canola & its role in australia’s conservation farming...
TRANSCRIPT

Canola & its role in Australia’s conservation
farming revolution
John Kirkegaard
CSIRO Plant Industry, Canberra

Why invite an Aussie?
An oilseed (canola) is most important non-cereal crop
(3rd most important overall)
Highest adoption of direct seeding worldwide
(72 - 96% area)
95% of canola is direct-seeded
Talk Outline
● Australian farming systems and the CA revolution
● Canola industry – history and current production
● Why grow canola? – selected R&D highlights
● Modern direct-seeded canola – trends and challenges

CLERMONT
120
0
DALBY
120
0
CONDOBOLIN
120
0
WAGGA WAGGA
120
0
MOOMBOOLDOOL
120
0
HORSHAM
120
0
ROSEWORTHY
120
0
ESPERANCE
120
0
MERREDIN
120
0
GERALDTON
120
0
Mixed farms (5000 acres)
1 crop/yr (May-Nov)
Mean yield 2000 lbs/ac
Australian environment, soils and system
Dry (12-20 inch), infertile soils, unsubsidised agriculture
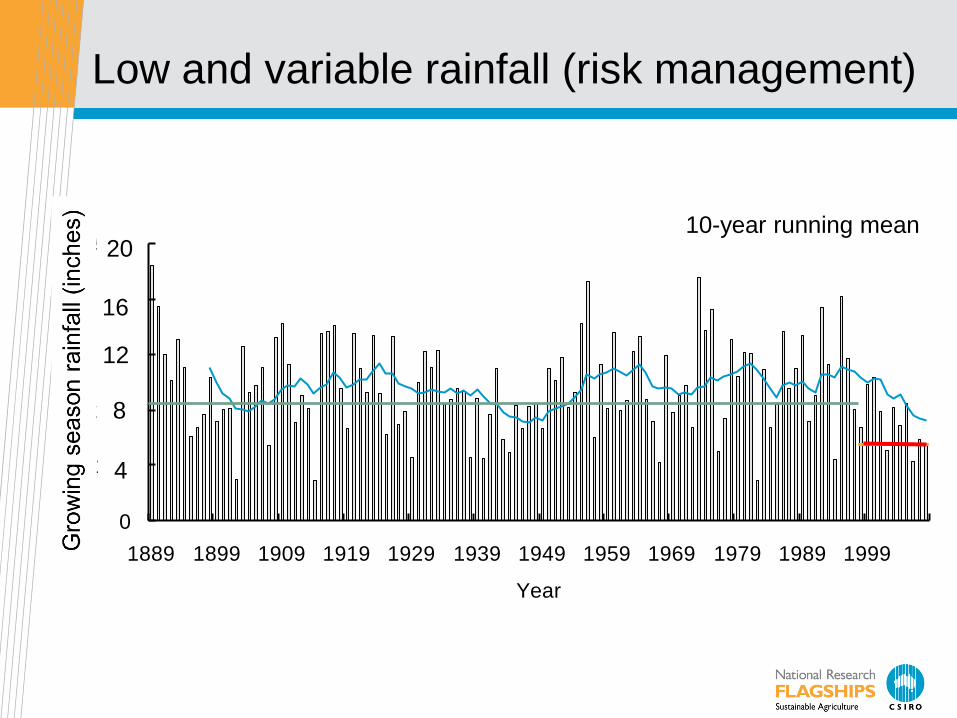
Low and variable rainfall (risk management)
0
100
200
300
400
500
1889 1899 1909 1919 1929 1939 1949 1959 1969 1979 1989 1999
Year
Gro
win
g s
ea
so
n r
ain
(m
m)`
10-year running mean 20
16
12
8
4
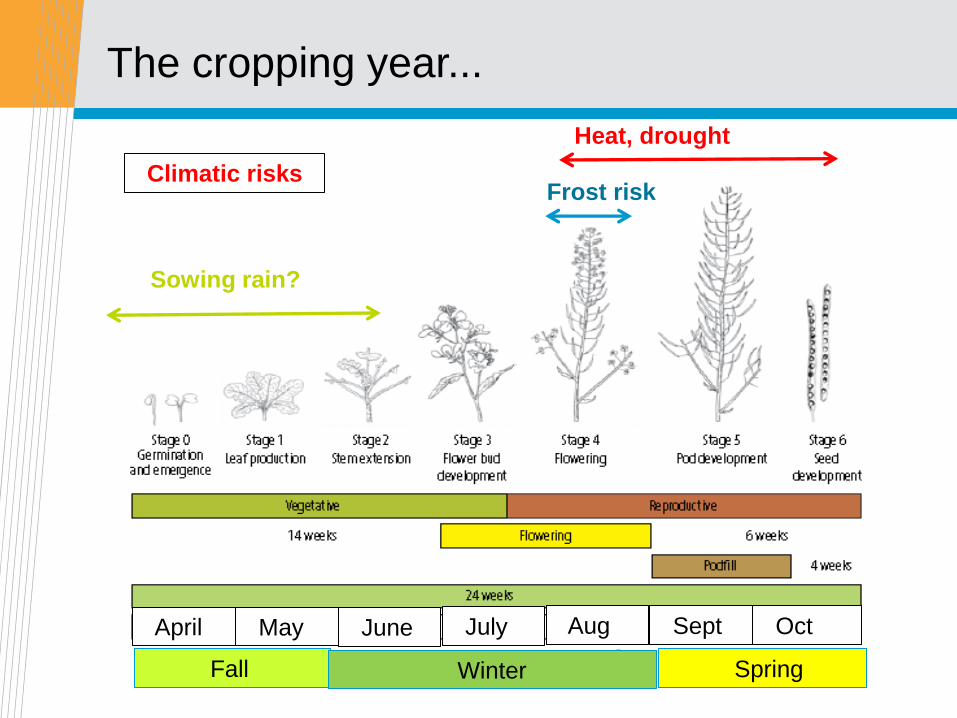
The cropping year...
Sowing rain?
Frost risk
Heat, drought
Climatic risks
Fall Winter Spring
April May June July Aug Sept Oct
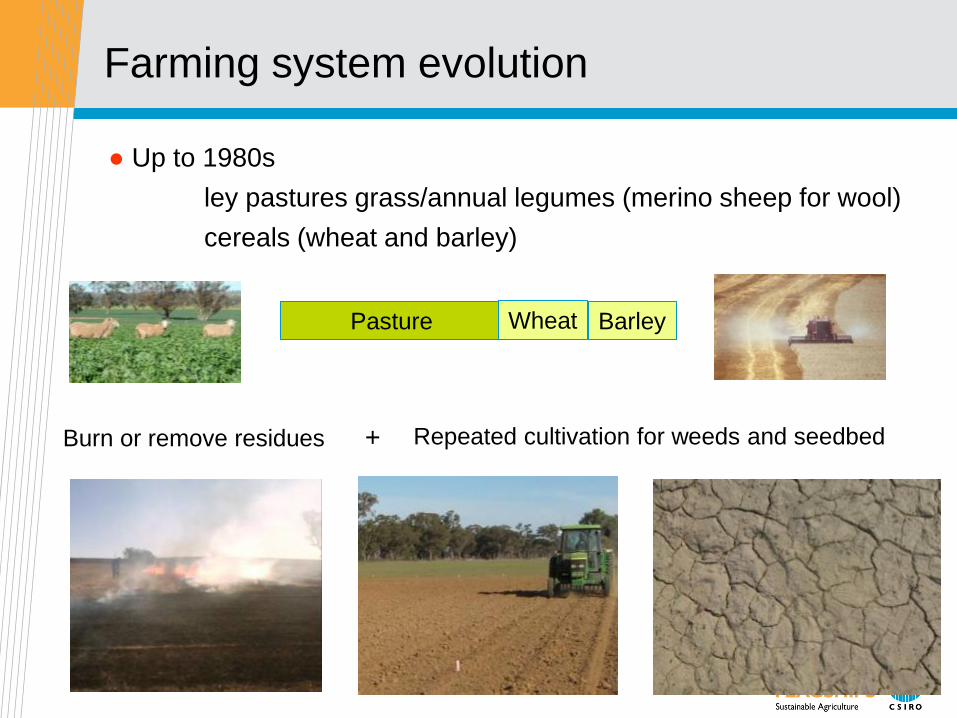
Farming system evolution
● Up to 1980s
ley pastures grass/annual legumes (merino sheep for wool)
cereals (wheat and barley)
Pasture Wheat Barley
Burn or remove residues + Repeated cultivation for weeds and seedbed
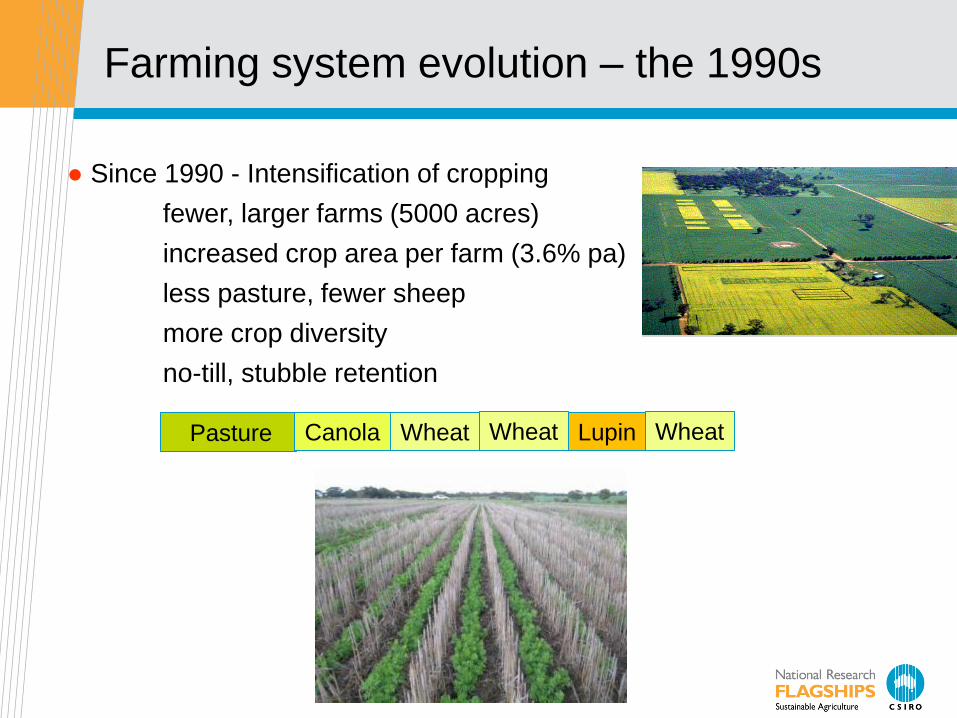
Farming system evolution – the 1990s
● Since 1990 - Intensification of cropping
fewer, larger farms (5000 acres)
increased crop area per farm (3.6% pa)
less pasture, fewer sheep
more crop diversity
no-till, stubble retention
Pasture Wheat Canola Wheat Lupin Wheat

Farming systems evolution – the 2000’s
● 2002-2009 The “Millenium” drought
more cereals, less break crops
wider rows and stubble retention
= herbicide resistant weeds
Glyphosate-resistant
populations
of annual ryegrass

Typical farm in 2014: 5000 acres (70:30 crop/pasture)

Australian national wheat yield trends
Kirkegaard et al., (2013) Agriculture, Ecosystem and Environment (online)
890
1780
450
1340
2200

No-till adoption and use in Australia
Year
1975 1980 1985 1990 1995 2000 2005 2010
% n
o-t
ill
ad
op
tio
n
0
20
40
60
80
100
year vs upper
year vs lower
year vs mean
GRDC 2010; Llewellyn et al 2011
Extent of Use (2009)
62 - 92% use No-till
73 - 96% crop area
WA, QLD
Mallee

The revolution begins....
Convergence of factors in 1970s to form potential for change
Natural resource management (political will)
Economic drivers (terms of trade)
Key enabling technologies
Item 1973-74 1982-83
Net wheat price per tonne $96 $119
Fuel (gallons) per tonne of wheat 600 84

Enabling technologies...
Herbicides for weed control
1971 Spray.Seed; 1977 Hoegrass; 1980 Glyphosate
Machinery development to reduce tillage/retain residue
Min-till – Direct drill – No-till – Zero till
Residue handling – harvest and seeding
Significant grower innovation
Broad-leaf rotation crops
Lupins in the 1980’s in Western Australia
Canola in the 1990s across Australia

Broadleaf rotation crops (legumes, canola)
Disease control
(root and stubble borne)
Weeds
(control of grass weeds)
Nitrogen
Legumes (+20 to 45 lb/acre N)
Residues easy for direct-seeding
20% yield benefit
Water and nutrient efficiency

Brief history of canola in Australia
● 1970s small areas of rapeseed (B napus, B campestris)
● 1976 decimated by Blackleg disease (Leptosphaeria maculans)
● 1990 resistant “double-low” varieties revive Industry
● 1999 area peaked at 5M acres, stabilised at ~3M acres
grown for system benefits rather than profit
80% triazine tolerant varieties, all open pollinated
● 2001 concern over “yield decline” in canola
● 2002-08 widespread drought limits yield and area sown
● 2008 new GM hybrid varieties first approved in 2008
● 2011 area grown and yield prospects best for a decade
● 2014 private breeding; 50% hybrid varieties, still 50% TT

Insert presentation title
Year
'70 '75 '80 '85 '90 '95 '00 '05 '10 '15
Area sown (million acres)
0
1
2
3
4
5
6
7
Yield(lb/acre)
0
250
500
750
1000
1250
1500
1750
Source: ABARE estimates, Australian Oilseeds Federation (AOF) industry estimates
Australian
varieties Canadian
varieties
TT
varieties Blackleg
Millenium
drought
GM hybrids Canola Check
Canola in Australia - area sown and yield

Current status
● 3rd most valuable grain crop in Australia
Gross value: Wheat ($7.8B), Barley ($1.9B), Canola ($1.1B)
Export value: Wheat ($5.0B); Barley ($1.5B); Canola ($ 0.8B)
● ~ 0.8 – 1.4 Mt (75%) exported annually
● 0.6 Mt canola crushed annually (Australian capacity 1.1 Mt)
● 25% of oil is exported, domestic use in food sector
● meal used in high protein feed in pig, poultry, dairy

Why grow canola?
- too drought sensitive
- too difficult to grow
- too variable in yield
- too costly
- too risky
- too susceptible to disease
- too many weeds
- but is canola profitable?

Canola reduces root/foliar diseases in cereals
Wheat after Wheat Wheat after Canola

Wheat yield response to previous canola
(26 on-farm experiments from 1989 – 1998)
1780
3560
5340
7120

Productivity benefits and economics
Economics of response
● 27% increase in 2 - year gross margin
● 27% due to canola, 63% due to better wheat
● C - W higher if canola price was 60% > wheat
JK
00
02
14
.PP
T
Other systems benefits
● Yield benefits may persist (2 - 3 years)
● Weed management benefits
● Conservation cropping, input efficiencies
Productivity benefit
● 20% increase in wheat yield
Kirkegaard et al (2008) Field Crops Research

Yield benefit (mean) is constant not proportional
Yield of wheat after wheat (t/ha)
0 2 4 6 8 10
Yie
ld o
f w
heat
aft
er
can
ola
(t/
ha)
0
2
4
6
8
10
Yield of wheat after wheat (t/ha)
0 2 4 6 8 10Y
ield
of
wh
eat
aft
er
Ind
ian
mu
sta
rd (
t/h
a)
0
2
4
6
8
10
1:1 line1:1 line
(a) (b)
1:1.2 line1:1.2 line
180 experiments
● Mean benefit 720 lbs/acre
● Independent of wheat yield
● underestimated when dry
(Angus et al 2011)

1860 1880 1900 1920 1940 1960 1980 2000 2020
0
1
2
3
Pasture legume N Better rotations Mechanisation
Superphosphate New wheat cultivars Fallowing
Nutrient exhaustion
N fertiliser in Sthn. Aust.
Canola in Sthn. Aust.
Lupin in rotations in WA
Semidwarf wheat cultivars Selective grass herbicides
Wheat
Yield
(lbs/acre)
Wagga WaggaJunee
Cootamundra
Condobolin
Goondiwindi
Rutherglen
Melbourne
Horsham
VICTORIA
Narrabri
Gunnedah
Trangie
Walgett
Moree
Canberra
NEW SOUTH WALES
QUEENSLAND
0 50 100 200 Km
Sydney
Regional advantage in canola impacts
890
1780
3100
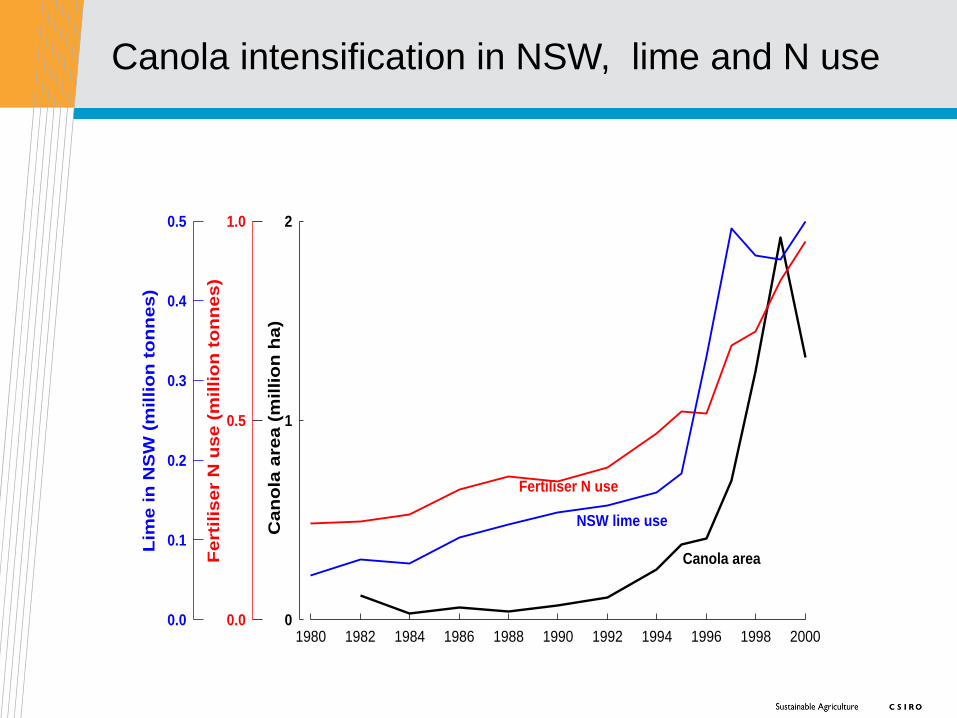
Canola area, lime use and N-fertiliser use
1980 1982 1984 1986 1988 1990 1992 1994 1996 1998 2000
Can
ola
are
a (
millio
n h
a)
0
1
2F
ert
ilis
er
N u
se (
millio
n t
on
nes)
0.0
0.5
1.0
Lim
e in
NS
W (
millio
n t
on
nes)
0.0
0.1
0.2
0.3
0.4
0.5
Canola area
Fertiliser N use
NSW lime use
Canola intensification in NSW, lime and N use
1980 1982 1984 1986 1988 1990 1992 1994 1996 1998 2000
Ca
no
la a
rea (
millio
n h
a)
0
1
2F
ert
ilis
er
N u
se (
millio
n t
on
nes)
0.0
0.5
1.0
Lim
e in
NS
W (
millio
n t
on
nes)
0.0
0.1
0.2
0.3
0.4
0.5
Canola area
Fertiliser N use
NSW lime use

Canola intensification and yield decline?
Concerned since 1999, poor yields in good seasons
Paddock Survey (2000 paddocks 1991 - 2000)
10% reduction in yield
Census and survey data (high rainfall east)

JK
00
02
14
.PP
T
● Simple rules of thumb
e.g. yield should be 50% of wheat
● Water-limited yield based on seasonal rainfall
Simple, accessible but less precise
● Prediction based on crop simulation models
Accounts for daily weather, soil, management
Requires more data and interpretation
Benchmarking yield performance in canola
What should my canola have yielded?

JK
00
02
14
.PP
T
● Farmers often expect yield to be 50% of wheat?
Robertson et al (1999)
0 .0
0 .2
0 .4
0 .6
0 .8
1 .0
1 .2
0 2000 4000 6000 8000 10000
W h eat g ra in y ie ld (kg /h a )
Ra
tio
ca
no
la:w
he
at
yie
ld
Benchmarking yield in canola
1780 3560 5300
Wheat grain yield (lbs/acre)
7080 8860

(b)
0
1000
2000
3000
4000
5000
6000
0 100 200 300 400 500 600 700 800
In-crop rain (mm)
(f)
0
1000
2000
3000
4000
5000
6000
0 100 200 300 400 500 600 700 800
Simulated transpiration (mm)
(d)
0
1000
2000
3000
4000
5000
6000
0 100 200 300 400 500 600 700 800
Seasonal water supply (mm)
240 lbs/acre/inch
330 lbs/acre/inch
175 lbs/acre/inch
Yield (lbs/acre)
[in-crop rainfall + stored water – water left]
Robertson and Kirkegaard (2005)
R2=0.68
Water-limited yield concept (French and Shultz)
5300
890
1780
2670
3560
4450
Seasonal water supply (inches)
24 20 16 12 8 4 28 32
0
100
200
300
400
500
0 100 200 300 400 500
Observed grain yield (g/m2)
Sim
ula
ted g
rain
yie
ld (g
/m2
)
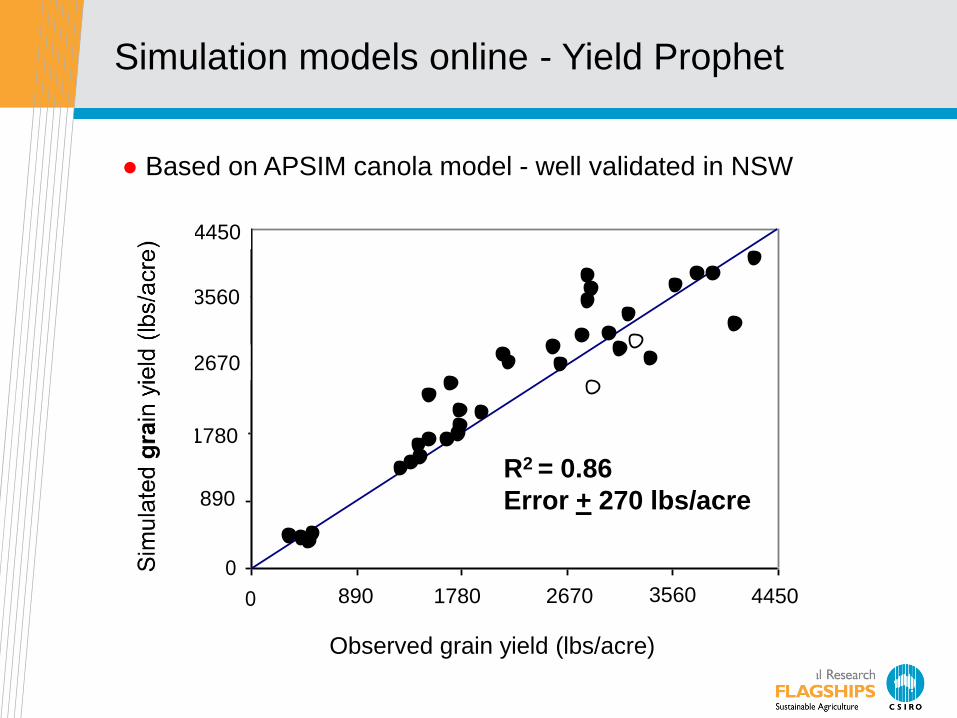
Simulation models online - Yield Prophet
● Based on APSIM canola model - well validated in NSW
R2 = 0.86
Error + 270 lbs/acre
890
1780
890 1780
2670
2670
3560
3560
4450
4450
Observed grain yield (lbs/acre)
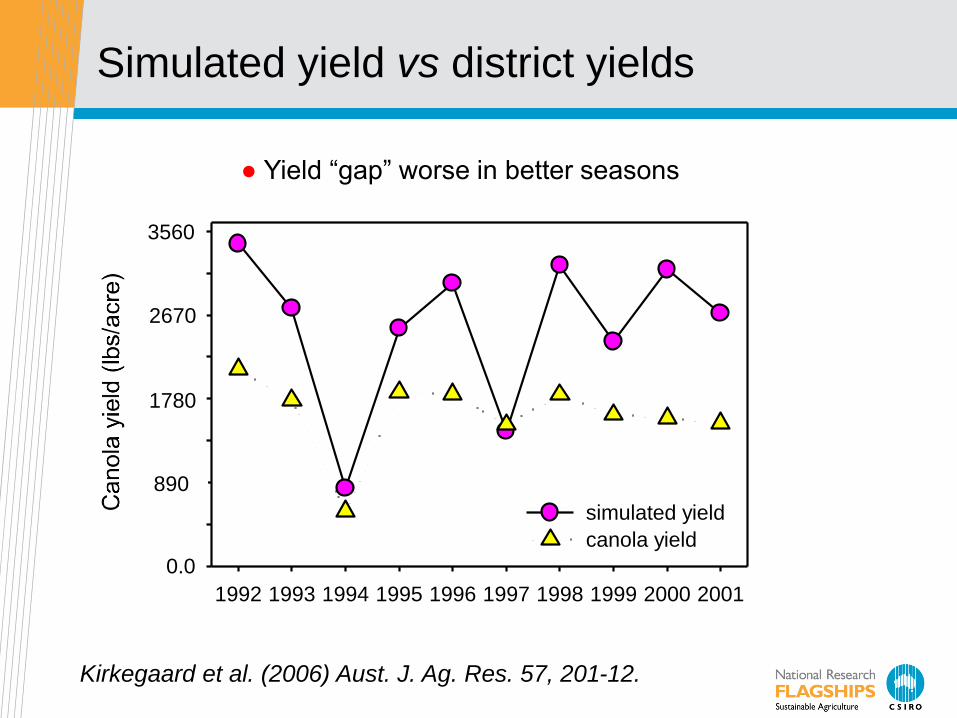
Simulated yield vs district yields
b)
1992 1993 1994 1995 1996 1997 1998 1999 2000 2001
Canola
yie
ld (
t/ha)
0.0
0.5
1.0
1.5
2.0
2.5
3.0
3.5
4.0
simulated yield
canola yield
Kirkegaard et al. (2006) Aust. J. Ag. Res. 57, 201-12.
● Yield “gap” worse in better seasons
890
1780
2670
3560

Establishing canola in wheat stubble
• Poor emergence
• Poor vigour
• 25% yield loss
• Causes
(allelopathy?)
Burn Retain

The “plastic straw” experiment
Trial designed to separate
physical and chemical effects:

Plastic straws and stubble = same effect!
Treatment
Bare Bare+N Fallow Stubble Stubble+N Plastic
Dry
Weig
ht
(g/m
2)
0
2
4
6
8
10
12
LSD
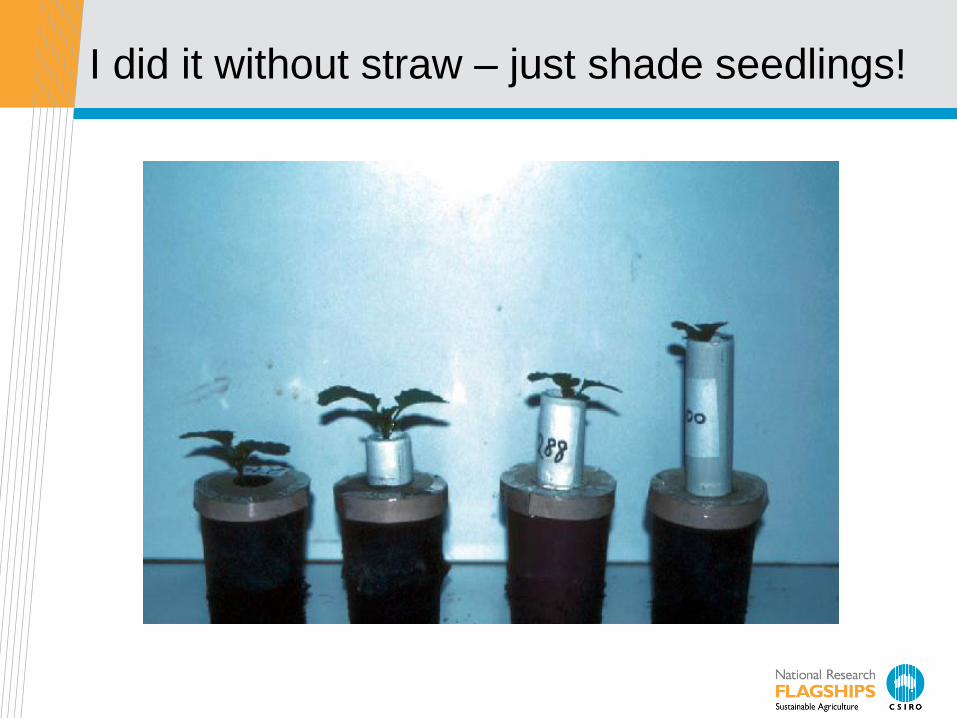
I did it without straw – just shade seedlings!

A grower solved the problem – without burning!
3100 lbs/acre
3030 lbs/acre
2225 lbs/acre
Burn
Stubble inter-row
Stubble spread

Increased diseases in wet seasons!
Premature death
Root rot
Sclerotinia stem rot
Blackleg

Response to fungicides at 7 sites from 2001-2005
JK
00
02
14
.PP
T
Year Sclerotinia control
(extra lbs/acre)
Blackleg control
(extra lbs/acre)
2001 980 800
2002 90 712
2003 90 180
2004 ns 90
2005 ns 270
If disease was controlled or absent crops yielded to potential
Summary of response to disease control
Kirkegaard et al. (2006) Aust. J. Ag. Res. 57, 201-12.
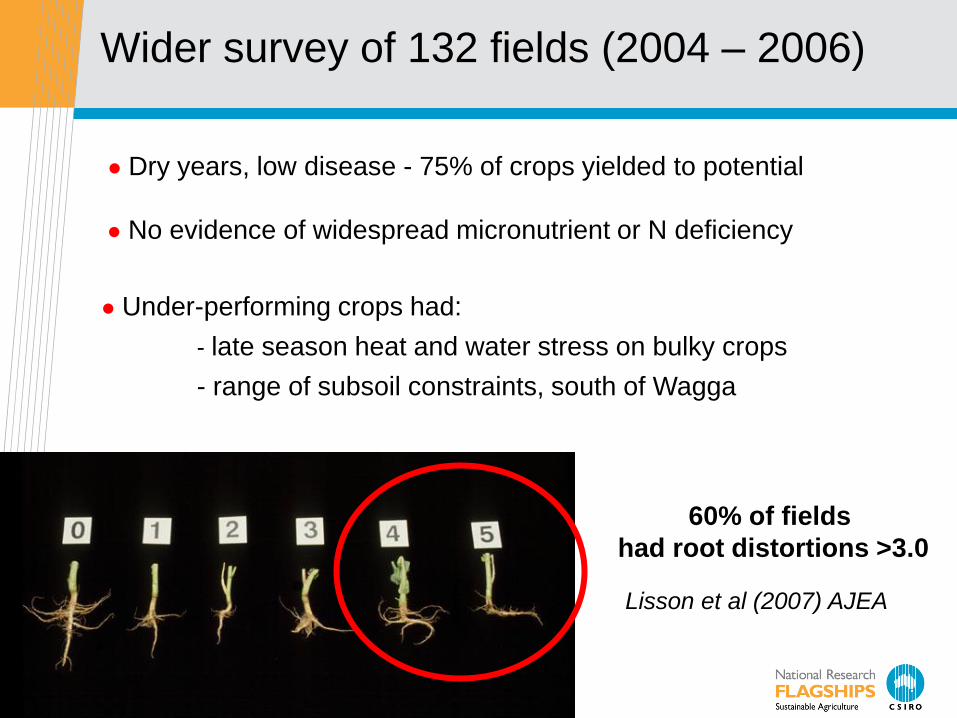
Wider survey of 132 fields (2004 – 2006)
● Dry years, low disease - 75% of crops yielded to potential
● Under-performing crops had:
- late season heat and water stress on bulky crops
- range of subsoil constraints, south of Wagga
● No evidence of widespread micronutrient or N deficiency
60% of fields
had root distortions >3.0
Lisson et al (2007) AJEA
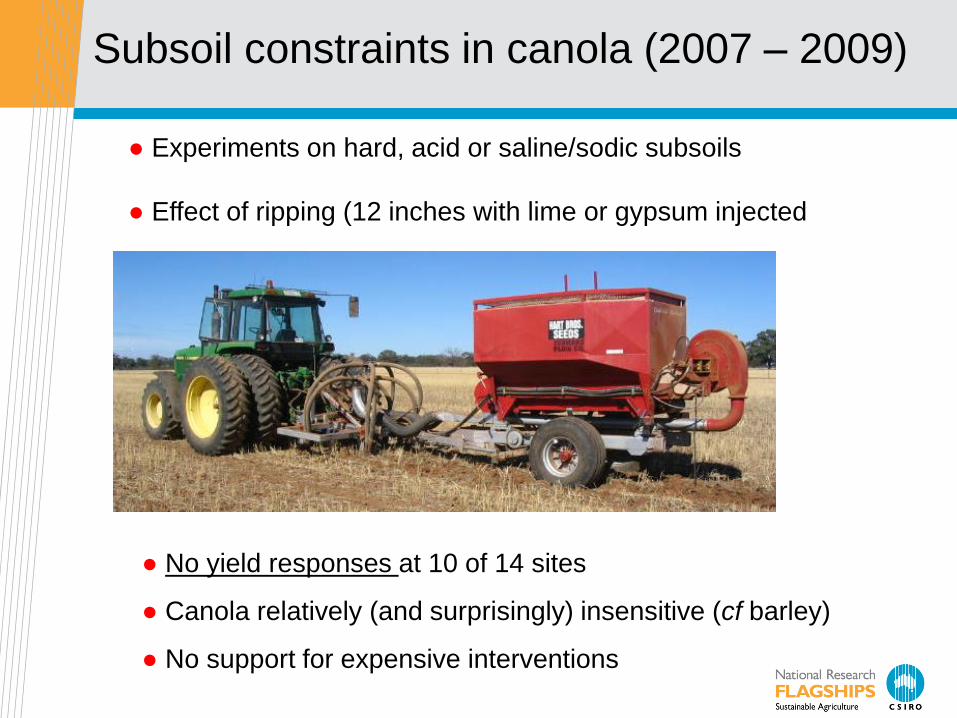
Subsoil constraints in canola (2007 – 2009)
● Experiments on hard, acid or saline/sodic subsoils
● Effect of ripping (12 inches with lime or gypsum injected
● No yield responses at 10 of 14 sites
● Canola relatively (and surprisingly) insensitive (cf barley)
● No support for expensive interventions

Impacts of soil salinity - variable site
CSIRO. Potential impacts of subsoil constraints on canola productivity in southern NSW
Sampling Positions
20 each 12 m2
with 16 plants/m2
EM Survey
Area: 45m x 600m
EM38: every 5m x 1m
Reducing the risk with canola
● Dual-purpose (grazing canola)
making money from the vegetative biomass to offset risk
● Canola suitability index (CSI)
improved decisions on when not to sow canola
● Yield prophet (web-based simulation)
in-season risk management
● Legume brown-manure “cover crops”
herbicide resistant weeds, water and N

Dual-purpose canola – graze and grain
● Canola crops grazed without yield penalty
● Increase flexibility, profitability and reduce risk
● Increase animal and crop production from mixed farms
Defoliation experiments Grazing experiments Simulation

The twist test
Sow early, stop grazing on time!
Monitor bud elongation
OK to start
Getting late

28 July 2008
13 November 2008
Grazed Ungrazed
Both yielded 3.2 t/ha
Grazing intensity

Dual-purpose canola – it works!
Site Sow Variety Grazing
(sheep.day/acre)
Flower
Delay (d)
Yield (t/ha)
G UG
Canberra
2008
3 April Winter 440 2 3.1 3.0
23 April Spring 70 4 2.8 2.2*
Young
2008
7 April Winter 630 1 5.0 4.6
16 April Spring 283 7 4.7 4.9
Kirkegaard et al (2012) Crop and Pasture Science 63, 429-443

Profitability, risk and systems benefits
“A decade ago we only grew fine wool……
Now we produce a range of crops and
pastures for forage, silage, hay and grain
as well as meat from sheep and cattle”
● If yield penalty is avoided, feed is added value
$GM/ha increase of $100 - $400/ha; whole-farm $100/ha
● Indirect benefits include
Canola is a grass weed and cereal disease control option
Winter pasture spelling provides lambing feed in late winter
Wider sowing and grazing windows for crops
Reduced crop height to facilitate swathing and harvest
Graze, hay and grain option = increased flexibility, lower risk

Modern canola systems evolution - 1
late cool burn
direct seeded
narrow tine
press-wheels

Modern canola systems evolution - 2
stubble retained
direct seeded
narrow tines
press-wheels
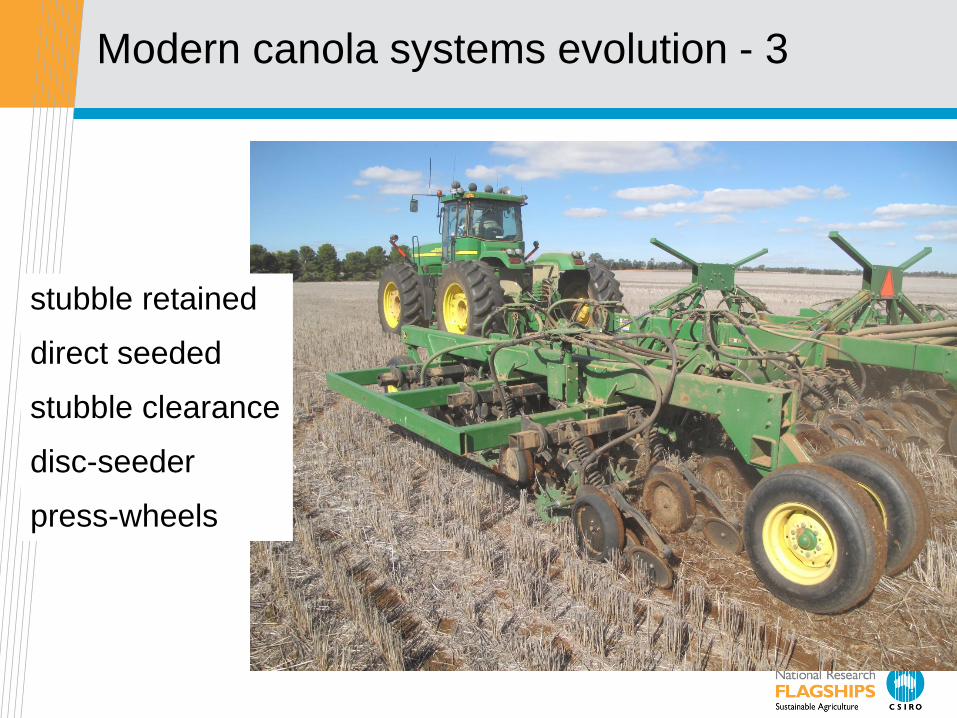
Modern canola systems evolution - 3
stubble retained
direct seeded
stubble clearance
disc-seeder
press-wheels

Modern canola system evolution - 4
stubble retained
direct seeded
inter-row sowing
disc-seeder
press wheels
controlled traffic

Modern canola system evolution – 4b
.......and red ones can do it as well!
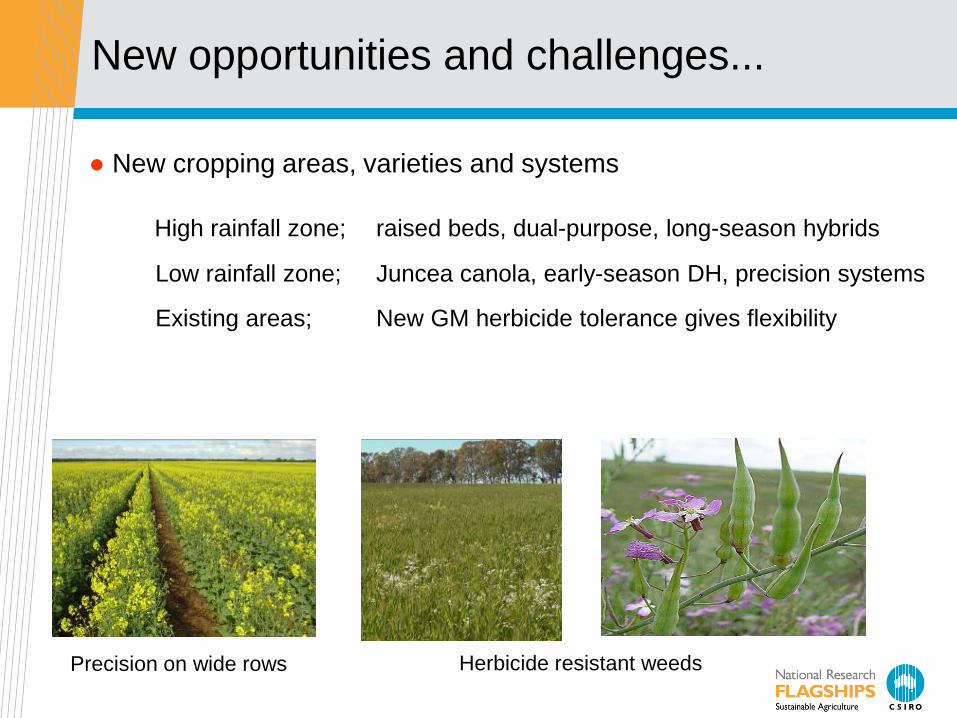
New opportunities and challenges...
● New cropping areas, varieties and systems
High rainfall zone; raised beds, dual-purpose, long-season hybrids
Low rainfall zone; Juncea canola, early-season DH, precision systems
Existing areas; New GM herbicide tolerance gives flexibility
Herbicide resistant weeds Precision on wide rows

Thank you Email:
Contact Us
Phone: 1300 363 400 or +61 3 9545 2176
Email: [email protected] Web: www.csiro.au
Many colleagues, farmers and friends.....