cap 787 international relations: the growth in air travel ... · cap 787 international relations...
TRANSCRIPT


CAP 787
International Relations
The Growth in Air Travel to Visit Friends or Relatives
Economic Regulation Group
September 2009

CAP 787 International Relations – The Growth in Air Travel to Visit Friends or Relatives
© Civil Aviation Authority 2009
All rights reserved. Copies of this publication may be reproduced for personal use, or for use within acompany or organisation, but may not otherwise be reproduced for publication.
To use or reference CAA publications for any other purpose, for example within training material forstudents, please contact the CAA at the address below for formal agreement.
ISBN 978 0 11792 262 4
Published September 2009
Enquiries regarding the content of this publication should be addressed to:Economic Policy and International Aviation, Economic Regulation Group, Civil Aviation Authority, K4,CAA House, 45-59 Kingsway, London, WC2B 6TE
The latest version of this document is available in electronic format at www.caa.co.uk/publications,where you may also register for e-mail notification of amendments.
Published by TSO (The Stationery Office) on behalf of the UK Civil Aviation Authority.
Printed copy available from: TSO, PO Box 29, Norwich NR3 1GN www.tso.co.uk/bookshopTelephone orders/General enquiries: 0844 477 7300 E-mail: [email protected] orders: 0870 600 5533 Textphone: 0870 240 3701

CAP 787 International Relations – The Growth in Air Travel to Visit Friends or Relatives
Chapter Page Date Chapter Page Date
List of Effective Pages
iii September 2009
iv September 2009
Contents 1 September 2009
Contents 2 September 2009
Executive Summary 1 September 2009
Executive Summary 2 September 2009
Executive Summary 3 September 2009
Executive Summary 4 September 2009
Executive Summary 5 September 2009
Executive Summary 6 September 2009
Executive Summary 7 September 2009
Executive Summary 8 September 2009
Executive Summary 9 September 2009
Executive Summary 10 September 2009
Executive Summary 11 September 2009
Executive Summary 12 September 2009
Chapter 1 1 September 2009
Chapter 1 2 September 2009
Chapter 1 3 September 2009
Chapter 1 4 September 2009
Chapter 1 5 September 2009
Chapter 1 6 September 2009
Chapter 1 7 September 2009
Chapter 1 8 September 2009
Chapter 2 1 September 2009
Chapter 2 2 September 2009
Chapter 2 3 September 2009
Chapter 2 4 September 2009
Chapter 2 5 September 2009
Chapter 2 6 September 2009
Chapter 2 7 September 2009
Chapter 2 8 September 2009
Chapter 2 9 September 2009
Chapter 2 10 September 2009
Chapter 2 11 September 2009
Chapter 2 12 September 2009
Chapter 2 13 September 2009
Chapter 2 14 September 2009
Chapter 2 15 September 2009
Chapter 2 16 September 2009
Chapter 2 17 September 2009
Chapter 2 18 September 2009
Chapter 2 19 September 2009
Chapter 2 20 September 2009
Chapter 2 21 September 2009
Chapter 2 22 September 2009
Chapter 2 23 September 2009
Chapter 2 24 September 2009
Chapter 2 25 September 2009
Chapter 2 26 September 2009
Chapter 3 1 September 2009
Chapter 3 2 September 2009
Chapter 3 3 September 2009
Chapter 3 4 September 2009
Chapter 3 5 September 2009
Chapter 3 6 September 2009
Chapter 3 7 September 2009
Chapter 3 8 September 2009
Chapter 3 9 September 2009
Chapter 3 10 September 2009
Chapter 4 1 September 2009
Chapter 4 2 September 2009
Chapter 4 3 September 2009
Chapter 4 4 September 2009
Chapter 4 5 September 2009
Chapter 4 6 September 2009
Chapter 4 7 September 2009
Chapter 4 8 September 2009
Chapter 4 9 September 2009
Chapter 4 10 September 2009
Chapter 4 11 September 2009
Chapter 4 12 September 2009
Chapter 4 13 September 2009
Chapter 4 14 September 2009
Chapter 4 15 September 2009
Chapter 4 16 September 2009
Chapter 4 17 September 2009
Chapter 4 18 September 2009
Chapter 4 19 September 2009
Chapter 4 20 September 2009
Chapter 4 21 September 2009
Chapter 4 22 September 2009
Chapter 4 23 September 2009
Chapter 4 24 September 2009
Annex A 1 September 2009
Annex A 2 September 2009
Annex A 3 September 2009
Annex A 4 September 2009
Annex A 5 September 2009
Annex A 6 September 2009
Annex A 7 September 2009
Annex A 8 September 2009
Page iiiSeptember 2009

CAP 787 International Relations – The Growth in Air Travel to Visit Friends or Relatives
Chapter Page Date Chapter Page Date
Annex B 1 September 2009
Annex B 2 September 2009
Annex B 3 September 2009
Annex C 1 September 2009
Page ivSeptember 2009
CAP 787 International Relations – The Growth in Air Travel to Visit Friends or Relatives
Contents
List of Effective Pages iii
Executive Summary 1
How is VFR traffic different to other air traffic? 2Where do VFR passengers fly to? 3Where do UK VFR passengers fly from? 4Who is travelling on VFR trips? 6Why the increase in VFR air trips? 7Statistical analysis 11Outline of the study 11Acknowledgements 12
Chapter 1 Introduction
Who are VFR passengers? 1Methodology 3Growth in international passenger traffic since 1990 4Foreign and UK residents 5Destination of VFR passengers 5Looking forward 7
Chapter 2 UK Airports and International VFR traffic
Changes in destination of VFR passengers 4No-frills airlines 7Other airlines 8London airports 8Regional airports 13Case Study A: Bristol airport 15Case Study B: Birmingham airport 20
Chapter 3 Characteristics of International VFR Passengers
Introduction 1A. Frequency of travel 3B. Income of passengers 5C. Length of trip 6D. Age of passengers 8E. Household type of passengers 9F. Price sensitivity 9
Contents Page 1September 2009

CAP 787 International Relations – The Growth in Air Travel to Visit Friends or Relatives
Chapter 4 Factors Influencing International VFR Traffic Growth
Introduction 2EU single market 2Economic growth 3Supply of air services 4Social factors 9Statistical analysis 21
Annex A Statistical Analysis
Introduction 1Modelling changes over time 2Modelling the country–specific individual effects 8
Annex B Data Used in Regression Modelling
Annex C EU Member States
Contents Page 2September 2009

CAP 787 International Relations – The Growth in Air Travel to Visit Friends or Relatives
Executive Summary
1 In recent years, an increasingly globalised world economy has led to a rise in labourmobility and migration, particularly within Europe. This movement of people has madesocial networks more dispersed, which in turn has meant growth in the potentialmarket of people who need to travel by air if they wish to maintain close links withtheir friends or relatives. The concurrent relaxation of regulatory restrictions onaviation markets has encouraged increases in supply to meet this demand.
2 'VFR' describes that subset of leisure passengers who travel for the purpose of'Visiting Friends or Relatives' (as identified through passenger surveys1). In recentyears, growth in leisure traffic visiting friends or relatives has been robust incomparison to other market segments – for example, growth of international holidaytraffic to and from the UK has remained less than that of VFR traffic since 2002.
3 This study focuses on VFR passengers travelling to and from the UK. It thereforeexcludes domestic journeys and those passengers who have arrived in the UK for thesole purpose of catching an onward international flight. From hereon in, where theabbreviation 'VFR' is used, it is specifically referring to this restricted set ofinternational passengers using UK airports.
4 Figure 1 shows how growth in international VFR traffic has remained severalpercentage points higher than growth in international business and holiday traffic overthe last five years. This faster growth rate means that the proportion of internationaltraffic travelling for the purposes of VFR has increased – from 18% in 2000 to anestimated 24%2 in 2008 – and is thus an increasingly important segment of overallUK air passenger demand.
Source: International Passenger Survey (MQ6), ONS.Notes: Q1–Q3 2008 data provisional.
1. Both the CAA Passenger Survey and the International Passenger Survey (IPS) conducted by the UK Office for NationalStatistics (ONS) collect these data. The IPS dataset is weighted to include all UK airports in every year, thus making itmore appropriate for a time-series than the CAA Passenger Survey, where a subset of UK airports are surveyed eachyear and data weighted at a route-level to airport totals, thus making it more appropriate for destination-specific analysis.
2. As estimated by the IPS (provisional data only for Q1–Q3 2008). The IPS records a journey purpose of ‘miscellaneous’,which comprised approximately 5% of international passengers in 2007 and has been excluded when calculatingproportions.
Figure 1 Rolling annual growth in international passenger traffic by journey purpose at all UK airports, 2000–2008
-15%
-10%
-5%
0%
5%
10%
15%
20%
Q4 200
0
Q2 200
1
Q4 200
1
Q2 200
2
Q4 2002
Q2 200
3
Q4 200
3
Q2 200
4
Q4 2004
Q2 200
5
Q4 200
5
Q2 200
6
Q4 200
6
Q2 2007
Q4 200
7
Q2 200
8P
Holiday Business VFR
Executive Summary Page 1September 2009

CAP 787 International Relations – The Growth in Air Travel to Visit Friends or Relatives
5 The robust growth of VFR traffic reflects societal trends such as increased labourmobility, migration and the ownership of second-homes abroad. Between 2000 and2007, whilst total passengers to and from the UK grew by one-third, those travellingfor the purpose of VFR increased by over three-quarters.
6 Looking forward, the current worldwide economic downturn is likely to impact uponVFR traffic, both through falls in UK GDP and changes in migration patterns. Changesin the flows of new migrants could affect the potential size of future VFR demand –but, even if there were to be a reversal of migration trends, there still remains anexisting body of people who are either current migrants, or have at some time, beenmigrants. Different groups of migrants will stimulate air travel to a different degree,most likely depending upon the reasons behind their original move, the permanencewith which they view their migration, and the duration of their migration thus far. Forthese people, demand for travel for VFR purposes is an indication of the desire to buildand maintain relationships. Whether VFR growth continues at the same rate ashistorically will depend on the relative value that migrants place on these relationshipsas compared with other demands on their time and income, and the cost of trips.
7 The analysis in this study has been carried out using data which cover a period ofsignificant change in terms of enlargement of the EU, the migration flows this enabledand concurrent liberalisation of the EU aviation market (giving rise to more affordableair travel). In light of these developments, it may not be realistic to assume continuedgrowth of the same magnitude, however, a strong foundation for an enlargedpassenger base has been established.
8 Thus, although falls in UK GDP are likely to impact on VFR passenger traffic, bothdirectly and indirectly via the effect on migration, the extent of this impact cannot beestimated with any certainty. Provisional data for 2008 indicate that, althoughpassenger numbers have fallen for the year, VFR traffic as a proportion of total trafficat UK airports is broadly the same as it was in 2007.
How is VFR traffic different to other air traffic?
9 VFR travel occurs as a result of dispersed social networks – in order to visit friends orrelatives abroad, some form of temporary or permanent migration will generally havetaken place. The ownership of second-homes abroad also adds to the pool of potentialVFR passengers, not only through friends or family visiting, but also through theestablishment of new relationships abroad. Although the owners of second-homesare not travelling on VFR themselves when travelling to their second-homes (rather,they would generally be classed as 'holiday' traffic), friends or relatives visiting themthere would be classed as VFR3.
10 Some key factors differentiate VFR travel from other leisure ('holiday') trips:
• the destination is less likely to be substitutable than in the case of internationalholiday travel, where a variety of destinations may meet passengers’ needs;
• the cost of the trip is likely to be closer to that of the flight alone, with loweraccommodation or living costs – because for many such trips, these costs may bemet in whole or part by the friend or relative being visited; and
• the desire to travel is dependent on the prior dispersal of social networks.
3. Both CAA and IPS surveys determine journey purpose by presenting the passenger with a list of alternative purposes tochoose from. Therefore, it is the interviewee who selects the journey purpose which they feel best fits their current trip.
Executive Summary Page 2September 2009

CAP 787 International Relations – The Growth in Air Travel to Visit Friends or Relatives
Where do VFR passengers fly to?
11 VFR passengers at UK airports fly to a mix of EU and longer-haul destinations,reflecting the current and historic associations between the UK and different parts ofthe world. The EU contribution to VFR over the last six years has grown particularlyrapidly – this traffic constitutes nearly three-quarters of the growth in VFR passengerssince 2000. Thus, the proportion of VFR traffic represented by these trips hasincreased from 50% in 2000 to 60% in 2007, indicating how increasing numbers ofEU citizens – both UK and non-UK nationals – are travelling to and from the UK for VFRpurposes, against a background of greater liberalisation of aviation markets andincreasing use of the freedoms of work and movement available to EU citizens.
12 This increase in VFR traffic is a reflection of closer relationships developing across theEU, both at an individual and a country level. Single market legislation has madepossible social and economic movement of individuals across the EU and thismovement, even if only temporary, leaves permanent social networks of the sortwhich underpin VFR travel. Whilst living in a foreign country, a migrant may wish toreturn home for family occasions or holidays, and their family and friends may cometo visit them in their new home. However, the migrant may also establish new social(or family) networks in the country of their stay, some of whom will travel to visit themigrant on their return or vice versa.
13 Although not growing at the same rate, there is still substantial VFR traffic betweenthe UK and non-EU destinations – of which approximately one-quarter was travellingto and from the US in 2007. Other key destinations are Australia, Canada, India andSouth Africa.
14 Figure 2 illustrates how VFR traffic to and from the UK has grown by destination. Itshows how the ten EU countries which joined in 2004 have accounted for almost asgreat an increase in passengers between 2000 and 2007 as all the non-EU countriescombined.
Source: CAA Passenger Survey, excluding international-to-international connectors.Notes:
• Airports included are: Heathrow, Gatwick, Luton, Stansted, Manchester, Birmingham, Bristol, Liverpool and East Midlands taking the nearest survey years to 2000 and 2007 4.
• ‘Other EU15’ countries are: Austria, Belgium, Denmark, Finland, Greece, Luxembourg, Netherlands and Sweden.
• 'Other EU27’ countries are: Bulgaria, Cyprus, Czech Republic, Estonia, Hungary, Latvia, Lithuania, Malta, Romania, Slovakia and Slovenia.
Figure 2 Contribution to growth of international VFR passengers at the main UK international airports, 2000–2007
4. As the regional airports are not surveyed every year by the CAA, the nearest survey years to 2000 and 2007 are used andscaled appropriately using CAA Airport Statistics. The actual survey data used are as follows: Bristol – 2000, January –June (provisional data) 2008; East Midlands – 1999, 2006; Liverpool – 1999, 2007; Birmingham – 1999, 2006; all otherairports – 2000, 2007.
16%
8%
6%
6%
6%3%5%12%
10%
28% SpainFranceIrelandItalyGermanyPortugal
Other EU15PolandOther EU27Rest of world
Non-EU
EU
Executive Summary Page 3September 2009

CAP 787 International Relations – The Growth in Air Travel to Visit Friends or Relatives
15 Data from the largest international airports5 in the UK indicate that:
• VFR traffic to and from Poland has increased from 100 thousand in 2000 to nearly2.5 million in 2007, and to and from the other EUA86 countries from 200 thousandin 2000 to 1.7 million in 2007. By 2007, the EUA8 countries accounted for 9% ofall international VFR traffic.
• Over the same period, VFR traffic has also increased between EU156 countriesand the UK. The EU15 represented nearly half of all international VFR traffic to andfrom the UK in both 2000 and 2007.
Where do UK VFR passengers fly from?
16 The nine largest UK airports in terms of international passenger numbers, each ofwhich handled over 4.5 million international passengers in 2007, accounted for 85%of total international passengers at UK airports. In total, passengers to and from theUK at these nine airports (for all purposes) grew by almost one-third, to reach nearly140 million in 2007. However, survey data indicate that VFR passengers travelling toand from the UK at these airports have grown by over three-quarters over this period7.
17 These nine airports also all demonstrate an increased proportion of internationalpassengers travelling for VFR from 2000 to 2007. However, growth in VFR traffic is notspread proportionately across the airports – it has grown more rapidly at some thanat others. For instance, although Heathrow accounts for the greatest number ofinternational VFR passengers at any single UK airport, international VFR traffic therehas grown by only 16% since 2000. Although regional8 airports have played a key rolein the VFR market, London9 airports still underpin the bulk of VFR demand to and fromthe UK, accounting for nearly 90% of those passengers. Stansted and Luton havegone from handling a very small proportion of London’s international passengers in1990 to nearly one-quarter of the total in 2007, and over a third of VFR passengerstravelling from London airports.
18 Overall, between 2000 and 2007, the CAA survey estimates that there was anincrease of 14.5 million international VFR passengers travelling through the Londonairports, bringing the total to 35 million in 2007. Around 40% of this increase comesfrom Stansted, the remainder being split between Luton, Heathrow and Gatwick.
19 Figure 3 shows how the proportion of VFR passengers at the London airports haschanged since 2000. Luton and Stansted show the highest proportions of VFRpassengers within the London airports – both over 40% of the airport’s passengers in2007. This proportion has been growing at the same time as the rapid growth in totalpassenger numbers at the two airports.
5. These nine airports are the Continuous Survey airports of Heathrow, Gatwick, Luton, Stansted and Manchester plus thenext four largest international airports: Birmingham, Bristol, East Midlands and Liverpool. This group of nine airports arereferred to in this study as the ‘main UK international airports’.
6. See Annex C for details of EU Member States and definitions of country groupings.7. ‘In Focus – Enhancing Social Networks Across Europe’ preliminary findings document, CAA, November 2008, quoted
“two-thirds”, this figure was based on Heathrow, Gatwick, Luton, Stansted and Manchester (the Continuous Surveyairports) – the extended sample’s growth rate was higher.
8. Throughout this study, ‘regional’ in the context of airports is generally taken to mean outside the London area. Thismeans that parts of the text referring to UK regions, will include, for convenience, Northern Ireland, Scotland and Wales,whereas these would normally be more properly referred to as nations.
9. For the purposes of this study, London City airport (which is not surveyed on a continuous basis) is not included in the‘London airport’ totals. An estimated 700 thousand VFR passengers used the airport in 2008.
Executive Summary Page 4September 2009

CAP 787 International Relations – The Growth in Air Travel to Visit Friends or Relatives
Source: CAA Passenger Survey, excluding international-to-international connectors.
20 At Stansted, between 2000 and 2007 there was a doubling of passenger numbers toand from the UK. Of the 10 million increase, 6.2 million was accounted for by VFRpassengers. Almost two-thirds of the growth in VFR traffic at Stansted came frompassengers travelling to EU15 countries and one-quarter from passengers to theremaining EU27 countries, where VFR traffic has grown from just under 80,000passengers in 2000 to nearly 1.8 million in 2007. Of these 1.8 million, half weretravelling between the UK and Poland. The growth of VFR traffic at Stansted over thisperiod has happened alongside the expansion of no-frills airlines at the airport.
21 Similarly, Luton has grown rapidly between 2000 and 2007. Growth of almost 90%(3.8 million) over the period means that 8.1 million international passengers used theairport to travel to and from the UK in 2007. The proportion of this increase whichrelated to VFR traffic (nearly three-quarters) is even more pronounced than atStansted. Half of the VFR increase was split between three destination countries –Poland, Spain and Ireland. As with Stansted, Luton airport has also seen rapid growthof no-frills operations which have serviced the increased demand.
22 For those airports where VFR growth has been particularly rapid, this has happenedalongside an increase in UK–EU services, closely related to changes in the airpassenger market prompted by the rise of no-frills airlines, and the consequentexpansion of route networks throughout the EU. Outside London, UK–EU VFR traffichas grown most strongly at those regional airports that have become no-frills bases(Bristol, East Midlands and Liverpool). For longer-haul destinations, VFR growth hasoccurred at Heathrow and Gatwick, but also as new long haul services have beenestablished at regional airports like Manchester, Birmingham and Glasgow.
23 The UK’s regional airports have seen strong general passenger growth over recentyears and now serve 35% of the UK’s international air passenger traffic. Previous CAAstudies10 have attributed this growth to the liberalisation of EU air services and theresulting emergence of no-frills airlines looking for opportunities for rapid expansion,which, in turn, unlocked latent demand from passengers keen to travel from their localairport. Simultaneously, regional airports adopted a more commercial approach,
Figure 3 VFR passengers as a proportion of total passengers to and from the UK at the four main London airports, 2000, 2003 and 2007
10. CAP 754 – UK Regional Air Services: A Study by the Civil Aviation Authority, CAA (February 2005) and CAP 775 – AirServices at UK Regional Airports: An Update on Developments, CAA (November 2007).
0%
5%10%
15%
20%
25%30%
35%
40%45%
50%
Stansted Luton Heathrow Gatwick
VFR
pro
porti
on o
f int
erna
tiona
l pa
ssen
gers 2000
20032007
Executive Summary Page 5September 2009

CAP 787 International Relations – The Growth in Air Travel to Visit Friends or Relatives
actively seeking a network of services. A large component of this growth has been anincrease in VFR passengers. To consider the development of VFR traffic against abackground of local social changes, this study looks in more detail at two regionalairports, Bristol and Birmingham, and finds that migrant links, whether historic ormore recent, have played their part in the development of VFR traffic at the airports.
24 Alongside no-frills airlines, there has also been some blurring in the business modelsof established airlines seeking to compete in the low-fares market. Some carriers nowprovide seat-only fares11 on charter flights or operate scheduled flights which carry amix of seat-only and inclusive tour passengers. Such airlines tend to concentrate on'sunshine holiday' route networks that cater to the traditional inclusive tour market butmay also have particular appeal to second-home-generated VFR passengers (asopposed to economic migrant-type VFR passengers) who are UK residents.
Who is travelling on VFR trips?
25 Survey data12 show that VFR passengers to and from the UK tend to make morefrequent trips than holiday passengers, with over 40% of passengers taking three ormore leisure trips in a 12 month period. And, as might be expected, VFR passengersare characterised by more frequent travel to the same destination – 36% of VFRpassengers make all their leisure trips in the year to the same destination, comparedwith 28% of holiday passengers.
26 With (potentially) no hotel bookings to worry about and more flexibility about when totravel13, VFR passengers are less likely to take a standard length of holiday. Thereforea larger proportion of VFR passengers either take short (less than five days) or long(greater than two weeks) trips than holiday passengers. An estimated 25% of VFRpassengers take trips longer than two weeks compared with only 12% of holidaypassengers.
27 VFR passengers differ from holiday passengers in other ways too. For example, for UKresidents, the modal age band is younger – 25–44 compared with 45–64. There arealso differences in household type – almost one in three VFR passengers live in asingle-person household, compared with less than one in five holiday passengers.
28 In addition, VFR passengers tend, on average, to have lower incomes than holidaypassengers, indicating that the international nature of social networks that drive VFRtravel open up flying to more of the population, since the cost of the trip is likely to becloser to the cost of travel than for other journey purposes. For example, whilst 27%of UK resident holiday passengers have a household income of less than £28,750, thisproportion rises to 41% for VFR passengers.
29 The impact of income on trip frequency appears to be similar for both VFR and holidaypassengers, in that, as income rises, the proportion of passengers taking more thanthree trips a year also rises. However, as Figure 4 shows, this proportion isconsistently higher for VFR passengers than for holiday passengers.
11. Seat-only refers to the sale of airline tickets only, rather than a full-package holiday including accommodation.12. CAA Passenger Survey data, July–December 2007 at the Continuous Survey airports – questions regarding frequency of
leisure trips (as opposed to any type of trip) were only asked from July 2007 onwards.13. Although the trip may be more time-specific, such as visiting family at Christmas, the length of trip will be less
constrained by charter flights or hotel bookings, for instance.
Executive Summary Page 6September 2009

CAP 787 International Relations – The Growth in Air Travel to Visit Friends or Relatives
Source: CAA Passenger Survey, excluding international-to-international connectors.
30 The different characteristics of holiday and VFR passengers suggest that passengersegments are also likely to differ in their price sensitivity. However, conflictingarguments can be made concerning the price sensitivity of VFR passengers.
31 On the one hand, it is likely that the air fare for VFR passengers will make up a greaterproportion of overall trip cost than for holiday passengers, which could potentiallymake VFR passengers more price sensitive. On the other hand, given that VFRpassengers are likely to be destination-specific they may be less price sensitive. Pricesensitivity for a marginal VFR trip is also likely to depend on the frequency of tripstaken, with some passengers travelling far more frequently than others, and thus,potentially, more willing to forego a single trip.
Why the increase in VFR air trips?
32 The geography of the UK means that travel to international VFR destinations istypically by air. A combination of both increased demand and increased supply of airservices means that, in recent years, overall VFR traffic volumes have increasedsubstantially, whilst air fares have generally fallen.
33 General economic factors, such as changes in GDP or consumer expenditure, willimpact on VFR demand, as they will on air travel more generally. Similarly, changes inthe supply of air services, such as decreases in fare levels and extension of routenetworks brought about by increased liberalisation, will be beneficial to allpassengers. However, VFR travel crucially requires the existence of a friend or relativeoverseas, and therefore demand is also likely to be sensitive to social factors.
34 These factors are all inter-related – for instance, economic growth in the UK is likelyto be both stimulated by and to stimulate migration, and the attraction of second-home ownership will have been influenced by the lowering of fares and increasedaccessibility of many destinations. This study looks at the impact of each of thesefactors individually on the growth of demand for VFR traffic, and the influence on themof changes to the EU single market.
Figure 4 Proportion of international leisure passengers taking more than three leisure trips per year at the Continuous Survey airports, 2007
0%
10%
20%
30%
40%
50%
60%
70%
80%
Under£11,500
£11,500-£28,749
£28,750-£40,249
£40,250-£57,499
£57,500-80,499
£80,500-£114,999
over£115,000
Household income per annum
Prop
ortio
n of
pas
seng
ers
taki
ng >
3 le
isur
e tri
ps/y
ear
VFR Holiday
Executive Summary Page 7September 2009

CAP 787 International Relations – The Growth in Air Travel to Visit Friends or Relatives
Economic growth
35 The growth in UK resident VFR traffic over the last few years appears to be positivelyrelated to growth in UK GDP but with a time lag of around one to two quarters. Thisis a shorter time lag than that exhibited by UK resident holiday traffic, but therelationship is not as strong, which indicates the presence of other significant driversaffecting the level of demand for VFR traffic.
Supply of air services
36 Recent years have seen improved access to air travel, brought about by increasedroute networks and lower fares. UK–EU air traffic growth has been supported bysignificant change in the EU air passenger market since the early 1990s with theadoption of the 'Third Package' of aviation liberalisation measures. This legislationcreated a single market for aviation in the EU, meaning that airlines flying within theEU were free of restrictions on routes, the frequency of flights, and the setting offares. These conditions facilitated the rapid expansion in size and number of airlines,mainly no-frills operations, flying in and out of the UK to EU destinations. The businessmodel of these airlines, along with the competitive response to their entry into themarket, has led to:
• an increased number of routes being served: carriers have been able to connectregional points as well as capital cities throughout the EU. Notable increasesinclude Poland – four scheduled routes14 operated between the UK and Poland in2001, increasing to over 30 in 2007 – and Spain where the increase was from 43in 2001 to 144 in 200715.
• a lowering of fares: increased competition, particularly within Europe, hasencouraged airlines to innovate, bring forward new business models and drivedown the costs of air travel. This means that many more destinations in Europe arenow accessible by air, with greater flexibility of travel16 and relatively low travelcosts facilitating passenger growth. VFR passengers are likely to incur loweraccommodation and living expenses on their trip than traditional leisurepassengers, and so the overall cost of their trip is likely to be much more closelyrelated to the cost of the flight. CAA Passenger Survey data indicates that between2000 and 2007, estimated fares between the UK and EU15 countries fell by overa quarter in real terms, and between the UK and EUA8 countries by 40%.
37 On 1 May 2004, just over a decade after the creation of the EU single market intransport, the EU expanded to include the EU Accession Eight (EUA8) countries, alongwith Malta and Cyprus. This increased the population within the EU by almost 75million17 to a total of almost 500 million. The freedom of labour and capital to movethroughout the EU meant that the potential market for VFR travel grew at the sametime as the means of servicing it became cheaper and more accessible.
38 However, increased accessibility to travel has not been restricted to the EU. Althoughlong haul travel has not, in recent years, seen the same kind of structural change asthe growth of no-frills operations on short haul, there has been increasingliberalisation on long haul routes. This means a reduction in bilaterally agreedrestrictions on flights between the UK and other countries, for example on routes
14. Defined as airport pairs averaging more than three return services per week in the year – this definition potentially meansthat some seasonal services will be excluded.
15. Spain including the Canary Islands. Part of the increase in routes represents a shifting from charter services to scheduledservices. However, even considering charter and scheduled destinations in total, the number of routes has increasedfrom 122 in 2001 to 181 in 2007.
16. For example, removal of the requirement for cheaper fares to span a Saturday night.17. Approximately half of which was in Poland.
Executive Summary Page 8September 2009

CAP 787 International Relations – The Growth in Air Travel to Visit Friends or Relatives
operated, frequency of flights, and setting of fares by airlines. Where markets areliberalised, with the provision of increased supply and greater competition, there isgenerally evidence of lower fares and increased accessibility of flights. New routesand improved connections may also reduce passenger journey times, particularly tosecondary cities.
39 A recent example of such liberalisation is the air services agreement between the UKand India. This was the subject of a CAA study in 200618, which found that theloosening of previous regulatory constraints triggered a rapid increase in the numberof passengers carried by airlines from both countries. Increases in capacity andcompetition led to significant reductions in fares between the UK and India. Surveydata estimates that a higher than average proportion of passengers between the UKand India are travelling for VFR purposes.
Social factors
40 Of particular relevance to VFR travel between the UK and other countries within theEU single market, EU enlargement has led to increased labour and capital mobilityover a wider area. Not only has this generated potential demand for travel, but thegeographical proximity of EU countries to the UK means that flights cost less andtravel to visit friends or relatives is more affordable in terms of both time and moneythan to longer-haul destinations.
41 In contrast, although there are significant social links between the UK andCommonwealth countries, trips to and from these countries tend to be more costly.This is partly a result of distance (such countries are generally further afield) but mayalso be due to the more restrictive air services agreements – potentially constrainingsupply – in place as compared with the single market for aviation across the EU.
42 Migrant flows both into and out of the UK have been growing over time, with the mostpronounced growth outside London. Figure 5 shows total London and regionalimmigrant and emigrant flow figures for the UK for selected years since 1992.
Source: ONS, Total International Migration.
18. UK–India Air Services: A case study in liberalisation, CAA (November 2006).
Figure 5 International migrants to and from London and the UK regions, 1992–2007
-300
-200
-100
0
100
200
300
400
500
1992 1997 2002 2007
Num
ber
of m
igra
nts
(thou
sand
s)
-300
-200
-100
0
100
200
300
400
500
London (inflow)Other UK (inflow)London (outflow)Other UK (outflow)
Executive Summary Page 9September 2009
CAP 787 International Relations – The Growth in Air Travel to Visit Friends or Relatives
43 Analysis of the full set of migration data shows:
• total flows of migrants across the UK’s borders19 rose by over 50% between 1997and 2007;
• before 2001, the total flows of international migrants to and from the UK regionsin a year was never more than half a million – by 2007 it had risen to almost 700thousand;
• net international migration in the UK regions for the period between 1992 and 1997was a few thousand – between 2002 and 2007, it was over 700 thousand; and
• in large part, the increase in migrant flows since 2002 has been due to migrationbetween the UK and other EU countries.
44 Whilst migrant flows may indicate how new cross-border social networks can begenerated, the UK has many existing immigrant and emigrant communities which areconstantly fluctuating in size. However, the effect of migration on relationshipnetworks is not confined solely to current migrants: the experience of migration islikely to create some ongoing demand for VFR traffic even if the migrant returns homeafter some period of time.
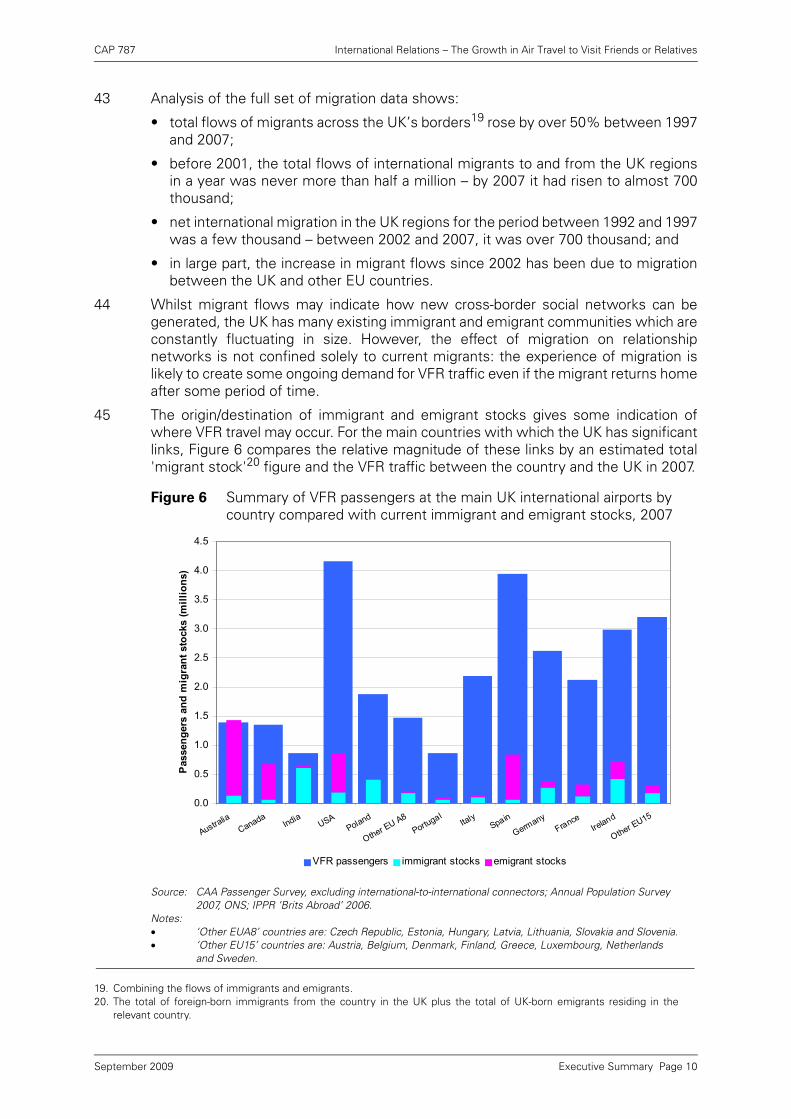
45 The origin/destination of immigrant and emigrant stocks gives some indication ofwhere VFR travel may occur. For the main countries with which the UK has significantlinks, Figure 6 compares the relative magnitude of these links by an estimated total'migrant stock'20 figure and the VFR traffic between the country and the UK in 2007.
Source: CAA Passenger Survey, excluding international-to-international connectors; Annual Population Survey 2007, ONS; IPPR ‘Brits Abroad’ 2006.
Notes:• ‘Other EUA8’ countries are: Czech Republic, Estonia, Hungary, Latvia, Lithuania, Slovakia and Slovenia.• ‘Other EU15’ countries are: Austria, Belgium, Denmark, Finland, Greece, Luxembourg, Netherlands
and Sweden.
19. Combining the flows of immigrants and emigrants.
Figure 6 Summary of VFR passengers at the main UK international airports by country compared with current immigrant and emigrant stocks, 2007
20. The total of foreign-born immigrants from the country in the UK plus the total of UK-born emigrants residing in therelevant country.
0.0
0.5
1.0
1.5
2.0
2.5
3.0
3.5
4.0
4.5
AustraliaCanada
IndiaUSA
Poland
Other EU A8Portugal
ItalySpain
GermanyFrance
Ireland
Other EU15
Pass
enge
rs a
nd m
igra
nt s
tock
s (m
illio
ns)
VFR passengers immigrant stocks emigrant stocks
Executive Summary Page 10September 2009

CAP 787 International Relations – The Growth in Air Travel to Visit Friends or Relatives
46 This figure illustrates that:
• for a given migrant stock balance, destinations closer to the UK generate moretraffic than longer-haul destinations; and
• EU destinations generally show higher VFR traffic where migrant stocks arehigher.
47 There are forms of more temporary migration which can also lead to the developmentof social networks, the maintenance of which will require VFR travel.
• Education – the UK remains a popular destination for students and hadapproximately 350 thousand21 foreign-born nationals in higher education in 2006/7.It is likely such students will visit and be visited by friends or relatives whilststudying, but also that they will build friendships which may lead to continuedtravel even after their course of study is completed. Although a growing numbercome from outside the EU, in 2006/7 one-third of such students were EU citizens.
• Second-home ownership – increasing levels of second-home ownership areclosely related to migration and VFR travel. In recent years, the number of Britishhouseholds owning a second-home overseas has increased rapidly toapproximately 250 thousand22 in 2006/7. Of these second-homes, over three-quarters are located in the EU. Although people visiting their own second-homeare not categorised as travelling for VFR, friends or relatives travelling to visit themare.
Statistical analysis
48 Regression analysis provides supporting evidence for the relationships between VFRtraffic and various potential drivers discussed above. However, due to limitations andrestrictions in the data available, the results are likely subject to a high degree ofuncertainty and any inferences drawn from them should be treated cautiously. Keylimitations to the data are the time period covered (a period where the time-varyingfactors considered have shown an upward trend), the countries included, and thereliance on survey data.
49 The results obtained support the view that the experience of migration and growth inincome are both positively related to changing levels of VFR over time. Furtherexploratory analysis on the relative levels of VFR by country indicates that factors suchas income and population, distance from the UK and social/cultural ties all have animpact. UK–Spain stands out as being a particularly large VFR market, most likely dueto a combination of factors that make it a particularly attractive leisure destination –for example, its climate, coastline and historical popularity as a leisure destination.
Outline of the study
50 The remainder of this study is structured as follows:
• Chapter 1: Introduction – sets out the aims, background and context for the study.
• Chapter 2: UK Airports and International VFR Traffic – considers how internationalVFR traffic has developed across UK airports in recent years, looking at differencesbetween the regional and London airports, destinations served and airlinesoperating. Two detailed case studies on Bristol and Birmingham airports areincluded.
21. Higher Education Statistics Agency – note these students are a subset of overall immigrant stocks.22. Housing Statistics Summary 027: Survey of English Housing: Preliminary Results – 2006/07, Communities and Local
Government.
Executive Summary Page 11September 2009
CAP 787 International Relations – The Growth in Air Travel to Visit Friends or Relatives
• Chapter 3: Characteristics of International VFR Passengers – considers how thesepassengers differ from other leisure (holiday) passengers in terms ofdemographics and frequency of travel.
• Chapter 4: Factors Influencing International VFR Traffic Growth – looks at possibledrivers behind increased demand, how the supply of air services has facilitatedgrowth, and investigates available data for evidence, including some statisticalsupporting work.
• Annexes: Further detail behind the statistical analysis summarised in Chapter 4,and EU country-group definitions used.
Acknowledgements
51 The CAA would like to thank all those from the aviation industry who contributed tothe discussions that helped inform the development of this study.
Executive Summary Page 12September 2009
CAP 787 International Relations – The Growth in Air Travel to Visit Friends or Relatives
Chapter 1 Introduction
23
Who are VFR passengers?
1.1 Air passengers travel for many different reasons, but for simplicity are oftensegmented into Business or Leisure passengers according to purpose of travel.Within the leisure segment there are a number of different types of trips being made,such as weekend breaks, gap-year trips, or annual two-week holidays. However, tripsto visit friends or relatives are different from the others in a number of ways.
• The destination is less likely to be substitutable than in the case of internationalholiday travel, where a variety of destinations may meet passengers’ needs.
• The cost of the trip is likely to be closer to that of the flight alone, because of loweraccommodation or living costs – for many such trips, these costs may be met inwhole or part by the friend or relative being visited.
• The desire to travel is dependent on the prior dispersal of social networks.
1.2 In recent years, an increasingly globalised world economy has led to a rise in labourmobility and migration. This movement of people has made social networks moredispersed, which has meant growth in the potential market of people who need totravel by air in order to maintain close links with their friends or relatives. Therelaxation of regulatory restrictions on aviation markets has encouraged increases insupply to meet this demand.
1.3 Of particular relevance to VFR travel between the UK and other countries within theEU single market, EU enlargement has led to increased labour and capital mobilityover a wider area. Not only has this generated potential demand for travel, but thegeographical proximity of EU countries to the UK means that flights cost less andtravel to visit and relatives is more affordable in terms of both time and money thanto longer-haul destinations.
23. The Continuous Survey airports refers to those airports that the CAA surveys on a continuous basis. These areHeathrow, Gatwick, Luton, Stansted and Manchester.
Chapter Summary
This Chapter sets out the objectives and scope of this study. It begins by providingbackground on passengers travelling to and from the UK for the purpose of VisitingFriends or Relatives (VFR), and why this particular subset of traffic is of interest.
International VFR traffic differs from other leisure traffic in that it requires someprevious overseas dispersal of friends or family, which creates potential demandfor travel to specific destinations and a total trip cost which is likely to be differentfrom other leisure traffic in that accommodation costs may be lower.
Between 2003 and 2007, VFR traffic grew strongly relative to other passengersegments, with rolling annual growth of more than 10% each year, accounting foran increasing proportion of total passengers. Provisional data for 2008 indicatethat, although passenger numbers have fallen for the year, the proportion travellingfor VFR purposes at the Continuous Survey23 airports remains broadly the sameas it was in 2007.
Chapter 1 Page 1September 2009

CAP 787 International Relations – The Growth in Air Travel to Visit Friends or Relatives
1.4 In contrast, although there are significant social links between the UK andCommonwealth countries, trips to and from these countries tend to be more costly.This is partly a result of distance (such countries are generally further afield) but mayalso be due to the more restrictive air services agreements – potentially constrainingsupply – in place, as compared with the single market for aviation across the EU.
1.5 In early 2008, the CAA published a study investigating recent UK air traffic growthtrends24. This study noted how growth rates have varied for different passengersegments, and identified segments where growth had slowed in the previous two tothree years (mainly domestic traffic and UK resident international holiday traffic).
1.6 The study also noted that the segment displaying the most consistently stronggrowth in recent years was passengers travelling internationally to visit friends orrelatives (VFR). International VFR traffic showed rolling annual growth of over 10%from Q1 2003 until the middle of 2007. Although growth had slowed to 5% in Q42007, this was still higher than other passenger segments. International VFRpassengers are therefore increasingly significant to the overall UK passenger market.Provisional data for 2008 indicates rolling annual growth of around 3% in Q3 2008.These figures are influenced by the growth still evident towards the end of 2007 andearly 2008 – quarterly data shows a decline in all passenger segments starting in thesecond half of 2008.
1.7 The aim of this study is to provide a greater understanding of this growing segmentof the air passenger market in the UK through examining:
• how international VFR traffic has grown in recent years, and how this differs fromother passenger segments;
• how this traffic has grown differently across UK airports;
• the characteristics of VFR passengers (and how they differ from other leisurepassengers);
• potential drivers behind the evident growth in demand, and how they differ fromthose for holiday traffic – if the drivers of international VFR traffic growth aresignificantly different from those of other leisure traffic (typically GDP growth andexchange rates), the increased significance of VFR traffic may have an impact onfuture air demand and predictions for it;
• how changes in the supply of air services have been beneficial in servicing thisdemand; and
• the future prospects for this traffic segment – the weakening of the UK economycould potentially affect VFR traffic growth through lower consumer spending, butmay also have an impact on migration, which would affect the size of the potentialVFR market.
1.8 The study draws heavily on the CAA’s extensive database of statistical, survey andother information on airports and airlines to understand more clearly how thispassenger segment has developed in recent years. By identifying relevant trends, thedrivers of those trends and the implications for the industry and consumers, and thenpublishing this information for the benefit of the industry and policymakers, the CAAis fulfilling a wider remit to facilitate the long-term sustainability of the industrythrough a wider understanding of the air passenger market in the UK.
24. Recent Trends in Growth of Air Passenger Demand, CAA (January 2008).
Chapter 1 Page 2September 2009

CAP 787 International Relations – The Growth in Air Travel to Visit Friends or Relatives
Methodology
1.9 Data from various sources were used in this study, including CAA air traffic statistics,the International Passenger Survey (IPS) carried out by the Office for NationalStatistics (ONS), the CAA’s own Passenger Survey, and other available data onmigration and the UK economy.
1.10 Proportions of VFR traffic as reported by the CAA and IPS surveys have beencompared. Although the CAA Passenger Survey tends to record a consistently higherproportion of VFR passengers than the IPS25, both surveys demonstrate an upwardtrend in growth in the proportion of VFR traffic, for both UK and non-UK residentpassengers, at UK airports.
1.11 This study generally uses the CAA Passenger Survey, where possible, as theinterviews are weighted at a route level and connecting passengers can be identified,making it more appropriate for this type of analysis26. However, where a time-seriesfor all UK airports is needed, the IPS data have been used as the CAA only surveysthe largest UK airports on a continuous basis (and, as demonstrated in Chapter 2, thesmaller regional airports have also played an important role in the growth of VFRtraffic).
1.12 Discussions were also held with various interested parties from the aviation industry.These discussions indicated that there are a number of differing, overlappingdefinitions of a VFR passenger. Some prefer to segment a passenger’s journeys intothose that are regular trips to the same destination (assumed to be VFR traffic), andthose that are trips to different destinations (assumed to be 'holiday' traffic).
1.13 Using this definition, passengers who visit a friend or relative infrequently may not fallinto the VFR category, while passengers commuting weekly to/from a second-homeoutside the UK would do. However, commuters are likely to be influenced by differentdrivers, and thus display different characteristics, from other types of VFRpassengers. For example, in the short-term, they are likely to be tied into theirtravelling plans and will appear to be fairly price-insensitive. However, sustained pricerises may lead to a step change in behaviour and a lifestyle adjustment to reduce theneed for ongoing regular trips.
1.14 In contrast, both CAA and IPS surveys classify passengers according to the theirstated journey purpose. Thus, weekly commuters are recorded as businesspassengers, while both regular (to the same destination) and irregular (travelling lessfrequently or to varying destinations) VFR travellers will be recorded as VFR. For thisstudy, this definition of a VFR passenger is used.
1.15 Throughout the study, analysis focuses on VFR passengers travelling to and from theUK. It therefore excludes domestic journeys and those passengers who have arrivedin the UK for the sole purpose of catching an onward international flight. From hereonin, where the abbreviation 'VFR' is used, it is specifically referring to this restricted setof international passengers using UK airports. Other international leisure passengersare referred to as 'holiday' passengers.
1.16 The main challenges faced when conducting this study were:• Reliance on survey data. The journey purpose of passengers can only be
obtained from survey data from a sample of passengers, and therefore any figuresderived are generally approximations. Both CAA and IPS surveys determine
25. The reason for which is not clear – it is likely the differences are due in part to interviewing techniques alongside moretechnical differences such as the weighting methodology applied. The IPS dataset is weighted to include all UK airportsin every year, making it more appropriate for a time-series than the CAA Passenger Survey, where airports are surveyedon a rotating basis and data weighted at a route-level to airport totals, making it more appropriate for destination-specificanalysis.
26. Although weighting is conducted at a route-level, survey data also allows identification of the passengers’ stated finaldestination, which is of more relevance to this analysis and has been used throughout.
Chapter 1 Page 3September 2009

CAP 787 International Relations – The Growth in Air Travel to Visit Friends or Relatives
journey purpose by presenting the passenger with a list of alternative purposes tochoose from, and it is the interviewee who selects the journey purpose which theyfeel best fits their current trip27.
• Identifying a consistent group of VFR passengers, and the subsets within.
Whilst the distinction between business and leisure travel may be considered fairlyclear cut, there is more ambiguity over the VFR category. For instance, if apassenger combines a traditional leisure trip with a visit to a friend or relative, thenthey could equally validly call the trip 'holiday' or 'VFR'28. However, this merelysignifies that the precise extent of the increase in VFR may be difficult to measure– it should not cast doubt on the central assertion that VFR traffic has recentlyincreased at a faster rate than other leisure traffic.
• Understanding the range of reasons for which VFR passengers may be
travelling. Some passengers may be making trips as a substitute for a holiday,while others may be economic migrants who have close family at home that theyvisit regularly. Some passengers will see their trip as more necessary than otherpassengers who may view it more as a discretionary holiday.
Growth in international passenger traffic since 1990
1.17 International passenger numbers at UK airports have grown by nearly 150% since1990, from 77 million to 192 million in 2007. Growth in international VFR traffic hasbeen robust in comparison with other market segments. Figure 1.1 shows how rollingannual VFR growth29 has remained several percentage points higher than growth ininternational business and other leisure traffic over the last five years. This fastergrowth rate means that the proportion of traffic travelling for VFR increased from 18%in 2000 to 24% in 200830.
Source: International Passenger Survey (MQ6), ONS.Note: Q1–Q3 2008 data provisional.
27. Both surveys give their interviewers guidance as to how to interpret the various categories, but this guidance wouldinfluence the response only when the interviewee asks for clarification or seems unsure.
28. The same is true of passengers who combine business and leisure trips. However the main purpose of the trip cangenerally be identified by asking who paid for the trip, with those trips funded by employers being considered tripsprimarily for a business purpose.
29. For example, rolling annual growth at Q3 2007 is the growth in the total traffic for the preceding year (Q4 2006–Q3 2007)compared with the equivalent period in the previous year (Q4 2005–Q3 2006).
Figure 1.1 Rolling annual growth in international passenger traffic at UK airports by journey purpose, 2000–2008
30. As estimated by the IPS (provisional data only for Q1–Q3 2008). The IPS records a journey purpose of ‘miscellaneous’,which comprised approximately 5% of international passengers in 2007 and has been excluded when calculatingproportions.
-15%
-10%
-5%
0%
5%
10%
15%
20%
Q4 2000
Q2 200
1
Q4 2001
Q2 2002
Q4 200
2
Q2 2003
Q4 200
3
Q2 200
4
Q4 2004
Q2 200
5
Q4 2005
Q2 2006
Q4 200
6
Q2 2007
Q4 200
7
Q2 200
8P
Rol
ling
annu
al g
row
th
Holiday Business VFR
Chapter 1 Page 4September 2009

CAP 787 International Relations – The Growth in Air Travel to Visit Friends or Relatives
Foreign and UK residents
1.18 Air passenger surveys typically place more weight on the residence (rather thannationality) of the passenger, because this indicates, for instance, the likely countrywhere the ticket to travel has been purchased (and the currency it has beenpurchased in). Although this may not always be the most suitable method for trackingVFR passengers (since migrants will initially be categorised as foreign residents, butwill become UK residents), it does facilitate the separation of passengers’ journeysinto inbound and outbound trips.
1.19 Figure 1.2 shows that strong growth of VFR traffic has been evident amongst bothforeign resident passengers and UK resident passengers since 2002. According tothe IPS, 14% of UK resident passengers were travelling for VFR purposes in 2000,rising to 19% in 2007. For foreign resident terminal passengers the VFR proportionrose from 28% in 2000, to 36% in 2007. Overall, VFR traffic made up nearly one-thirdof leisure traffic in the year to Q3 2008.
Source: International Passenger Survey (MQ6), ONS.Note: Q1–Q3 2008 data provisional.
1.20 In 2008, less than one-third of traffic to and from the UK was foreign resident, but over40% of the VFR traffic. Since early 2004 both UK and foreign resident VFR traffic havegrown at rates in excess of 10% per annum, only falling below that in 2007, whenthere was a noticeable slowdown. However, VFR was still growing more stronglythan holiday traffic.
Destination of VFR passengers
1.21 Figure 1.3 shows the most significant destination31 countries for international VFRpassengers at the five UK airports continuously surveyed by the CAA. It illustratesthat the increase in passenger numbers is a combination of slower growth fromcountries with a larger passenger base and more rapid growth in passenger numbersfrom some of the other countries (starting from a low base). It is notable that theUnited States and three other longer-haul destinations (shown in shades of blue) haveshown minimal growth, although still constitute a sizeable proportion of total VFRtraffic in 2007.
Figure 1.2 Rolling annual growth in international VFR passenger at UK airports, 2000–2008
31. ‘Destination’ is used throughout to refer to both origin and final destination country of those passengers travelling to andfrom the UK respectively.
-5%
0%
5%
10%
15%
20%
Q4 2000
Q2 2001
Q4 2001
Q2 200
2
Q4 200
2
Q2 2003
Q4 2003
Q2 200
4
Q4 200
4
Q2 2005
Q4 2005
Q2 2006
Q4 200
6
Q2 200
7
Q4 2007
Q2 2008
P
Growth in UK resident VFR Growth in foreign resident VFR
Chapter 1 Page 5September 2009

CAP 787 International Relations – The Growth in Air Travel to Visit Friends or Relatives
Source: CAA Passenger Survey.
Notes:
• Excluding international-to-international connectors (those passengers identified in the Passenger Survey as arriving at the airport by air from an international destination and flying out to an international destination).
• UK airports included are: Heathrow, Gatwick, Luton, Stansted and Manchester.
• ‘Other EU15’ countries are: Austria, Belgium, Denmark, Finland, Greece, Luxembourg, Netherlands and Sweden.
• ‘Other EU27’ countries are: Bulgaria, Cyprus, Czech Republic, Estonia, Hungary, Latvia, Lithuania, Malta, Romania, Slovakia and Slovenia.
1.22 Destinations with the highest absolute levels of VFR traffic to and from the fiveairports surveyed are USA, Spain, Ireland, Germany, Italy and France. However, fasterrecent growth in both Poland and the recently acceded EU member states (shown as'Other EU27'32) is evident. From less than one million passengers in 2001, Poland andthe other accession countries together now account for a similar number of VFRpassengers to and from the UK as the United States.
1.23 Figure 1.3 uses data from the CAA Passenger Survey. In order to obtain a time series,data are shown for the Continuous Survey airports only (which accounted for three-quarters of total international passengers at UK airports in 2007, but nearly all the longhaul passengers). By excluding the other UK airports these data are likely to overstatethe importance of the long haul destinations as compared with short haul in terms ofthe overall picture across the UK. Chapter 2 therefore looks at a more extensive rangeof UK airports with traffic estimated in spot years of 2000, 2003 and 2007.
Figure 1.3 International VFR passengers by country of final destination at the Continuous Survey airports, 2001–2007
32. See Annex C for details of EU Member States and definitions of country groupings.
0
5
10
15
20
25
30
35
40
45
2001 2002 2003 2004 2005 2006 2007
Inte
rnat
iona
l VFR
pas
seng
ers
(mill
ions
)
0
5
10
15
20
25
30
35
40
45
Australia Canada India United States Germany
Ireland Italy France Spain Portugal
Other EU15 Poland Other EU27 Total
Chapter 1 Page 6September 2009

CAP 787 International Relations – The Growth in Air Travel to Visit Friends or Relatives
Looking forward
1.24 Subsequent to the completion of the main body of this study and analysis therein,provisional data for passengers in 2008 have become available. As noted previously,the subset of VFR passengers is only identifiable through survey data, which meansthere is a longer lead time for final data to be published than for total passengernumbers.
1.25 Latest data33 from the International Passenger Survey indicate that VFR growth in2008 remained stronger than other market segments, with business travel volumefalling. VFR traffic growth fell below 10% in mid-2007 but remained steady at around3% for most of 2008. However, the data show a decline in quarterly passenger traffic(for all purposes) in Q3 2008.
1.26 CAA Passenger Survey data are also now available for 2008, albeit in provisional formonly. These data indicate that, although passenger numbers have fallen for the year,VFR traffic as a proportion of total traffic at the Continuous Survey airports is broadlythe same as it was in 2007.
1.27 Since Q3 2008, the UK economy has seen negative growth in GDP, which is likely tohave an impact on passenger numbers. As discussed in Chapter 4, the relationshipbetween VFR and UK GDP does not appear to be as strong as that between holidaytraffic and UK GDP, and that migratory flows also play an important role in VFRgrowth.
1.28 However, there is evidence of a link between UK GDP and changes in migration34.For immigrants, the relationship is likely to be circular, with rising income levelsmaking the UK an attractive destination, whilst increases in population will also addto overall GDP. In recent years, rising UK house prices and favourable exchange rates(both trends which have now reversed) may have made emigration an attractiveprospect for UK nationals, for example, through selling property in the UK and movingto destinations where real house prices were relatively lower.
1.29 Changes in the flow of new migrants35 could affect the potential size of the futureVFR market – but even if there were to be a reversal of migration trends, there stillremains an existing body of people who are either current migrants, or have at somepoint been migrants. The responses of these individuals to the UK recession will varyaccording to factors such as: how long they have been in their current country ofresidence, the nature of their employment, family ties (either in their country ofresidence or in their country of birth) and relative exchange rates. Also, if a migrantdoes return home (either from or back to the UK), the likelihood of repeat VFR travelon the route will again be dependent on individual circumstances.
1.30 The analysis in this study has been carried out using data which cover a period ofsignificant change in terms of enlargement of the EU, the migration flows thisenabled and concurrent liberalisation of the EU aviation market (giving rise to moreaffordable air travel). In light of these developments, it may not be realistic to assumecontinued growth of the same magnitude, however, a strong foundation for anenlarged passenger base has been established.
33. IPS (MQ6) data are now available for Q1–Q3 2008 in provisional form.34. See Technical Annex A for more detail. A correlation coefficient of 0.4 is observed between the increase in ‘migration
experience’ (cumulative inflows to the UK of foreign nationals plus cumulative outflows from the UK of UK nationals) andUK GDP over the period 2000–2007.
35. The UK ONS forecast future net migratory inflows to the UK to be 191 thousand per annum up to 2016/17. However,these projections do not attempt to predict the impact of new or future government policies, changing economiccircumstances or other factors. National Population Projections 2006-based – PP2 No.26, ONS (June 2008).
Chapter 1 Page 7September 2009

CAP 787 International Relations – The Growth in Air Travel to Visit Friends or Relatives
1.31 Demand for travel for VFR purposes is an indication of the desire to build and maintainrelationships, and whether people continue to do this at the same rate as they havehistorically will depend on the relative value that they place on these relationships ascompared with other demands on their time and income, and the affordability of trips,affected by exchange rates and travel costs.
1.32 Thus, although falls in UK GDP are likely to impact on VFR passenger traffic, bothdirectly and indirectly via the effect on migration, the extent of the impact cannot beestimated with any certainty. Provisional data for 2008 indicate that althoughpassenger numbers have fallen for the year, VFR traffic as a proportion of total trafficat UK airports is broadly the same as it was in 2007.
Chapter 1 Page 8September 2009

CAP 787 International Relations – The Growth in Air Travel to Visit Friends or Relatives
Chapter 2 UK Airports and International VFR traffic
2.1 In 2007, 163 million international passengers were handled by the UK’s nine largestinternational airports36. This total has increased by nearly 30% since 2000. Theremaining 15% of international passengers, totalling 30 million in 2007, were handledby more than 30 smaller UK commercial airports. Since the nine biggest airportsaccount for the majority of international passengers, and survey data is necessarilymore limited at smaller airports, this Chapter focuses on these nine main internationalairports.
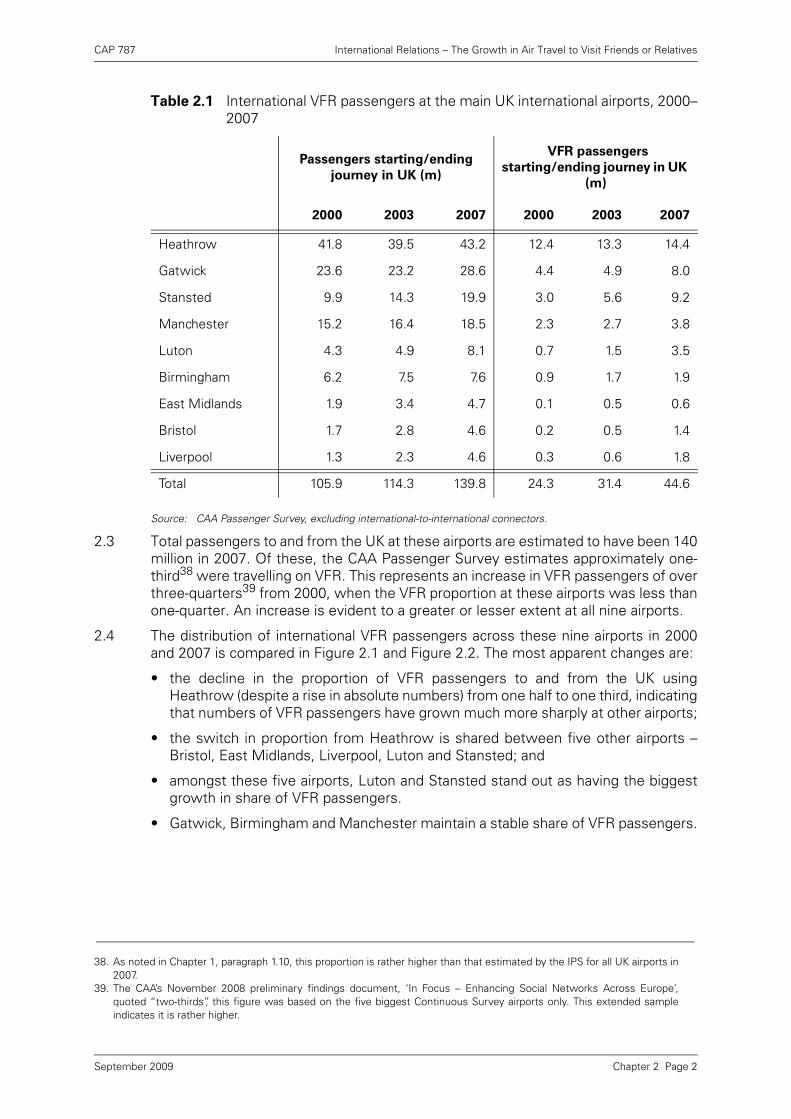
2.2 Development of VFR traffic at each of these nine airports since 2000 has beeninvestigated using survey data37 with a view to identifying common themes thatappear to be of particular relevance to VFR traffic. This analysis excludes passengerswho have connected at the survey airport from an international flight in order to flyonwards. Table 2.1 shows total international passengers starting or ending theirjourney in the UK, for each of the nine airports, and the number travelling for thepurpose of VFR.
36. These nine airports are: Heathrow, Gatwick, Luton, Stansted, Manchester, Birmingham, Bristol, East Midlands andLiverpool. The smallest handled 4.6 million international passengers in 2007.
37. As UK regional airports are not surveyed every year by the CAA, the nearest survey years to 2000, 2003 and 2007 wereused and scaled appropriately using CAA Airport Statistics. The actual survey data used are as follows: Bristol – 2000,2003, 2008 Jan–June; East Midlands – 1999, 2003, 2006; Liverpool – 1999, 2003, 2007; Birmingham – 1999, 2003, 2006;all other airports – 2000, 2003, 2007
Chapter Summary
This Chapter considers how international VFR traffic has developed at UK airportsin recent years, looking at differences between regional and London airports,destinations served and airlines operating. Two detailed case studies on Bristoland Birmingham airports are included.
Although the main UK airports all demonstrate an increased proportion ofinternational passengers travelling for VFR since 2000, growth in VFR traffic is notspread proportionately between them. For instance, although Heathrow accountsfor the greatest number of international VFR passengers of any single UK airport,VFR traffic there has grown by only 16% since 2000. Stansted, however, servedapproximately three times as many VFR passengers in 2007 as it did in 2000, andLuton nearly five times as many.
At airports where VFR growth has been particularly rapid, it has primarily beendriven by trips between the UK and EU, and, generally, an increase in VFR trafficto EU destinations from an airport has been related to the expansion of no-frillsairline operations at that airport. Airports where VFR growth has been at a lowerrate tend to have a more substantial proportion of passengers travelling todestinations outside the EU.
Chapter 2 Page 1September 2009
CAP 787 International Relations – The Growth in Air Travel to Visit Friends or Relatives
Source: CAA Passenger Survey, excluding international-to-international connectors.
2.3 Total passengers to and from the UK at these airports are estimated to have been 140million in 2007. Of these, the CAA Passenger Survey estimates approximately one-third38 were travelling on VFR. This represents an increase in VFR passengers of overthree-quarters39 from 2000, when the VFR proportion at these airports was less thanone-quarter. An increase is evident to a greater or lesser extent at all nine airports.
2.4 The distribution of international VFR passengers across these nine airports in 2000and 2007 is compared in Figure 2.1 and Figure 2.2. The most apparent changes are:
• the decline in the proportion of VFR passengers to and from the UK usingHeathrow (despite a rise in absolute numbers) from one half to one third, indicatingthat numbers of VFR passengers have grown much more sharply at other airports;
• the switch in proportion from Heathrow is shared between five other airports –Bristol, East Midlands, Liverpool, Luton and Stansted; and
• amongst these five airports, Luton and Stansted stand out as having the biggestgrowth in share of VFR passengers.
• Gatwick, Birmingham and Manchester maintain a stable share of VFR passengers.
Table 2.1 International VFR passengers at the main UK international airports, 2000–2007
Passengers starting/ending
journey in UK (m)
VFR passengers
starting/ending journey in UK
(m)
2000 2003 2007 2000 2003 2007
Heathrow 41.8 39.5 43.2 12.4 13.3 14.4
Gatwick 23.6 23.2 28.6 4.4 4.9 8.0
Stansted 9.9 14.3 19.9 3.0 5.6 9.2
Manchester 15.2 16.4 18.5 2.3 2.7 3.8
Luton 4.3 4.9 8.1 0.7 1.5 3.5
Birmingham 6.2 7.5 7.6 0.9 1.7 1.9
East Midlands 1.9 3.4 4.7 0.1 0.5 0.6
Bristol 1.7 2.8 4.6 0.2 0.5 1.4
Liverpool 1.3 2.3 4.6 0.3 0.6 1.8
Total 105.9 114.3 139.8 24.3 31.4 44.6
38. As noted in Chapter 1, paragraph 1.10, this proportion is rather higher than that estimated by the IPS for all UK airports in2007.
39. The CAA’s November 2008 preliminary findings document, ‘In Focus – Enhancing Social Networks Across Europe’,quoted “two-thirds”, this figure was based on the five biggest Continuous Survey airports only. This extended sampleindicates it is rather higher.
Chapter 2 Page 2September 2009

CAP 787 International Relations – The Growth in Air Travel to Visit Friends or Relatives
Source: CAA Passenger Survey, 2000, excluding international-to-international connectors.
Note: In 2000, these airports made up 89% of all international terminal passengers at UK airports40.
Source: CAA Passenger Survey, 2007, excluding international-to-international connectors.
Note: In 2007, these airports made up 85% of all international terminal passengers at UK airports40.
2.5 These charts broadly reflect the general pattern of international traffic growth atairports between 2000 and 2007 – relatively little growth at Heathrow, nearly 25% atBirmingham, Manchester and Gatwick and anything from 90% to 250% at the others.In particular, some regional airports show a high growth rate in recent years, from arelatively small base.
Figure 2.1 Distribution of international VFR passengers between the main UK international airports, 2000
Figure 2.2 Distribution of international VFR passengers between the main UK international airports, 2007
40. It is not possible to estimate the proportion of VFR passengers that these airports account for out of the totalinternational VFR passengers in any one year, as there is not a full CAA data set for all UK airports available for each yearand the IPS data is weighted in such a way that the airports listed cannot be isolated.
0%
1%
3%
12%4%10%
51%18%
18% 1%BirminghamManchesterHeathrowGatwick
BristolEast MidlandsLiverpoolLutonStansted
1%
4%9%
32%37%
18%
21%
8%
4%
3%Birmingham
ManchesterHeathrow
Gatwick
Bristol
East Midlands
Liverpool
LutonStansted
Chapter 2 Page 3September 2009

CAP 787 International Relations – The Growth in Air Travel to Visit Friends or Relatives
2.6 Table 2.2 demonstrates how strong VFR traffic growth at these nine airports hasaltered the proportions of passengers travelling for VFR purposes over the period2000 to 2007. All the airports show an increase in this proportion, some morepronounced than others.
Source: CAA Airport Statistics and CAA Passenger Survey, excluding international-to-international connectors.Note: Nearest survey years to 2000, 2003 and 2007 used – see footnote 37.
Changes in destination of VFR passengers
2.7 As shown in Table 2.1, across the nine airports considered, international VFR trafficgrew by approximately 20 million to an estimated 45 million in 2007.
2.8 Figure 2.3 demonstrates that nearly three-quarters of this growth arose frompassengers travelling between the UK and EU (passengers making connections at EUhub airports on to non-EU flights are not included in this category). Although non-EUtraffic made up just over one-quarter of the growth, it still accounted for 40% of thetotal international VFR traffic in 2007.
Table 2.2 VFR proportion of international passengers at the main UK international airports, 2000–2007
VFR% of international
passengers with O/D of UK
2000 2003 2007
Stansted 30% 39% 46%
Luton 17% 31% 43%
Liverpool 22% 27% 40%
Heathrow 30% 34% 33%
Bristol 11% 18% 31%
Gatwick 19% 21% 28%
Birmingham 14% 23% 24%
Manchester 15% 17% 21%
East Midlands 6% 14% 13%
Chapter 2 Page 4September 2009

CAP 787 International Relations – The Growth in Air Travel to Visit Friends or Relatives
Source: CAA Passenger Survey, excluding international-to-international connectors.Notes:
• UK airports included are: Heathrow, Gatwick, Luton, Stansted, Manchester, Birmingham, Bristol, Liverpool and East Midlands.
• Nearest survey years to 2000 and 2007 – see footnote 37.
• 'Other EU15’ countries are: Austria, Belgium, Denmark, Finland, Greece, Luxembourg, Netherlands and Sweden. UK is excluded as domestic traffic not considered here.
• 'Other EU27’ countries are: Bulgaria, Cyprus, Czech Republic, Estonia, Hungary, Latvia, Lithuania, Malta, Romania, Slovakia and Slovenia.
2.9 Figure 2.4 illustrates how the growth in VFR passengers is split by destination and UKairport – at Birmingham, Manchester and Heathrow the growth is mainly made up ofpassengers travelling outside the EU, whereas growth at the other airports is mainlyfrom UK–EU traffic.
Source: CAA Passenger Survey, excluding international-to-international connecting passengers.
Figure 2.3 Contribution to growth of international VFR passengers at the main UK international airports, 2000–2007
Figure 2.4 Estimated growth in international VFR traffic, by destination and airport, 2000–2007
16%
8%
6%
6%
6%3%5%12%
10%
28% SpainFranceIrelandItalyGermanyPortugal
Other EU15PolandOther EU27Rest of world
Non-EU
EU
0
2
4
6
8
10
12
14
16
EU27 non-EUEstim
ated
gro
wth
in V
FR p
asse
nger
s (m
illio
ns)
Birmingham, Manchester,Heathrow
Bristol, East Midlands,Liverpool, Luton, Stansted,Gatwick
Chapter 2 Page 5September 2009

CAP 787 International Relations – The Growth in Air Travel to Visit Friends or Relatives
2.10 Airports where the growth in VFR has been largely to and from the EU are highlightedin Figure 2.5 – Bristol, East Midlands, Liverpool, Luton, Stansted and Gatwick. Thereare a number of other factors which these airports tend to have in common:
• higher overall levels of international passenger growth (as denoted by the yellowsquares using the right hand axis);
• larger percentage point increases in the proportion of international traffic travellingfor VFR (East Midlands is an exception); and
• little long haul VFR traffic, despite the fact that these data consider the finaldestination of connecting passengers. Gatwick is the obvious exception here. Ofthe Gatwick passengers travelling outside the EU in 2007, over one-third weregoing to the United States. Since the EU-US “Open Skies” agreement came intoeffect in April 2008, many direct US services have moved from Gatwick toHeathrow.
Source: CAA Passenger Survey, 2000–2007, excluding international-to-international connectors.Notes:
• Passenger growth for Liverpool not shown as off the scale (>250%).
• Nearest survey years to 2000 and 2007 used – see footnote 37.
2.11 Table 2.3 summarises the changes illustrated in Figure 2.5 above. By splitting out theincrease in the proportion of passengers travelling for VFR purposes by their finaldestination, the airports where growth in VFR has been dominated by passengers onUK–EU routes can be identified.
Figure 2.5 Proportion of international VFR passengers by destination and airport, 2000, 2003 and 2007
0%
5%
10%
15%
20%
25%
30%
35%
40%
45%
50%
2000
2003
2007
2000
2003
2007
2000
2003
2007
2000
2003
2007
2000
2003
2007
2000
2003
2007
2000
2003
2007
2000
2003
2007
2000
2003
2007
Bristol EastMidlands
Liverpool Luton Stansted Gatwick Birmingham Manchester Heathrow
VFR
pro
porti
on o
f int
erna
tiona
l pas
seng
ers
0%
20%
40%
60%
80%
100%
120%
140%
160%
180%
200%
Estim
ated
gro
wth
in in
tern
atio
nal p
asse
nger
s
EU27 (LH axis) non-EU (LH axis) Total int'l passenger growth (RH axis)
Airports where VFR growth mainly UK-EU
Chapter 2 Page 6September 2009

CAP 787 International Relations – The Growth in Air Travel to Visit Friends or Relatives
Source: CAA Passenger Survey, excluding international-to-international connectors.
No-frills airlines
2.12 The CAA study 'No-frills Carriers: Revolution or Evolution?'41 detailed the rise in no-frills air services with a focus on UK–EU routes. It showed how the route networkserved by no-frills carriers had grown rapidly since the mid-1990s, in particular at UKregional airports, as a result of liberalisation of the EU air transport market. Thisexpansion of no-frills services and the accompanying response of full-service airlineshave broadened route networks and lowered fares across the EU. The effects ofthese changes on the growth of VFR travel is investigated further in Chapter 4.
2.13 The airports identified in paragraph 2.10 are those that tend to be longer establishedand proportionately more significant bases for no-frills airlines. These airports havegenerally seen greater increases in the proportion of international passengerstravelling for VFR purposes, and higher rates of growth of total internationalpassengers.
2.14 Further, the airports identified in Figure 2.5 as having the bulk of their increase in VFRtraffic to and from European destinations are also those where no-frills airlines havegrown rapidly and (Gatwick aside) carry the majority of international passengers. Thiscontrasts with Heathrow, where virtually all passengers are flying on full-serviceairlines, and Manchester and Birmingham, where there is both substantial charter andfull-service traffic, and no-frills operations (although growing) remain a smallerproportion of the overall traffic. Although Gatwick also has a mix of services similar toManchester and Birmingham, its increase in no-frills traffic has been, to some extentat least, at the expense of full-service (and potentially longer-haul) operations.
Table 2.3 Growth in proportion of international VFR passengers by destination and airport, 2000–2007
VFR% of
international
passengers
2000
UK-EU
increase
UK-Non EU
increase
VFR% of
international
passengers
2007
Bristol 11% 19% 2% 31%
East Midlands 6% 7% 1% 13%
Liverpool 22% 18% 0% 40%
Luton 17% 26% 0% 43%
Stansted 30% 15% 1% 46%
Gatwick 19% 8% 1% 28%
Birmingham 14% 6% 5% 24%
Manchester 15% 2% 3% 21%
Heathrow 30% -2% 5% 33%
41. CAP 770 – No-frills Carriers: Revolution or Evolution?, CAA (November 2006).
Chapter 2 Page 7September 2009

CAP 787 International Relations – The Growth in Air Travel to Visit Friends or Relatives
Other airlines
2.15 Alongside no-frills airlines, there has also been some blurring in the business modelsof established airlines seeking to compete in the low-fares market. Some carriers nowprovide seat-only fares42 on charter flights or operate scheduled flights which carry amix of seat-only and inclusive tour passengers. Such airlines tend to concentrate on'sunshine holiday' route networks that cater to the traditional inclusive tour marketbut may also have particular appeal to second-home-generated VFR passengers (asopposed to the economic migrant-type VFR passengers) who are UK residents.
2.16 These airlines tend to be based at airports where, historically, there has been arelatively high proportion of charter traffic. One such airline is Monarch whichoperates a number of key routes from UK airports (Birmingham, Manchester, Gatwickand Luton) to popular second-home destinations in Spain. Another is Thomsonfly withflights to holiday destinations throughout the Mediterranean and further afield.
2.17 A UK-based airline which has explicitly stated43 its intention to appeal to VFR trafficthrough its route network is Flybe. Although most of its traffic is domestic andtherefore outside the scope of this study, Flybe’s international network includesFrench and German regional airports which cater for second-home owners andoverseas UK military respectively. Virtually all of Flybe’s international routes areoperated from UK regional airports.
London airports
2.18 Although UK regional airports have played a key role in changes to the VFR market, interms of size the London airports still underpin the bulk of VFR demand. Internationalterminal passengers have more than doubled at the five London airports from nearly60 million in 1990, to over 120 million in 2007. Stansted and Luton handled a verysmall proportion of international passengers at London airports in 1990 to nearly one-quarter of the total in 2007 (see Figure 2.6).
Source: CAA Airport Statistics.
42. Seat-only refers to the sale of airline tickets only, rather than a full-package holiday including accommodation.43. http://www.flybe.com/investorrelations/today.htm
Figure 2.6 International terminal passengers at London airports, 1990–2007
0
20
40
60
80
100
120
140
1990
1991
1992
1993
1994
1995
1996
1997
1998
1999
2000
2001
2002
2003
2004
2005
2006
2007
Inte
rnat
iona
l ter
min
al p
asse
nger
s (m
illio
ns)
Gatwick Heathrow Stansted Luton London City
Chapter 2 Page 8September 2009

CAP 787 International Relations – The Growth in Air Travel to Visit Friends or Relatives
2.19 Figure 2.7 shows how the proportion of VFR passengers at the London airports haschanged since 2000. Stansted and Luton show the highest proportions of VFRpassengers of the London airports, at over 40%. This proportion has been growing atthe same time as the rapid growth in passengers at the two airports.
Source: CAA Passenger Survey, excluding international-to-international connectors.
2.20 Heathrow has shown little growth in its proportion of VFR traffic between 2000 and2007, whereas Gatwick’s proportion of VFR traffic has grown more, particularlybetween 2003 and 2007. Due to the size of these airports, small changes will have animpact on the London airports’ overall proportion of VFR traffic. Certain long hauldestinations are only directly accessible from these two largest airports.
2.21 Overall, the CAA Passenger Survey estimates that between 2000 and 2007, therewas a 14.5 million increase in the number of international VFR passengers travellingthrough the London airports, bringing the total to 35 million. Around 40% of thisincrease comes from Stansted, the remainder being split between Luton, Heathrowand Gatwick44.
Stansted
2.22 At Stansted, there was an increase of 100% in passengers travelling to and from theUK between 2000 and 2007 (bringing the total to 20 million); virtually all of theincrease came from passengers on scheduled services. Of the 10 million increase ininternational passengers, 6.2 million was accounted for by VFR passengers, half ofwhom were travelling to four countries – Spain, Poland, France and Italy.
2.23 Two-thirds of this 6.2 million increase was from passengers travelling to EU15countries and over one-quarter from passengers to the remaining EU27 countries, forwhich VFR traffic at Stansted has grown from just under 80,000 passengers in 2000to nearly 1.8 million in 2007. Of these 1.8 million, half were travelling between the UKand Poland. Figure 2.8 demonstrates the increasing importance of the more recentlyjoined EU Member States to total VFR traffic at Stansted. There is also some increasein VFR traffic to destinations outside the EU, mainly to Norway, Turkey andSwitzerland.
Figure 2.7 VFR passengers as a proportion of total passengers to and from the UK at the four main London airports, 2000, 2003 and 2007
44. For the purposes of this document, London City airport is not included in the ‘London airport’ totals. This is in partbecause the airport is not surveyed on a continuous basis, but also it is not significant in terms of VFR passengers, (lessthan 500 thousand in 2007).
0%
5%10%
15%
20%
25%30%
35%
40%45%
50%
Stansted Luton Heathrow Gatwick
VFR
pro
port
ion
of in
tern
atio
nal
pass
enge
rs 200020032007
Chapter 2 Page 9September 2009
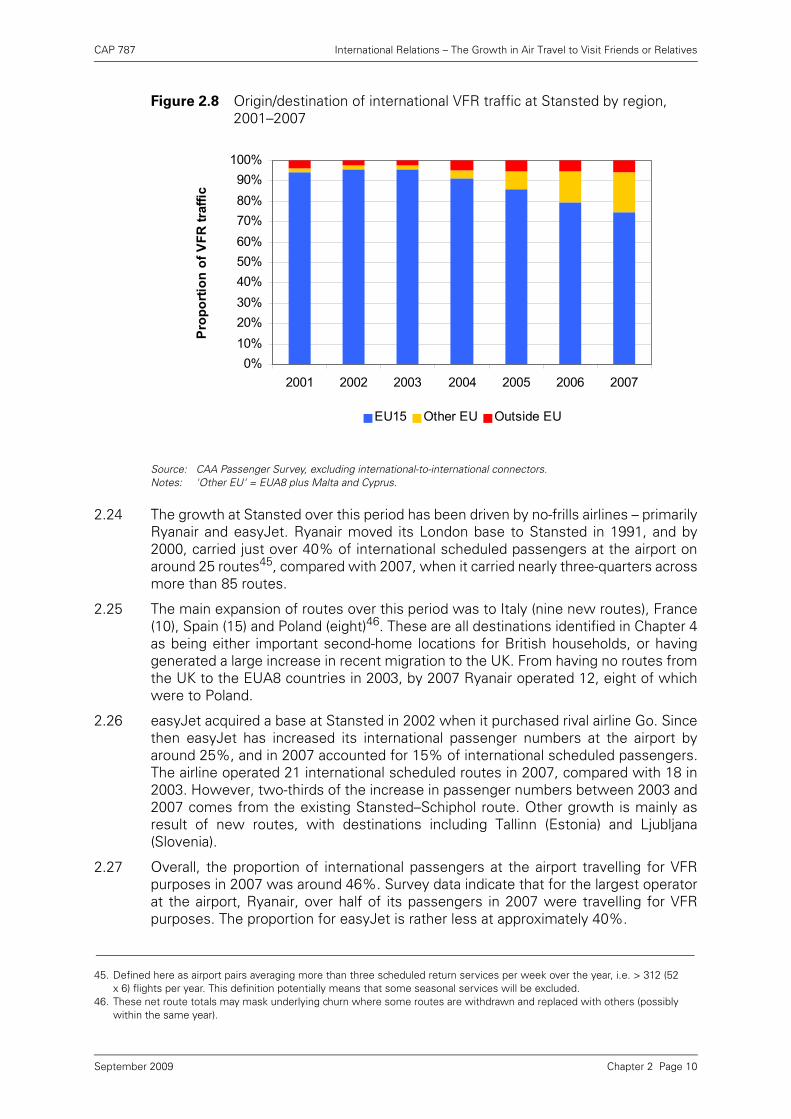
CAP 787 International Relations – The Growth in Air Travel to Visit Friends or Relatives
Source: CAA Passenger Survey, excluding international-to-international connectors.Notes: 'Other EU' = EUA8 plus Malta and Cyprus.
2.24 The growth at Stansted over this period has been driven by no-frills airlines – primarilyRyanair and easyJet. Ryanair moved its London base to Stansted in 1991, and by2000, carried just over 40% of international scheduled passengers at the airport onaround 25 routes45, compared with 2007, when it carried nearly three-quarters acrossmore than 85 routes.
2.25 The main expansion of routes over this period was to Italy (nine new routes), France(10), Spain (15) and Poland (eight)46. These are all destinations identified in Chapter 4as being either important second-home locations for British households, or havinggenerated a large increase in recent migration to the UK. From having no routes fromthe UK to the EUA8 countries in 2003, by 2007 Ryanair operated 12, eight of whichwere to Poland.
2.26 easyJet acquired a base at Stansted in 2002 when it purchased rival airline Go. Sincethen easyJet has increased its international passenger numbers at the airport byaround 25%, and in 2007 accounted for 15% of international scheduled passengers.The airline operated 21 international scheduled routes in 2007, compared with 18 in2003. However, two-thirds of the increase in passenger numbers between 2003 and2007 comes from the existing Stansted–Schiphol route. Other growth is mainly asresult of new routes, with destinations including Tallinn (Estonia) and Ljubljana(Slovenia).
2.27 Overall, the proportion of international passengers at the airport travelling for VFRpurposes in 2007 was around 46%. Survey data indicate that for the largest operatorat the airport, Ryanair, over half of its passengers in 2007 were travelling for VFRpurposes. The proportion for easyJet is rather less at approximately 40%.
Figure 2.8 Origin/destination of international VFR traffic at Stansted by region, 2001–2007
45. Defined here as airport pairs averaging more than three scheduled return services per week over the year, i.e. > 312 (52x 6) flights per year. This definition potentially means that some seasonal services will be excluded.
46. These net route totals may mask underlying churn where some routes are withdrawn and replaced with others (possiblywithin the same year).
0%10%20%30%40%50%60%70%80%90%
100%
2001 2002 2003 2004 2005 2006 2007
Pro
porti
on o
f VFR
traf
fic
EU15 Other EU Outside EU
Chapter 2 Page 10September 2009
CAP 787 International Relations – The Growth in Air Travel to Visit Friends or Relatives
Luton
2.28 At Luton, passengers flying to and from the UK have risen from 3.8 million in 2000 to8.1 million in 2007. This compares with an increase in VFR passengers of 2.8 millionto 3.5 million – one-quarter of which relates to Poland alone, and a further quarter toSpain and Ireland. As with Stansted, Luton has grown rapidly as no-frills operationshave expanded at the airport whilst charter services have contracted. In 2000, 30%of international traffic was on charter services. By 2007, this had fallen by 0.7 millionto 8%.
2.29 The total number of passengers travelling from the airport to Spain was over 2 millionin 2007 and represented around one-quarter of all international passengers. Althoughpassenger numbers were higher, this is a fall in proportion from 2000 when UK–Spaintraffic was over 40% of the airport’s total international traffic. However, over thissame period, the proportion of UK–Spain traffic travelling for VFR purposes has risenfrom just over 10% to nearly 30%.
2.30 In 2000 there were no services between Luton and Poland, however, by 2007 thesepassengers made up more than 10% of total international passengers at the airport,and of these passengers, the proportion travelling for VFR purposes was over 70%.
2.31 easyJet first commenced international services at the airport in 1996 and, by 2000,carried over three-quarters of international scheduled traffic at Luton. Since then,despite a continued increase in passenger numbers, the proportion has fallen toaround half of the airport’s international scheduled passengers due to increasedpassenger numbers on other airlines. In 2000, easyJet served 10 international routesfrom Luton; by 2007 this had risen to 24. New routes included three to Germany, andtwo each to Italy, France, Portugal and Poland.
2.32 Ryanair and Wizzair also have significant operations at Luton airport, carrying one-thirdof international scheduled passengers between them in 2007. Wizzair is a no-frillsairline based in Hungary, with the stated aim “…to make flying affordable to thecitizens of Central and Eastern Europe, as well as to provide a new travel experienceto all travellers in the EU”47. The airline commenced operations in 2004 at Katowice,and shortly afterwards began operations at Luton. By 2007, the airline carried 14% ofinternational scheduled passengers at Luton airport, with routes focused on EasternEurope, including four to Poland.
2.33 Ryanair carried around 10% of international scheduled passengers at the airport at thestart of the decade (when Luton–Dublin was its only route, having moved its base toStansted some years previously). There was a net increase of nine new routesbetween 2000 and 2007, (including three to Spain and two to Italy) and by 2007Ryanair carried nearly one-fifth of international scheduled passengers. Ryanair’s routenetwork at Luton is less extensive than at Stansted, although in 2008 six newinternational routes from Luton were announced including two to Poland and one toLithuania.
2.34 With a route network concentrated on holiday destinations in Spain and Portugal,Monarch is another significant airline at the airport, accounting for nearly 10% of theinternational scheduled passengers in 2007. In 2000, over one-third of Monarch’spassengers from Luton were travelling on charter services; by 2007 virtually all wereon scheduled services. In total, Monarch carried nearly 20% more passengers fromLuton in 2007 compared with 2000. As demonstrated in Chapter 4 these destinationsare popular locations for second-homes owned by British households.
47. http://wizzair.com/about_us/company_information/
Chapter 2 Page 11September 2009

CAP 787 International Relations – The Growth in Air Travel to Visit Friends or Relatives
2.35 The proportions of passengers travelling for VFR purposes on Ryanair and easyJet atLuton are similar to those at Stansted – over 50% for Ryanair and around 40% foreasyJet. Wizzair stands out as having a particularly high proportion of VFR traffic atnearly 70%. Monarch’s scheduled services carry approximately one-third of itspassengers for VFR purposes compared with only 10% of passengers on (all) charterservices at the airport.
Heathrow
2.36 Although total international passenger numbers at Heathrow and Gatwick have notchanged dramatically in recent years, this masks underlying significant changes totheir route networks.
2.37 Since 2000, the proportion of international traffic at Heathrow travelling todestinations outside of the (current) EU member states has fallen from 46% to under40% in 2007, continuing a trend in evidence since the early 1990s. Over the period2000 to 2007, British Airways (BA) has consistently remained the largest singlecarrier, with approximately 40% of international passengers. Of these, the proportiontravelling to EU destinations has fallen, similar to that for the airport as a whole.
2.38 There are a number of full-service carriers whose route networks are concentrated onEU or geographical European destinations – for instance, bmi with traffic to Ireland,Netherlands and Belgium, and Lufthansa serving the UK–Germany market. However,the single most popular destination from Heathrow (across all airlines) is New YorkCity.
2.39 Between 2000 and 2007, whilst VFR passengers travelling to and from the UK at theairport have increased by 2 million, the total number of passengers for all purposeshas increased by 1.4 million. The number travelling for holiday purposes has fallen by600 thousand, offsetting the increase in VFR passengers.
2.40 The increase in VFR passengers to destinations outside the EU of 2.5 million issimilarly offset by a decrease in the number of UK–EU VFR passengers of 500thousand. The five destinations with the largest increases in VFR traffic at Heathrowaccounted for over a million new passengers between 2000 and 2007 – India, UnitedArab Emirates, Canada, New Zealand and the United States.
2.41 In 2007, BA’s proportion of VFR passengers at Heathrow was just over one-quarter,less than the average proportion of VFR passengers travelling to and from the UK atthe airport in 2007, which was around one-third.
Gatwick
2.42 Gatwick has shown something of a reversal of the pattern seen at Heathrow, with theproportion of UK–EU international scheduled traffic rising from 44% in 2000 to 60%in 2007. Whereas virtually all the airlines serving Heathrow are full-service, Gatwickhas a substantial element of no-frills and charter traffic – 38% of internationalpassengers in 2000 travelled on charter flights, falling to 27% in 2007. Within thistotal, an increasing proportion of the charter traffic is travelling to destinations outsidethe EU.
2.43 As at Heathrow, BA has had a consistently significant presence at the airport, servingaround one-quarter of international scheduled passengers each year over the period2000 to 2007. However, easyJet started international services at the airport in 2001with its Gatwick–Barcelona route. In 2002 easyJet was the second largest airline atthe airport and by 2007, the airline was serving almost as many passengers as BA.With the acquisition of GB Airways in 2008, easyJet became the largest airline at the
Chapter 2 Page 12September 2009

CAP 787 International Relations – The Growth in Air Travel to Visit Friends or Relatives
airport, serving over one-third of international passengers. Whereas virtually all BApassengers from the airport were travelling to destinations outside the EU, theopposite was true for GB Airways and easyJet.
2.44 Between 2000 and 2007, the number of passengers travelling to and from the UK atGatwick rose by 5 million to nearly 29 million. Of this increase, over 70% related topassengers travelling for VFR purposes, over half of whom were travelling to EU15countries. The largest increases were Spain with 800 thousand new VFR passengers,Italy with 300 thousand and France, Ireland, Portugal and the Netherlands with 200thousand each.
2.45 The remainder of the EU accounted for a further 500 thousand increase, of which 200thousand passengers were travelling to Poland. Outside the EU, there were alsoincreases, with 800 thousand more passengers travelling for VFR purposes in 2007than 2000 (of whom one-third were visiting Canada).
2.46 In 2007, only 6% of passengers on charter flights from Gatwick travelled for VFRpurposes. This compares with 36% on scheduled flights. Survey data indicate thatthis proportion is rather higher for easyJet passengers (around 40%) than it is for BA(around 30%). easyJet’s proportion is similar to that seen, by the airline, bothStansted and Luton.
Regional airports
2.47 The increase in international terminal passengers at UK airports in recent years hasbeen particularly significant at regional airports, where passenger numbers increasedby 257% between 1990 and 2007, compared with growth of 113% at the Londonairports over the same period. The proportion of international passengers flying fromregional airports has consequently increased from just under one-quarter in 1990 toover one-third in 2007.
2.48 A CAA study in 200548, which was updated in 200749, looked at the underlyingreasons for the substantial growth of regional air services. It concluded that thisgrowth could be attributed to the liberalisation of EU air services and the resultingemergence of no-frills airlines looking for opportunities for rapid expansion, which, inturn, unlocked latent demand from passengers keen to travel from their local airport.At the same time, regional airports adopted a more commercial approach, activelyseeking to attract airlines and develop a network of services. The update in 2007found that, although there had been some slowdown in growth, there was increasingcompetition between regional airports, strong competition between airlines usingthem and changes in travel patterns as passengers to and from points outside Londonused regional airports rather than travelling via London.
48. CAP 754 – UK Regional Air Services: A Study by the Civil Aviation Authority, CAA (February 2005).49. CAP 775 – Air Services at UK Regional Airports: An Update on Developments, CAA (November 2007).
Chapter 2 Page 13September 2009

CAP 787 International Relations – The Growth in Air Travel to Visit Friends or Relatives
Source: International Passenger Survey, ONS.
Note:• Proportions based on total passengers subject to exclusions per footnote 30.
• There is a discontinuity in the IPS time-series in 199950.
2.49 IPS data indicate that the proportion of international passengers travelling for VFRacross all UK airports has increased steadily since 200051. Figure 2.9 shows that since2002, the rate of increase in the proportion of VFR traffic is noticeably higher at theregional airports, albeit from a lower base. Over the last three years, the regionalairports’ growth rate has been around ten percentage points higher than that for theLondon airports. Figure 2.10 shows the relative rolling annual growth rates52 in moredetail for the period 2001–2007.
Figure 2.9 VFR proportion of international passengers at UK airports, 1994–2007
50. In 1999 the IPS commenced interviewing on air and sea routes between the UK and the Irish Republic. For the years upto and including 1998, estimates of visitor numbers between the UK and the Irish Republic and their characteristics werebased on data provided by other sources.
51. As noted previously (paragraph 1.10), the IPS tends to record a lower proportion of VFR passengers than the CAAPassenger Survey.
52. For example, rolling annual growth at Q3 2007 is the growth in the total traffic for the preceding year (Q4 2006–Q3 2007)compared with the equivalent period in the previous year (Q4 2005–Q3 2006).
0%
5%
10%
15%
20%
25%
1994 1995 1996 1997 1998 1999 2000 2001 2002 2003 2004 2005 2006 2007
VFR
pro
port
ion
of in
tern
atio
nal p
asse
nger
s
London airports Regional airports
Chapter 2 Page 14September 2009

CAP 787 International Relations – The Growth in Air Travel to Visit Friends or Relatives
Source: International Passenger Survey, ONS.
2.50 In order to understand better how development of regional airports has affected andbeen affected by the growth in VFR travel, two airport case studies for Bristol andBirmingham have been undertaken.
Case Study A: Bristol airport
Summary
• Total international passengers at Bristol have grown from 1.7 million in 2000 to 4.6million in 2007. Alongside this rapid growth, survey data indicate that theproportion travelling for VFR has increased from 11% in 2000 to 31% in 200753.
• Bristol has seen a rapid growth of no-frills operations at the airport since the late1990s, with easyJet carrying nearly half of all international traffic in 2007.
• Charter traffic has remained at broadly the same level (1.3 million internationalpassengers) since 2002, therefore representing a declining proportion of overalltraffic. Over the period 2000 to 2007, the proportion of international passengers oncharter flights has fallen from two-thirds to less than one-third.
• VFR traffic as a proportion of total international traffic has risen as scheduledservices have increased in significance at the airport.
• The proportion of VFR traffic on scheduled flights has also increased.
• EU15 destinations account for nearly 75% of the increase in scheduled traffic.
• Poland stands out as the route with the highest proportion of VFR traffic.
Figure 2.10 Rolling annual growth of international VFR traffic at London and regional airports, 2001–2007
53. The airport was not surveyed in 2007, so provisional survey data from the period January–June 2008 were used andscaled to actual 2007 airport numbers.
0%
5%
10%
15%
20%
25%
30%
Q1 200
1
Q3 2001
Q1 200
2
Q3 200
2
Q1 200
3
Q3 200
3
Q1 2004
Q3 2004
Q1 2005
Q3 200
5
Q1 200
6
Q3 2006
Q1 2007
Q3 2007
Growth in London airports VFR Growth in regional airports VFR
Chapter 2 Page 15September 2009

CAP 787 International Relations – The Growth in Air Travel to Visit Friends or Relatives
Location within the UK
2.51 The city of Bristol (Unitary Authority) has a population of 0.4m54 and falls within theSouth West planning region, which has a population of 5.2 million (8% of the UKtotal). The city has good road links to Wales, West London, the Midlands, and furtherSouth West. Regular rail services also operate to these areas.
2.52 Given the city’s location and transport links, the journey to London Heathrow fromBristol is relatively straightforward and, historically, passengers from the area haveused Heathrow, particularly for long haul travel. The two nearest alternative airportsare Cardiff and Exeter.
Industry
2.53 Bristol is located on the Severn Estuary, and historically the port has been animportant part of the city’s economy, although less so now.
2.54 The aerospace industry has grown over the years and is a major part of the localeconomy with Airbus and Rolls-Royce both having significant bases there. Otherimportant sectors of the local economy are financial services (Lloyds TSB) and the hi-tech sector (Hewlett-Packard research).
2.55 The city was the UK's seventh most popular destination for foreign tourists in 2007,with 470 thousand visitors spending at least one night there according to theInternational Passenger Survey.55
Residents
2.56 The Resident Population Estimates by Ethnic Group produced by the ONS indicatethat, as at June 2006, 16% of the population of Bristol56 are not of white British ethnicbackground. The most significant groups within this are white non-British (5%),followed by Indian (2%), Pakistani (1%), Black African (1%) and Black Caribbean (1%).These estimates are broadly similar to those for England overall.
2.57 Many of these residents will be descendants of previous generations of immigrantsto the city, and, although born in the UK, may have family links outside the UK. TheCensus data show that in 2001, 8% of Bristol’s population was born outside the UK.
2.58 The South West Regional Assembly response to the Migration Impacts ForumConsultation indicates that, since the 2001 Census took place, the enlargement of theEU in 2004 has led to significant inward migration to the region, and particularly tourban Bristol57.
54. All population figures are based on the Office for National Statistics mid-2007 estimates.55. www.visitbritain.com 56. City of Bristol Unitary Authority.57. ‘South West Response to Migration Impacts Forum Consultation’ – South West Regional Co-ordination Board for
Migration & South West Local Government Association 2007. This is a response by the Strategic Migration partnership tothe MIF survey on the benefits and challenges of migration at regional and local level (www.southwest-ra.gov.uk).
Chapter 2 Page 16September 2009
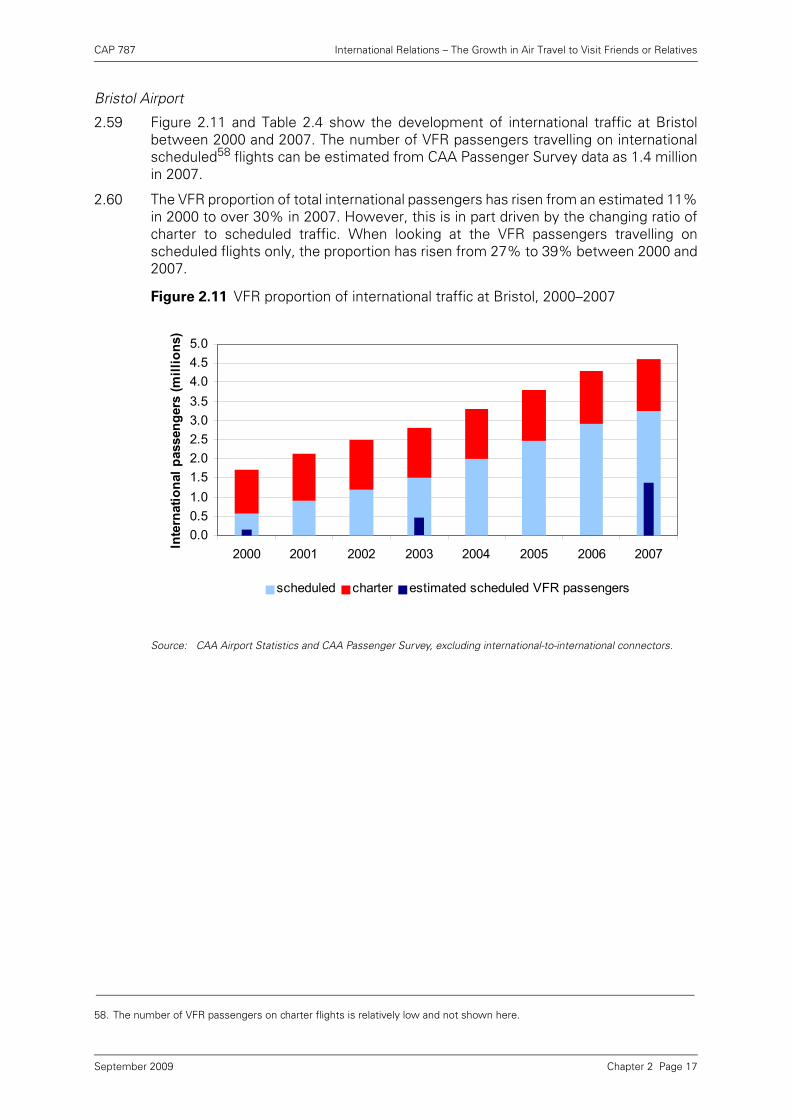
CAP 787 International Relations – The Growth in Air Travel to Visit Friends or Relatives
Bristol Airport
2.59 Figure 2.11 and Table 2.4 show the development of international traffic at Bristolbetween 2000 and 2007. The number of VFR passengers travelling on internationalscheduled58 flights can be estimated from CAA Passenger Survey data as 1.4 millionin 2007.
2.60 The VFR proportion of total international passengers has risen from an estimated 11%in 2000 to over 30% in 2007. However, this is in part driven by the changing ratio ofcharter to scheduled traffic. When looking at the VFR passengers travelling onscheduled flights only, the proportion has risen from 27% to 39% between 2000 and2007.
Source: CAA Airport Statistics and CAA Passenger Survey, excluding international-to-international connectors.
58. The number of VFR passengers on charter flights is relatively low and not shown here.
Figure 2.11 VFR proportion of international traffic at Bristol, 2000–2007
0.00.51.01.52.02.53.03.54.04.55.0
2000 2001 2002 2003 2004 2005 2006 2007
Inte
rnat
iona
l pas
seng
ers
(mill
ions
)
scheduled charter estimated scheduled VFR passengers
Chapter 2 Page 17September 2009
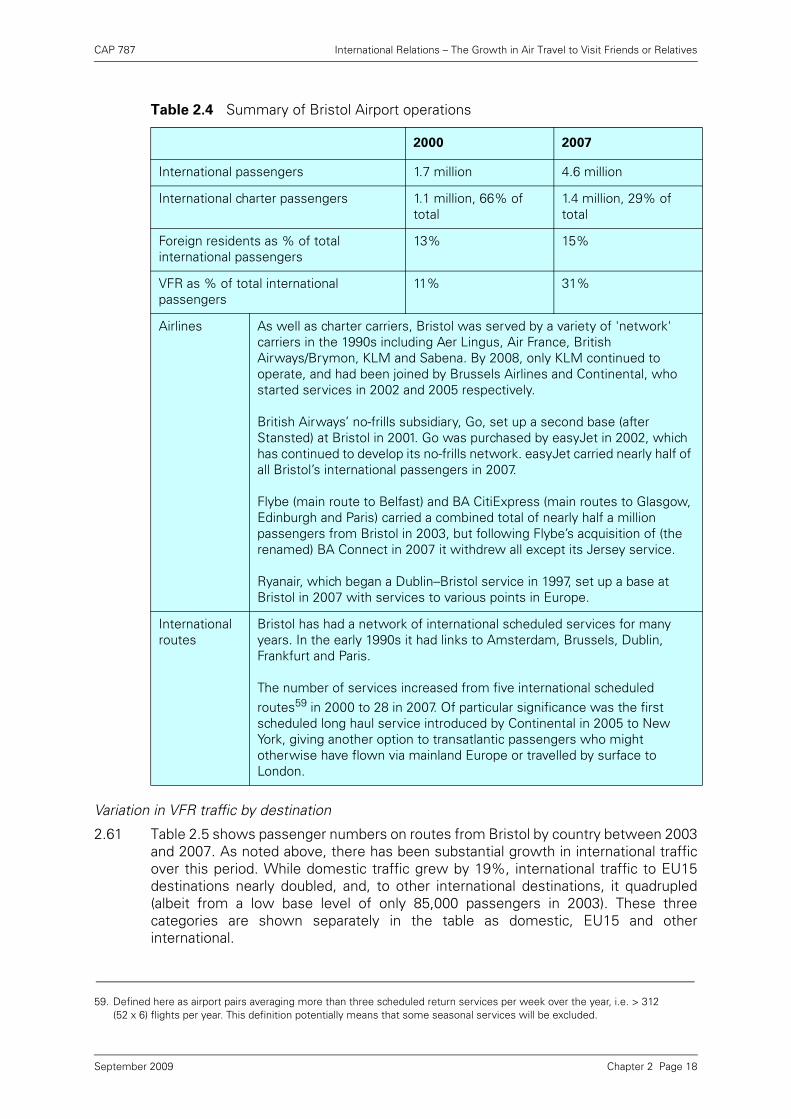
CAP 787 International Relations – The Growth in Air Travel to Visit Friends or Relatives
59
Variation in VFR traffic by destination
2.61 Table 2.5 shows passenger numbers on routes from Bristol by country between 2003and 2007. As noted above, there has been substantial growth in international trafficover this period. While domestic traffic grew by 19%, international traffic to EU15destinations nearly doubled, and, to other international destinations, it quadrupled(albeit from a low base level of only 85,000 passengers in 2003). These threecategories are shown separately in the table as domestic, EU15 and otherinternational.
Table 2.4 Summary of Bristol Airport operations
2000 2007
International passengers 1.7 million 4.6 million
International charter passengers 1.1 million, 66% of total
1.4 million, 29% of total
Foreign residents as % of total international passengers
13% 15%
VFR as % of total international passengers
11% 31%
Airlines As well as charter carriers, Bristol was served by a variety of 'network' carriers in the 1990s including Aer Lingus, Air France, British Airways/Brymon, KLM and Sabena. By 2008, only KLM continued to operate, and had been joined by Brussels Airlines and Continental, who started services in 2002 and 2005 respectively.
British Airways’ no-frills subsidiary, Go, set up a second base (after Stansted) at Bristol in 2001. Go was purchased by easyJet in 2002, which has continued to develop its no-frills network. easyJet carried nearly half of all Bristol’s international passengers in 2007.
Flybe (main route to Belfast) and BA CitiExpress (main routes to Glasgow, Edinburgh and Paris) carried a combined total of nearly half a million passengers from Bristol in 2003, but following Flybe’s acquisition of (the renamed) BA Connect in 2007 it withdrew all except its Jersey service.
Ryanair, which began a Dublin–Bristol service in 1997, set up a base at Bristol in 2007 with services to various points in Europe.
International routes
Bristol has had a network of international scheduled services for many years. In the early 1990s it had links to Amsterdam, Brussels, Dublin, Frankfurt and Paris.
The number of services increased from five international scheduled routes59 in 2000 to 28 in 2007. Of particular significance was the first scheduled long haul service introduced by Continental in 2005 to New York, giving another option to transatlantic passengers who might otherwise have flown via mainland Europe or travelled by surface to London.
59. Defined here as airport pairs averaging more than three scheduled return services per week over the year, i.e. > 312 (52 x 6) flights per year. This definition potentially means that some seasonal services will be excluded.
Chapter 2 Page 18September 2009

CAP 787 International Relations – The Growth in Air Travel to Visit Friends or Relatives
2.62 EU15 scheduled traffic (excluding UK domestic) has increased in importance – from37% of total traffic in 2003 to 47% in 2007 – such that these routes have contributednearly 70% of overall traffic growth at the airport over this period. Other internationalroutes are identified individually where the survey sample was sufficient to estimatethe proportion of VFR passengers on the route.
2.63 The table highlights countries with a high (greater than 40%) proportion of VFR traffic.Of those countries shown individually, the highest international VFR proportions areon Poland, France and Ireland routes. Most of the non-EU15 destinations include ahigh proportion of VFR traffic. The growth is split approximately three ways – the eightEU accession countries (EUA8), USA and Switzerland. The Czech Republic stands outas having a lower VFR proportion than the other EUA8 countries.
Source: CAA Airport Statistics, passenger related data; CAA Passenger Survey, excluding international-to-international connectors.
Notes:• Countries where less than 100 scheduled passenger interviews were obtained on the route are
amalgamated within ‘other’.• VFR proportions are estimated of scheduled passengers only with a final destination of the route identified.• VFR proportions are highlighted where greater than 40%.
2.64 Passengers flying out of Bristol may be connecting on to a further flight at theirimmediate destination. Newark and Amsterdam are the most significant routes forconnecting passengers, with over one-third of passengers on both routes connectingonwards.
Table 2.5 Passenger traffic on routes from Bristol Airport
Terminal passengers (000's) change growthVFR
%
2003 2005 2007 2003-2007 2003-2007 2008
Domestic 1,072 1,400 1,275 203 19% 44%
Spain 517 748 930 414 80% 32%
France 214 285 472 259 121% 43%
Ireland 264 317 487 223 84% 43%
Italy 82 226 299 217 263% 30%
Netherlands 161 265 282 121 75% 28%
Other EU15 182 295 305 124 68% 31%
Total EU15 (excluding UK) 1,420 2,136 2,776 1,357 96% 35%
Switzerland 0 110 144 144 32%
Poland 0 0 101 101 90%
United States 0 55 93 93 35%
Czech Republic 85 94 99 14 16% 27%
Others 0 92 41 41 34%
Total other international 85 351 478 392 34%
Scheduled total 2,577 3,887 4,529 1,952 76% 40%
Charter total 1,310 1,312 1,355 45 3% 3%
Grand total 3,887 5,199 5,884 1,997 51% 33%
Chapter 2 Page 19September 2009

CAP 787 International Relations – The Growth in Air Travel to Visit Friends or Relatives
Case Study B: Birmingham airport
Summary
• Total international passengers at Birmingham have grown relatively slowly from6.3 million in 2000 to 7.6 million in 2007. Alongside this growth, survey dataindicate that the estimated proportion travelling for VFR has increased from 14%in 2000 to 24% in 200760. Over the same period, the proportion of internationalpassengers on charter flights has fallen from 45% to just under one-third (a similarproportion in 2007 to Bristol).
• Between 2000 and 2007, there has been a decline of 14% in the number of charterpassengers using Birmingham airport.
• Over half of all international passengers in 2007 were travelling to and from EU15destinations.
• Around one-third of scheduled traffic in 2007 travelling directly to destinationsoutside the EU15 countries was travelling to Dubai, reflecting its development asa hub airport.
• Birmingham has a wide range of airlines and airline types using the airport.
Location within the UK
2.65 The city of Birmingham has a population of 1.0 million61. It forms part of the largerWest Midlands conurbation, which has a population of 2.6 million, and includesseveral neighbouring towns and cities such as Solihull, Wolverhampton and thetowns of the Black Country.
2.66 The city is located centrally within the UK with good road links. The West Coast MainLine links rail services between London, the North West and Scotland, passingthrough Birmingham and Coventry.
Industry
2.67 Historically, employment in the West Midlands was dominated by manufacturing,particularly the automotive industry. Over the last 30 years, the service sector hasgrown substantially, although manufacturing remains an important element in thelocal economy, accounting for 17.4% of the city’s employment according to the 2001Census. The region has also proved successful in attracting foreign directinvestment62.
2.68 There are a number of universities and higher education establishments in the area –the West Midlands is the fourth most popular region for overseas students studyingin the UK63.
2.69 Tourism is also an increasingly important part of the local economy. It was the fifthmost visited city by foreign tourists in the UK, as estimated by the 2007 InternationalPassenger Survey, with 700 thousand foreign visitors spending at least one nightthere64.
60. The airport was not surveyed in 2007, so survey data from the year 2006 were used and scaled to actual 2007 airportnumbers.
61. All population figures are based on the ONS mid-2007 estimates.62. www.birminghampost.net, ‘Foreign Investment in West Midlands rises 10%’, 9 June 2008.63. www.guardian.co.uk, ‘So, What’s the Attraction?’, 20 May 2008.64. www.visitbritain.com
Chapter 2 Page 20September 2009

CAP 787 International Relations – The Growth in Air Travel to Visit Friends or Relatives
Residents
2.70 ONS data65 provide similar estimates at June 2006 to those obtained from the 2001Census. These indicate that 37% of the population of the Birmingham MetropolitanArea are not of white British ethnic background. The most significant groups withinthis are Pakistani (11%), Indian (6%), Black Caribbean (5%) and Irish (3%).
2.71 Many of these residents will be descendants of previous generations of immigrantsto the city, and, although born in the UK, may have family links outside the UK. TheCensus data show that in 2001, 17% of the city’s population was born outside the UK.
History of immigration
2.72 In the 1950s and 1960s, Birmingham became one of the UK’s most multi-culturalcities, seeing a major inflow of immigrants from the Commonwealth, particularly fromSouthern Asia and the Caribbean. There was also substantial immigration to the cityfrom Ireland around this time. In more recent years immigration has increasedsignificantly from the EUA8 countries.
2.73 A recent (November 2007) publication by the West Midlands Regional Observatory(WMRO) looks at the economic impact of migrant workers in the region66. This studyfound (using the ONS Labour Force Survey) that:
• there were 122,000 non-UK nationals in employment in the West Midlands regionin summer 2006, representing 4.9% of total employment, of whom 86,000 hadentered the UK since 1991 and 54,000 had entered since 200167;
• the number of migrant workers in the West Midlands region has increasedmarkedly in recent years;
• recent migrants are on the whole relatively young and in employment; and
• the West Midlands has slightly more migrant workers from EUA8 countries andNew Commonwealth countries than the UK average, and fewer migrants fromEU15 countries and the Old Commonwealth. The EUA8 countries have replacedthe New Commonwealth as the largest source of new labour migrants in recentyears.
2.74 Table 2.6 shows data collated by the WMRO study on the National Insurance numberregistrations of overseas nationals in the West Midlands region to help identifychanges to migratory flows. This indicates that, although there is continued migrationfrom India and Pakistan, the recent increase in the number of Polish nationals seekingwork in the region had led to this migratory flow becoming by far the largest in 2006/7.Analysis of survey data indicates both India and Poland have a very high proportion ofVFR traffic on air routes (see Table 2.8).
65. ONS – Resident Population Estimates by Ethnic Group.66. ‘The Economic Impact of Migrant Workers in the West Midlands’, West Midlands Regional Observatory, November 2007.67. These are likely to be minimum estimates given that some of the most mobile groups of the population tend to be
missed by the Labour Force Survey, which is what the study used.
Chapter 2 Page 21September 2009

CAP 787 International Relations – The Growth in Air Travel to Visit Friends or Relatives
Source: West Midlands Regional Observatory.Note: The five largest national groups are shown for each year.
Birmingham Airport
2.75 Figure 2.12 and Table 2.7 show the development of international traffic atBirmingham between 2000 and 2007. The number of VFR passengers travelling oninternational scheduled flights is estimated from CAA Passenger Survey data.
Source: CAA Airport Statistics and CAA Passenger Survey, excluding international-to-international connectors.
Table 2.6 NI number registrations by foreign nationals in West Midlands region, 2002/3, 2004/5 and 2006/7
Country 2002/03 % Country 2004/05 % Country 2006/07 %
India 2,640 11.3 Poland 4,180 14.9 Poland 18,630 38.8
Pakistan 2,550 10.9 India 2,890 10.3 India 4,130 8.6
Iraq 1,900 8.1 Pakistan 2,410 8.6 Pakistan 3,020 6.3
Zimbabwe 1,130 4.8 China 1,030 3.7 Slovakia 2,820 5.9
Afghanistan 1,040 4.4 S Africa 850 3.0 Latvia 1,080 2.2
Total 23,400 100 Total 28,100 100 Total 48,030 100
Figure 2.12 VFR proportion of international traffic at Birmingham, 1999–2007
01
234
567
89
1999 2000 2001 2002 2003 2004 2005 2006 2007
Inte
rnat
iona
l pas
seng
ers
(mill
ions
)
scheduled charter estimated scheduled VFR passengers
Chapter 2 Page 22September 2009

CAP 787 International Relations – The Growth in Air Travel to Visit Friends or Relatives
68
Table 2.7 Summary of Birmingham Airport operations
2000 2007
International passengers 6.3 million 7.6 million
International charter passengers 2.9 million, 46% of total 2.5 million, 33% of total
Foreign residents as % of total
international passengers
19% 20%
VFR as % of total international
passengers
14% 24%
Airlines Birmingham has had a strong charter presence for many years, as well as full-service scheduled services, including some long haul services. The main charter destination is Spain (including the Canary Islands) with more than one million passengers in 2007 – 42% of all charter traffic. More recently, the amount of no-frills traffic has substantially increased creating a mix of no-frills and full-service airlines with no single dominant carrier. The two biggest international operators in 2007 were bmibaby (which began services in 2005) and Monarch (which, as part of a wider shift from charter services, began services on a scheduled basis the same year). Together these two airlines accounted for one-third of international scheduled passengers in 2007. Flybe also has a significant presence at the airport, although the majority of its passengers are domestic. However, following its acquisition of BA Connect, Flybe added a number of major European cities to its long-established domestic network. Ryanair opened a new base in summer 2008, initially with two aircraft serving 20 routes, and plans eventually to base 10 aircraft by 2013.
Routes In 2007 there were around 40 international scheduled routes68 flown from the airport, compared with 29 in 2000. Approximately 80% of scheduled passengers are flying to EU15 countries (and of these nearly 50% are travelling to Spain or Ireland). However, there is a fast-growing market in services outside the EU15. The biggest long haul operator in 2007 was Emirates, which currently serves its Dubai hub twice daily. Between 2003 and 2007, passenger numbers on the route grew by 125% to represent 7% of international scheduled passengers. Survey data show nearly three-quarters of passengers are connecting at Dubai for onward travel to a different destination, most commonly Australia.Another big market, although not showing the same growth rate, is the USA. This market is similar in size to the combined passenger numbers for India and Pakistan – which have been growing in recent years, albeit at a slower rate than that to Dubai.Certain routes appear to reflect the migratory trends in the area – the Irish market is very important; although much smaller in terms of passenger numbers, there has been growth in the services to Southern Asia; and the new Ryanair routes include a number of Eastern European destinations.
68. Defined here as airport pairs averaging more than three scheduled return services per week over the year, i.e. > 312 (52x 6) flights per year. This definition potentially means that some seasonal services will be excluded.
Chapter 2 Page 23September 2009

CAP 787 International Relations – The Growth in Air Travel to Visit Friends or Relatives
Variation in VFR traffic by destination
2.76 Table 2.8 shows passenger numbers on routes from Birmingham by country between2003 and 2007, grouped into domestic, EU15 and other international routes. CAAPassenger Survey data have been used to indicate which routes are particularlyimportant for VFR traffic.
2.77 As noted above, there has been only modest overall growth in traffic over this period,although medium and long haul services have been growing relatively quickly. Thestrong growth in scheduled traffic to Spain and Portugal illustrates a trend for trafficto shift from charter to scheduled flights (charter traffic to these destinations hasdeclined by a similar amount). Scheduled traffic to some other EU countries (such asDenmark and Italy) has actually declined significantly.
2.78 For VFR passengers, particularly those travelling to longer-haul destinations, are morelikely to find routes operated on lower frequencies (such as twice per week) attractivethan are business or holiday passengers. This is because VFR passengers may haveless need to co-ordinate flights with, for example, accommodation bookings orbusiness meetings.
2.79 Regardless of the charter decline and resultant shift to scheduled services, theabsolute growth in scheduled passenger numbers between 2003 and 2007 can bebroadly characterised as one-sixth domestic traffic, one-third EU15 traffic with theremainder being other international destinations.
2.80 The table highlights countries with a high proportion of VFR traffic (greater than 40%).Of the countries shown individually, the highest VFR proportions are on the longer-haul routes and Poland:
• United Arab Emirates – the CAA Passenger Survey indicates that a third ofpassengers with a final destination of Dubai are travelling on VFR. However, theVFR proportion for the route is rather higher, as Dubai is also an important hub forpassengers travelling on connecting flights to points beyond, particularlyAustralasia and South East Asia. CAA Passenger Survey data show the proportionof VFR traffic for passengers connecting at Dubai to be nearly three-quarters.
• India – historical ties with the region along with ongoing immigration to the UKshow how established migrant communities and their descendants can potentiallyact as a reservoir of demand for long haul routes carrying relatively high proportionsof VFR passengers. The table shows passenger numbers on direct routes,although, since autumn 2008 Air India has suspended its scheduled services(reported as a temporary move to protect its slots at Heathrow69, and a plannedreplacement – a joint venture between Monarch and Bilga Air has not yetcommenced operations70. CAA Passenger Survey data indicated that in 2006 Indiawas the joint most popular final destination (alongside the United States) forpassengers travelling from Birmingham via a non-UK hub. Popular indirect routesincluded travel via Turkmenistan and Dubai. In the absence of direct services, it islikely that the number of passengers travelling indirectly will increase.
• Poland – rapid immigration from Poland to the West Midlands region appears to begenerating increased demand.
• Within the total of 'others' where sample size is too small to estimate the VFRproportion, there are destinations such as Pakistan, Turkmenistan and Uzbekistan– all of which the airport’s own survey indicate to have a high proportion of VFRtraffic (some of which is likely to be travelling onward to final destinations).
69. http://news.bbc.co.uk/1/hi/england/west_midlands/7609396.stm, BBC, 10 September 2008.70. Birmingham Airport press release, 17 September 2008.
Chapter 2 Page 24September 2009

CAP 787 International Relations – The Growth in Air Travel to Visit Friends or Relatives
Source: CAA Airport Statistics, passenger related data; CAA Passenger Survey, excluding international-to-international connectors.
Notes:• Countries where less than 100 scheduled passenger interviews were obtained on the route are
amalgamated within ‘other’.• VFR proportions are estimated of scheduled passengers only with a final destination of the route identified.
Thus those passengers connecting at Dubai, say, to go on to Australia to visit family would not be included in the calculation of the VFR proportion for Dubai – only those passengers finishing their journey in Dubai would count.
• VFR proportions are highlighted where greater than 40%.
2.81 Approximately 20% of all the passengers on international scheduled flights areconnecting at their immediate destination on to another flight. This proportion isslightly higher for VFR passengers, with 25% connecting. Destinations where a highproportion of total traffic connects on to another flight are Dubai (70%), Newark (64%)and Amsterdam (46%). If VFR traffic only is considered, the proportion of passengerstravelling on these routes in order to connect to another flight is approximately ninepercentage points higher, on all three named routes.
Table 2.8 Passenger traffic on routes from Birmingham Airport
Terminal passengers (000's) change growth VFR %
2003 2005 2007 2003-2007 2003-2007 2006
Domestic 1,406 1,514 1,541 135 10% 31%
Spain 692 1,131 1,016 324 47% 24%
Netherlands 406 428 473 67 16% 26%
Ireland 755 716 802 48 6% 48%
Belgium 166 150 160 -6 -4% 20%
France 565 621 540 -26 -5% 25%
Germany 716 659 689 -27 -4% 29%
Denmark 135 110 89 -46 -34% 38%
Italy 188 146 76 -111 -59% 8%
Others 324 306 250 -74 -23%
Total EU15 (excluding UK) 3,759 4,119 4,018 258 7% 30%
United Arab Emirates 165 231 370 205 124% 32%
Poland 52 52
India 20 39 39 88%
Canada 10 32 39 29 304% 49%
Czech Republic 47 145 79 32 69% 18%
Switzerland 137 80 159 23 16% 18%
Others 352 494 369 17 5%
Total other international 710 1,002 1,107 397 56% 48%
Scheduled total 5,876 6,635 6,666 791 13% 35%
Charter total 3,048 2,676 2,468 -580 -19% 4%
Grand total 8,924 9,311 9,134 210 2% 26%
Chapter 2 Page 25September 2009

CAP 787 International Relations – The Growth in Air Travel to Visit Friends or Relatives
2.82 The final destinations of the VFR passengers connecting at these airports tend to bemainly: Australia and India from Dubai, other US airports from Newark and a widerange of short and long haul destinations from Amsterdam.
Chapter 2 Page 26September 2009

CAP 787 International Relations – The Growth in Air Travel to Visit Friends or Relatives
Chapter 3 Characteristics of International VFR Passengers
Introduction
3.1 If a passenger makes a single trip for VFR purposes, this confirms the existence of afriend or a relative abroad – a prerequisite for VFR travel. The frequency of trips aperson makes to this VFR destination is then likely to be determined by the wealth ofthe individual; the cost of the trip (both financially and in journey time); and thecloseness of the relationships and desire to maintain links with the destination.
3.2 This Chapter considers:
• how the characteristics of VFR passengers differ from other leisure passengers interms of frequency of travel, trip duration, passenger age, income and householdtype; and
• whether there are distinguishable subsets of VFR passengers,
while the underlying drivers of this form of travel are considered in Chapter 4.
Chapter Summary
Using CAA Passenger Survey data, this Chapter considers how VFR passengersdiffer from other leisure (holiday) passengers in terms of demographics andfrequency of travel.
Frequency of travel
• on average, VFR passengers travel more frequently;
• they are more likely to fly regularly to the same destination;
• only 19% of VFR passengers take a single leisure trip per year, and only 17%travel solely for VFR purposes on multiple trips. The remainder take both VFRand holiday trips.
Income
• VFR passengers tend have a lower household income than holidaypassengers – around 60% of VFR passengers have a household income ofless than £40,000 compared with 50% of holiday passengers.
Length of trip (UK resident international leisure traffic)
• VFR passengers are more likely to take relatively short (less than five days)or long (greater than two weeks) trips. For example, 25% take trips longerthan two weeks, compared with only 12% of holiday passengers.
Age and household type
• for UK residents, VFR passengers have a modal age band of 25–44,compared with 45–54 for holiday passengers;
• foreign resident VFR passengers are more likely to be in the 16–24 age bandthan UK resident VFR passengers;
• VFR passengers are more likely to live in single person households thanholiday passengers.
Price sensitivity
• There are conflicting arguments as to whether VFR passengers are more orless price sensitive than holiday passengers, and the data in this study arenot sufficient to reach a conclusion.
Chapter 3 Page 1September 2009

CAP 787 International Relations – The Growth in Air Travel to Visit Friends or Relatives
3.3 This analysis is based on CAA Passenger Survey data from the five UK airports thatare subject to Continuous Survey (Heathrow, Gatwick, Stansted, Luton andManchester). For the purposes of this analysis, leisure passengers travelling forreasons other than VFR are referred to throughout as 'holiday' passengers; and thedata exclude those passengers who have arrived at the airport on an internationalflight in order to connect onto an onward international flight.
3.4 In 2007, the five Continuous Survey airports accounted for three-quarters ofinternational passengers travelling to and from UK airports. Figure 3.1 shows thistraffic broken down by journey purpose and residency, and changes since 2002.
Source: CAA Passenger Survey, excluding international-to-international connectors.
3.5 Figure 3.1 shows a shift from holiday to VFR traffic, particularly in respect of UKresidents, with little change in the proportion of business traffic. In 2002, UK residentsaccounted for just over 70% of international passengers. This proportion fell slightlyin 2007, but would have fallen more had the relatively slow growth in UK residentholiday traffic not been counterbalanced by the growth in UK resident VFR.
3.6 Table 3.1 shows the proportions of international leisure passengers ('holiday' and'VFR') travelling from the Continuous Survey airports in 2007 by journey purpose andresidency. Over two-thirds of leisure passengers are UK residents. UK residentpassengers are almost twice as likely to be flying on holiday than for VFR purposes,as opposed to foreign resident passengers, who are more likely to be flying for VFRpurposes.
Source: CAA Passenger Survey, excluding international-to-international connectors.
Figure 3.1 Journey purpose and residency of international passengers at the Continuous Survey airports, 2002 and 2007
Table 3.1 Journey purpose and residency of international leisure passengers at the Continuous Survey airports, 2007
Residency
Purpose UK Foreign Total
Holiday 47% 10% 57%
VFR 25% 18% 43%
72% 28% 100%
0%
5%
10%
15%
20%
25%
30%
35%
40%
45%
UK business
UK holiday
UK VFR Foreignbusiness
Foreignholiday
Foreign VFR
Market segment
Perc
enta
ge o
f int
erna
tiona
l ter
min
al
pass
enge
rs
20022007
Chapter 3 Page 2September 2009

CAP 787 International Relations – The Growth in Air Travel to Visit Friends or Relatives
3.7 The remainder of this Chapter analyses survey data for international leisurepassengers at the Continuous Survey airports by passenger characteristics. Some ofthe assumptions made in the methodology adopted are explained in the box below.
A. Frequency of travel
3.8 To help understand the subgroups within the VFR segment, an estimate of howpassenger trips are distributed across passengers can be generated. If there is a baselevel of one VFR trip per year that passengers would be more reluctant to give up thanmarginal trips beyond that, then it is useful to gain an understanding of how individualand repeat trips are distributed. Table 3.2 shows how many flights for leisurepurposes passengers had taken in the previous 12 months on any route.
Source: CAA Passenger Survey, July–December 2007, excluding international-to-international connectors.
Assumptions used in analysis of survey data in sections A to C
• The total number of trips has been calculated by assuming one trip comprisestwo flights and halving the number of previous flights plus the current flight(i.e. the flight at the time of interview), and rounding up. The current flightmust represent either the outward leg or the return leg of one trip. Thus eitherzero or one previous flight equates to a total number of trips of one – bydefinition, everyone interviewed must take at least one trip in the 12-monthperiod.
• Any analysis of frequency of travel considers passenger trips rather thanunique passengers. For example, 20 passengers over the 12 months maycomprise 10 individuals taking one trip plus one passenger taking 10 trips. Inthis example there is an equal probability of interviewing either the frequenttraveller or one of the single-trip passengers. Thus a survey could beexpected to show that 50% of passengers take 10 trips a year. Inverseweighting by probability of interview would also indicate that only one in 11unique passengers takes 10 trips a year.
• The journey purpose of the current trip is not necessarily the same as that forall the other trips over the 12 months. Thus, although a passenger may betravelling for VFR at the time of interview, the survey does not record thepurpose of their other leisure trips. It is reasonable, however, to assume thatany previous trips on the same route are also likely to have been for VFRpurposes.
• The relevant questions on frequency of leisure trips undertaken in theprevious 12 months were not introduced into the CAA Passenger Survey untilJuly 2007. This is why some of the data tables relate only to the second halfof 2007.
Table 3.2 Number of leisure trips taken on any route in the previous 12 months by international leisure passengers at the Continuous Survey airports, 2007
Number of
leisure trips
UK ForeignTotal
Holiday VFR Holiday VFR
1 21% 16% 28% 24% 21%
2 22% 19% 20% 14% 20%
3 20% 18% 16% 17% 19%
over 3 37% 46% 36% 45% 40%
100% 100% 100% 100% 100%
Chapter 3 Page 3September 2009

CAP 787 International Relations – The Growth in Air Travel to Visit Friends or Relatives
3.9 Table 3.2 shows that both UK and foreign resident passengers travelling for VFRpurposes at the time of interview were likely to take more frequent leisure trips thanpassengers who were travelling for holiday purposes.
3.10 Table 3.3 below shows the same categories but with the data confined to the numberof trips, for leisure purposes, these passengers had taken in the previous 12 monthson the same route as that at the time of interview.
Source: CAA Passenger Survey, July–December 2007, excluding international-to-international connectors.
3.11 Table 3.3 shows an even more pronounced difference between the responses ofholiday and VFR passengers. VFR passengers are more likely to take two or moreleisure trips a year to the same destination than holiday passengers. Again, this isconsistent for both UK and foreign residents. Of those passengers shown in the tableas taking more than three trips a year to the same destination, the majority have takenfour or five. Only a very small proportion of passengers took more than this.
3.12 By comparing the data for the number of trips taken on any route with that for thenumber of trips on the same route, it is possible to estimate the proportion ofpassengers who make all their leisure trips to the same destination and thereby tocategorise VFR passengers. Table 3.4 analyses the frequency of leisure trips overalland the frequency on the same route.
Source: CAA Passenger Survey, July–December 2007, excluding international-to-international connectors.Note: Where all leisure trips are to the same destination, the journey purpose has been assumed to be that
at the time of interview.
Table 3.3 Number of leisure trips taken on the same route in the previous 12 months by international leisure passengers at the Continuous Survey airports, 2007
Number of
leisure trips
UK Foreign
Total
Holiday VFR Holiday VFR
1 84% 60% 86% 64% 75%
2 8% 17% 7% 14% 11%
3 3% 9% 2% 8% 5%
over 3 5% 15% 4% 14% 9%
100% 100% 100% 100% 100%
Table 3.4 International leisure passengers by trip profile at the Continuous Survey airports, 2007
VFR Holiday
UK Foreign Total UK Foreign Total
Passengers taking only one trip 17% 24% 19% 21% 28% 22%
Passengers making multiple trips, same destination 17% 14% 17% 6% 6% 6%
Passengers making multiple trips, multiple destinations 66% 62% 64% 73% 66% 72%
100% 100% 100% 100% 100% 100%
Chapter 3 Page 4September 2009

CAP 787 International Relations – The Growth in Air Travel to Visit Friends or Relatives
3.13 Table 3.4 shows that the proportion of total VFR passengers who travel repeatedly tothe same destination over a year (17%) is smaller than the proportion making just oneVFR trip over a year (19%). The proportion of passengers who make more than oneleisure trip in a year who make them all to the same destination is 21% for VFRpassengers and 8% for holiday passengers71.
3.14 It is possible to derive the average number of leisure trips taken per year by a UKresident unique passenger72 by inverse weighting the survey responses by thelikelihood of being interviewed (i.e. the number of leisure trips taken in the last 12months73). The evidence from the tables above suggests that the average number ofleisure trips per year taken by a UK resident unique passenger is an estimated 2.2 forholiday passengers, and 2.5 for VFR passengers. Thus for an equal number ofpassenger trips, there are slightly fewer unique VFR passengers than unique holidaypassengers.
B. Income of passengers
3.15 The CAA Passenger Survey asks all leisure passengers to identify their householdincome within a range of income bands74. Figure 3.2 shows the cumulativehousehold income distribution for UK resident holiday and VFR passengers in 2007.This is calculated by plotting the mid-values of the income bands against thecumulative proportion of passengers reported by the survey75. The upper end of thedistribution above £115,000 is not shown as this only covers a relatively small fractionof the passengers. Indeed, the relatively small sample size for very high or very lowincome levels means that the data at these extremes are less reliable; the mid-rangefrom £11,500 to £80,500 covers approximately two-thirds of the passengers.
Source: CAA Passenger Survey, excluding international-to-international connectors.Note: The y-axis shows the total proportion passengers whose household income is less than the amount
shown on the x-axis.
71. 17% / (17+64)% = 21%; 6% / (6+72)% = 8%72. It is possible to do this for UK resident passengers only by making the assumption that of the trips they have taken in the
last 12 months, all have been from one of the continuous-survey airports, thus increasing their likelihood of beinginterviewed. In the case of foreign-resident passengers, this assumption is not sufficiently robust.
73. A passenger who takes three trips per year is three times more likely to be interviewed in the survey than a passengerwho takes one trip per year. For a more comprehensive explanation of how ‘unique passenger’ numbers are derived, seeChapter 4 of Recent trends in growth if UK air passenger demand, CAA (January 2008).
74. For UK resident passengers these bands are in Sterling and for foreign-resident passengers they are in one of 12 foreigncurrencies including Euro, US dollar and Japanese yen.
75. Again, consider that these data are passenger trips data, and thus if a certain type of passenger has a higher propensityto fly, they will skew the distribution in favour of their own characteristics.
Figure 3.2 Income profile of international leisure passengers at the Continuous Survey airports, 2007
a) UK resident b) Foreign resident
0%
10%
20%
30%
40%
50%
60%
70%
80%
90%
100%
£0 £20,000 £40,000 £60,000 £80,000 £100,000 £120,000
Household income per annum
Cum
ulat
ive
perc
enta
ge o
f pa
ssen
gers
Holiday VFR
0%
10%
20%
30%
40%
50%
60%
70%
80%
90%
100%
£0 £20,000 £40,000 £60,000 £80,000 £100,000 £120,000
Household income per annum
Cum
ulat
ive
perc
enta
ge o
f pa
ssen
gers
Holiday VFR
Chapter 3 Page 5September 2009

CAP 787 International Relations – The Growth in Air Travel to Visit Friends or Relatives
3.16 Figure 3.2 shows that, on average, VFR passengers have a lower household incomethan holiday passengers. For example, around 60% of VFR passengers have ahousehold income of £40,000 or less, compared with around 50% of holidaypassengers. Comparison of the income distribution of UK resident and foreignresident leisure passengers shows them to be virtually identical.
3.17 Figure 3.3 shows, for different income bands, the propensity for VFR and holidaypassengers to take multiple leisure trips. It shows that the proportion of passengerstaking more than three leisure trips per year is greater for VFR passengers thanholiday passengers at all income levels, and is greater for higher-income passengersthan lower-income passengers.
Source: CAA Passenger Survey, excluding international-to-international connectors.
C. Length of trip
3.18 As VFR passengers will may be free of the restrictions to which some holidaypassengers may be subject (such as booking of accommodation), a more varieddistribution of trip length might be expected. Analysis of UK resident passenger datashows that this is indeed the case, with a smaller proportion of VFR passengerstaking trips of 5–14 days (55%) than for holiday passengers (74%).
Source: CAA Passenger Survey, July–December 2007, excluding international-to-international connectors.
Figure 3.3 Proportion of international leisure passengers taking more than three leisure trips per year at the Continuous Survey airports, 2007
Table 3.5 Proportion of UK resident international VFR passengers by length of current trip and number of leisure trips in the previous year at the Continuous Survey airports, 2007
Total
Leisure trips
in previous year
(any route)
Length of current trip (days)Total
1 to 4 5 to 7 8 to 14 15 to 28 over 28
17% 1 12% 20% 31% 26% 11% 100%
19% 2 11% 26% 35% 22% 7% 100%
19% 3 16% 31% 27% 19% 6% 100%
45% over 3 29% 28% 24% 15% 4% 100%
100% Total 20% 27% 28% 19% 6% 100%
0%
10%
20%
30%
40%
50%
60%
70%
80%
Under£11,500
£11,500-£28,749
£28,750-£40,249
£40,250-£57,499
£57,500-80,499
£80,500-£114,999
over£114,999
Household income per annum
Prop
ortio
n of
pas
seng
ers
taki
ng >
3 le
isur
e tr
ips/
year
VFR Holiday
Chapter 3 Page 6September 2009

CAP 787 International Relations – The Growth in Air Travel to Visit Friends or Relatives
3.19 Table 3.5 shows that 25% of UK resident international VFR passengers take trips ofmore than two weeks. However, the proportion of passengers taking such long tripsdeclines the more trips per year that are taken. The proportion is 37% if one trip peryear is taken, but only 19% if more than three trips per year are taken.
3.20 As might be expected, the opposite is true for short trips lasting up to four days,which make up 20% of the journeys of international VFR passengers. Here, theproportion of passengers taking a shorter trip increases with trip frequency, from 12%for passengers making one trip per year to 29% for those taking more than three trips.
3.21 Table 3.6 makes the same comparison for holiday passengers. It shows that nearlythree-quarters of all holiday passengers’ leisure trips are between five and 14 days’duration. Only 12% last for more than two weeks, compared with the 25% notedabove for VFR passengers. In other words, compared with holiday passengers, VFRpassengers are both more likely to take relatively long leisure trips and relatively shorttrips.
Source: CAA Passenger Survey, July–December 2007, excluding international-to-international connectors.
3.22 As with VFR passengers, the table shows that UK resident holiday passengers takingshorter trips of less than four days at the time of interview tend to make morefrequent leisure trips over the year. However, in the case of those on a trip of morethan four days, there is no obvious correlation with the number of leisure trips takenover the year. Only those passengers taking more than three trips a year arenoticeably different in that they appear to take more frequent, shorter trips and lesstrips in the 8–14 day bracket than the overall average. Table 3.6 also shows that asmaller proportion of holiday passengers at all frequencies take trips of greater than28 days, as compared with VFR passengers. The average number of days thatpassengers spend away is broadly similar for VFR and holiday passengers(approximately 12 days). However, as the tables demonstrate, the variance of the triplength is noticeably higher for VFR passengers and varies according to the frequencyof their travel.
3.23 Figure 3.4 below illustrates these relationships by comparing the proportion ofpassengers who have taken either 'short' or 'long' trips by journey purpose of currenttrip (either holiday or VFR). For example, of those VFR passengers who have takenmore than three leisure trips in the past year, nearly 30% have a current trip length ofone to four days. This compares with around 4% with a trip length of over 28 days.However, of those VFR passengers whose current trip is their only trip in the last 12months, more than 10% are taking a trip of over 28 days.
Table 3.6 Proportion of UK resident international holiday passengers, by length of trip and the number of leisure trips in the previous year at the Continuous Survey airports, 2007
Total
Leisure trips
in previous year
(any route)
Length of current trip (days)
Total1 to 4 5 to 7 8 to 14 15 to 28 over 28
21% 1 8% 39% 40% 11% 2% 100%
22% 2 9% 39% 41% 9% 2% 100%
20% 3 12% 37% 37% 11% 3% 100%
36% over 3 21% 37% 31% 9% 2% 100%
100% Total 14% 38% 36% 10% 2% 100%
Chapter 3 Page 7September 2009
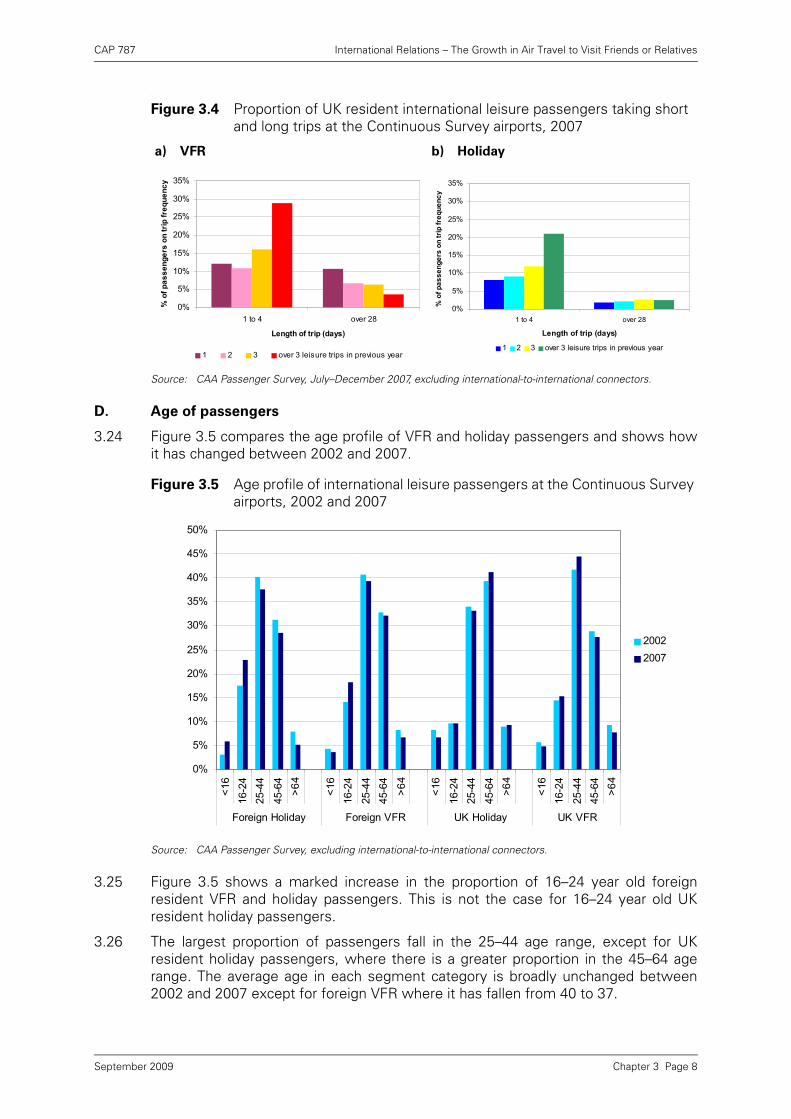
CAP 787 International Relations – The Growth in Air Travel to Visit Friends or Relatives
.
Source: CAA Passenger Survey, July–December 2007, excluding international-to-international connectors.
D. Age of passengers
3.24 Figure 3.5 compares the age profile of VFR and holiday passengers and shows howit has changed between 2002 and 2007.
Source: CAA Passenger Survey, excluding international-to-international connectors.
3.25 Figure 3.5 shows a marked increase in the proportion of 16–24 year old foreignresident VFR and holiday passengers. This is not the case for 16–24 year old UKresident holiday passengers.
3.26 The largest proportion of passengers fall in the 25–44 age range, except for UKresident holiday passengers, where there is a greater proportion in the 45–64 agerange. The average age in each segment category is broadly unchanged between2002 and 2007 except for foreign VFR where it has fallen from 40 to 37.
Figure 3.4 Proportion of UK resident international leisure passengers taking short and long trips at the Continuous Survey airports, 2007
a) VFR b) Holiday
Figure 3.5 Age profile of international leisure passengers at the Continuous Survey airports, 2002 and 2007
0%
5%
10%
15%
20%
25%
30%
35%
1 to 4 over 28
Length of trip (days)
% o
f pas
seng
ers
on tr
ip fr
eque
ncy
1 2 3 over 3 leisure trips in previous year
0%
5%
10%
15%
20%
25%
30%
35%
1 to 4 over 28
Length of trip (days)
% o
f pas
seng
ers
on tr
ip fr
eque
ncy
1 2 3 over 3 leisure trips in previous year
0%
5%
10%
15%
20%
25%
30%
35%
40%
45%
50%
<16
16-2
425
-44
45-6
4>6
4
<16
16-2
4
25-4
445
-64
>64
<16
16-2
425
-44
45-6
4>6
4
<16
16-2
4
25-4
445
-64
>64
Foreign Holiday Foreign VFR UK Holiday UK VFR
20022007
Chapter 3 Page 8September 2009

CAP 787 International Relations – The Growth in Air Travel to Visit Friends or Relatives
3.27 The data suggest that foreign resident VFR and holiday passengers have a similar agedistribution, whereas in the case of UK resident passengers there is a greaterdifference between the two segments.
Source: CAA Passenger Survey, excluding international-to-international connectors.Note: Average ages are calculated using the mid-point of each age band.
E. Household type of passengers
3.28 Figure 3.6 shows how VFR and holiday passengers differ in terms of household type.Of UK resident VFR passengers, nearly 70% live alone or with one other adult withno children, in broadly equal proportions. The percentage of households with eitherone or two adults and children is similar for both types of leisure passengers, and bothUK and foreign residents. The biggest proportion (44%) of UK resident passengerstravelling on holiday live with one other adult and no children. A greater proportion ofVFR than holiday passengers live alone.
Source: CAA Passenger Survey, 2007, excluding international-to-international connectors.Note: ‘Over 2 adults’ households may or may not include children.
F. Price sensitivity
3.29 It is not possible to speculate confidently on the relative sensitivities of VFR andholiday passengers to changes in the price of air travel. There are, for example,conflicting intuitive arguments:
• VFR passengers could be more price sensitive than holiday passengers, given thattheir accommodation costs may be met by the friend or relative they are visiting,and therefore the air fare will make up a greater proportion of total trip cost;
Table 3.7 Estimated average age of international leisure passengers, the Continuous Survey airports, 2002 and 2007
Foreign UK
Holiday VFR Holiday VFR
2002 40 41 42 40
2007 37 40 43 39
Figure 3.6 Household type of international leisure passengers at the Continuous Survey airports, 2007
0%
20%
40%
60%
80%
100%
UK Holiday UK VFR Foreign Holiday Foreign VFR
single 2 adults no children up to 2 adults w ith children over 2 adults
Chapter 3 Page 9September 2009

CAP 787 International Relations – The Growth in Air Travel to Visit Friends or Relatives
• VFR passengers could be less price sensitive than holiday passengers, given thattheir travel plans are likely to be more destination-specific, whereas holidaypassengers can substitute alternative, less expensive, destinations if prices rise ona particular route; and
• although VFR passengers’ trips may be more time-specific, for instance, visitingfamily at Christmas, the passengers are less likely to be restricted by factors suchas charter flights and hotel bookings, thus offering a degree of flexibility perhapsnot available to all passengers.
3.30 It is also possible that frequency of travel will be related to price sensitivity ofpassengers. For instance, in the event of a price increase on a particular route,passengers who only take one VFR trip a year may be less willing to forego that tripthan passengers who take more frequent trips, who may be more prepared to switchto fewer, perhaps longer duration, trips.
3.31 Conversely, a lower fare on a particular route may stimulate more frequent VFR tripsby an individual passenger, whereas, given the evidence above that a relatively smallproportion of holiday passengers take all their trips to a single destination, it wouldseem less likely to lead to repeated holiday trips by the same individual. However, alower fare could lead to trips (for either journey purpose) being made by individualswho would not otherwise have travelled.
Chapter 3 Page 10September 2009
CAP 787 International Relations – The Growth in Air Travel to Visit Friends or Relatives
Chapter 4 Factors Influencing International VFR Traffic
Growth
Chapter Summary
This Chapter looks at possible drivers behind the increased demand forinternational VFR travel to and from the UK, and how supply of air services hasincreased to serve it. Such factors can be divided into those making all air travelmore affordable and accessible, and those specific to VFR travel.
Factors common to all air travel
• Economic growth – the growth in UK resident VFR traffic over the last fewyears appears to be positively related to growth in UK GDP with a time lag ofone to two quarters. This relationship seems to be less strong than that forholiday traffic and with a shorter lag.
• Supply of air services – recent years have seen improved access to air travel,brought about by broader route networks and lower fares. The emergenceof no-frills carriers (and the competitive response of the market) has been aparticularly significant feature of the short haul market, with a largeproportion of VFR traffic using no-frills carriers.
Factors specific to VFR travel
For VFR travel to occur, some sort of inter-country social network is a pre-requisite.This may have developed for a number of reasons.
• Migration – in recent years migration has increased, particularly between theUK and the EU (in both directions). The proximity of these migrants to theirhome country means that they have a bigger impact on VFR traffic throughmore frequent trips, on average, than migrants with links further afield (suchas UK emigrants based in Australia, or immigrants to the UK from India).
• Education – the UK remains a popular destination for students, and thesetemporary migrants (a subset of total migrants) increase the potential VFRmarket. Although a growing number come from outside the EU, one-third (in2006-07) were EU citizens – and they are also likely to have a proportionatelylarger effect on VFR traffic due to the proximity of their home country to theUK.
• Second-home ownership – the increasing level of second-home ownershipis closely related to growth in migration and VFR travel. Although peopletravelling to and from their second-home are not categorised as travelling forVFR, friends or relatives travelling to visit them are.
Most (arguably all) of these drivers have been significantly influenced by thedevelopment of the single market in the EU in recent years. The concurrentliberalisation of the air services market and increased use of the freedoms to workand move throughout the EU has meant that the potential market for VFR travelhas grown and the means of servicing it has become cheaper and more accessible.
The results of statistical analysis that tends to support the themes explored aresummarised at the end of the Chapter.
Chapter 4 Page 1September 2009

CAP 787 International Relations – The Growth in Air Travel to Visit Friends or Relatives
Introduction
4.1 Change in the demand for VFR traffic is related to a number of different factors. Somewill be common to all leisure passengers; some will be specific to VFR passengers.The drivers of economic growth and accessibility of flights (either through extensionof route networks or falling fares on existing routes) are likely to affect all leisurepassengers.
4.2 However, beyond these economic considerations, there is a pre-requisite forinternational VFR travel that does not apply to travel for other purposes – theexistence of a friend or relative abroad, or with a presence abroad, as is the case withownership of a second-home which friends or relatives may visit. Migration, eitherrecent or further in the past, is generally necessary to create demand for VFR travel.This may be through permanent migration, or shorter-term arrangements such asstudent exchanges.
4.3 Along with migration, there is also a close relationship between VFR and theownership of second-homes abroad by UK citizens. Although the owners of second-homes are not travelling on VFR themselves when going to their second-home (theyare classed as 'holiday' traffic), friends or relatives visiting them there would beclassed as VFR76.
4.4 These factors are all inter-related – for instance, economic growth in the UK is likelyboth to be stimulated by and to stimulate migration, and the attraction of second-home ownership will, in many cases, have been influenced by the greater availabilityof low fares to many destinations. This Chapter looks at the impact of each of thesedrivers individually on the growth of VFR traffic, and the influence on them of the EUsingle market, which is a recurring theme throughout this Chapter.
76. However, as noted elsewhere, the interviewee is responsible to deciding their own journey purpose so thesedistinctions may not always be clear-cut.
EU single market
Changes within the EU have led to freedom of movement for more people (andthereby increased migration), freedom of movement of capital over a wider area(for example, purchasing of second-homes) and a more liberalised market in airservices (leading to increased route networks and lower fares). These changeshave provided impetus to growth in the VFR market. In addition, the geographicalproximity of other EU states to the UK means that the destinations lendthemselves to more frequent trips, as both the financial and time costs of travel arelower than for destinations further afield.
Key developments of particular relevance to this study are:
1993 – the EU Aviation 'Third Package' which brought about a single market in airtransport in the EU. Most importantly, this allowed EU airlines to offer servicesfreely between any Member States at the prices they wished to charge and thusprotection from competition for national flag carriers was removed.
2004 – the EU expanded on 1 May 2004 to include the EU Accession Eight (EUA8)countries, along with Malta and Cyprus. This increased the population within theEU by almost 75 million.
Chapter 4 Page 2September 2009

CAP 787 International Relations – The Growth in Air Travel to Visit Friends or Relatives
Economic growth
4.5 Increases in general levels of real income would be expected to stimulate air travelfor all purposes as it becomes relatively cheaper. Hence, economic growth can beexpected to be a driver for the subset of VFR traffic, as the desire to travel by air tovisit friends or relatives can only be realised provided the expense can be covered.
4.6 Figure 4.1 plots the rolling annual growth of UK GDP against the rolling annual growthin UK resident international VFR traffic. It shows how both have fluctuated in recentyears with VFR traffic growth lagging GDP growth by one to two quarters. The growthin foreign resident VFR traffic is likely to be linked to the GDP of all possibleorigin/destination countries, rather than just that of the UK. However, given that overhalf of all international VFR traffic is UK resident, it is evident that UK GDP is animportant driver.
4.7 It is impractical to look at global GDP and too complex to construct some weightedinternational GDP measure reflective of potential for VFR traffic. Individual passengercircumstances and their differing reasons for travelling mean that whether theprimary economic driver is either UK or foreign GDP is likely to vary across foreignresident passengers.
Source: International Passenger Survey (MQ6) and ONS.
4.8 More detailed analysis of the correlation77 between the growth in UK GDP and thegrowth in UK resident VFR traffic reveals that although the relationship is not strong,there is a clearly identifiable link between the two, which peaks at a lag of one quarter.Due to the recurring peaks and troughs in both series, the correlations becomenegative at longer time lags.
4.9 Figure 4.2 compares the correlation between UK resident VFR traffic growth and UKGDP growth at increasing lags78 with that seen for UK holiday traffic. Whilst VFR andholiday growth both appear related to GDP with a lag of up to a year, the VFR
Figure 4.1 UK resident VFR traffic growth compared with GDP growth
77. The correlation coefficient indicates the strength and direction of a linear relationship between two variables. It takesvalues between –1 (a perfect negative linear relationship) and 1 (a perfect positive linear relationship), with a value of 0indicating no relationship. By lagging the GDP growth rate for a given number of quarters, evidence of a laggedrelationship can be observed.
78. For example a lag of ‘t-1’ compares growth in VFR traffic in the current quarter with GDP growth in the prior quarter, ‘t-2’with the one before that, and so on.
0%
2%
4%
6%
8%
10%
12%
14%
16%
18%
20%
1994
Q4
1995
Q4
1996
Q4
1997
Q4
1998
Q4
1999
Q4
2000
Q4
2001
Q4
2002
Q4
2003
Q4
2004
Q4
2005
Q4
2006
Q4
2007
Q4
0%
1%
2%
3%
4%
5%
rolling annual growth UK resident VFR (lhs) rolling annual growth GDP (rhs)
Chapter 4 Page 3September 2009

CAP 787 International Relations – The Growth in Air Travel to Visit Friends or Relatives
relationship is less strong. Also, there tends to be a greater time lag in the relationshipbetween GDP and holiday traffic (peaking at around six months) than that betweenGDP and VFR traffic (peaking at around three months). This analysis indicates thatVFR passengers may not make their travel plans as far in advance, and that income isnot the only factor affecting VFR travel (and therefore drivers other than the economymay also be significant).
Source: Derived from data from the International Passenger Survey and ONS (using rolling annual growth rates from GDP Q4 1994).
4.10 More complex statistical analysis at the end of this Chapter considers the impact ofthe absolute level of UK GDP on VFR traffic alongside other explanatory variables.
Supply of air services
4.11 As well as increases in income, decreases in fares or the opening of a new route mayalso stimulate VFR traffic by making it easier and/or cheaper to travel. Whilsteconomic growth is likely to affect the total number of trips taken, the accessibility offlights may vary by route, thus prompting the substitution of one trip for a cheaperalternative. The extent of the impact of these factors on VFR passengers will dependon the 'importance' to the passenger of making the specific trip on the specific route.
4.12 The availability of routes may be a limited stimulant for holiday traffic as travellers maybe prepared to substitute destinations. VFR traffic, like business, will tend to bedestination-specific (depending on the extent of the social networks in place). Whilstpotential VFR passengers who are not able to travel to their chosen destination may,unlike business travellers, take a leisure trip instead, they may also choose not tospend their money on air travel at all.
4.13 Chapter 3 showed how VFR passengers can be separated into three different groupsbased on the estimated frequency of their leisure travel:
• those making a only single leisure trip in the year, which is for VFR purposes;
• those making multiple leisure trips in a year, all for VFR purposes; and
• those making multiple leisure trips to multiple destinations, at least one of whichis for VFR, the others for 'holiday' purposes.
Figure 4.2 Correlation between UK resident leisure traffic and GDP growth rates
-0.6
-0.4
-0.2
0.0
0.2
0.4
0.6
t t-1 t-2 t-3 t-4 t-5 t-6 t-7
time lag (quarters)
corr
elat
ion
coef
ficie
nt
UK resident holiday vs. GDP UK resident VFR vs. GDP
increasing positive correlation
increasing negativecorrelation
Chapter 4 Page 4September 2009

CAP 787 International Relations – The Growth in Air Travel to Visit Friends or Relatives
4.14 It is likely that these groups will place differing importance on an individual VFR trip.For example, those taking more frequent trips may place less importance on themarginal trip than the passenger who only makes one trip a year. The more'substitutable' a trip, the more impact a change in fares is likely to have. For holidaytraffic, substituting one destination for another if fares on one route rise is expectedand rational behaviour. For VFR passengers, it is harder to substitute destination.
4.15 A greater proportion (nearly three-quarters) of UK resident leisure passengers travelto/from the UK to short haul destinations rather than long haul destinations. For UKresident VFR passengers, the proportion is lower at two-thirds (similar to both foreignresident holiday and VFR passengers). However, the short haul classification usedhere includes a number of popular holiday destinations which are not within the EU(for example, Egypt and Turkey). If the destinations are divided into EU and non-EUgroups rather than short/long haul, the difference between the distribution of UKresident holiday and VFR passengers is less pronounced.
4.16 Figure 4.3 shows, for different destination groups, how the journey purpose of leisurepassengers is split. This chart highlights the particularly high VFR proportion on routesto the EUA8 countries (which, as shown by the orange bar, make up 5% of totalleisure traffic in 2007 at these five UK airports).
Source: CAA Passenger Survey, 2007, excluding international-to-international connectors.Note:• ‘Other EU’ countries are: Cyprus, Malta, Romania and Bulgaria.• ‘Short haul’ includes countries outside the EU, such as Switzerland, Norway, Turkey, Egypt, Russia and
Tunisia.
4.17 The following sections consider changes in the European and longer-haul marketsseparately, due to the differing factors that influence route networks and fare levels– in particular, no-frills carriers operating to and from the UK are predominantly flyingto Europe.
Europe
4.18 60% of the international VFR traffic to and from the UK at the main UK internationalairports in 2007 was between the UK and Europe. The EU15 countries have been alarge part of the VFR market for many years. However, recent enlargement of the EUhas led to additional rapid growth in VFR between the UK and the EUA8 countries.
Figure 4.3 Journey purpose and destination, international leisure passengers at the Continuous Survey airports, 2007
0%10%
20%30%
40%50%60%
70%80%
90%100%
EU15 EUA8 otherEU
non-EU
shorthaul
non-EU
longhaul
UK VFR Foreign VFR UK holiday Foreign holiday Destination proportion of total leisure
Chapter 4 Page 5September 2009

CAP 787 International Relations – The Growth in Air Travel to Visit Friends or Relatives
4.19 Taking the dataset of the ‘main UK international airports’, (the five Continuous Surveyairports plus the four biggest international regional airports of Birmingham, Bristol,East Midlands and Liverpool), key observations are that:
• total VFR passengers increased from an estimated 24 million in 2000 to 45 millionin 2007;
• the bulk of the VFR increase (from 1.4 million in 2000 to 5.7 million in 2007) at thefour regional airports listed above was in UK–EU traffic;
• VFR traffic to and from Poland has increased from 100 thousand in 2000 to nearly2.5 million in 2007, the other EUA8 countries also growing from 200 thousand in2000 to 1.7 million in 2007. By 2007, the EUA8 countries accounted for 9% of allinternational VFR traffic at these airports;
• over the same period, traffic has also increased between EU15 countries and theUK. In each year, the EU15 represented around half of all international VFR trafficto/from the UK; and
• UK–non EU VFR traffic has increased slightly over the same period, but overall,growth is very much dominated by the European countries. Figure 2.3 in Chapter2 breaks down the estimated growth in VFR traffic between 2000 and 2007 bycountry.
4.20 This growth in UK–EU VFR traffic has been supported by significant change in the EUair passenger market since the early 1990s. The adoption of the 'Third Package' ofaviation liberalisation measures in 1993 created a single market for aviation in the EU,meaning that airlines flying within the EU were free of restrictions on routes, thefrequency of flights, and the setting of fares.
4.21 This legislation facilitated the rapid expansion in size and number of airlines, mainlyno-frills operations, flying in and out of the UK to EU destinations. The business modelof these airlines, along with the competitive response to their entry into the market,has led to:
• an increased number of routes being served; and
• a lowering of fares.
4.22 Chapter 2 illustrated that the UK airports where VFR traffic grew particularly stronglybetween 2000 and 2007 were those where no-frills airlines were quick to establish asignificant base.
4.23 Figure 4.4 shows that for UK–EU traffic, no-frills airlines serve a much greaterproportion of the UK resident VFR market than the holiday market. For foreignresidents the difference is far less pronounced. 40% of UK resident holidaypassengers travelled on charter services in 2007, a fall from nearly two-thirds in 2000.The growth in no-frills airlines has been a key reason behind this.
Chapter 4 Page 6September 2009

CAP 787 International Relations – The Growth in Air Travel to Visit Friends or Relatives
Source: CAA Passenger Survey, excluding international-to-international connectors.
Routes
4.24 Previous work79 published by the CAA illustrated the growth in the European no-frillsroute network between 2000 and 2006. The number of UK–EU airport pairs served byall airlines was estimated to have more than doubled from around 160 in 2000 to over370 in 2005. Since then, other notable increases include Poland – four scheduledroutes80 operated between the UK and Poland in 2001, increasing to over 30 in 2007;and Spain where the increase was from 43 in 2001 to 144 in 200781.
4.25 Enhanced route networks have developed as no-frills operators have tested newmarkets and taken advantage of the possibilities for rapid expansion at regionalairports (both in the UK and abroad). The effect of this on VFR traffic at UK airportswas considered in Chapter 2.
4.26 The use of regional airports throughout Europe may have provided an additional boostfor the VFR market as the destinations served move away from capital cities (toregional cities), from city centres (to secondary airports) and from leisure destinationsto the types of areas where people live, opening up previously less accessible areasto lower fares and regular flights. To the extent that this will reduce the time and farescost for travel it will be a positive contributor to VFR growth. For example, consideringthe route London–Toulouse, in January 1995 the cheapest published fare (excludingtaxes) was around £180 with British Airways. For March 2009, current published fares(excluding taxes) for both British Airways and easyJet are under £70.
4.27 Stansted stands out as contributing the biggest single increase to VFR passengernumbers, with nearly one-third of the estimated 21 million increase. As noted inChapter 2 this has been driven by the no-frills airlines operating at the airport. Thenumber of international destinations served from the airport almost doubled between2001 and 2007 to nearly 120 in 2007.
Figure 4.4 Leisure passengers (UK–EU) by airline type and residency at the Continuous Survey airports, 2007
79. CAP 770 – No-Frills Carriers: Revolution or Evolution?, CAA (November 2006) – this analysis defined routes as thoseservices with no less than 20 departing flights in the month of July.
80. In this document, a wider definition of routes is considered more appropriate for VFR passengers, and a route is definedas airport pairs averaging more than three return services per week in the year – this definition may exclude someseasonal routes.
81. Spain including the Canary Islands. Part of this increase represents a shifting from charter services to scheduledservices. However, even considering charter and scheduled routes in total, the number of routes has increased from 122in 2001 to 181 in 2007.
0%
20%
40%
60%
80%
100%
UK Holiday UK VFR Foreign Holiday Foreign VFR
Charter No-frills Full service
Chapter 4 Page 7September 2009

CAP 787 International Relations – The Growth in Air Travel to Visit Friends or Relatives
Fares
4.28 One selling point of no-frills carriers has been their lower, and/or more flexible fareofferings. As shown in Chapter 3, VFR passengers are more likely to take frequentshort trips than holiday passengers and lower fares may help encourage this.
4.29 No-frills airlines have increased the level of competition in the industry for all types ofcarrier. CAA Passenger Survey data show that the estimated cost of return economyfares between the UK and EU countries has fallen in real terms between 2000 and2007. The largest fall in percentage terms is for the EUA8 group of countries whichjoined the EU in 2004. As previously noted, these countries have collectively seenlarge increases in VFR traffic.
Source: CAA Passenger Survey 2000 and 2007, fares paid in pounds sterling.Notes:
• unweighted data used.• single fares assumed to be 50% of a return fare.
Long haul liberalisation
4.30 Although the UK–EU market has dominated growth in VFR over the last six years (asillustrated in Figure 1.3 in Chapter 1), there is still a sizeable long haul market. In 2007,around 40% of international VFR passengers to and from the Continuous Surveyairports were travelling to destinations outside the EU. As the following section onmigration goes on to show, many of these routes show a higher than averageproportion of VFR passengers.
4.31 Improved routes and connections for long haul flights can reduce the time cost oftravel significantly. However, there is a limit to how far such improvements can go,and the journey time to long haul destinations is significantly higher than for short haultravel. For example, the shortest flight time currently on offer from London Heathrowto Sydney is around 22 hours, as compared with Heathrow to Madrid at just undertwo and a half hours.
4.32 In recent years, although long haul travel has not seen the same kind of changes asshort haul resulting from the growth of no-frills operations, there has beenliberalisation on long haul routes. This means a reduction in bilaterally agreedrestrictions on flights between the UK and other countries, for example on the routesoperated, the frequency of flights, and the setting of fares by airlines. Where marketsare liberalised, with the provision of increased supply and greater competition, thereis generally evidence of lower fares and increased accessibility of flights. New routesand improved connections have been a feature potentially reducing the time costs oftravelling.
4.33 An example of this, of particular relevance to VFR passengers, is the liberalisation ofthe UK–India air services agreement between late 2004 and mid 2005. Using CAAPassenger Survey data82, the estimated proportion of passengers travelling UK–Indiafor VFR purposes is 50% and, as noted in Chapter 2, the proportion at Birmingham, acity with strong migrant links to the country, the proportion is very much higher.
Table 4.1 Estimated average return Economy class air fares, including taxes
In 2007 prices (£)2000 2007
EU15 174 129 -26%
EUA8 211 127 -40%
Other EU27 236 201 -15%
82. At the main UK international airports.
Chapter 4 Page 8September 2009

CAP 787 International Relations – The Growth in Air Travel to Visit Friends or Relatives
4.34 The liberalisation of the air services agreement led to an increase in the number ofcity pairs with direct services between the two countries from five to eight, and thenumber of direct services rose from 34 a week in October 2004 to 112 in October2006. A thorough discussion of the impact of this was produced by the CAA in200683, which also indicated that the increases in capacity and competition resultedin a reduction in fares.
Social factors
4.35 In order for a passenger to be travelling for VFR, they need to have some friends orfamily in another country or someone with a presence there. It may be that thepassenger has migrated, the friends or family being visited have migrated or eitherparty has previously lived abroad for an extended period (temporary migration).
4.36 The UK is home to a number of long-standing migrant populations, and there are alsosignificant UK communities in other countries. Both will contribute to VFR traffic.Historically, this migration has been linked to the Commonwealth and the ease ofmovement between its countries and the UK as regards visa restrictions. However,since these migrations were at their height, the UK has developed increased ties withthe EU (both social and legislative) and has seen a great deal of immigration from theeight accession states (EUA8) which joined the EU in 2004, particularly Poland.
The effect of immigrant communities in the UK on VFR traffic
4.37 The proportion of foreign-born citizens residing in the UK has also increased from anestimated 6.7% in 1991 to 10.5% in 200784. Over the period, the total number offoreign-born citizens living in the UK has increased by 65%, whereas the totalpopulation, has increased by 6.2%.
4.38 The ONS’s Annual Population Survey (APS) shows that:
• the immigrant population in the UK from the EU15 countries is approximately 1.2million;
• this compares with nearly 600 thousand from the EUA8 countries (of which aroundtwo-thirds is from Poland), and 1.2 million from the Indian subcontinent; and
• the largest foreign-born population groups are from India, Republic of Ireland,Poland and Pakistan. Between them, these account for around 3% of the total UKpopulation and make up nearly 30% of foreign-born UK residents.
4.39 The APS breaks down total foreign-born residents by country of birth. Table 4.2shows the top 10 countries, which covered only half of the total immigrant populationin 2007, indicating the diverse range of countries from which the UK drawsimmigrants. The table also shows the proportion of total traffic between the UK andeach country that is travelling for VFR purposes, estimated using the CAA PassengerSurvey. It indicates that air routes to those countries with significant migrantpopulations in the UK tend to have a much higher than average proportion ofpassengers travelling for VFR purposes.
83. UK–India Air Services: A case study in liberalisation, CAA (November 2006).84. Focus on People and Migration: 2005, Rendall and Salt, ONS (2005) and Annual Population Survey 2007, ONS.
Chapter 4 Page 9September 2009

CAP 787 International Relations – The Growth in Air Travel to Visit Friends or Relatives
Source: Table 1.3, Annual Population Survey 2007, ONS and CAA Passenger Survey at the UK’s main international airports.
Note: Red font indicates a VFR proportion higher than average.
4.40 In 2007, a report by the Institute for Public Policy Research (IPPR)85 looked at theeconomic contribution of the various immigrant communities in the UK, andestimated the proportions of a country’s immigrant stock that arrived in the UK after1996. This report indicates that:
• the majority of migrants from India, Pakistan and the Republic of Ireland (whomake up nearly one-quarter of foreign-born UK residents) arrived in the UK prior to1996; and
• by contrast, over three-quarters of Polish national immigrants arrived since 1996(the highest proportion of any of the immigrant countries) – this is likely to be aresult of the accession of Poland to the EU in 2004.
4.41 Total International Migration (TIM) figures from the ONS show the beginnings ofcircular migration with regard to Eastern Europe – that is, Eastern European nationalswho have been residing in the UK and are now leaving86. More recently, theFederation of Poles in Great Britain estimated that, although 200 thousand Poles leftthe UK in 2008, an estimated 500 thousand immigrants, many families with youngchildren, are likely to stay “not necessarily permanently, but for more than the short-term” despite the economic downturn and fall of sterling against the Polish zloty87.
Table 4.2 Foreign-born population groups resident in the UK (Top 10 countries), 2007
Country
Estimated
population group
(000s)
% of non-UK
born population
Proportion of VFR
on air route 2007
1 India 613 10% 50%
2 Ireland 420 7% 47%
3 Poland 405 6% 70%
4 Pakistan 377 6% 87%
5 Germany 266 4% 35%
6 Bangladesh 205 3% 69%
7 South Africa 201 3% 56%
8 United States 188 3% 32%
9 Jamaica 166 3% 35%
10 Nigeria 140 2% 58%
Others 3,360 53% 28%
Total 6,341 100% 32%
85. ‘Britain’s Immigrants – an economic profile’, IPPR (September 2007).86. See also, for example, a number of articles in the media about the possibility that Polish migrants in particular may be
starting to return home – the improving Polish economy means that the wage differentials are reducing and there aremore work opportunities in Poland – “Bad times ahead”, The Economist, 16 October 2008.
87. Federation of Poles in Great Britain, Press Release, 28 January 2009, http://www.zpwb.org.uk/en/archive_zpwb
Chapter 4 Page 10September 2009

CAP 787 International Relations – The Growth in Air Travel to Visit Friends or Relatives
4.42 It is too early to estimate the impact this circular migration could have on VFR traffic– potentially, people who return home will continue to generate VFR traffic as theymay have friends or family in the UK who they will continue to visit and vice versa.However, it is also worth noting that in 2009 there has been a withdrawal (orannouncement of forthcoming withdrawal) of some routes operated between the UKand Poland by a number of airlines, including Ryanair and easyJet88.
The effect of UK emigrant communities on VFR traffic
4.43 Whilst UK residents who were born overseas are likely to make visits to, or be visitedby, friends or relatives in their home country, there are also a large number of UKnationals who live overseas themselves and are likely to make visits home or to bevisited abroad by their friends or relatives.
4.44 Another report by the IPPR, 'Brits Abroad'89, uses a number of methods to estimatethe size of the total emigrant population – the number of people born in the UK whonow live abroad90. The number of Britons living abroad (for a year or more) isestimated by the IPPR to be 5.5 million, or just over 9% of the UK resident population.
4.45 Within this total, the level of emigration from the UK has been increasing over recentyears. 2006 saw over 400 thousand people (of all citizenships) leave the UK – thehighest estimate since the ONS introduced the method to calculate TIM in 1991. Ofthese emigrants, over half were British citizens. However, 2007 data show a declineto 340 thousand UK emigrants.
4.46 The IPPR also makes estimates of where emigrants are residing, which are shown inTable 4.3. The CAA Passenger Survey data are again used to estimate the proportionof total traffic travelling for VFR between the UK and each country. This table indicatesthat those countries where there are a significant number of British emigrants tendto have a higher than average proportion of passengers travelling for VFR. Notableexceptions to this are the popular holiday destinations of Spain and Cyprus.
4.47 A comparison of Table 4.2 and Table 4.3 shows them to be fairly dissimilar with onlyfour out of the ten named countries appearing in both tables.
88. “Ryanair cuts 11 routes to Poland”, 9 February 2009, www.telegraph.co.uk 89. ‘Brits Abroad’, IPPR, 2006.90. Stocks of emigrants and where they reside are harder to count than immigrant stocks, as by definition the people are
now outside the UK. The only complete and up-to-date UK dataset available is the number of people receiving their UKstate pension overseas. Other sources of data used by the IPPR included local censuses and UK passports issuedoverseas. All of these data sources have their limitations, but collectively provide a useful basis for making estimates.
Chapter 4 Page 11September 2009

CAP 787 International Relations – The Growth in Air Travel to Visit Friends or Relatives
Source: IPPR estimates, ‘Brits Abroad’ – Appendix B and CAA Passenger Survey at the UK’s main international airports.
Note: Red font indicates a VFR proportion higher than average.
4.48 Compared with Table 4.2, the emigrant destinations are far less dispersed than theimmigrant origins, with over 27% of UK emigrants in either Australia or New Zealand,and a further 23% in North America. 80% of the total emigrant population isestimated to reside in the top ten named countries. This compares to less than onehalf of the immigrant population coming from the top ten countries in Table 4.2.
4.49 It should be noted that the extreme long haul nature of trips between the UK andAustralasia means that frequent trips are less likely, despite its appeal as a holidaydestination – even if fares were to fall, the journey time is still very significant. This,in part, may account for the higher VFR percentages on these routes – whilst VFRpassengers may be tied to the destination and make repeated or annual return trips,holiday passengers may be less likely to make repeated trips of such length.
4.50 Using the same data, an estimated 28% of total emigrants are based in the EU15countries, half of whom are in Spain, with minimal numbers (approximately 2%) in theEUA8 countries.
How does VFR traffic relate to migrant stocks?
4.51 Figure 4.5 combines the estimates of stocks of immigrants from and emigrants inanother country to give a 'migrant stock' figure which is indicative of the level of sociallinks between the UK and a range of countries in 200791. The chart also shows thelevel of VFR traffic in 2007 between the UK and each country.
Table 4.3 Estimated number of Britons abroad by country of residence (Top 10 countries), 2006
Country
Britons abroad
for a year or
longer (000s)
% of total
emigrant
population
Proportion of
VFR on air route
2007
1 Australia 1,300 23% 65%
2 Spain 761 14% 21%
3 United States 678 12% 32%
4 Canada 603 11% 57%
5 Ireland 291 5% 47%
6 New Zealand 215 4% 62%
7 South Africa 212 4% 56%
8 France 200 4% 34%
9 Germany 115 2% 35%
10 Cyprus 59 1% 23%
Others 1,115 20% 31%
Total 5,540 100% 32%
91. These numbers are estimates drawn from different sources reflecting the position at given points in time (2006 forimmigrants, 2007 for emigrants), thus they are only intended to give an indication of the relative levels of migrant linksacross countries.
Chapter 4 Page 12September 2009

CAP 787 International Relations – The Growth in Air Travel to Visit Friends or Relatives
Source: CAA Passenger Survey, excluding international-to-international connectors; Annual Population Survey 2007, ONS; IPPR ‘Brits Abroad’ 2006.
Notes:• ‘Other EU27’ countries are: Bulgaria, Cyprus, Czech Republic, Estonia, Hungary, Latvia, Lithuania,
Malta, Romania, Slovakia and Slovenia.• ‘Other EU15’ countries are: Austria, Belgium, Denmark, Finland, Greece, Luxembourg, Netherlands
and Sweden.
4.52 This figure illustrates that:
• destinations closer to the UK generate more traffic than longer-haul
destinations. This is backed up by academic research by the Centre for Researchand Analysis of Migration92, which found that optimised travel frequency isinversely related to distance and transportation costs of travel, and positivelyrelated to psychological costs of separation. The shorter the trip home (and thuscheaper both in time and money), the more frequently migrants travelled, but fortrips of shorter duration . On the assumption that these findings are robust overthe wider population, migrants between the UK and Europe are likely to makemore frequent but shorter trips than those with relationship links further afield. Theexception to this is VFR traffic to the US, which is noticeably high relative tomigrant stocks, and of this traffic, nearly one-quarter is travelling to New York.Although the CREAM study looks at 'current' migrant stocks (i.e. those away fromhome at a point in time), it is reasonable to assume that after an extended periodof temporary migration there could be a residual effect where migrants would wishto maintain links with their former host country, even after returning home.
• EU destinations generally show higher VFR traffic where migrant stocks are
higher, indicating a probable link between the two. This link may be facilitated bythe relative geographical proximity of the EU states, and so will be less apparentfor non-EU countries.
Figure 4.5 Summary of VFR passengers at the main UK international airports by country compared with immigrant and emigrant stocks, 2007
92. ‘Migration, Relationship Capital and International Travel: Theory and Evidence – Discussion Paper’, CDP 08/08, McCann,Poot and Sanderson; CREAM, Department of Economics, University College London (August 2008).
0.0
0.5
1.0
1.5
2.0
2.5
3.0
3.5
4.0
4.5
AustraliaCanada
IndiaUSA
Poland
Other EU A8Portugal
ItalySpain
GermanyFrance
Ireland
Other EU15
Pass
enge
rs a
nd m
igra
nt s
tock
s (m
illio
ns)
VFR passengers immigrant stocks emigrant stocks
Chapter 4 Page 13September 2009

CAP 787 International Relations – The Growth in Air Travel to Visit Friends or Relatives
4.53 Further analysis of these combined 'migrant stocks' shows that EU countriesaccounted for only 30% of the estimated 12 million migrant stocks in the world withlinks to the UK (either immigrants based here, or emigrants from the UK livingoverseas), but a much larger proportion (around 60%) of VFR traffic. This is illustratedin Figure 4.6, and is likely to be a reflection of relative costs (in time and money) oftravel.
Source: CAA Passenger Survey, excluding international-to-international connectors; Annual Population Survey 2007, ONS; IPPR ‘Brits Abroad’ 2006.
4.54 This analysis provides the basis for the separation of UK–EU VFR traffic from otherVFR traffic in the regression modelling summarised at the end of this Chapter – thereis evidence of a relationship between migrant stocks and VFR traffic, and that therelationship appears to be substantially different for the EU and non-EU groups.
UK net migrant flows
4.55 Figure 4.7 shows UK migration figures since 1991. Both total inflows and outflowshave been rising since 1997, reaching a peak in 2006. From 1998 to 2003 the overallnet inflow of migrants was around 150 thousand per year. There is a marked increasein the level of inward migration from 2004, which appears to be mainly from EUA8countries93.
4.56 Within this total, the IPS estimate for the period 2004–2007 is that 64% of the inflowof migrants to the UK from the EUA8 countries was from Poland94. This correspondsto the increased VFR traffic between the UK and Poland noted in paragraph 4.19.
4.57 Whilst the rapid increase in the net flow of immigrants has come from the EUA8countries, the total net flow in 2007 is also made up of significant migrant numbersfrom the 'new Commonwealth' and 'Other foreign citizens' groupings (see chart forthe definitions used). The largest flows within these groupings are:
• 'New Commonwealth' – India, Pakistan, Bangladesh and Nigeria
• 'Other foreign citizens' – USA, China, Japan and the Philippines.
Figure 4.6 Combined migrant stocks compared with international VFR passengers at the main UK international airports, 2007
93. Prior to 2004 these citizens were included w.ith the ‘Other foreign citizens’ category, which shows a reduction ofapproximately 13,000 net immigrants in 2004
94. ONS – MN33, Table 3.21, IPS A8 Cit 92-07.
0%
10%
20%
30%
40%
50%
60%
EU15 other EU North America Others
prop
ortio
n of
tota
l
estimated combined migrant stocks VFR passengers 2007
Chapter 4 Page 14September 2009

CAP 787 International Relations – The Growth in Air Travel to Visit Friends or Relatives
Source: ONS, Total International Migration, 1991–2007 (from International Passenger Survey data).Notes:
• From 2004 onwards, Malta and Cyprus are in ‘Other foreign citizens’ rather than ‘New Commonwealth’.• From 2004 onwards, the EUA8 countries are shown separately rather than in 'Other foreign citizens'.• ‘Old Commonwealth’ is made up of Canada, Australia, New Zealand and South Africa.• ‘New Commonwealth’ is all other Commonwealth countries, British Dependent Territories and British
Overseas Citizens.• ‘Other foreign citizens’ are those from outside the Commonwealth, EU15 and EUA8.• Nationality is defined as the nationality of passport the traveller is using.
4.58 Examining the component inflows and outflows, all country groups demonstrate'circular migration' (not all of migrants remain permanently in their host country –some return home, or move on to a third country). In the UK both immigrant andemigrant stock levels are increasing: in 2007, over five-sixths of the migrant inflowswere non-British nationals but only half of the outflows were. Table 4.4 shows howthe total flows grew in both directions between 2000 and 2007. There has been a fallin the inflow proportion represented by immigrants from outside of the EU and theCommonwealth. However, this is likely to be partially a result of the reclassificationof the EUA8 countries during the period (see footnote to Table 4.4).
Source: ONS, Total International Migration, 2000–2007 (from International Passenger Survey data).Note: * in 2000 EUA8 figures were included in ‘other foreign citizens’ .
Figure 4.7 UK Total International Migration, net flow by nationality, 1991–2007
Table 4.4 Total International Migration into and out of the UK by citizenship, 2000 and 2007
2000 2007
Inflow Outflow Net Inflow Outflow Net
British 99 21% 161 50% -62 75 13% 171 51% -96
EU15 63 13% 57 18% 6 79 14% 41 12% 128
EUA8 (from 2004) * * * 112 20% 25 7% 38
'old' Commonwealth 56 12% 32 10% 24 45 8% 31 9% 13
'new' Commonwealth 91 19% 15 5% 76 130 23% 26 8% 103
Other foreign citizens 169 35% 55 17% 114 131 23% 43 13% 88
Total 478 100% 320 100% 572 100% 337 100% 274
-600
-400
-200
0
200
400
600
800
1991
1992
1993
1994
1995
1996
1997
1998
1999
2000
2001
2002
2003
2004
2005
2006
2007
Mig
rant
s (th
ousa
nds)
British EU 15 EU A8 (from 2004)'old' Commonwealth 'new' Commonwealth Other foreign citizensNet balance Total inflow Total outflow
Chapter 4 Page 15September 2009

CAP 787 International Relations – The Growth in Air Travel to Visit Friends or Relatives
Regional impact of migration
4.59 Although UK regional airports currently only handle around one-third of UKinternational passengers, Figure 4.8 shows how migratory flows in and out of the UKare substantially higher (and growing) outside London. For example, it is reported thatthe recent wave of migrants from Eastern Europe has spread across the UK far morethan other migrant groups: the Economist quotes 21% of Eastern European nationalswithin the UK as living in London, compared with 41% of other foreign nationalsresident in the UK95.
4.60 This movement of people coupled with the development of new route networks atthe regional airports has provided both the means and a driver for increased VFRtravel outside London (bearing in mind that the London airports serve the whole ofthe South East).
Source: ONS, Total International Migration, 1991–2007.
Summary of key UK–world migrant links and VFR traffic
4.61 The origin/destination of immigrant and emigrant stocks give some indication ofwhere friends or relatives are likely to be located. Table 4.5 below summarises themost important links the UK has as a result of migration, their distance from the UKand changes in their accessibility by air.
95. “Poles Depart”, The Economist, 30 August 2008.
Figure 4.8 UK origin/destination of international migrants to and from the UK
-400
-300
-200
-100
0
100
200
300
400
500
1991
1992
1993
1994
1995
1996
1997
1998
1999
2000
2001
2002
2003
2004
2005
2006
2007
Mig
rant
s (th
ousa
nds)
London (inflow) London (outflow) Other UK (inflow) Other UK (outflow)
Chapter 4 Page 16September 2009

CAP 787 International Relations – The Growth in Air Travel to Visit Friends or Relatives
96
Ta
ble
4.5
Sum
mar
y of
key
UK
–wor
ld m
igra
nt li
nks
and
VFR
tra
ffic
UK
im
mig
ran
t sto
ck
sO
rig
inA
cce
ssib
ilit
y c
ha
ng
es
Ch
an
ge
s o
bse
rved
in
VF
R t
raff
ic*
Imm
igra
nts
from
Ind
ia,
Pa
kis
tan
an
d B
an
gla
de
sh
m
ake
up n
early
one
-fift
h of
UK
m
igra
nt s
tock
s.
The
imm
igra
nt p
opul
atio
n in
the
U
K f
rom
Po
lan
d h
as g
row
n ra
pidl
y. It
now
repr
esen
ts 7
% o
f al
l UK
imm
igra
nt s
tock
s.
Non
-EU
EU
UK
–Ind
ia r
oute
s ha
ve b
enef
ited
in r
ecen
t ye
ars
from
libe
ralis
atio
n96. T
o a
less
er e
xten
t th
ere
has
also
bee
n lib
eral
isat
ion
of t
he a
ir se
rvic
es
agre
emen
t (A
SA) b
etw
een
UK
and
Pak
ista
n.
How
ever
, as
imm
igra
nt s
tock
leve
ls w
ere
alre
ady
high
, the
effe
ct is
less
mar
ked,
and
the
di
stan
ce in
volv
ed m
eans
that
less
freq
uent
trip
s ar
e lik
ely.
Join
ing
the
EU
in 2
004
mea
nt P
olan
d be
cam
e pa
rt o
f th
e si
ngle
mar
ket
for
air
serv
ices
with
in
the
EU
. Ser
vice
s to
the
cou
ntry
hav
e in
crea
sed
larg
ely
as a
res
ult
of n
o-fr
ills
oper
atio
ns.
Sin
ce 2
003,
the
com
bine
d V
FR p
asse
nger
s to
Indi
a, P
akis
tan
and
Ban
glad
esh
have
tot
alle
d ov
er o
ne m
illio
n ea
ch y
ear (
the
maj
ority
tr
avel
ling
to In
dia
and
Paki
stan
), ha
ving
gro
wn
by a
roun
d th
ree-
quar
ters
sin
ce 2
001,
in li
ne w
ith o
vera
ll tr
affic
gro
wth
on
thes
e ro
utes
. The
pro
port
ion
of V
FR p
asse
nger
s to
the
se c
ount
ries
is
broa
dly
stab
le a
nd r
elat
ivel
y hi
gh, p
artic
ular
ly t
o Pa
kist
an a
nd
Ban
glad
esh
(typ
ical
ly o
ver
thre
e-qu
arte
rs).
For
pass
enge
rs t
o In
dia
it is
rat
her
low
er (a
t ar
ound
45–
50%
).
Tota
l UK
–Pol
and
VFR
pas
seng
ers
appr
oach
ed t
wo
mill
ion
in 2
007,
fr
om a
roun
d 10
0 th
ousa
nd in
200
0. T
he p
ropo
rtio
n of
VFR
on
UK
–Po
land
rou
tes
has
incr
ease
d fr
om a
roun
d on
e-th
ird in
200
0 to
tw
o-th
irds
in 2
007.
UK
em
igra
nt
sto
ck
sO
rig
inA
cce
ssib
ilit
y c
ha
ng
es
Ch
an
ge
s o
bse
rved
in
VF
R t
raff
ic*
UK
em
igra
nt s
tock
s ov
erse
as
are
fairl
y co
ncen
trat
ed in
de
stin
atio
n –
over
one
-qua
rter
in
Au
str
ali
a o
r Ne
w Z
ea
lan
d, a
nd
near
ly o
ne-q
uart
er in
US
A o
r C
an
ad
a.
The
maj
ority
of
rem
aini
ng U
K
emig
rant
s ar
e in
the
EU
15
. Th
ese
coun
trie
s ar
e al
so p
opul
ar
for
Brit
ish
hous
ehol
ds o
wni
ng a
se
cond
-hom
e ov
erse
as.
Non
-EU
EU
Exc
eptin
g U
SA, t
hese
des
tinat
ions
hav
e ha
d ge
nera
lly li
bera
l bila
tera
l ASA
s w
ith t
he U
K fo
r so
me
time.
The
new
libe
ral E
U–U
S A
SA is
too
re
cent
to
have
impa
cted
upo
n th
e nu
mbe
rs in
th
is s
tudy
.
Thes
e de
stin
atio
ns b
enef
ited
from
the
199
3 Th
ird P
acka
ge, w
hich
cre
ated
a s
ingl
e m
arke
t for
ai
r se
rvic
es a
cros
s th
e E
U. T
his
prec
eded
the
ra
pid
incr
ease
in n
o-fr
ills
oper
atio
ns.
VFR
tra
ffic
bet
wee
n th
e U
K a
nd b
oth
Aus
tral
ia a
nd t
he U
S
show
ed r
elat
ivel
y lo
w g
row
th b
etw
een
2000
and
200
7 (1
1% a
nd
6% r
espe
ctiv
ely)
, and
had
sta
ble
prop
ortio
ns o
f V
FR t
raff
ic (t
wo-
third
s fo
r UK
–Aus
tral
ia a
nd o
ne-t
hird
for t
he U
K–U
S).
By
cont
rast
, U
K–N
ew Z
eala
nd a
nd U
K–C
anad
a V
FR t
raff
ic g
rew
fast
er. T
here
w
ere
a si
mila
r nu
mbe
r of
pas
seng
ers
trav
ellin
g be
twee
n th
e U
K
and
Can
ada
as b
etw
een
the
UK
and
Aus
tral
ia (1
.4 m
illio
n) in
200
7,
whe
n V
FR a
ccou
nted
for
over
hal
f of
all
UK
–Can
ada
jour
neys
. U
K–N
ew Z
eala
nd t
raff
ic, a
lthou
gh g
row
ing
and
with
nea
rly t
wo-
third
s of
pas
seng
ers
trav
ellin
g on
VFR
, acc
ount
ed fo
r le
ss t
han
half
a m
illio
n V
FR p
asse
nger
s in
200
7.
UK
–EU
15 V
FR t
raff
ic h
as g
row
n by
ove
r th
ree-
quar
ters
bet
wee
n 20
00 a
nd 2
007,
with
the
pro
port
ion
of t
otal
tra
ffic
gro
win
g fr
om
arou
nd 2
0% in
200
0 to
30%
in 2
007.
It is
like
ly th
at th
e in
crea
sed
VFR
tra
vel a
s a
resu
lt of
EU
mig
ratio
n ha
s be
en a
mpl
ified
by
the
conc
urre
nt li
bera
lisat
ion
of t
he E
U a
viat
ion
mar
ket.
96.
See
par
agra
ph 4
.32.
*
at t
he C
ontin
uous
Sur
vey
airp
orts
, ove
r th
e pe
riod
2000
–200
7 un
less
spe
cifie
d ot
herw
ise.
Chapter 4 Page 17September 2009
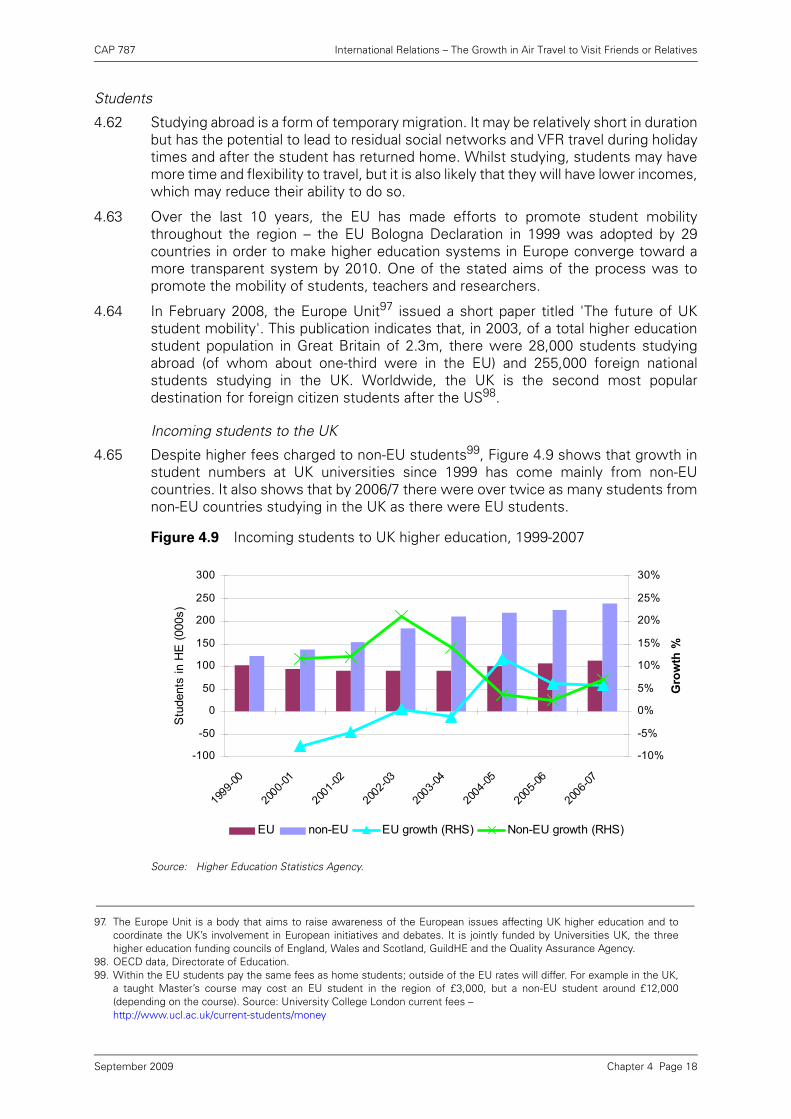
CAP 787 International Relations – The Growth in Air Travel to Visit Friends or Relatives
Students
4.62 Studying abroad is a form of temporary migration. It may be relatively short in durationbut has the potential to lead to residual social networks and VFR travel during holidaytimes and after the student has returned home. Whilst studying, students may havemore time and flexibility to travel, but it is also likely that they will have lower incomes,which may reduce their ability to do so.
4.63 Over the last 10 years, the EU has made efforts to promote student mobilitythroughout the region – the EU Bologna Declaration in 1999 was adopted by 29countries in order to make higher education systems in Europe converge toward amore transparent system by 2010. One of the stated aims of the process was topromote the mobility of students, teachers and researchers.
4.64 In February 2008, the Europe Unit97 issued a short paper titled 'The future of UKstudent mobility'. This publication indicates that, in 2003, of a total higher educationstudent population in Great Britain of 2.3m, there were 28,000 students studyingabroad (of whom about one-third were in the EU) and 255,000 foreign nationalstudents studying in the UK. Worldwide, the UK is the second most populardestination for foreign citizen students after the US98.
Incoming students to the UK
4.65 Despite higher fees charged to non-EU students99, Figure 4.9 shows that growth instudent numbers at UK universities since 1999 has come mainly from non-EUcountries. It also shows that by 2006/7 there were over twice as many students fromnon-EU countries studying in the UK as there were EU students.
Source: Higher Education Statistics Agency.
97. The Europe Unit is a body that aims to raise awareness of the European issues affecting UK higher education and tocoordinate the UK’s involvement in European initiatives and debates. It is jointly funded by Universities UK, the threehigher education funding councils of England, Wales and Scotland, GuildHE and the Quality Assurance Agency.
98. OECD data, Directorate of Education.99. Within the EU students pay the same fees as home students; outside of the EU rates will differ. For example in the UK,
a taught Master’s course may cost an EU student in the region of £3,000, but a non-EU student around £12,000(depending on the course). Source: University College London current fees – http://www.ucl.ac.uk/current-students/money
Figure 4.9 Incoming students to UK higher education, 1999-2007
-100
-50
0
50
100
150
200
250
300
1999
-00
2000
-01
2001
-02
2002
-03
2003
-04
2004
-05
2005
-06
2006
-07
Stu
dent
s in
HE
(000
s)
-10%
-5%
0%
5%
10%
15%
20%
25%
30%
Gro
wth
%
EU non-EU EU growth (RHS) Non-EU growth (RHS)
Chapter 4 Page 18September 2009
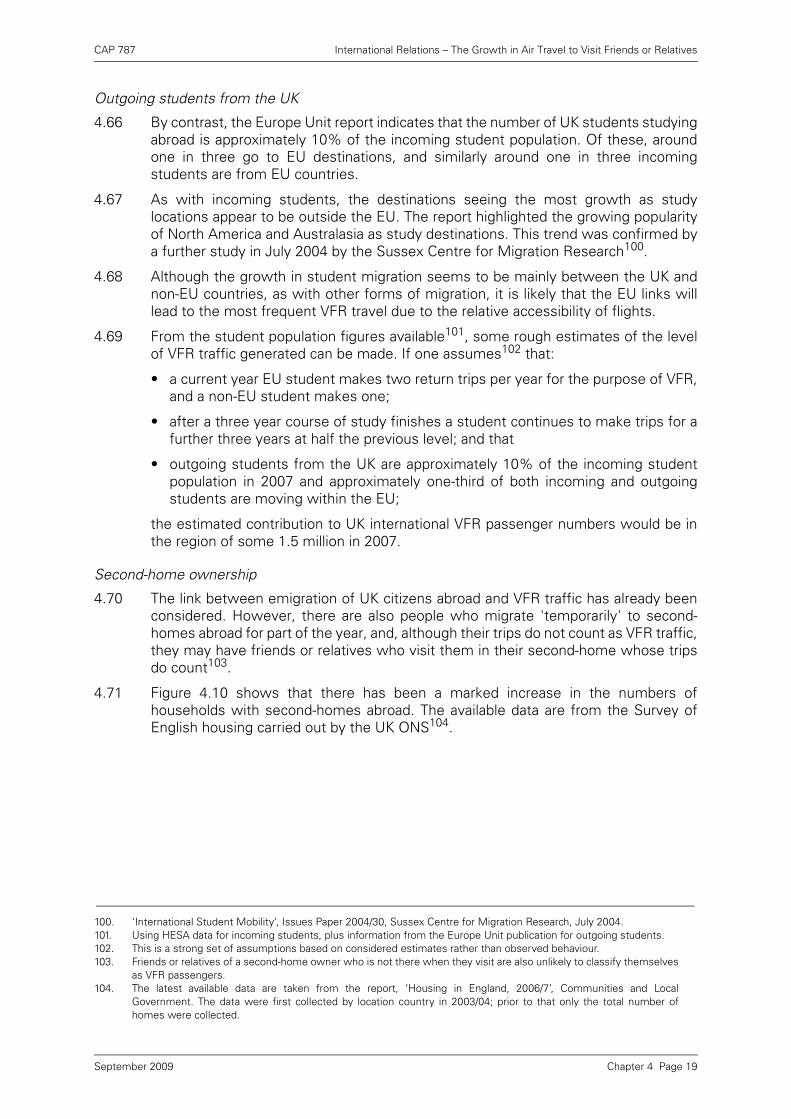
CAP 787 International Relations – The Growth in Air Travel to Visit Friends or Relatives
Outgoing students from the UK
4.66 By contrast, the Europe Unit report indicates that the number of UK students studyingabroad is approximately 10% of the incoming student population. Of these, aroundone in three go to EU destinations, and similarly around one in three incomingstudents are from EU countries.
4.67 As with incoming students, the destinations seeing the most growth as studylocations appear to be outside the EU. The report highlighted the growing popularityof North America and Australasia as study destinations. This trend was confirmed bya further study in July 2004 by the Sussex Centre for Migration Research100.
4.68 Although the growth in student migration seems to be mainly between the UK andnon-EU countries, as with other forms of migration, it is likely that the EU links willlead to the most frequent VFR travel due to the relative accessibility of flights.
4.69 From the student population figures available101, some rough estimates of the levelof VFR traffic generated can be made. If one assumes102 that:
• a current year EU student makes two return trips per year for the purpose of VFR,and a non-EU student makes one;
• after a three year course of study finishes a student continues to make trips for afurther three years at half the previous level; and that
• outgoing students from the UK are approximately 10% of the incoming studentpopulation in 2007 and approximately one-third of both incoming and outgoingstudents are moving within the EU;
the estimated contribution to UK international VFR passenger numbers would be inthe region of some 1.5 million in 2007.
Second-home ownership
4.70 The link between emigration of UK citizens abroad and VFR traffic has already beenconsidered. However, there are also people who migrate 'temporarily' to second-homes abroad for part of the year, and, although their trips do not count as VFR traffic,they may have friends or relatives who visit them in their second-home whose tripsdo count103.
4.71 Figure 4.10 shows that there has been a marked increase in the numbers ofhouseholds with second-homes abroad. The available data are from the Survey ofEnglish housing carried out by the UK ONS104.
100. ‘International Student Mobility’, Issues Paper 2004/30, Sussex Centre for Migration Research, July 2004.101. Using HESA data for incoming students, plus information from the Europe Unit publication for outgoing students.102. This is a strong set of assumptions based on considered estimates rather than observed behaviour.103. Friends or relatives of a second-home owner who is not there when they visit are also unlikely to classify themselves
as VFR passengers.104. The latest available data are taken from the report, ‘Housing in England, 2006/7’, Communities and Local
Government. The data were first collected by location country in 2003/04; prior to that only the total number ofhomes were collected.
Chapter 4 Page 19September 2009
CAP 787 International Relations – The Growth in Air Travel to Visit Friends or Relatives
Source: Communities and Local Government, Survey of English Housing.
4.72 This increase is likely to have been driven by a number of factors:
• increased travel to EU countries for other purposes means increased exposure toavailable opportunities and a familiarity with the location;
• the increase in the value of property in the UK leading to increases in householdwealth;
• access to low-cost air travel – increase in no-frills route networks, particularly topreviously little-used regional airports abroad;
• liberalisation within the EU allowing freedom of movement of capital within EUcountries105 and the enlargement of the EU opening up new areas for propertyinvestment;
• sterling–Euro exchange rate, which, up until recently, made investment in theEurozone an attractive proposition for those spending pounds sterling. However,the exchange rate had dropped from 1.6 at the start of 2000 to 1.1 in February2009106; and
• UK media representation of the possibilities of investing abroad – particularly asregards opportunities in countries new to the EU.
4.73 The split of second-homes owned abroad by British households, by location countryis shown in Table 4.6 – over three-quarters are estimated to be within the EU. One-third are in Spain alone, and about one-quarter in France. The total owned is estimatedto have doubled between 1999/00 and 2006/07 although detailed location breakdownis not available prior to 2003/04.
Figure 4.10 English households with second-homes (three-year moving average)
105. The free movement of capital includes the rights of citizens and businesses to purchase property such as a holidayhome or secondary residence in a different Member State. While free movement applies to all Member States, atthe time of the accession of the new Member States, transitional periods and some exceptions were negotiated forthe free movement of capital. These concern, to a highly limited extent, the purchase of property and agricultural andforest land in specific States.
106. Bank of England, monthly average spot rates.
0
50
100
150
200
250
300
1996
/97
1997
/98
1998
/99
1999
/00
2000
/01
2001
/02
2002
/03
2003
/04
2004
/05
2005
/06
2006
/07Hou
seho
lds
with
sec
ond
hom
es (0
00s)
England Other GB Abroad
Chapter 4 Page 20September 2009

CAP 787 International Relations – The Growth in Air Travel to Visit Friends or Relatives
Source: Housing in England 2006/7, Communities and Local Government and CAA Passenger Survey, excluding international-to-international connectors.
4.74 It is likely that there is commonality between factors that have driven the increasesin VFR traffic and the purchase of second-homes, along with some feedback effectwhereby the increased ownership of second-homes has led to further increases inVFR. It is difficult to separate out the specific impact that second-home ownershiphas on VFR traffic, however, as there are only limited times-series data available.
4.75 The website www.cheapflights.co.uk gives advice to would-be second-homepurchasers, with an overview of which European airports are convenient for whichregion, and even which airlines currently fly there107. The website suggests avoidingreliance on one flight a week from the UK to the destination. Added to this is the highlevel of churn that has been seen on some thinner routes to regional airports asairlines test out new routes and then cut those that are less profitable – which couldpotentially leave the new home-owner with an accessibility issue.
4.76 Press articles108 have indicated that recent route cuts are affecting UK second-homeowners. The Times109 estimates no-frills airlines will cut nearly 60 routes fortheir winter 2008 schedules, many to France, Italy and Spain. Cutting routes makesjourney costs higher in terms of both time and probably money, making frequent tripsless appealing. For example, in November 2007, Monarch Airlines cut its Gatwick toGranada service, meaning second-home owners in the region normally living south ofLondon now have to fly to Malaga which is a two hour drive away, or traverse Londonto take the Ryanair flight from Stansted to Granada.
Statistical analysis
4.77 The following analysis uses regression modelling to quantify the potentialrelationships considered previously in this Chapter between VFR traffic and otherfactors. However, due to limitations and restrictions in the data available, the resultsare likely subject to a high degree of uncertainty and any inferences drawn from themshould be treated cautiously. Key limitations to the data are the time period covered(a period where the time-varying factors considered have shown an upward trend),the countries included, and the reliance on survey data.
Table 4.6 Second-home ownership abroad 2006/7 by British households
France Spain Italy Portugalother
EU
Total
EU
United
States
Other
non-EU
Total
non-EUTotal
Number of households (000’s)
60 81 7 10 38 196 11 44 55 248
Proportion of GB-owned second-homes
24% 33% 3% 4% 15% 79% 4% 18% 21% 100%
Estimated growth in VFR traffic, 2000–2007
132% 193% 96% 240% 104% 122% 7% 64% 45% 83%
107. http://www.cheapflights.co.uk/travel-tips/buying-homes-abroad/108. “Property overseas: Fasten seatbelts – turbulence ahead”, www.telegraph.co.uk, 7 November 2008.109. “Airline squeeze hits holiday homes”, www.timesonline.co.uk, 10 August 2008.
Chapter 4 Page 21September 2009

CAP 787 International Relations – The Growth in Air Travel to Visit Friends or Relatives
4.78 Data from 27 countries110 over the period 2000–2007 were used. The available datawere split into EU and non-EU destinations, and the two datasets modelledindividually. The analysis was undertaken through two separate types of modelling –the first looked at changes in VFR traffic over time, and the second at relative levelsof VFR traffic across the countries.
4.79 The results obtained from the first stage modelling tentatively support the view thatthe 'experience of migration'111 by country and the level of UK GDP are bothpositively related to changing levels of VFR traffic over time. Fares also appear to havean impact, although this relationship cannot be satisfactorily isolated. A summary ofthe model form and final coefficient estimates obtained is shown in Table 4.7 (forfurther details, see Annex A).
4.80 The models indicate a positive relationship between the experience of migration andVFR traffic (at the five Continuous Survey airports) between the UK and each country,with the increase far larger for those countries in the EU. The models estimate anincrease in VFR passengers of eight for each new European migrant experience, and0.6112 for each non-EU migrant experience. Given that one trip equates to twopassengers, this converts to an estimated four113 trips per year generated by eachUK–EU migrant (either taken themselves or by friends or family visiting them).
110. These were the countries with significant migrant flows into and out of the UK over the period. See Annex A for a fulllist.
111. The sum total of immigrant flows into the UK and UK national emigrant flows out on a cumulative basis since 1999 –this total is not reduced for those migrants who subsequently leave their host country – thus it gives an estimate ofthe number of new people who have ‘experienced migration’ in the period.
Table 4.7 Estimated fixed effects models for total VFR traffic to and from the UK to destination country
yit = ui + b1x1it + b2x2it
Where:
yit = VFR passengers (thousands) between UK and country i in year t (at the five
Continuous Survey airports)
ui = individual country effect – a time-invariant constant
x1it = cumulative increase in migration experience between UK and country i from
1999 to year t
x2it = UK GDP (£ billions), 2003 prices
EU (n=10) Non-EU (n=17)
Coefficient Variable description
Coefficient estimate
p–value Coefficient estimate
p–value
b1 Increase in migrant experience (thousands)
7.8 0.002 0.6 0.024
b2 UK GDP (£ billions, 2003 prices)
1.2 0.081 0.7 0.004
112. With a 95% confidence interval between 0 and 0.6 trips per year.113. With a 95% confidence interval between 1.8 and 6 trips per year.
Chapter 4 Page 22September 2009

CAP 787 International Relations – The Growth in Air Travel to Visit Friends or Relatives
4.81 The models also indicate a positive relationship between UK GDP and VFR trafficlevels. This should be interpreted cautiously as there is an upwards trend in both UKGDP and VFR traffic over the period; and there is also evidence in both the EU andnon-EU datasets of a positive relationship between GDP and migration levels and anegative relationship between fares (which aren’t included in the final model) andGDP. However, a statistically significant relationship is found in both datasets for UKGDP, and the coefficient estimates can be used to calculate country-level incomeelasticities of 1.0 for the EU group and 1.2 for the non-EU group (at 2007 mean grouplevels).
4.82 By using the traffic data from the Continuous Survey airports only, the results do notreflect the behaviour at the regional airports. However, as the regional airports havelittle traffic to and from non-EU countries, the non-EU model would be unlikely tochange materially even with inclusion of these data.
4.83 These models consider the changing levels of VFR over time, but they cannot explainthe factors influencing the relative levels of VFR by country. The key observation fromthese models is that the vast majority (around 95%) of the variance in VFR trafficcomes from country-specific individual effects. This is supported by Figure 1.3, whichshowed how despite the growth from EU countries, the level of VFR traffic from, forinstance, the US had remained high back to 2001.
4.84 These individual effects are estimated as constants, and are a reflection of bothobservable and unobservable factors, which may affect the relative levels of VFRtraffic across the countries. The constancy of these estimated relative VFR levels maynot hold over the long term, but it is likely to be a reasonable approximation for theperiod considered.
4.85 Using constant relative VFR levels as the dependent variable introduces theoreticalproblems which may affect the coefficient estimates made and the certaintysurrounding them. However, some basic exploration using linear regressionmodelling indicates that, for the 27 countries considered, the relative levels of VFRtraffic between the UK and a country are influenced by:
• Membership of Commonwealth – socio-cultural ties with the UK have a positiveimpact on VFR traffic. Many of the big immigrant stock countries (India,Bangladesh and Pakistan) and emigrant stock countries (Australia, Canada andNew Zealand) are in the Commonwealth, and it is likely that this variable acts as aproxy for the migrant stock levels in 1999 (prior to the period of changing levelsmodelled).
• Distance from London (miles) – reflects the cost of flying in terms of both timeand money, and has a negative relationship with VFR traffic. This variable is highlycorrelated with membership of the EU and thus there is no need for an EU dummyvariable in the model.
• Relative size and income of the country – country-specific GDP and populationvariables are clearly not time-constant, but over the period in question they providea broadly stable indicator of the differences in relative size and income of thecountries. (The magnitude of the variance of these factors is far greater betweenthe countries than within the countries across the time period, and their effectcould not be estimated with statistical significance in the first stage fixed-effectsmodel.)
• Spain – this country has a significantly higher level of VFR traffic than othercountries in the sample that cannot be explained by the other factors considered,but is likely due to the special relationship that the UK has with Spain in terms ofits popularity as a retirement destination and location for second-homes.
Chapter 4 Page 23September 2009

CAP 787 International Relations – The Growth in Air Travel to Visit Friends or Relatives
4.86 Whilst these results are far from conclusive, they show evidence of the expectedrelationships and potentially provide a useful foundation for further work in this area.Further explanation of the methodology and data sources used are covered in theannexes A and B.
Chapter 4 Page 24September 2009

CAP 787 International Relations – The Growth in Air Travel to Visit Friends or Relatives
Annex A Statistical Analysis
Introduction
A.1 This annex provides more detail behind the modelling work summarised in Chapter 4(paragraphs 4.77–4.86). The panel data used in the model-building process comprises27 countries (see Table A 1) for the period 2000–2007. Migrant flow data by countryare only published by the ONS for the largest flows in each year, and this was a keyrestriction on the dataset used.
A.2 Analysis elsewhere in the study indicates that UK–EU VFR traffic has grownparticularly rapidly compared with UK–non-EU VFR traffic. Splitting the data into EUand non-EU destinations, and modelling the two datasets individually, the possibilityof interaction between distance from the UK and the variables under consideration isallowed for (e.g. immigration from a nearby country may lead to more frequent VFRtrips than immigration from a country further away).
A.3 The analysis was undertaken in two stages:
1) investigating how changes in VFR traffic between the UK and another countryover time is related to other variables that also vary over time114; then
Table A 1 Countries used in regression model-building
EU (n=10) Non-EU (n=17)
Belgium Australia
Czech Republic Bangladesh
France Canada
Germany China
Greece Hong Kong
Hungary India
Italy Japan
Netherlands Malaysia
Poland New Zealand
Spain Pakistan
Philippines
Singapore
South Africa
Switzerland
Turkey
United Arab Emirates
USA
114. As opposed to those factors which are constant over time, for example, distance from the UK.
Annex A Page 1September 2009

CAP 787 International Relations – The Growth in Air Travel to Visit Friends or Relatives
2) output from the first-stage models which gives an indication of relative VFRtraffic levels between the UK and the countries was considered. Althoughsimplistic, exploratory work was conducted in order to identify those time-constant (or near-constant for the period) factors which impact upon theserelative VFR traffic levels across the countries.
A.4 Neither set of models offer any contra-indications to the more discursive analysisalready presented elsewhere in the study. Although intuitive and broadly in line withexpectations, the conclusions drawn from this quantitative work are limited for thefollowing reasons:
• Restricted number of countries investigated: the countries included were dictatedby the availability of country-specific IPS migration data115.
• Restricted years of data used – prior to 2000, CAA Passenger Survey data are notavailable at all five Continuous Airports annually. The data used span a periodwhere all the time-varying factors have shown an upward trend – thus increasingthe likelihood of spurious results appearing statistically significant.
• “Noisy” data coming from surveys: VFR traffic, fares data and migration data allcome from surveys, and are subject to sampling error. This introduces samplingvariability into the dependent variable making it more difficult to identifyrelationships with other variables – a problem which is compounded by the factthat some of the relevant explanatory variables are also only available from surveydata and are subject to various restrictions and assumptions (e.g. fares andmigration data).
• The inter-related nature of some of the variables: interactions between variablesmake estimation of the individual effects difficult.
Modelling changes over time
Methodology
A.5 Where there is substantial cross-sectional variance in panel data, there are twosuitable options for model-building – fixed or random effects. The type of model usedwill depend on the views held about the behaviour of the country-specific interceptterms116.
A.6 A random effects analysis assumes that the sample of countries used is drawnrandomly from the larger population of all countries in the world, and that theregression could be informative for all countries. A fixed effects model assumes thatthe model is specific to the sample of countries used. Ideally, a statistical Hausmantest would be performed to ascertain the most appropriate model. However, thedifference in the coefficient vectors was not positive definite, (likely due to the smallsample size) meaning this test could not be carried out.
A.7 In the absence of the Hausman test results, other evidence points towards the useof a fixed effects model. In both datasets, the estimated country-specific interceptsshow correlation with the regressors (of around 0.3). It is reasonable to consider thatthe magnitude of the migrant flows are correlated to the country-specific intercepts,with those countries with a relatively higher level of VFR traffic likely to also generatehigher levels of migrant stocks.
115. IPS – MN33, tables 3.20abc, ONS. The data is only published for the ‘Top 10’ countries in each year, hence data is onlyavailable for those countries with significant migrant flows.
116. There is another possibility when using panel data, which would be to build a ‘pooled’ model which assumes noindividual country effect. Given the nature of the data, this was not considered appropriate.
Annex A Page 2September 2009

CAP 787 International Relations – The Growth in Air Travel to Visit Friends or Relatives
A.8 Further, given that the sample consists only of those countries which haveexperienced large migrant flows with the UK, a fixed effects model seems moreappropriate with the intercept terms treated as specific to the countries rather thanas additional random disturbances. The implication of using fixed effects models isthat the results are specific to the countries considered rather than to all the countriesin the world.
A.9 It is likely that some of the assumptions made in the model as defined above areviolated due to the nature of the data.
• Heteroskedasticity across the panels (countries) – that is, the variance of eit will bedifferent depending on the country – is likely given that the mean passengernumbers are so different by country.
• Serial correlation is also likely to be a problem within the countries, given thenature of the data.
A.10 Both of these problems were tested for during analysis in Stata using the commands'xtserial'117 and 'xttest3'118 and problems found. To allow for this, the standard errorsof the coefficients within the fixed effects models were calculated using the Huber-White robust variance estimator that allows for both panel-wise heteroskedasticityand serial correlation within the panels.
A.11 The robust estimator is valid in the presence of any heteroskedasticity or serialcorrelation in the error terms (eit), provided that T (number of time periods) is smallrelative to N (number of countries), which is the case here. The robust estimator(generally) has the effect of increasing the standard errors of the coefficientsestimated.
117. ‘xtserial’ tests for serial correlation of residuals in a linear panel data model by performing a Wald test on the nullhypothesis of no serial correlation. Where there is no serial correlation, the residuals from the regression of the first-differenced variables should have an autocorrelation of -0.5. Thus the coefficient on the lagged residuals in a regressionof the lagged residuals on the current residuals should be -0.5. See Drukker (2003) and Wooldridge (2002) for furtherdetails.
118. ‘xttest3’ – although the errors may be homoskedastic within the countries, it is possible the variance will differ acrosscountries (‘groupwise heteroskedasticity’). Given the variance in their relative magnitude, this is likely. ‘xttest3’calculates a modified Wald statistic for groupwise heteroskedasticity in the residuals of a fixed-effect regression model.‘Residual diagnostics for cross-section time series regression models’ – Christopher F. Baum, The Stata Journal (2001),Number 1, pp. 101–104.
Annex A Page 3September 2009

CAP 787 International Relations – The Growth in Air Travel to Visit Friends or Relatives
A.12 Linear regression models were built that attempt to explain the variation in VFR trafficto and from the UK over the period 2000–2007. Relative differences in absolute VFRvolumes between countries are absorbed into a country-specific constant. Therefore,a model will be a good fit if the country’s y above or below the country mean issignificantly correlated with the country’s individual x values above or below thecountry’s mean x values.
A.13 The country-specific constant allows for heterogeneity between the countries –acknowledging that there are both country-specific unobservable factors along withcountry-specific time-invariant factors which cannot be estimated using a model ofthis form. An example of a country-specific time-invariant factor is a dummy variabledenoting whether a country is a member of the Commonwealth. This had to bedropped from the models as it does not vary over time for any of the countries.However, an EU dummy could potentially be included as some of the countriesbecame members during the time period.
A.14 Modelling was carried out using data in absolute numbers in order to isolate theaverage effect of migration, by individual migrant experience, on total VFR traffic –with the assumption that the existing level of migrant stock would not impact uponthe frequency of travel for a new migrant (or his/her associated friends orrelatives)119.
A.15 Also, by using the data in levels, the assumption is made that income elasticity variesby income level. There is scope for further work, which has not been pursued here,in exploring the assumptions made and potentially devising further models to test adifferent set of assumptions.
Summary of Model form: fixed effects panel data regression
yit = ui + bxit + eiteit = error terms, assumed distributed independently and normally with mean 0, variance σe.i= 1,2, .....27 (the countries considered)t = 2000, 2001, ....2007 (the years considered)
estimated by:yit = ui + bxit
Where:yit = number of passengers to/from country i at time tui = individual country effect - a country-specific, time-invariant constant. Has variance σu.b = coefficients for variables xit xit = independent variables related to country i at time t
This type of model effectively removes the country-level means from both sides of the model, and thus regresses:
(yit – mean(yi)) = (ui – ui) + b(xit – mean(x)i) + (eit – mean(ei))
Models were estimated using xtreg in Stata using fixed effects, with robust standard errors (to allow for serial correlation and heteroskedasticity in the error terms).
119. Further, the prevalence of zero within the migration data presents theoretical difficulties to transforming these data.
Annex A Page 4September 2009

CAP 787 International Relations – The Growth in Air Travel to Visit Friends or Relatives
Dependent variable
A.16 The dependent variable modelled was total VFR traffic (combining both UK andforeign residents) by country of origin/destination. These data were obtained from theCAA Passenger Surveys 2000–2007 at the Continuous Airports (Heathrow, Gatwick,Manchester, Luton and Stansted). In earlier years, surveys were not conductedannually at all five airports. The CAA Passenger Survey was deemed the mostappropriate passenger data to use because passenger numbers are weighted at aroute level, thus generating more accurate totals by destination.
A.17 Passenger origin/destination was defined as the airport at which the intervieweeended their journey. For some passengers, whose journey involves a change of plane,this will not be the same as the destination airport (or country) of the flight which theywere boarding when interviewed. Passengers who arrived at the survey airport froman international origin and flew on to an international destination ('international-to-international connectors') were excluded, since these passengers are likely to havedifferent drivers of demand to VFR passengers travelling to and from the UK, and awide choice of interline airports.
Potential explanatory variables – time-varying
A.18 The explanatory variables considered as potential drivers behind changes in the levelof VFR traffic were:
• migration experience (cumulative foreign inflows and UK outflows from 1999);
• fares (return economy fares, 2007 prices);
• UK GDP (sterling, 2003 prices) and country-specific GDP (international dollars atpurchasing power parity, 2007 prices);
• EU accession (dummy variable);
• number of British households with a second-home abroad.
Further details of these data, their sources and the limitations in using them areshown in Annex B.
Model-building
A.19 For both the EU and non-EU models, the three factors that appear to have a significanteffect on changes in total VFR traffic are the change in migrant stocks, UK GDP andfares. Table A 2 shows the correlation coefficients of the key variables considered inthe model-building process. For the EU dataset in particular, the high correlationbetween fares and the other variables, along with the general trends observed,means that the effect of fares in isolation is not found to be statistically significantusing the data available for migration and UK GDP.
Table A 2 Correlation of key variables
EU dataset (n=10) Non-EU dataset (n=17)
VFR traffic Migration experience
UK GDP VFR traffic Migration experience
UK GDP
Migration 0.8 0.5
UK GDP 0.3 0.4 0.1 0.4
Fares -0.5 -0.4 -0.6 -0.1 0.1 -0.3
Annex A Page 5September 2009

CAP 787 International Relations – The Growth in Air Travel to Visit Friends or Relatives
A.20 Table A 3 summarises the models built for both datasets. In part, the final model formwas established with consideration for the stability of the coefficients estimated andhow they varied as the model was respecified, and also with a view to building acomparable model for both datasets.
A.21 The final models for both datasets indicate that the vast majority of the variation stilllies within the country-specific terms – particularly for the non-EU data.
Table A 3 Summary of stage one model-building – comparison of EU and non-EU models
Model EU (n=10) Non-EU (n=17)
Model a: Fares, change in migrant experience and UK GDP
UK GDP not significant at the 5% level.
Fares not significant at the 5% level.
Model b: Fares, change in migrant experience
Similar coefficient for migration whether UK GDP or fares is included as the 2nd explanatory variable.
Both UK GDP and fares when used in a 2 variable model with migration are statistically significant at 10% level.
Model less stable than with EU – using a 2 variable model with either fares or UK GDP gives a rather different coefficient for migration, but fares not found to be statistically significant when used in a 2 variable model.
Model c (final): Change in migrant experience and UK GDP
Similar coefficient for migration whether UK GDP or fares used.
A 2 variable model using UK GDP gives a similar migration coefficient to using all 3 variables.
Final models – time-varying factors
The models take the form:vit = ui + b1X1it + b2X2it
Where:vit = VFR passengers (thousands) between UK and country i in year t ui = individual effect for country i X1it = cumulative increase in migration experience between UK and country i from 1999 to year t) X2it = UK GDP, billions international dollars at purchasing power parity 2007 prices
EU (n=10) Non-EU (n=17)
Coefficient estimate
p–value 95% confidence interval
Coefficient estimate
p–value 95% confidence interval
Increase in migrant experience (thousands)
7.8 0.002 3.5 – 12.0 0.6 0.024 0.1 – 1.1
UK GDP (£ bns)
1.2 0.081 -0.2 – 2.6 0.7 0.004 0.3 – 1.1
Sigma_u 698.1 881.8
Sigma_e 176.2 73.5
Rho = (fraction of variance due to u_i)
0.94 0.99
Annex A Page 6September 2009

CAP 787 International Relations – The Growth in Air Travel to Visit Friends or Relatives
A.22 The models indicate a positive relationship between the experience of migration andtotal VFR traffic between the UK and each country, with the increase far larger forthose countries nearer to the UK. The models estimate an increase in VFRpassengers of eight for each new European migrant experience, and 0.6 for each non-EU migrant experience. Given that one trip equates to two passengers, this convertsto an estimated four trips per year generated by a UK–EU migrant (either takenthemselves or by friends or family visiting them). Both of these coefficient estimateshave a 95% confidence interval that is mainly above zero in both models, againindicating that a positive relationship is likely.
A.23 By modelling using absolute migrant stock levels (rather than growth rates), themodel implicitly assumes that the behaviour of a single migrant is not related to theexisting levels of migrant stock from or in that country.
A.24 It is unlikely that a migrant who has returned home will continue to generate the samefrequency of VFR trips indefinitely, but it is likely that the time series used here is tooshort to illustrate this.
A.25 The models indicate a positive relationship between UK GDP and VFR traffic levels.Interpretation of these coefficients for GDP (b2) should be cautious as there isevidence in both the EU and non-EU datasets of a positive relationship between GDPand migration levels, and a negative relationship between fares and GDP, both ofwhich make estimates of the effect of GDP in isolation more uncertain. Coupled withthis is the upward trend of both UK GDP and VFR traffic over the period.
A.26 As estimated from the 2007 means120, the income elasticities for the two countrygroups are calculated as 1.0 for the countries in the EU group and 1.2 for the countriesin the non-EU group. These estimates are only based on the countries modelled andthe results cannot be reliably extrapolated over an expanded group of countrieswithout further analysis. However the results are interesting in that they arenoticeably lower than the income elasticities of 1.5–1.8 estimated for all leisurepassengers for the period 1993–2003 in a previous CAA study121.
A.27 For the countries considered, these income elasticity estimates indicate that,compared with other leisure traffic, VFR traffic is less responsive to changes inincome over time. And, similar to the leisure passenger income elasticities estimatedpreviously, the European elasticity is lower than that for non-European traffic.
A.28 The results obtained support the view that migration122 and growth in income areboth positively related to the changing levels of VFR traffic. To an extent, fares willalso have an impact, although this relationship is harder to uncover – particularlywithin the EU where migration and fares have both likely been substantially affectedby EU enlargement in 2004.
A.29 However, the most important observation from this model is that the vast majority(around 95%) of the variance of the dependent variable comes from the country-specific individual effects (which are time invariant), which these models do notattempt to explain. These individual effects are a reflection of both unobservable andtime-constant factors which may all affect the relative levels of VFR traffic across thecountries and are constant over time. This property of constant relative VFR levelsmay not hold over the long term, but it is likely to be a reasonable approximation forthe period considered.
120. Taking total observed VFR traffic for both groups in 2007 and dividing by the number of countries, i.e. for the EU group,n=10; and for the outside-EU group, n=17.
121. Demand for Outbound Leisure Travel and its Key Drivers, CAA, December 2005122. As measured by the ‘experience of migration’, i.e. those people who have migrated at some point, rather than current
migrant stocks.
Annex A Page 7September 2009

CAP 787 International Relations – The Growth in Air Travel to Visit Friends or Relatives
Modelling the country–specific individual effects
Dependent variable
A.30 A linear regression model was used to explore the impact of various factors on thelevels of the relative levels of VFR traffic estimated by the country-specific individual.This modelling took no account of the uncertainty inherent in the estimated individualeffects and thus will tend to underestimate the standard errors of the coefficientestimates. However, the estimates do, at least, provide useful pointers to therelationships present.
Potential explanatory variables – time constant
A.31 The explanatory variables considered to be potential drivers behind the relative levelsof VFR traffic by country were:
• Commonwealth membership in 2007 (dummy variable – 0 or 1);
• Distance (estimated as Great Circle Distance miles from main country airport toLondon Heathrow);
• EU membership in 2007 (dummy variable – 0 or 1);
• Relative size and income of each country – although these are not time-constantfactors, over the short period looked at, the distribution of these over the countriesis likely to be fairly stable.
o Country-specific GDP 2007 in international dollars at purchasing powerparity123;
o Country-specific population 2007123 ;
o Gini coefficient (a measure of the equality of wealth distribution within thecountry)124.
Model building
A.32 Linear regression modelling indicated the following explanatory factors are significantin explaining the variance between country-specific intercepts: Commonwealthmembership, distance from London, the relative size and income of the countries(country GDP and population for 2007 were used as indicators for this). However, anexamination of the plot of residuals indicates that Spain is an outlier, with a particularlyhigh relative level of VFR traffic. Although the USA is also an outlier (in terms of itsintercept value), it is fits reasonably well using the models.
A.33 The need for a dummy variable for Spain indicates that it has a particularly large VFRmarket that is not clearly related to the other factors investigated. This is likely to bea combination of factors that make it a particularly attractive leisure destination, suchas climate, coastline and historical popularity as a leisure destination.
A.34 A key variable in the first model (looking at changes in VFR over time) was the changein migrant stocks in each year over the period. It would have been preferable to havethe opening migrant stocks, i.e. the immigrant and emigrant balances in 1999, butthese are not readily available. Thus, the effect of this group is contained within thecountry-specific intercepts, and it is reasonable to suggest that opening migrantstocks would be highly correlated with the data that we have been able to use. Inparticular, membership of the Commonwealth was identified earlier in this study toas related to the largest groups of migrant stocks.
123. WEO database 2008. Although country-specific GDP and population were previously considered in the context of theoriginal fixed effects model, it is likely that changes over the 8 years from the mean were too small relative to the effectof the mean of these variables for them to be significant.
124. CIA – The World Factbook
Annex A Page 8September 2009

CAP 787 International Relations – The Growth in Air Travel to Visit Friends or Relatives
Annex B Data Used in Regression Modelling
Migration experience
B.1 Ideally, migrant stock data (stocks of foreign nationals living in the UK by country oforigin, and stocks of UK emigrants living abroad by country of destination), would beused. However, these data are not available by year across a wide range of countries,and there is no viable method of imputation. But, given the nature of the model,migrant stocks in 1999 can be treated as time-invariant (and thus the effect of theseis contained within the country-specific intercept term) and flow data over the period2000–2007 used to measure the change in migrant stocks instead.
B.2 The source for these data was the table 'Migratory flows by place of last/nextresidence' (table 3.20abc, MN series, ONS). These tables give totals estimated fromthe IPS for overlapping two yearly periods for the following categories:
• foreign citizens immigrating to the UK;
• UK citizens immigrating to the UK (presumably returning from a temporaryresidency abroad);
• UK citizens emigrating from the UK; and
• foreign citizens emigrating from the UK (presumably leaving after a temporaryresidency in the UK).
B.3 There are a number of points to consider regarding these IPS data:
• These data will include survey sampling errors which will add to the variances inthe model.
• In order to reach total international migration (TIM) figures, the ONS performsfurther adjustments to IPS figures. The adjusted TIM figures are not published indetail by last/next residence so IPS data have been used here.
• The IPS figures are published as two-year totals (e.g. migrants in 1999 + 2000).Here these totals were divided by two and allocated to the second year in the pair.Thus some sort of 'smoothing' effect was introduced to the data.
• The IPS publish country-level figures only for the ten largest flows in any two-yearperiod. Therefore, as migrant numbers have increased over time, the minimumflow recorded has tended to increase over time.
• Where a country does not feature in the top 10 in a given year (but does at somepoint over the period), the imputed flow for the year was zero – this createsadditional variance in the data, and is likely to understate the real flow in the year.
B.4 Various forms of the migration variable were constructed – the least restrictive formwas of four increasing balances – foreign citizen inflows to the UK, foreign citizenoutflows, UK citizen inflows and UK citizen outflows. In both the EU and non-EUmodels, only the accumulated foreign inflows to the UK and accumulated UK nationaloutflows were found to be significant at the 10% level, and with broadly similarcoefficients (particularly in the EU dataset). Thus these two variables were combinedto generate a 'migration experience' variable.
B.5 Rather than being a measure of the stock of 'current' migrants, the migrationexperience variable is a measure of the number of people who have immigrated oremigrated, regardless of whether they have subsequently returned home. This allowsfor the possibility of VFR journeys as a result of relationships built during the period
Annex B Page 1September 2009
CAP 787 International Relations – The Growth in Air Travel to Visit Friends or Relatives
of migration, even after the migrant has returned. No account is taken of migrantstock who have died, or the residual effect of prior migration on VFR travel to diminishover time. However, over a short time period, both these factors are likely to have arelatively small impact.
Fares
B.6 The fares data used were taken from the CAA Passenger Survey for the ContinuousAirports between 2000 and 2007. A number of restrictions were placed on the datato facilitate the fares calculations:
• Unweighted data were used.
• Only fares reported as paid in GBP were included, which means foreign-paid faredhave been excluded from the calculations. We assume that these will generallymove in line with the sterling equivalents.
• Only fares for the ticket type 'Economy full fare' and 'Economy other' have beenincluded.
• Return fares have been used, and where necessary it has been assumed that asingle is equivalent to 50% of a return fare – (the majority of interviewees with areturn fare in any year was generally around 95%).
• Fares for each year were expressed in 2007 prices, a conversion being made fromthe survey data using the annual RPI index.
UK GDP and country-specific GDP
B.7 UK GDP in sterling at 2003 prices was obtained from the ONS (data series ABMI). Forother countries, GDP at Purchasing Power Parity (PPP) in current international dollarswas sourced from the World Economic Outlook (WEO), April 2008 database125.
B.8 Country-specific GDP was not found to be a significant explanatory variable. It is likelythat the magnitude of variation in this variable over time relative to the difference incomparative sizes across the countries is small. Therefore, this variable wasconsidered again when looking at time-invariant factors as an indicator for relativeincome and size of a country.
EU accession
B.9 In the EU model, a dummy variable which captured the joining of the accession statesin 2004 was included. However, it was not found to be statistically significant, and itis likely that the effect of accession is incorporated into the fares and migrationvariables.
Second-homes abroad
B.10 There are only limited data on UK ownership of homes overseas. The available dataare from the Survey of English Housing carried out by the UK ONS. Although datahave been collected in total for a number of years, the location of second-homes hasonly been asked since the 2003/04 survey, and is published as a percentage split ofthe total. As the total number of second-homes abroad are published for other years,and assuming the same distribution across locations, the actual number of housesprior to 2003/4 can be imputed. However, the assumptions made in order to carry outthe imputation will certainly have reduced the variability one might expect to see inthe actual data on location of second-homes, if they were available.
125.The PPP rate between two countries is the rate at which the currency of one country needs to be converted into that ofa second country to ensure that a given amount of the first country's currency will purchase the same volume of goodsand services in the second country as it does in the first. In these data, GDP is expressed in US dollars at PPP. By usingconsumer inflation data, also from the WEO database, these GDP figures were expressed in 2007 prices.
Annex B Page 2September 2009

CAP 787 International Relations – The Growth in Air Travel to Visit Friends or Relatives
B.11 Discussion earlier in the study indicates that a number of factors impacting on VFRtraffic will also have impacted on the growth in ownership of second-homes (forinstance, increased route networks operated in the EU). This is reflected in thepositive correlation seen between VFR traffic and the imputed second-homes data.
B.12 However, given the extent of the imputation necessary to generate this variable (overboth time and country) it was not considered robust enough to be included in theregression analysis, although the imputed data showed a high correlation with VFRtraffic (0.7 in the EU dataset).
Annex B Page 3September 2009

INTENTIONALLY LEFT BLANK
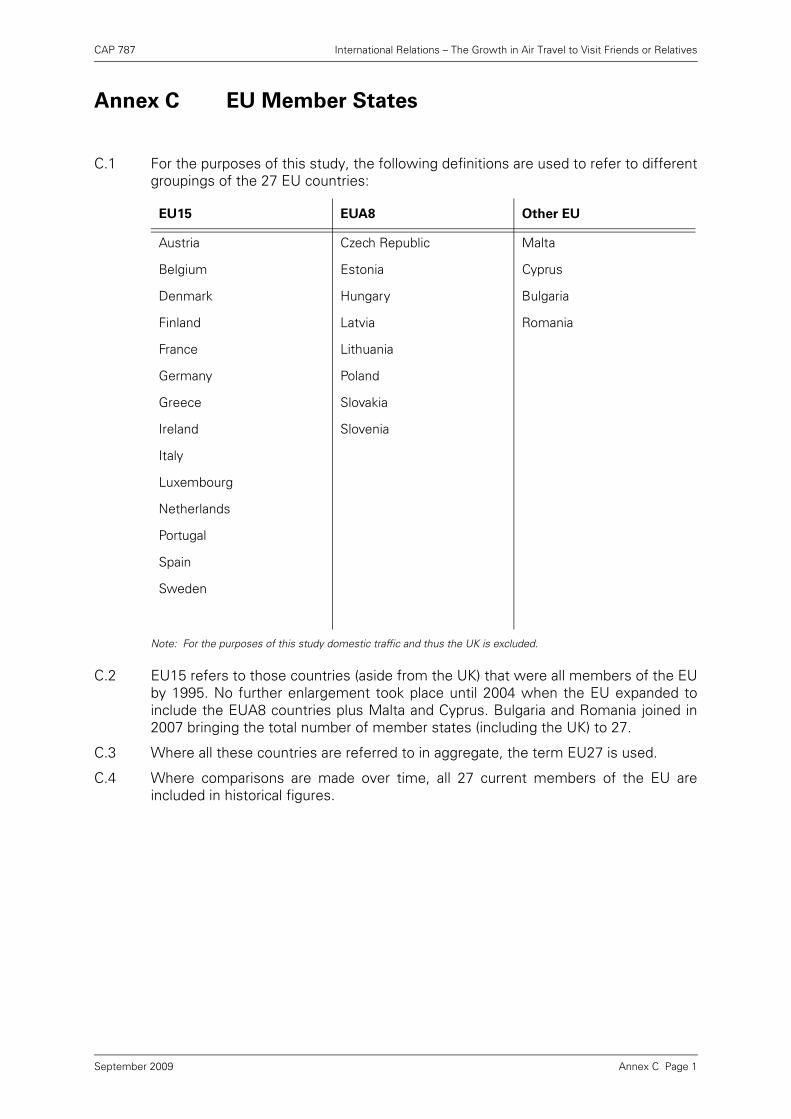
CAP 787 International Relations – The Growth in Air Travel to Visit Friends or Relatives
Annex C Page 1
Annex C EU Member States
C.1 For the purposes of this study, the following definitions are used to refer to differentgroupings of the 27 EU countries:
Note: For the purposes of this study domestic traffic and thus the UK is excluded.
C.2 EU15 refers to those countries (aside from the UK) that were all members of the EUby 1995. No further enlargement took place until 2004 when the EU expanded toinclude the EUA8 countries plus Malta and Cyprus. Bulgaria and Romania joined in2007 bringing the total number of member states (including the UK) to 27.
C.3 Where all these countries are referred to in aggregate, the term EU27 is used.
C.4 Where comparisons are made over time, all 27 current members of the EU areincluded in historical figures.
EU15 EUA8 Other EU
Austria Czech Republic Malta
Belgium Estonia Cyprus
Denmark Hungary Bulgaria
Finland Latvia Romania
France Lithuania
Germany Poland
Greece Slovakia
Ireland Slovenia
Italy
Luxembourg
Netherlands
Portugal
Spain
Sweden
September 2009

INTENTIONALLY LEFT BLANK