capabilities and choices: do they make sen’se for ... · attempts to bring the various components...
TRANSCRIPT
Capabilities and Choices: Do They Make Sen’sefor Understanding Objective and Subjective Well-Being?An Empirical Test of Sen’s Capability Frameworkon German and British Panel Data
Ruud Muffels • Bruce Headey
Accepted: 5 December 2011 / Published online: 29 December 2011� The Author(s) 2011. This article is published with open access at Springerlink.com
Abstract In Sen’s Capability Approach (CA) well-being can be defined as the freedom
of choice to achieve the things in life which one has reason to value most for his or her
personal life. Capabilities are in Sen’s vocabulary therefore the real freedoms people have
or the opportunities available to them. In this paper we examine the impact of capabilities
alongside choices on well-being. There is a lot of theoretical work on Sen’s capability
framework but still a lack of empirical research in measuring and testing his capability
model especially in a dynamic perspective. The contribution of the paper is first to test
Sen’s theoretical CA approach empirically using 25 years of German and 18 years of
British data. Second, to examine to what extent the capability approach can explain long-
term changes in well-being and third to view the impact on subjective as well as objective
well-being in two clearly distinct welfare states. Three measures of well-being are con-
structed: life satisfaction for subjective well-being and relative income and employment
security for objective well-being. We ran random and fixed effects GLS models. The
findings strongly support Sen’s capabilities framework and provide evidence on the way
capabilities, choices and constraints matter for objective and subjective well-being.
Capabilities pertaining to human capital, trust, altruism and risk taking, and choices to
family, work-leisure, lifestyle and social behaviour show to strongly affect long-term
changes in subjective and objective well-being though in a different way largely depending
on the type of well-being measure used.
Keywords Subjective and objective well-being � Happiness � Work-leisure choices �Income security � Employment security � Sen’s capability approach �German and British panel data � Fixed effects GLS models
R. Muffels (&)Department of Sociology/ReflecT, Tilburg University, P.O. Box 90153, 5000 LE Tilburg,The Netherlandse-mail: [email protected]
B. HeadeyMelbourne Institute of Applied Economic and Social Research, Melbourne University,801 Swanston St, Parkville, Melbourne, VIC 3052, Australiae-mail: [email protected]
123
Soc Indic Res (2013) 110:1159–1185DOI 10.1007/s11205-011-9978-3
1 Introduction
There is a plethora of studies on the theoretical aspect of the capability approach (CA) of
Sen, but contrasting little evidence and lack of research on the measurement of capabilities
especially in a dynamic perspective. The need to address empirical research on the CA is
however acknowledged (see e.g. Schokkaert 2007; Stiglitz et al. 2009). In this paper we
test Sen’s capability model by viewing the impact of capabilities and choices on well-being
using 25 years of German and 18 years of British data. The basic idea is to test Sen’s CA
framework for explaining long-term changes in objective (OWB) and subjective well-
being (SWB).
Three measures of well-being are constructed: life satisfaction for SWB and relative
income and employment security for OWB. The test makes use of two of the richest panel
data sets in terms of breath and depth; the German panel for 1984–2008 (SOEP) and the
British one for 1991–2008 (BHPS), both containing extended information on important
determinants of well-being such as personality traits, human, social and cultural capital,
employment status, health, life values, time use, and work-leisure and life choices. The
paper builds forth on earlier attempts to explain non-transient long-term changes in well-
being (Headey and Wearing 1992; Headey et al. 2010, 2011).
1.1 Outline
The paper is organized as follows. Section 2 discusses the capability framework and how it
can be used in empirical research to study well-being. Subsequently, in Sect. 3 the
empirical model is explained while in Sect. 4 some evidence is presented on the applied
well-being measures. Section 5 reports on the estimation results of the random and fixed
panel regressions and in Sect. 6 we end with conclusions and some discussion on how to
progress in future research.
2 Theoretical Framework and Conceptual Model
2.1 Well-Being: Objective or Subjective
In much of Sen’s work he views well-being as being primarily objective, whereas others,
especially in the realm of psychology, adopt a subjective interpretation (Headey 1993,
2008; Headey et al. 2008; Diener and Oishi 2000; Kahneman 2003; van Praag and Ferrer-i-
Carbonell 2004; Kahneman and Krueger 2006; Clark et al. 2008a, b). Sen was critical
about stated or subjective measurement because disadvantaged people might report high
levels of SWB partly due to ignorance or deficiencies in their knowledge of the range of
choices that ought to be available to them. Another argument is related to adaptation and
anticipation effects: people in their subjective assessment of the quality of their lives adapt
themselves rather quickly to a new situation (e.g. a rise in income or wealth) or even
anticipate to future changes and adjust their judgment and behavior accordingly suggesting
that though income or resources changes affect peoples’ well-being or poverty status in the
short run they do not in the longer run (Easterlin 2001; Clark et al. 2008b; Ball and
Chernova 2008). Arguments in favor of the subjective interpretation concerns the claims of
especially psychologists that beliefs and motivations affect behavior but also of sociolo-
gists’ that well-being is relative referring to the ‘keeping up with the Joneses’ argument;
people tend to judge their own well-being relative to others by comparing their own
1160 R. Muffels, B. Headey
123
situation with their peers’ as in social comparison and relative deprivation theory (Fest-
inger 1954; Runciman 1966). Whereas most studies either use objective or subjective
measures the joint use of these will in our view provide a better insight into the relationship
between people’s capabilities and their choices or behavior (cf. Oswald and Wu 2010). The
literature on the subject further shows that the concepts of well-being such as happiness,
life satisfaction, psychological stress, affect or subjective welfare are interchangeably used
even though they measure dissimilar concepts. Common to all approaches however is that
a distinction is made between objective and subjective measures of well-being (Schokkaert
2007).
2.2 Sen’s Notions of Capabilities and Functionings
According to Sen, well-being can be defined as the freedom of choice to achieve the things
in life which one has reason to value most for his or her personal life. In Sen’s vocabulary
the freedoms are the capabilities to achieve particular functionings (the doings and beings)
such as finding a partner, getting a job or following education. Capabilities are the real
freedom people have or the opportunities and choices available to them. Central is ‘freedom
of choice’: people, in Sen’s view, should have the opportunities to achieve the functionings
they have reason to value most for their personal lives (Sen 1983, 1993, 1999a, b, 2004,
2005; Muffels et al. 2002; Alkire 2007; Nussbaum 1997). The choices people make during
their life are dependent on their capabilities which impact their well-being outcomes.
However, the societal and economic context imposes constraints on the choices and hence
on the well-being outcomes. These constraints refer to income or liquidity and employment
and health constraints holding people back on their preferred choices.
Direct empirical measures for peoples’ capabilities viewed as the ability to achieve
certain functionings are obviously very difficult to define. The approach in this paper is
therefore to define indirect measures based on empirical data. The capability framework
translates in our approach into a ‘capabilities-choices-events’ (CACHE) model. From a
dynamic perspective we might argue that capabilities and choices pertain to stocks and
flows respectively. Within the life satisfaction literature there is—to our knowledge—little
to no empirical work done testing Sen’s framework in this way. Previous studies viewed
the role of life values (Headey 2008) and events such as divorce and job loss or recurrent
unemployment (Winkelmann and Winkelmann 1995; Clark et al. 2008a). Others also
looked into the role of particular choices, such as the choice of a partner or children
(Diener et al. 1999; Powdthavee 2007; Cuven et al. 2010). No study to our knowledge
attempts to bring the various components of Sen’s model together.
2.3 A Capability-Choice-Events Approach
The capabilities or stocks are indicated by the amount of economic, social, cultural and
psychological capital people possess:
• Economic capital pertaining to wealth, human capital endowments and skills (Becker
1975)
• Social capital (Putnam 2000, 2005) pertaining to the level of trust in other people and
the social networks people are involved in, indicated by the frequency of contact with
others and the support people get from others in their network (bonding social capital),
but also the membership of organizations and associations or clubs such as trade
unions, social and sport clubs (bridging social capital)
Capabilities and Choices 1161
123
• Cultural capital pertaining to individual values and life goals, such as work, family and
social values like helping others and volunteering, but also life goals such as forming a
family, raising children or making a career and to risk attitudes such as risk taking or
risk aversion (Dohmen et al. 2011)
• Psychological capital pertaining to people’s personality traits, generally indicated by
the so-called ‘big five’: extraversion, agreeableness, conscientiousness, emotional
stability, and openness to experience (e.g. Diener et al. 1999).
These forms of capital impact on peoples’ life chances and opportunities although the
returns in terms of happiness depend on peoples’ efforts and choices or their doings and
beings. The doings are the efforts or choices themselves, such as caring or volunteering, or
the decision to invest in the career through training, job search, exercising etc. Peoples’
efforts and choices are however not necessarily voluntary. People might have to make
involuntary choices due to constraints associated with the occurrence of events such as
dismissal, divorce, disability, death of the partner or a child etc. The inclusion of events
makes the capability model ‘path-dependent’ since the sort of events people experience
over time and how long they lasts, tend to affect their well-being. The life satisfaction
literature suggests that though most events only have temporary effects the adverse effect
of particular events like disability, the death of a child, job displacement, or recurrent
unemployment on life satisfaction might persist rather long (cf. Clark et al. 2008b).
2.4 Capabilities and Choices
Human capital can be seen as a capability affecting people’s well-being over time. Further
education and training is an investment in human capital and the career, just like overtime
work. Health is a capability because it is partly determined by people’s genetic heritage
and partly the return to an investment in a healthy or unhealthy life style irrespective of
people’s genetics. Exercising, sport activities and smoking and drinking are choices or
investments in one’s health. Trust in other people is a capability while it induces coop-
eration that pays-off in returns and social support. The time invested in meeting other
people can be seen as a choice to invest in social capital. The frequency of social contacts
and whether people get support from their friends or neighbors, another dimension of
social capital, indicate the capability of people to build up a social network. Risk attitudes,
but also life goals can be seen as capabilities being part of people’s cultural capital just as
religion or religious denomination is. In the literature it is shown that life goals matter for
SWB (Headey 2008). These life goals can be divided into economic (success in job,
affording luxuries, owning a house etc.), family (importance of having children or a
partner), and social goals (altruism, get support from neighbors, good relationships with
friends).1 According to Headey (2008) economic life goals represent zero sum and family
and social life goals positive sum domains. In zero sum domains gains for one always
imply losses for others whereas in positive sum domains, gains are either not at the costs of
others or even improve those of others. The time spent in volunteering and caring is an
investment in cultural capital. Another component of cultural capital pertains to risk
attitudes in the form of risk-seeking or risk-averse behavior while they influence people’s
achievements and outcomes.
1 The distinction between family, social and economic life goals is based on performed principal compo-nents analysis on the data (see Sect. 3 on data and methodology).
1162 R. Muffels, B. Headey
123

2.5 Events
Events are voluntary or involuntary choices (constraints) affecting future outcomes.
Divorce can be seen as an event following a decision to split with large consequences for
people’s well-being. But also marriage tends to have long-term consequences just like
unemployment or stopping a business. There is ample evidence in the literature on the
positive effects of marriage and the negative effects of divorce and unemployment on SWB
(Gangl 2006; Headey 2008; Clark et al. 2008a; Headey et al. 2010). The two panel surveys
now permit to define a variety of events, like moving into poverty, job displacement, early
retirement, divorce, marriage etc.2
2.6 The ‘Capabilities-Choices-Events’ (CACHE) Model
The model is presented in Fig. 1. Well-being is the outcome of the interaction process
between capabilities and choices. Using panel data we can associate levels of and changes
in capabilities to particular choices by viewing the sequence of changes in capabilities and
choices over time. However, some reverse causation between capabilities and choices
might exist. People might adapt and change for example their life goals in the next period
when the desired choice cannot be realized due to constraints.
2.7 The Empirical Model
The capability model is aimed at explaining objective and subjective well-being over time
but leaves the question into the relationship of SWB and OWB aside. Though this rela-
tionship is interesting for further scrutiny it is not the main purpose of the paper, that is, to
view the separate impact of capabilities and choices on various measures of well-being
used in the literature. In Sect. 4, we show that the concepts of OWB and SWB are clearly
Capabilities -stocks (capital):
- Human capital
- Social capital
- Psychologicalcapital
- Cultural capital
Choices-flows- Choices-Investments
-Events (choices-constraints)
Well-being:- Objective (OWB)
- Subjective (SWB)
Fig. 1 A ‘capabilities-choices-events’ (CACHE) model of well-being based on Sen’s capability approach
2 In the German panel study we were able to derive events from the annual and monthly calendar infor-mation on labour market status. The German panel contains a calendar in which information is asked aboutthe socio-economic status of the respondent for each of the 12 months preceding the interview date. Also theBritish panel contains monthly information on people’s activities. The calendar information permits toassessing changes over people’s work history and life course. Most of the events are however derived fromthe annual information at the time of the interview.
Capabilities and Choices 1163
123

associated but that the correlations are all below 0.35 indicating that they pertain to
different concepts. We therefore expect that some of the correlates of SWB (such as
personality traits) will have low correlations with OWB and vice versa, that particular
correlates of OWB (such as human capital endowments) have low correlations with SWB.
2.8 Country and Welfare Regime
We use evidence for two countries to test Sen’s approach in two rather different welfare
states.3 For interpretation of the differences across the two countries we make use of the
Varieties of Capitalism (VOC) literature (Hall and Soskice 2001). According to the VOC
literature the two countries represent two different types of market economies: a strongly
coordinated (Germany) and a weakly coordinated, more or less liberal type (United
Kingdom). The question addressed is to what extent Sen’s CA model is able to explain
well-being in these two countries representing two different market economies. The dis-
tinction is relevant for Sen’s framework because people’s ‘capabilities’ are to a large extent
influenced by the level of their human capital obtained through education, learning on the
job and training. The coordinated type is now typified by a so-called ‘specific skills’ regime
and the weakly coordinated one by a ‘general skills’ regime (see also Esteves-Abe et al.
2001). We therefore suspect that a ‘specific skills’ regime due to the non-transferability of
these skills to other employers meet particularly problems to ensure employment security
for particularly the low-skilled whereas a ‘general skills’ regime due to the way markets
work might encounter problems to ensure low-skilled workers income security or income
stability over the career. The British education system is suspected to have ‘meritocratic’
features because of which the low educated might have more chances to make a career and
move upwards on the career ladder attaining higher wage levels than the low educated in
Germany who have worse chances to escape a low level job or to improve their career.
3 Data and Methodology
3.1 Data
We used the German and the British panel covering respectively 25 (1984–2008) and
18 years (1991–2008) of data. We included all persons of 16–65 years. All incomes were
deflated by the consumer price index. The data were weighted with the product of the
cross-sectional weights and the staying factors (the probability to stay in the panel across
two consecutive waves). We created a person-year file while including information from
the monthly calendars for the entire period.
The information on risk attitudes and life values were collected in only four years
(SOEP) of the German panel. The UK data do not contain information on risk attitudes and
in only three waves information was asked about social values, the last time in 2008.
Though values might change over time they turn out to be rather stable across the 3 and
4 years of observation in the British and German panel. We therefore imputed the values
for the missing years in between by taking the average of the values between 2 years if
available for that particular person. We also used the information on time use which was
available for many years in the German and some years in the British panel. Even though
3 The interpretation of the occurring differences between the two countries is not straightforward sincesample and design differences might impact the comparison. The sample framework and design though ofthese two panel studies are however very similar (see Sect. 3.1).
1164 R. Muffels, B. Headey
123

time use information reflect preferences as well as behavior and therefore tend to change
more over time than just values, for avoiding losing too many observations we imputed the
values for the missing years by calculating the average of the values for the two non-
missing years which are closest to the missing year.
3.2 Three Measures for Objective and Subjective Well-Being
In this paper we use objective and subjective measures of well-being indicated by three
yardsticks: income and employment security and life satisfaction:
• Income security is defined as escaping relative low income statuses. We calculated the
ratio of each person’s equivalent household income in proportion to the 60% income
poverty threshold as used by the OECD and Eurostat. The income measure is a rather
well-known continuous measure of ‘relative income’ very similar to Sen’s well-know
‘income inequality’ or ‘income deprivation’ measure though his inequality measure
was defined as a weighted gap between income and the income threshold (weighted
with the level of inequality among the poor) instead of the ratio. The income
information in both panels refers to the last year’s income period but in Germany this is
the last calendar year whereas for the UK it is the current year running from the last
interview in the period October-December last year to the same interview period this
year. For Germany we therefore assigned the t ? 1 income to the current year whereas
for Britain we used the information as it is given for the current year.
• Employment security is defined as the number of weeks people were full-time or part-time
employed in the current year. Since the information in both panels is asked for the
preceding year we assigned the values of the next year to the current year. People might
however choose for part-time employment because they cannot find a full-time job. But
when people prefer to work part-time and they are able to realize their preferences they
should be considered as being employment-secure. For that reason we correct for whether
the part-time or full-time work corresponds to people’s working time preferences or not.
We correct for the voluntary nature of a low attachment to the labor market by deriving a
variable indicating whether people want a job or prefer not to work. Unemployed and
inactive people in the British as well as the German panel were asked whether they actively
search for a job or not and whether they are available for work and can start in due course. In
the second step we used this information to define a job or hours match variable indicating
whether the actual working hours match peoples working time preferences or not. In the
latter case they are overworked (work more hours than they want) or underworked (work
less hours). Unemployed and inactive people are assumed to be underworked if they
actively look for a job, otherwise they are classified as having their preferences met.
• Life satisfaction is measured in the usual way on a scale of 0–10 as in Germany or 1–7
as in the UK, 0 indicating the lowest level and 10 or 7 the highest. The life satisfaction
question is asked every single year in the German panel but only as of 1996 in the
British panel and missing for 2001, so for 11 years only. We transformed the British
scale into a 0–10 scale. According to set-point theory (Diener and Oishi 2000; Headey
1993; Headey et al. 2010) people’s life satisfaction score remains rather stable over
time because each individual tend to stay on his or her own track, dependent in
particular on a person’s score on the ‘big five’ social-psychological traits. Shocks
associated with health impairments or life events (such as unemployment, marriage/
divorce) may cause people to depart from their long-term path but only temporarily;
people tend to recover rather quickly to return to their quasi permanent baseline track.
Capabilities and Choices 1165
123

3.3 The Empirical Model
We employed random and fixed effects panel regression models to allow correcting for
unobserved heterogeneity or individual effects. This is important because capabilities are
unobserved factors which are likely to be associated with the observed measures for capa-
bilities that we included in our models such as education level and participation in training.
Even though we were able to incorporate many capability and choices indicators we cannot
rule out the possibility that we only partly capture the unobserved heterogeneity related to
factors as ability, motivation and effort. The fixed effects (FE) models correct for this provided
that these unobserved factors are assumed to be time constant. The FE models show the impact
of changes in the covariates such as capabilities, choices and events on changes in well-being
since the model takes the difference of the dependent and independent variables with the
means over time. The random effects (RE) models show the impact of time constant but
important factors such as gender, education level and being an immigrant etcetera on measures
of SWB and OWB which are removed in the fixed-effects models. More importantly, the
random effects models show the relative size of the effects of personality traits (measured only
once) compared to those of capabilities, choices and events. For these reasons we estimated
random and fixed effects panel regression models separately for the three measures of sub-
jective well-being (SWB), income security (YS) and employment security (ES):
SWBit ¼ a0 þ bXit þ d1Traitsþ d2Stocksþ d3Choicesþ d4Eventsþ li þ ct þ eit ð1Þ
YSit ¼ Yeqit =plt ¼ a0 þ bXit þ d1Traitsþ d2Stocksþ d3Choicesþ d4Eventsþ li þ ct þ eit
ð2Þ
ESit ¼X52
w¼1
Emplw ¼ a0þbXitþ d1Traitsþ d2Stocksþ d3Choicesþ d4Eventsþliþ ctþ eit
ð3Þ
where income security (YSit) is the ratio of equivalent income of each individual at time t to
the level of the poverty line (plt) in the country for year t as defined by the 60% of the
median household income threshold (Yeqit =plt). Employment security is defined as the
number of weeks employed in the current year (Emplw) and life satisfaction or subjective
well-being (SWB) as the score on the life satisfaction scale in the current year ranging from
0 to 10. The Xit’s represent a set of control variables either time invariant like sex, living in
East Germany and ‘born in a foreign country’ or time varying, like age, age squared,
education level, number of children, life course stage and whether people are seeking work
or not. The traits, capabilities and events variables are also included either as time invariant
variables, like personal traits or risk attitudes (part of capabilities), or as time varying such
as choices and events. The ct represents a time-specific effect that is assumed to correct for
business cycle influences indicated by the yearly changing unemployment rate for each of
the periods (1980s, 1990s or 2000s). The ui represent the unobserved heterogeneity or
individual effects and the disturbance is given by eit. The SWB scale is ordinal and ranges
from 0 to 10.4 However, a cardinal treatment of it renders more or less the same results
(Diener et al. 1999; Clark et al. 2008a). The advantage of treating the life-satisfaction scale
4 Because SWB is basically an ordinal scale some researchers used ordered probit or ordered logit forestimation. However, since the scale ranges from 0 to 7 in Britain and 0–10 in Germany (and hence contains7–11 mass points), the linearity assumption as implied by treating it as a cardinal scale is not seriouslyviolated. A test using Kernel density estimates and kernel density plots on the data confirms this.
1166 R. Muffels, B. Headey
123
in a linear manner is that we can correct for unobserved individual effects estimating GLS
random and fixed effects models.
3.4 Variables
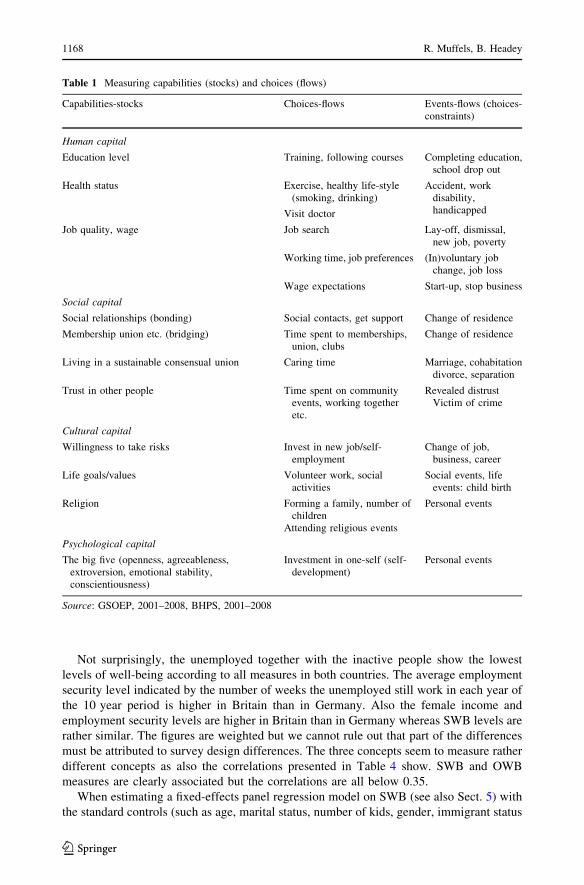
The most important variables are of course the variables indicating the capabilities, choices
and events. Table 2 shows the definition of the included variables in the model. We, firstly,
added some obvious controls knowing to be important correlates of well-being such as
gender, age, age squared and immigrant status. For Germany we added a variable indicating
whether they are living in former East-Germany since well-being levels are known to be
lower in the former East. We added as control also a life-course oriented household type
variable indicating the marital status and life-stages of people (single, single parent family
with young children, couple with young children, empty nest etc.). We included as indi-
cators for capabilities measures for genetic or psychological capital, human capital and
social and cultural capital. Genetic capital is measured through the ‘Big Five’ personality
traits. Human capital is measured through highest attained education level and training
efforts. For Germany as well as Britain we used the international education level classifi-
cation called ISCED to distinguish between three levels of education (high, intermediate and
low). Social capital is measured through the frequency of contacts with friends and relatives,
the support they get from others in their social network and through the level of ‘trust in
other people’. The amount of cultural capital is measured by the so-called life goals dealing
in Germany with the importance of certain aspects in life such as altruism, success in job,
what people can afford, being happy with the partner, having children, friends, travel and
social or political activities and owning a house. The life goals list in the British panel
largely pertains to the same items such as the importance of partner and children, of friends,
owning a house, having success in work and good health. We employed for both countries a
principal components factor analysis on these life goals and the results (not given here) show
that there remain basically three main factors in Germany and two factors in Britain which
we called the economic (in Germany success in job and to afford things, and in Britain:
success in job, to afford things and living an independent life), family (importance of partner
and children) and social life goals (in Germany and in Britain importance of friends).
Because of the low loadings in Germany of ‘owning a house’ and ‘travel’ and ‘participation
in social and political activities’ we removed these items. We did not weigh the factors with
the factor loadings but just took the aggregated scores on the variables belonging to the two
dimensions. Eventually we included a number of events as listed in Table 1. For Germany
and Britain we constructed a limited set of events based on the monthly and/or annual
information in the panel with a view to employment and marital status. These events are
getting divorced, getting married or cohabiting, early retirement, start or stop one’s own
business and an involuntary job change due to dismissal, being laid-off or a business close
down. The constructed well-being indicators for income security (YS) and employment
security (ES) and subjective well-being (SWB) refer to the current year whereas the events
refer to the change from the last calendar or last financial year to the current year.
4 First Evidence on the Three Well-Being Measures
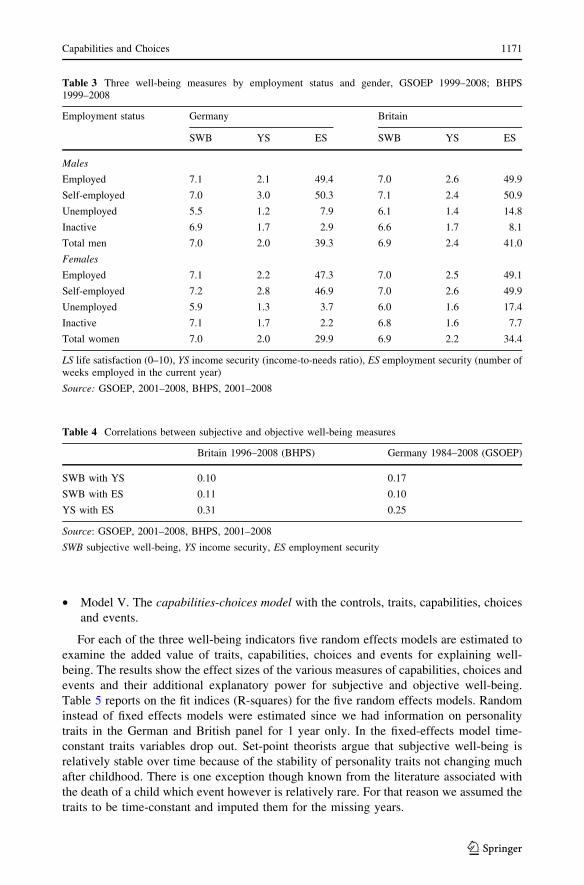
In Table 3 some evidence is presented on the levels of our three well-being measures:
subjective well-being (SWB), income security (YS) and employment security (ES) by
employment status for the years 1999–2008 in Germany and Britain.
Capabilities and Choices 1167
123
Not surprisingly, the unemployed together with the inactive people show the lowest
levels of well-being according to all measures in both countries. The average employment
security level indicated by the number of weeks the unemployed still work in each year of
the 10 year period is higher in Britain than in Germany. Also the female income and
employment security levels are higher in Britain than in Germany whereas SWB levels are
rather similar. The figures are weighted but we cannot rule out that part of the differences
must be attributed to survey design differences. The three concepts seem to measure rather
different concepts as also the correlations presented in Table 4 show. SWB and OWB
measures are clearly associated but the correlations are all below 0.35.
When estimating a fixed-effects panel regression model on SWB (see also Sect. 5) with
the standard controls (such as age, marital status, number of kids, gender, immigrant status
Table 1 Measuring capabilities (stocks) and choices (flows)
Capabilities-stocks Choices-flows Events-flows (choices-constraints)
Human capital
Education level Training, following courses Completing education,school drop out
Health status Exercise, healthy life-style(smoking, drinking)
Accident, workdisability,handicappedVisit doctor
Job quality, wage Job search Lay-off, dismissal,new job, poverty
Working time, job preferences (In)voluntary jobchange, job loss
Wage expectations Start-up, stop business
Social capital
Social relationships (bonding) Social contacts, get support Change of residence
Membership union etc. (bridging) Time spent to memberships,union, clubs
Change of residence
Living in a sustainable consensual union Caring time Marriage, cohabitationdivorce, separation
Trust in other people Time spent on communityevents, working togetheretc.
Revealed distrustVictim of crime
Cultural capital
Willingness to take risks Invest in new job/self-employment
Change of job,business, career
Life goals/values Volunteer work, socialactivities
Social events, lifeevents: child birth
Religion Forming a family, number ofchildren
Attending religious events
Personal events
Psychological capital
The big five (openness, agreeableness,extroversion, emotional stability,conscientiousness)
Investment in one-self (self-development)
Personal events
Source: GSOEP, 2001–2008, BHPS, 2001–2008
1168 R. Muffels, B. Headey
123

Table 2 List of variables used in the empirical model
Variable Germany Britain
Controls
Age and age squared Based on year and month of birth Based on year of birth
Household type (life coursestages)
Couple youngest child \5 years;couple youngest child between 6and 15, single with children,single parent, youngest child \5,single parent, youngest childbetween 6 and 16, other type
Similar
Number of children In-living child between 0 and16 years of age
Similar
Number of other employed inthe household
All other members in thehousehold with self-reportedemployment status
Similar
East-Germany and Immigrant Living in East-Germany; not bornin Germany
No region indicator used; not bornin Britain
Interaction unemployment rateand period correcting for thebusiness cycle
Overall annual unemployment rateis derived from the Eurostatdatabase. Period is split into the1980s, the 1990s and the 2000s
Similar to Germany though periodsplit in two (1990s and 2000s)
Stocks
Health limitations People reporting beinghandicapped or not and theirdegree of disability. If more than50% people are considereddisabled for work
Health problems limit amount andtype of work
Human capital Education level using ISCEDcodes and recoded into low,intermediate and high
Similar ISCED classification used
Social capital Bonding: Frequency of contactsrelatives/friends,
Trust other people (4 categoriesfrom totally agree to totallydisagree)
Bridging: Membership tradeunion/association, clubs
Frequency contacts friends. Trustbased on question whetherpeople can be trusted, that runsfrom 1 ‘most people can betrusted’ to 3 ‘depends’
Cultural capital Religion: Catholic, Protestant,Other Christian, Other religion,No denomination
Life goals: importance of beingable to afford something,altruism, success in job, family,friends, partner, owned house
Willingness to take risks (11 pointsscale)
SimilarLife goals: importance of family,
friends, success in work, health,house, travel
No information on willingness totake risks
Functionings/events
Career choices throughinvesting in training,apprenticeship
Training participation for theemployed and unemployedseparately and apprenticeship
Participation in general andspecific training andapprenticeship for the employed,and in government training forthe unemployed/inactive
Capabilities and Choices 1169
123

and unemployment rate) and with the OWB measures of income and employment security
as covariates, the effects of OWB on SWB turn out to be significant but rather moderate
(0.11 for income security and 0.03 for employment security in Germany and 0.02 and 0.03
respectively in Britain).
5 Results on the Model Estimations
In the next step several GLS panel regression models are estimated to test the empirical
‘capabilities-choices-events’ model. The results show the separate contribution of capa-
bilities, choices and events on the three measures of objective and subjective well-being.
We estimated five separate models on each of the three well-being indicators. These are the
following:
• Model I. The baseline model with the usual controls (age, age squared, sex, household
type, number of children, region (West and East German region only), being an
immigrant and unemployment rate.
• Model II. The traits model with the controls and the five personality traits variables
included
• Model III. The capabilities model with the controls and the capabilities but without the
personality traits.
• Model IV. The traits-capabilities model with the controls, the capabilities and the traitsincluded
Table 2 continued
Variable Germany Britain
Work-leisure choices indicatedby job match for unemployedand employed separately
Difference between preferred andactual total working hours in alljobs smaller or equal to 3 h.More than 3 h differenceindicates being overworked orunderworked. Unemployed andinactive people are consideredunderworked when they activelysearch for a job
Asked to people whether they wantto work more or fewer hours orthat they want to continue withthe same number of hours.Unemployed and inactive peopleare considered underworkedwhen they actively look for a job
Lifestyle choices throughinvestment in healthy lifestyle(time use)
Healthy life: active sports,exercising
Similar
Social choices throughinvestment in social networks(time use)
Time spent with friends, attendingcommunity and social events,volunteer work. Time weekdayson: housework, shopping, work,visiting friends
Frequency of attending social andcommunity events; frequency ofvolunteer work and of spendingtime with relatives/friends
Cultural choices throughinvestment in culture
Time spent on cultural eventsVisiting church or religious events
Similar
Events such as divorce/separation, marriage/cohabitation, early retirement,involuntary job change
Constructed from the monthlycalendar and from annualinformation at t - 1 and atinterview date
Constructed from monthlyinformation on activities andfrom annual information at t - 1and t
Source: GSOEP, 2001–2008, BHPS, 2001–2008
1170 R. Muffels, B. Headey
123
• Model V. The capabilities-choices model with the controls, traits, capabilities, choices
and events.
For each of the three well-being indicators five random effects models are estimated to
examine the added value of traits, capabilities, choices and events for explaining well-
being. The results show the effect sizes of the various measures of capabilities, choices and
events and their additional explanatory power for subjective and objective well-being.
Table 5 reports on the fit indices (R-squares) for the five random effects models. Random
instead of fixed effects models were estimated since we had information on personality
traits in the German and British panel for 1 year only. In the fixed-effects model time-
constant traits variables drop out. Set-point theorists argue that subjective well-being is
relatively stable over time because of the stability of personality traits not changing much
after childhood. There is one exception though known from the literature associated with
the death of a child which event however is relatively rare. For that reason we assumed the
traits to be time-constant and imputed them for the missing years.
Table 3 Three well-being measures by employment status and gender, GSOEP 1999–2008; BHPS1999–2008
Employment status Germany Britain
SWB YS ES SWB YS ES
Males
Employed 7.1 2.1 49.4 7.0 2.6 49.9
Self-employed 7.0 3.0 50.3 7.1 2.4 50.9
Unemployed 5.5 1.2 7.9 6.1 1.4 14.8
Inactive 6.9 1.7 2.9 6.6 1.7 8.1
Total men 7.0 2.0 39.3 6.9 2.4 41.0
Females
Employed 7.1 2.2 47.3 7.0 2.5 49.1
Self-employed 7.2 2.8 46.9 7.0 2.6 49.9
Unemployed 5.9 1.3 3.7 6.0 1.6 17.4
Inactive 7.1 1.7 2.2 6.8 1.6 7.7
Total women 7.0 2.0 29.9 6.9 2.2 34.4
LS life satisfaction (0–10), YS income security (income-to-needs ratio), ES employment security (number ofweeks employed in the current year)
Source: GSOEP, 2001–2008, BHPS, 2001–2008
Table 4 Correlations between subjective and objective well-being measures
Britain 1996–2008 (BHPS) Germany 1984–2008 (GSOEP)
SWB with YS 0.10 0.17
SWB with ES 0.11 0.10
YS with ES 0.31 0.25
Source: GSOEP, 2001–2008, BHPS, 2001–2008
SWB subjective well-being, YS income security, ES employment security
Capabilities and Choices 1171
123
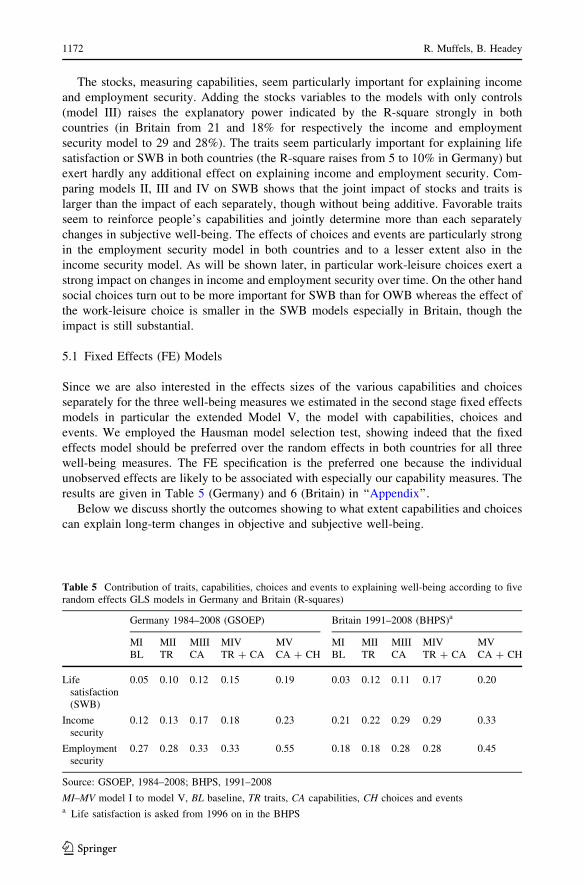
The stocks, measuring capabilities, seem particularly important for explaining income
and employment security. Adding the stocks variables to the models with only controls
(model III) raises the explanatory power indicated by the R-square strongly in both
countries (in Britain from 21 and 18% for respectively the income and employment
security model to 29 and 28%). The traits seem particularly important for explaining life
satisfaction or SWB in both countries (the R-square raises from 5 to 10% in Germany) but
exert hardly any additional effect on explaining income and employment security. Com-
paring models II, III and IV on SWB shows that the joint impact of stocks and traits is
larger than the impact of each separately, though without being additive. Favorable traits
seem to reinforce people’s capabilities and jointly determine more than each separately
changes in subjective well-being. The effects of choices and events are particularly strong
in the employment security model in both countries and to a lesser extent also in the
income security model. As will be shown later, in particular work-leisure choices exert a
strong impact on changes in income and employment security over time. On the other hand
social choices turn out to be more important for SWB than for OWB whereas the effect of
the work-leisure choice is smaller in the SWB models especially in Britain, though the
impact is still substantial.
5.1 Fixed Effects (FE) Models
Since we are also interested in the effects sizes of the various capabilities and choices
separately for the three well-being measures we estimated in the second stage fixed effects
models in particular the extended Model V, the model with capabilities, choices and
events. We employed the Hausman model selection test, showing indeed that the fixed
effects model should be preferred over the random effects in both countries for all three
well-being measures. The FE specification is the preferred one because the individual
unobserved effects are likely to be associated with especially our capability measures. The
results are given in Table 5 (Germany) and 6 (Britain) in ‘‘Appendix’’.
Below we discuss shortly the outcomes showing to what extent capabilities and choices
can explain long-term changes in objective and subjective well-being.
Table 5 Contribution of traits, capabilities, choices and events to explaining well-being according to fiverandom effects GLS models in Germany and Britain (R-squares)
Germany 1984–2008 (GSOEP) Britain 1991–2008 (BHPS)a
MI MII MIII MIV MV MI MII MIII MIV MVBL TR CA TR ? CA CA ? CH BL TR CA TR ? CA CA ? CH
Lifesatisfaction(SWB)
0.05 0.10 0.12 0.15 0.19 0.03 0.12 0.11 0.17 0.20
Incomesecurity
0.12 0.13 0.17 0.18 0.23 0.21 0.22 0.29 0.29 0.33
Employmentsecurity
0.27 0.28 0.33 0.33 0.55 0.18 0.18 0.28 0.28 0.45
Source: GSOEP, 1984–2008; BHPS, 1991–2008
MI–MV model I to model V, BL baseline, TR traits, CA capabilities, CH choices and eventsa Life satisfaction is asked from 1996 on in the BHPS
1172 R. Muffels, B. Headey
123

5.2 Results from the Random and Fixed Effects Models in Germany and Britain
(Estimation Results are Given in ‘‘Appendix’’)
We briefly review the results of the baseline model for the well-being measures since the
results confirm the evidence in the literature. The relationship of SWB with age is
U-shaped, first decreasing up to 45 years in Germany and 41 in Britain and then increasing.
But for income and employment security the relationship is exactly the opposite, inversely
U-shaped, first for income security increasing up to 50 years in Germany and 42 years in
Britain and for employment security up to 39 years in both countries and then decreasing.
It shows that subjective and objective well-being measures are indeed different concepts
which need to be studied separately.
Children tend to increase life satisfaction in Germany but to reduce it in Britain which is
remarkable. On the other hand, children seem to reduce people’s income security and
especially employment security in both countries compared to people without children.
This is known in demographic research known as the ‘life cycle squeeze’ associated with
the retreat of the female partner from the labour market after childbirth resulting in a
decline of income (see e.g. Kalmijn and Alessie 2008), the so-called ‘child valley’ in life
cycle income. Nevertheless, couples with very young children are happier than couples
without children but only in Germany; in Britain they are seemingly less happy. Worst off
though are single parent households with young children viewing their levels of subjective
and objective well-being in both countries. This confirms the ‘income squeeze’ thesis since
these households suffer most from a reduced household income due to a combination of
labour market withdrawal and the income consequences of divorce while facing increasing
costs of children. The ‘child valley’ effect seems therefore more important for these single
parent families. The more household members work the happier people are in Germany but
not in Britain. The latter finding might be associated with ‘time squeeze’ effects because of
the reduced time left for fulfilling caring duties and household chores. The more workers
there are in the household the better though the level of income and employment security
in both countries. East-Germans and immigrants share a lower level of subjective well-
being and have a worse record in maintaining income and employment security. The
British immigrants fare apparently better with a view to their subjective well-being than
their German counterparts. The unemployment evidence confirms the adverse impact of
unemployment experience known from the literature on subjective and objective well-
being in Germany as well as in Britain.
The fixed effects results are very similar to the random effects results except for the
unemployment rate that becomes insignificant in the FE model. That effect seems to be
taken over by the effect of the number of workers in the household which effects is
stronger in the FE model.
5.3 Traits
The purpose of the analyses is to show the effects of capabilities after netting out the
effects of personality traits. The evidence on traits, as being part of the set of capabilities,
confirms the adverse effects of emotional instability or neuroticism on life satisfaction in
both countries. All the other personality traits except openness show a positive effect on
subjective well-being in both countries. Less well-known are the significant effects of these
traits on income and employment security. Especially the sign and the size of the negative
effects of neuroticism and of openness and agreeableness on employment security in
Germany are remarkable. In Germany but also in Britain we find a negative effect of
Capabilities and Choices 1173
123
agreeableness on income and employment security. Conscientious people seem more
satisfied with life though they are less income secure and more employment secure in
Germany. In Britain they are both, more income and employment secure.
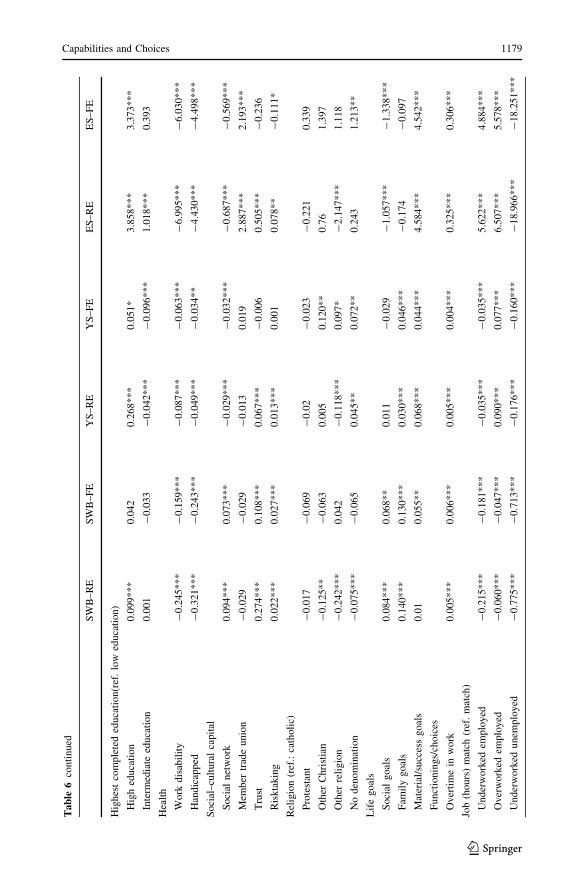
5.4 Capabilities
The more human, social and cultural capital endowments people have the more satisfied
they are with life and the better they appear capable of maintaining one’s income and
employment security in both countries. A high education level warrants a job and
therefore pays off in terms of feeling happier. Remarkably though, the effect of edu-
cation level on SWB is negative in Britain according to the random effects model
possibly reflecting the meritocratic nature of the British system. In particular the adverse
effect of health limitations and disability shows up very strongly in all models in both
countries.
Interestingly, we find significant effects of the ‘willingness to take risks’ variable in
Germany showing that economic risk seeking behavior seems to reward in terms of life
satisfaction and staying income and employment secure at least in the random effects
models. In the fixed effects models the impact on income and employment security turns
insignificant and even negative. This is likely to be due to the few measurements we had
and the lack of variation associated with that. Another interesting finding deals with the
positive impact of social capital (trust, memberships). It is shown that ‘trust in otherpeople’ exerts a particularly strong positive effect on subjective well/being in Germany as
well as in Britain. The positive effect of trust on income and employment security in both
countries disappears in the fixed effect model. This might again be due to the few mea-
surement time-points and lack of variation over time. The impact of social capital on
income and employment security is especially in Britain also reflected in the strong
positive effect of membership of a trade union or association. Both results render firm
support to the social capital thesis put forward by Putnam and others (Putnam 2000;
Putnam et al. 2005).
Religion exerts a small effect on income and employment security but a stronger
effect on life satisfaction in both countries. In Britain, Protestants and Other Christians
are slightly happier compared to Catholics, whereas in Germany people with no
denomination or another religion are less happy. Social and family life goals make
people feel happier in Germany and in Britain but not necessarily more income and
employment secure. The positive effects on SWB are rather strong in both countries
(Muffels and Kemperman 2011; Headey et al. 2011). On the other hand, the more
important social goals are, the less employment secure people tend to be, both in Ger-
many and Britain. The explanation might be that the time invested in family and social
networks make people happier but reduces the time available for working. That family
and social goals do not harm people’s income security—in Germany family goals even
have a positive effect on income security—might be related to the positive impact of
social capital on the job match and the career counterbalancing the negative time
spending effect. The SWB literature suggests that persistent rather than transient com-
mitments to material goals matter more for life satisfaction (see Headey 2008; Headey
et al. 2010). The random effects models show no effect of material goals on SWB in
Britain and in Germany. In an earlier paper on Germany we found support for the
findings in the literature that persistent commitment to material life goals not only matter
more to happiness than short-term commitments but also that they exert a negative effect
on SWB too. The negative effect is confirmed in another paper on the German, British
1174 R. Muffels, B. Headey
123

and Australian panel data (Muffels and Kemperman 2011; Headey et al. 2011). The
explanation might be that striving for material success may make people happier in
the short-term but harms people social relationships in the longer-term while it reduces
the time spent with friends and relatives.
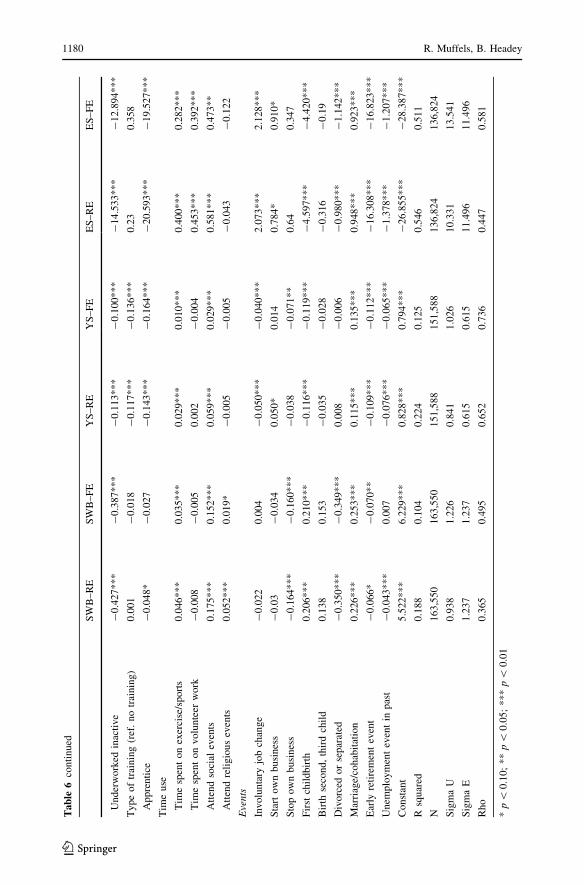
5.5 Choices
Working overtime turns out to be rewarding while it indeed improves people’s income
and employment security in Germany and Britain. It has no effect on people’s life
satisfaction in Britain and only a small positive effect on their SWB in Germany which is
slightly surprising. The effects of being overworked or underworked while at work on
subjective well-being are much stronger though in both countries suggesting that it is not
the number of hours that matters but to what extent people’s working hours fit or match
their working time preferences. In another paper (Muffels and Kemperman 2011; Headey
et al. 2011) focusing on German women of 20–55 years we find strong support for the
impact of the hours match on subjective well-being. Employed people working less than
they wish (underworked) pay a price in terms of income security in both countries but
their employment security is even improved compared to working and non-working
people for which the working hours match their preferences. On the other hand over-
worked people (working more than they wish) are less happy but more income and
employment secure. The negative effects of being over or underworked on SWB are
rather strong. They are even stronger for the unemployed and inactive people, which is
not surprising with a view to the stronger mismatch between their preferences and actual
involvement in work.
For training we find rather strong and positive effects on well-being in Britain but
puzzling negative effects on all well-being measures in Germany. The reason might be that
it resembles the adverse well-being outcomes for the unemployed or inactive people who
participate strongly in (vocational) training in Germany. For the same reason we also find
negative effects for apprenticeship jobs in Germany. The explanation might also be found
in the different professional education system and the earlier discussed difference between
a ‘general skills’ regime such as in Britain and a ‘specific skills’ regime such as in
Germany. In Germany potential workers are educated and trained in the highly stratified
vocational (apprenticeship) education system for a particular job in a particular profession
with specific skills prior to entering the labour market. Formal training on the job can
therefore be limited to compensate for lack of skills obtained before. In Britain the edu-
cational system is much less stratified with respect to vocational education and it provides
much larger shares of (lower educated) workers with general skills who require training on
the job to fulfill a specific job (Korpi et al. 2003). Training tends to act as a sorting
mechanism to select workers into the better jobs and careers. These results on training
require further scrutiny with a different research design since for examining the effects of
training we need to compare a matched group of workers with and without training in their
subsequent careers, but that goes beyond the purpose of this paper. That people though
with job related training tend to have better income and employment opportunities in
Britain suggest that training matters to people’s careers.
The investment in a healthy lifestyle seem to pay-off since people active in sports or
exercising are happier and more income secure in both countries. They are also more
employment secure in Germany but not in Britain. Earlier we reported already on the effect of
religion on subjective well-being as part of the capabilities; the results on attending religious
events show positive effects on life satisfaction but not on income or employment security.
Capabilities and Choices 1175
123

The investments in social capital not always pay off while it seems to be related to
the amount of time people invest. Time spent to volunteer work has a negative effect on
income and employment security in Britain but a positive effect in Germany. There
seems to be a trade-off between the time invested in volunteering leaving less time to
spend in formal work (Britain) and the positive impact of the building up of social
capital through volunteering on the career (Germany). The time spent to visit relatives
and friends during weekdays also harms income security as well as life satisfaction
though visiting relatives and friends occasionally (social networking) improves the
employment security.
5.6 Events
Events exert a rather strong impact on all three WB measures in both countries though
the effects are rather dissimilar. Unexpectedly, we find that the birth of a first child raises
people’s life satisfaction in Britain and Germany but also their income and employment
security at least in Britain. In Germany the birth of the first child lowers people’s income
and employment security. We already referred earlier to the ‘life cycle squeeze’ thesis
for an explanation. It might be that fathers in Britain after childbirth tend to invest more
in work to compensate the income loss of their partner and aimed at raising the
household income to cover the additional costs of children (Fouarge et al. 2010). The
effect of second and following childbirths on employment security is negative in Britain.
Divorce harms people’s life satisfaction in both countries but remarkably not people’s
income and employment security, at least in Britain. The transition into early retirement
harms all three forms of well-being in Germany, but only the employment security and
not people’s life satisfaction or income security in Britain. Rather strong adverse effects
on income and employment security but also on life satisfaction are observed for
unemployment experiences in the past in Germany and Britain. Stopping one’s business
has especially a negative impact on life satisfaction in Germany but exerts no strong
effects on subjective or objective well-being in Britain. These results confirm the exis-
tence of strong ‘scarring’ effects of unemployment on well-being and suggest that people
seem to recoup with great difficulty from unemployment experiences in the past (Clark
et al. 2008a; Muffels 2008).
6 Conclusions and Discussion
The empirical findings render strong support for the capabilities and functionings approach
of Sen. The results are generally very plausible and confirm the findings of earlier research.
The outcomes show the added value of Sen’s capability approach for explaining objective
and subjective well-being and their evolution over time. Because the aim of the paper is to
examine the added-value of Sen’s capability approach for explaining well-being we did not
look into the relationships between the various well-being measures which is however an
interesting issue for future research. The low correlations though between the measures
show that the concepts seem to be rather different.
The stocks indicating Sen’s capabilities seem particularly important for explaining
income security and employment security in both countries whereas the personality traits
exert the largest impact on SWB and only a small effect on income and employment
security in both countries. Choices and events exert a large impact in all three models both
in Britain and Germany whereby choices in particular affect SWB and events in particular
1176 R. Muffels, B. Headey
123

income and employment security. This evidence on the impact of choices on SWB con-
firms earlier results (Headey et al. 2010) but also challenges the idea as in set-point theory
(Diener et al. 1999) that SWB is rather stable over time. All models perform rather
satisfactory with a view to the explained variance, including the fixed effects models. The
reason might be that the long-running German panel but also the shorter British panel
allow the researcher to include a rather rich set of covariates in the models which are
required to test Sen’s capability model.
Overall, the results appear fairly robust in the models and we consider it reassuring that
the fixed effects models reveal no different picture from the random effects models except
for a very few variables indicating that correcting for the correlation between the unob-
served individual effects and the observables does not do much harm to the parameter
estimates of the models suggesting that most of the variance is captured with the
observables in the models.
The results further show that the effects of most variables are very similar across the
two countries except for some. Germany has a better record in maintaining income
security and Britain a better record in maintaining employment security especially for
females. Whether that should be attributed to the different ‘skill’ regime in the two
countries remains to be seen. But we do find evidence in our models that the human
capital variables such as education level and training efforts behave very differently
across the two regimes. We argued that the dissimilar outcomes seem to mirror the
differences between a ‘general skills’ regime as Britain is and a ‘specific skills’ regime
as Germany is. Since the evidence is not conclusive yet, there is reason for further
scrutiny into the issue.
Rather strong positive effects are observed of the social capital variables such as trust,
social networks (bonding social capital) and social participation or membership (bridging
social capital) on income and employment security though not on SWB. We also find
support for the impact of cultural capital factors like the willingness to take risks and social
and economic life goals and values such as altruism and trust. Strong positive effects are
observed for risk taking behavior on income and employment security in Germany but
negative effects on life satisfaction. Social values raise people’s life satisfaction in both
countries. The results therefore convincingly show that along with human capital and
economic values, social capital and social values significantly contribute to explaining
changes in well-being confirming earlier findings (Headey et al. 2010, 2011; Muffels and
Kemperman 2011).
The aim of the paper is to use a broad set of measures derived from the rich theoretical
literature on well-being to test whether the capability approach of Sen translated into an
empirical ‘capabilities-choices’ model of well-being has added value. We showed that
Sen’s approach makes sense to arrive at a better understanding of long-term changes in
objective and subjective well-being. The capability approach adds to our knowledge about
what raises people’s long-term well-being with a view to income and employment security
and how satisfied people are with their lives.
Open Access This article is distributed under the terms of the Creative Commons Attribution Noncom-mercial License which permits any noncommercial use, distribution, and reproduction in any medium,provided the original author(s) and source are credited.
Appendix: Estimation Results
See Tables 6 and 7.
Capabilities and Choices 1177
123

Tab
le6
GL
Sra
ndom
(RE
)an
dfi
xed
effe
cts
(FE
)m
odel
son
subje
ctiv
ew
ell-
bei
ng
(SW
B),
inco
me
secu
rity
(YS
)an
dem
plo
ym
ent
secu
rity
(ES
),G
erm
any,
1984–2008,
po
pula
tio
n1
6–
64
yea
rs
SW
B–
RE
SW
B–
FE
YS
–R
EY
S–
FE
ES
–R
EE
S–
FE
Co
ntr
ols
Ag
e-
0.0
37
**
*-
0.0
28
**
*0
.05
4*
**
0.0
57
**
*3
.244
**
*3
.152
**
*
Ag
esq
uar
ed/1
00
0.0
42
**
*0
.016
**
*-
0.0
54
**
*-
0.0
57
**
*-
4.1
53
**
*-
3.9
92
**
*
Ho
use
ho
ldty
pe
Co
up
le,
chil
d0
–5
0.0
50
**
0.0
44
*-
0.1
99
**
*-
0.1
95
**
*-
5.2
98
**
*-
5.5
11
**
*
Co
up
le,
chil
d6
–1
50
0-
0.1
17
**
*-
0.1
09
**
*-
0.6
40
**
-1
.010
**
*
Sin
gle
,n
och
ild
-0
.220
**
*-
0.1
63
**
*-
0.1
08
**
*-
0.0
47
**
-0
.08
-0
.05
Sin
gle
par
ent,
chil
d0
–5
-0
.380
**
*-
0.2
85
**
*-
0.3
04
**
*-
0.2
48
**
*-
5.5
99
**
*-
4.5
20
**
*
Sin
gle
par
ent,
chil
d6
–1
5-
0.3
56
**
*-
0.2
72
**
*-
0.2
75
**
*-
0.2
20
**
*1
.974
**
*2
.117
**
*
Oth
er-
0.0
60
**
*-
0.0
64
**
*-
0.0
28
**
-0
.01
3-
0.9
45
**
*-
1.0
94
**
*
Nu
mb
ero
fch
ild
ren
0–
15
0.0
23
**
0.0
21
*-
0.1
34
**
*-
0.1
36
**
*-
2.3
03
**
*-
2.1
48
**
*
Fem
ale
(ref
.m
ale)
0.1
03
**
*–
0.0
41
**
*–
-6
.654
**
*–
Nu
mb
ero
fo
ther
emp
loyed
0.0
35
**
*0
.031
**
*0
.03
6*
**
0.0
26
**
*-
0.2
02
**
-0
.263
**
Eas
t-
0.5
14
**
*–
-0
.503
**
*–
-1
.421
**
*–
Fo
reig
n-
0.0
33
–-
0.3
01
**
*–
0.1
45
–
Un
emp
l-ra
te9
Per
iod
-0
.014
**
*-
0.0
09
**
*-
0.0
05
**
*-
0.0
06
**
*0
.030
**
*-
0.0
2
Tra
its
Neu
roti
cism
-0
.217
**
*–
-0
.059
**
*–
-0
.544
**
*–
Ex
tro
ver
sio
n0
.040
**
*–
-0
.003
–0
.151
–
Open
nes
s0.0
34***
–0.0
67***
–-
0.3
63
**
*–
Ag
reab
len
ess
0.0
53
**
*–
-0
.059
**
*–
-0
.364
**
*–
Consc
ienti
ousn
ess
0.0
68***
–-
0.0
32
**
*–
1.2
66
**
*–
Ca
pa
bil
itie
s
1178 R. Muffels, B. Headey
123
Tab
le6
con
tin
ued
SW
B–
RE
SW
B–
FE
YS
–R
EY
S–
FE
ES
–R
EE
S–
FE
Hig
hes
tco
mple
ted
educa
tion(r
ef.
low
educa
tion)
Hig
hed
uca
tion
0.0
99***
0.0
42
0.2
68***
0.0
51*
3.8
58***
3.3
73***
Inte
rmed
iate
educa
tion
0.0
01
-0
.033
-0
.042
**
*-
0.0
96
**
*1
.018
**
*0
.393
Hea
lth
Wo
rkd
isab
ilit
y-
0.2
45
**
*-
0.1
59
**
*-
0.0
87
**
*-
0.0
63
**
*-
6.9
95
**
*-
6.0
30
**
*
Han
dic
app
ed-
0.3
21
**
*-
0.2
43
**
*-
0.0
49
**
*-
0.0
34
**
-4
.430
**
*-
4.4
98
**
*
So
cial
–cu
ltu
ral
cap
ital
So
cial
net
work
0.0
94
**
*0
.073
**
*-
0.0
29
**
*-
0.0
32
**
*-
0.6
87
**
*-
0.5
69
**
*
Mem
ber
trad
eu
nio
n-
0.0
29
-0
.029
-0
.013
0.0
19
2.8
87
**
*2
.193
**
*
Tru
st0
.274
**
*0
.108
**
*0
.06
7*
**
-0
.00
60
.505
**
*-
0.2
36
Ris
kta
kin
g0
.022
**
*0
.027
**
*0
.01
3*
**
0.0
01
0.0
78
**
-0
.111
*
Rel
igio
n(r
ef.:
cath
oli
c)
Pro
test
ant
-0
.017
-0
.069
-0
.02
-0
.02
3-
0.2
21
0.3
39
Oth
erC
hri
stia
n-
0.1
25
**
-0
.063
0.0
05
0.1
20
**
0.7
61
.397
Oth
erre
ligio
n-
0.2
42
**
*0
.042
-0
.118
**
*0
.097
*-
2.1
47
**
*1
.118
No
den
om
inat
ion
-0
.075
**
*-
0.0
65
0.0
45
**
0.0
72
**
0.2
43
1.2
13
**
Lif
eg
oal
s
So
cial
go
als
0.0
84
**
*0
.068
**
0.0
11
-0
.02
9-
1.0
57
**
*-
1.3
38
**
*
Fam
ily
go
als
0.1
40
**
*0
.130
**
*0
.03
0*
**
0.0
46
**
*-
0.1
74
-0
.097
Mat
eria
l/su
cces
sg
oal
s0
.01
0.0
55
**
0.0
68
**
*0
.044
**
*4
.584
**
*4
.542
**
*
Funct
ionin
gs/
choic
es
Ov
erti
me
inw
ork
0.0
05
**
*0
.006
**
*0
.00
5*
**
0.0
04
**
*0
.325
**
*0
.306
**
*
Job
(ho
urs
)m
atch
(ref
.m
atch
)
Un
der
wo
rked
emplo
yed
-0
.215
**
*-
0.1
81
**
*-
0.0
35
**
*-
0.0
35
**
*5
.622
**
*4
.884
**
*
Ov
erw
ork
edem
plo
yed
-0
.060
**
*-
0.0
47
**
*0
.09
0*
**
0.0
77
**
*6
.507
**
*5
.578
**
*
Un
der
wo
rked
un
emp
loy
ed-
0.7
75
**
*-
0.7
13
**
*-
0.1
76
**
*-
0.1
60
**
*-
18
.96
6*
**
-1
8.2
51
**
*
Capabilities and Choices 1179
123
Tab
le6
con
tin
ued
SW
B–
RE
SW
B–
FE
YS
–R
EY
S–
FE
ES
–R
EE
S–
FE
Un
der
wo
rked
inac
tiv
e-
0.4
27
**
*-
0.3
87
**
*-
0.1
13
**
*-
0.1
00
**
*-
14
.53
3*
**
-1
2.8
94
**
*
Ty
pe
of
trai
nin
g(r
ef.
no
trai
nin
g)
0.0
01
-0
.018
-0
.117
**
*-
0.1
36
**
*0
.23
0.3
58
Ap
pre
nti
ce-
0.0
48
*-
0.0
27
-0
.143
**
*-
0.1
64
**
*-
20
.59
3*
**
-1
9.5
27
**
*
Tim
eu
se
Tim
esp
ent
on
exer
cise
/sp
ort
s0
.046
**
*0
.035
**
*0
.02
9*
**
0.0
10
**
*0
.400
**
*0
.282
**
*
Tim
esp
ent
on
vo
lun
teer
wo
rk-
0.0
08
-0
.005
0.0
02
-0
.00
40
.453
**
*0
.392
**
*
Att
end
soci
alev
ents
0.1
75
**
*0
.152
**
*0
.05
9*
**
0.0
29
**
*0
.581
**
*0
.473
**
Att
end
reli
gio
us
even
ts0
.052
**
*0
.019
*-
0.0
05
-0
.00
5-
0.0
43
-0
.122
Eve
nts
Inv
olu
nta
ryjo
bch
ang
e-
0.0
22
0.0
04
-0
.050
**
*-
0.0
40
**
*2
.073
**
*2
.128
**
*
Sta
rto
wn
bu
sin
ess
-0
.03
-0
.034
0.0
50
*0
.014
0.7
84
*0
.910
*
Sto
po
wn
bu
sin
ess
-0
.164
**
*-
0.1
60
**
*-
0.0
38
-0
.07
1*
*0
.64
0.3
47
Fir
stch
ild
bir
th0
.206
**
*0
.210
**
*-
0.1
16
**
*-
0.1
19
**
*-
4.5
97
**
*-
4.4
20
**
*
Bir
thse
cond,
thir
dch
ild
0.1
38
0.1
53
-0
.035
-0
.02
8-
0.3
16
-0
.19
Div
orc
edo
rse
par
ated
-0
.350
**
*-
0.3
49
**
*0
.00
8-
0.0
06
-0
.980
**
*-
1.1
42
**
*
Mar
riag
e/co
hab
itat
ion
0.2
26
**
*0
.253
**
*0
.11
5*
**
0.1
35
**
*0
.948
**
*0
.923
**
*
Ear
lyre
tire
men
tev
ent
-0
.066
*-
0.0
70
**
-0
.109
**
*-
0.1
12
**
*-
16
.30
8*
**
-1
6.8
23
**
*
Un
emp
loy
men
tev
ent
inp
ast
-0
.043
**
*0
.007
-0
.076
**
*-
0.0
65
**
*-
1.3
78
**
*-
1.2
07
**
*
Co
nst
ant
5.5
22
**
*6
.229
**
*0
.82
8*
**
0.7
94
**
*-
26
.85
5*
**
-2
8.3
87
**
*
Rsq
uar
ed0
.188
0.1
04
0.2
24
0.1
25
0.5
46
0.5
11
N1
63
,55
01
63
,55
01
51
,58
81
51
,58
81
36
,82
41
36
,82
4
Sig
ma
U0
.938
1.2
26
0.8
41
1.0
26
10
.33
11
3.5
41
Sig
ma
E1
.237
1.2
37
0.6
15
0.6
15
11
.49
61
1.4
96
Rh
o0
.365
0.4
95
0.6
52
0.7
36
0.4
47
0.5
81
*p\
0.1
0;
**
p\
0.0
5;
**
*p\
0.0
1
1180 R. Muffels, B. Headey
123
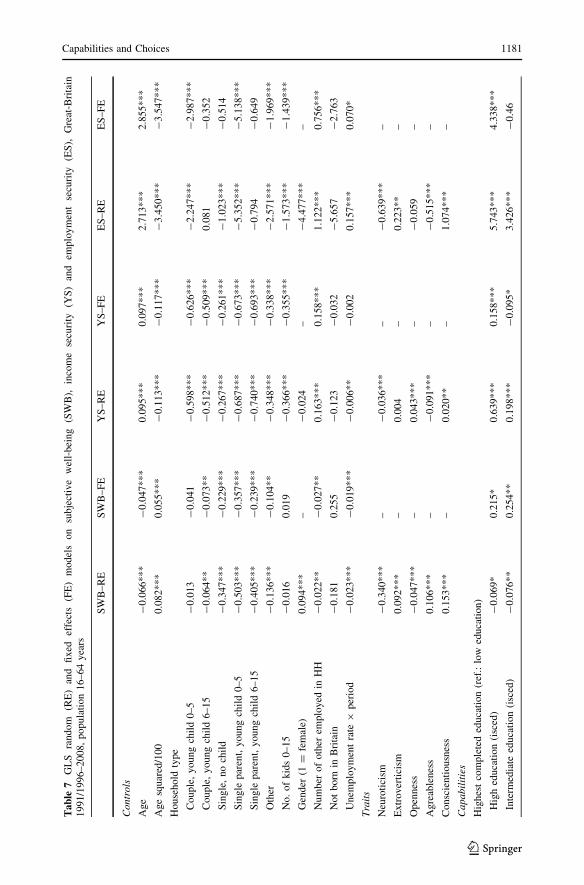
Tab
le7
GL
Sra
nd
om
(RE
)an
dfi
xed
effe
cts
(FE
)m
od
els
on
sub
ject
ive
wel
l-b
eing
(SW
B),
inco
me
secu
rity
(YS
)an
dem
plo
ym
ent
secu
rity
(ES
),G
reat
-Bri
tain
19
91/1
99
6–2
00
8,
po
pu
lati
on
16
–64
yea
rs
SW
B–
RE
SW
B–
FE
YS
–R
EY
S–
FE
ES
–R
EE
S–
FE
Co
ntr
ols
Ag
e-
0.0
66
**
*-
0.0
47
**
*0
.09
5*
**
0.0
97
**
*2
.713
**
*2
.855
**
*
Ag
esq
uar
ed/1
00
0.0
82
**
*0
.05
5*
**
-0
.113
**
*-
0.1
17
**
*-
3.4
50
**
*-
3.5
47
**
*
Ho
use
ho
ldty
pe
Co
up
le,
yo
ung
chil
d0
–5
-0
.013
-0
.041
-0
.598
**
*-
0.6
26
**
*-
2.2
47
**
*-
2.9
87
**
*
Co
up
le,
yo
ung
chil
d6
–1
5-
0.0
64
**
-0
.073
**
-0
.512
**
*-
0.5
09
**
*0
.081
-0
.35
2
Sin
gle
,n
och
ild
-0
.347
**
*-
0.2
29
**
*-
0.2
67
**
*-
0.2
61
**
*-
1.0
23
**
*-
0.5
14
Sin
gle
par
ent,
yo
ung
chil
d0
–5
-0
.503
**
*-
0.3
57
**
*-
0.6
87
**
*-
0.6
73
**
*-
5.3
52
**
*-
5.1
38
**
*
Sin
gle
par
ent,
yo
ung
chil
d6
–1
5-
0.4
05
**
*-
0.2
39
**
*-
0.7
40
**
*-
0.6
93
**
*-
0.7
94
-0
.64
9
Oth
er-
0.1
36
**
*-
0.1
04
**
-0
.348
**
*-
0.3
38
**
*-
2.5
71
**
*-
1.9
69
**
*
No
.o
fk
ids
0–
15
-0
.016
0.0
19
-0
.366
**
*-
0.3
55
**
*-
1.5
73
**
*-
1.4
39
**
*
Gen
der
(1=
fem
ale)
0.0
94***
–-
0.0
24
–-
4.4
77
**
*–
Nu
mb
ero
fo
ther
emplo
yed
inH
H-
0.0
22
**
-0
.027
**
0.1
63
**
*0
.158
**
*1
.122
**
*0
.756
**
*
No
tb
orn
inB
rita
in-
0.1
81
0.2
55
-0
.123
-0
.032
-5
.65
7-
2.7
63
Un
emp
loy
men
tra
te9
per
iod
-0
.023
**
*-
0.0
19
**
*-
0.0
06
**
-0
.002
0.1
57
**
*0
.070
*
Tra
its
Neu
roti
cism
-0
.340
**
*–
-0
.036
**
*–
-0
.63
9*
**
–
Extr
over
tici
sm0.0
92***
–0.0
04
–0.2
23**
–
Open
nes
s-
0.0
47
**
*–
0.0
43
**
*–
-0
.05
9–
Agre
able
nes
s0.1
06***
–-
0.0
91
**
*–
-0
.51
5*
**
–
Consc
ienti
ousn
ess
0.1
53***
–0.0
20**
–1.0
74***
–
Ca
pa
bil
itie
s
Hig
hes
tco
mp
lete
ded
uca
tio
n(r
ef.:
low
edu
cati
on
)
Hig
hed
uca
tion
(isc
ed)
-0
.069
*0
.21
5*
0.6
39
**
*0
.158
**
*5
.743
**
*4
.338
**
*
Inte
rmed
iate
edu
cati
on
(isc
ed)
-0
.076
**
0.2
54
**
0.1
98
**
*-
0.0
95
*3
.426
**
*-
0.4
6
Capabilities and Choices 1181
123

Tab
le7
con
tin
ued
SW
B–
RE
SW
B–
FE
YS
–R
EY
S–
FE
ES
–R
EE
S–
FE
Hea
lth
lim
itat
ions
atw
ork
-0
.622
**
*-
0.4
45
**
*-
0.1
29
**
*-
0.0
73
**
*-
5.6
99
**
*-
3.4
52
**
*
Mem
ber
trad
eu
nio
n0
.00
40
.00
40
.10
8*
**
0.1
02
**
*4
.507
**
*4
.235
**
*
So
cial
–cu
ltu
ral
capit
altr
ust
0.1
34
**
*0
.09
5*
**
0.0
51
**
*0
.012
0.1
78
0.0
68
Rel
igio
n(r
ef.:
cath
oli
c)
Pro
test
ant
0.1
08***
0.0
62
0.0
33
-0
.025
0.7
23
**
-0
.55
6
Oth
erC
hri
stia
n0
.10
6*
*0
.08
6-
0.0
13
-0
.081
0.3
56
-0
.58
8
Oth
erre
ligio
n-
0.0
11
0.1
08
0.0
08
-0
.015
-0
.9-
1.0
85
No
den
om
inat
ion
0.0
73
**
0.0
69
0.0
39
-0
.008
1.1
80
**
*0
So
cial
con
tact
s0
.10
1*
**
0.0
87
**
*-
0.0
26
**
*-
0.0
03
-0
.55
4*
**
-0
.50
3*
**
Lif
eg
oal
s
Mat
eria
l/su
cces
sg
oal
s0
.01
40
.01
30
.00
40
.005
1.6
28
**
*1
.505
**
*
So
cial
go
als
0.1
17
**
*0
.11
4*
**
-0
.007
0.0
06
-0
.12
2-
0.3
65
**
Fu
nct
ion
ing
s—ch
oic
es
Over
tim
e0
0.0
01
0.0
14***
0.0
12***
0.2
08***
0.1
90***
Job
(ho
urs
)m
atch
(ref
.fi
t)
Un
der
wo
rked
emplo
yed
-0
.148
**
*-
0.0
97
**
*-
0.0
78
**
*-
0.0
58
**
*4
.560
**
*4
.101
**
*
Ov
erw
ork
edem
plo
yed
-0
.159
**
*-
0.1
41
**
*0
.17
8*
**
0.1
58
**
*4
.949
**
*4
.225
**
*
Un
der
wo
rked
un
emp
loy
ed-
0.4
66
**
*-
0.4
31
**
*-
0.0
77
**
-0
.069
*-
6.1
01
**
*-
6.5
05
**
*
Un
der
wo
rked
inac
tive
-0
.284
**
*-
0.2
00
**
*-
0.1
20
**
*-
0.1
06
**
*-
17
.76
2*
**
-1
6.3
12
***
Ty
pe
of
trai
nin
g(r
ef.
no
trai
nin
g)
Go
ver
nm
ent
trai
nin
g-
0.0
59
-0
.099
0.0
21
0.0
44
-5
.83
2*
**
-5
.64
6*
**
Ap
pre
nti
cesh
ip0
.28
0*
*0
.25
10
.10
.218
**
10
.06
1*
**
10
.15
1*
**
Tra
inin
go
nth
ejo
b0
.03
7*
**
0.0
40
**
*0
.08
2*
**
0.0
63
**
*3
.663
**
*3
.232
**
*
Tra
inin
gw
hen
inac
tive
0.0
03
0.0
12
-0
.047
*-
0.0
50
**
-4
.69
4*
**
-4
.03
5*
**
1182 R. Muffels, B. Headey
123
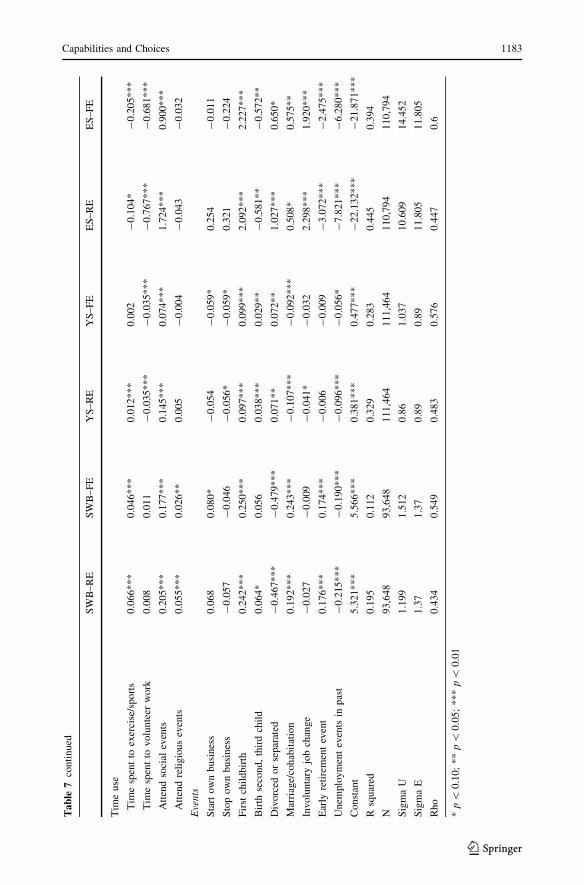
Tab
le7
con
tin
ued
SW
B–
RE
SW
B–
FE
YS
–R
EY
S–
FE
ES
–R
EE
S–
FE
Tim
eu
se
Tim
esp
ent
toex
erci
se/s
port
s0.0
66***
0.0
46***
0.0
12***
0.0
02
-0
.10
4*
-0
.20
5*
**
Tim
esp
ent
tov
olu
nte
erw
ork
0.0
08
0.0
11
-0
.035
**
*-
0.0
35
**
*-
0.7
67
**
*-
0.6
81
**
*
Att
end
soci
alev
ents
0.2
05
**
*0
.17
7*
**
0.1
45
**
*0
.074
**
*1
.724
**
*0
.900
**
*
Att
end
reli
gio
us
even
ts0
.05
5*
**
0.0
26
**
0.0
05
-0
.004
-0
.04
3-
0.0
32
Eve
nts
Sta
rto
wn
bu
sin
ess
0.0
68
0.0
80
*-
0.0
54
-0
.059
*0
.254
-0
.01
1
Sto
po
wn
bu
sin
ess
-0
.057
-0
.046
-0
.056
*-
0.0
59
*0
.321
-0
.22
4
Fir
stch
ild
bir
th0
.24
2*
**
0.2
50
**
*0
.09
7*
**
0.0
99
**
*2
.092
**
*2
.227
**
*
Bir
thse
cond,
thir
dch
ild
0.0
64*
0.0
56
0.0
38***
0.0
29**
-0
.58
1*
*-
0.5
72
**
Div
orc
edor
separ
ated
-0
.467
**
*-
0.4
79
**
*0
.07
1*
*0
.072
**
1.0
27
**
*0
.650
*
Mar
riag
e/co
hab
itat
ion
0.1
92
**
*0
.24
3*
**
-0
.107
**
*-
0.0
92
**
*0
.508
*0
.575
**
Inv
olu
nta
ryjo
bch
ang
e-
0.0
27
-0
.009
-0
.041
*-
0.0
32
2.2
98
**
*1
.920
**
*
Ear
lyre
tire
men
tev
ent
0.1
76
**
*0
.17
4*
**
-0
.006
-0
.009
-3
.07
2*
**
-2
.47
5*
**
Un
emp
loy
men
tev
ents
inp
ast
-0
.215
**
*-
0.1
90
**
*-
0.0
96
**
*-
0.0
56
*-
7.8
21
**
*-
6.2
80
**
*
Const
ant
5.3
21***
5.5
66***
0.3
81***
0.4
77***
-2
2.1
32
***
-2
1.8
71
***
Rsq
uar
ed0
.19
50
.11
20
.32
90
.283
0.4
45
0.3
94
N9
3,6
48
93
,64
81
11
,46
41
11
,46
41
10
,79
41
10
,79
4
Sig
ma
U1
.19
91
.51
20
.86
1.0
37
10
.60
91
4.4
52
Sig
ma
E1
.37
1.3
70
.89
0.8
91
1.8
05
11
.80
5
Rh
o0
.43
40
.54
90
.48
30
.576
0.4
47
0.6
*p\
0.1
0;
**
p\
0.0
5;
**
*p
\0
.01
Capabilities and Choices 1183
123

References
Alkire, S. (2007). Choosing dimensions: The capability approach and multidimensional poverty. In J. Silber(Ed.), The many dimensions of poverty. New York: Palgrave Macmillan.
Ball, R., & Chernova, K. (2008). Absolute income, relative income, and happiness. Social IndicatorsResearch, 88, 497–529.
Becker, G. (1975). Human capital: A theoretical and empirical analysis, with special reference to educa-tion. New York: National Bureau of Economic Research.
Clark, A., Frijters, P., & Shields, M. (2008a). Relative income, happiness and utility: An explanation for theEasterlin paradox and other puzzles. Journal of Economic Literature, 46(1), 95–144.
Clark, A. E., Diener, E., Georgellis, Y., & Lucas, R. E. (2008b). Lags and leads in life satisfaction: A test ofthe baseline hypothesis. Economic Journal, 118, 222–243.
Cuven, C., Senik, C., & Stichnoth, H. (2010). You can’t be happier than your wife, happiness gaps anddivorce, ISSN 1864-6689, SOEP Papers, No. 261, DIW Berlin.
Diener, E., & Oishi, S. (2000). Money and happiness: Income and subjective well-being across nations. In E.Diener & E. M. Suh (Eds.), Culture and subjective well-being (pp. 185–218). Cambridge, MA: MITPress.
Diener, E., Suh, E. M., Lucas, R. E., & Smith, H. L. (1999). Subjective well-being: Three decades ofprogress. Psychological Bulletin, 125, 276–302.
Dohmen, T., Falk, A., Huffman, D., Sunde, U., Schupp, J., & Wagner, G. G. (2011). Individual riskattitudes: Measurement, determinants and behavioral consequences. Journal of the European Eco-nomic Association, 9(3), 522–550.
Easterlin, R. A. (2001). Income and happiness: Towards a unified theory. The Economic Journal, 111(July),465–484.
Esteves-Abe, M., Iversen, T., & Soskice, D. (2001). Social protection and the formation of skills: Areinterpretation of the welfare state. In P. Hall & D. Soskice (Eds.), The institutional foundations ofcomparative advantage (pp. 145–183). New York: Oxford University Press.
Festinger, L. (1954). A theory of social comparison processes. Human Relations, 7(2), 117–140.Fouarge, D., Manzoni, A., Muffels, R., & Luijkx, R. (2010). Childbirth and cohort effects on mother’s
labour supply: A comparative study using life-history data for Germany, the Netherlands and Great-Britain. Work, Employment and Society, 24(3), 487–507.
Gangl, M. (2006). Scar effects of unemployment: An assessment of institutional complementarities.American Sociological Review, 71(December), 9861013.
Hall, P., & Soskice, D. (Eds.). (2001). Varieties of capitalism: the institutional foundations of comparativeadvantage. Oxford: Oxford University Press.
Headey, B. (1993). An economic model of subjective well-being: Integrating economic and psychologicaltheories. Social Indicators Research, 28(1), 97–116.
Headey, B. (2008). Life goals matter to happiness: A revision of set-point theory. Social IndicatorsResearch, 86(2), 213–231.
Headey, B., & Wearing, A. J. (1992). Understanding Happiness. Melbourne: Longman Cheshire.Headey, B., Muffels, R., & Wooden, M. (2008). Money does not buy happiness: Or does it? A reassessment
based on the combined effects of wealth, income and consumption. Social Indicators Research, 87(1),65–82.
Headey, B. W., Muffels, R. J. A., & Wagner, G. G. (2010). Long-running German panel survey shows thatpersonal and economic choices, not just genes, matter for happiness, Proceedings of the NationalAcademy of Sciences, 107(42), 17922–17926.
Headey, B. W., Muffels, R. J. A., & Wagner, G. G. (2011). Choices which change life satisfaction: Similarresults for Australia, Britain and Germany, Social Indicators Research (forthcoming).
Kahneman, D. (2003). A psychological perspective on economics. American Economic Review, 93(2),162–168.
Kahneman, D., & Krueger, A. B. (2006). Developments in the measurement of subjective well-being.Journal of Economic Perspectives, 20(1), 3–24.
Kalmijn, M., & Alessie, R. (2008). Life course changes in income. An exploration of age and stage effects ina 15-year panel in the Netherlands. NETSPAR, Panel Paper 10 (p. 75).
Korpi, T., de Graaf, P., Hendrickx, J., & Layte, R. (2003). Vocational training and career employmentprecariousness in Great Britain, The Netherlands and Sweden. Acta Sociologica, 46(1), 17–30.
Muffels, R. (2008). Flexibility and employment security in Europe. Labour markets in transition (p. 407).Cheltenham: Edward Elgar.
Muffels, R., & Kemperman, B. (2011). Does a better job match makes women happier? Work orientations,work-care choices and subjective well-being in Germany, SOEP Papers, No. 361, DIW Berlin, p. 32.
1184 R. Muffels, B. Headey
123
Muffels, R., & Tsakloglou, P., & Mayes, D. G. (2002). Social exclusion in European Welfare states. Serieson globalization and welfare (p. 366). Cheltenham: Edward Elgar.
Nussbaum, M. C. (1997). Capabilities and human rights. Fordham Law Review, 66, 273–300.Oswald, A. J., & Wu, S. (2010). Objective confirmation of subjective measures of human well-being:
Evidence from the USA. Science, 327(5965), 576–579.Powdthavee, N. (2007). Putting a price tag on friends, relatives and neighbours: Using surveys of life
satisfaction to value social relationships. Journal of Socio-Economics, 37(4), 1459–1480.Putnam, R. D. (2000). Bowling alone: The collapse and revival of American community. New York: Simon
& Schuster.Putnam, R. D., Leonard, R., & Nanetti, R. Y. (2005). Making democracy work. Princeton: Princeton
University Press.Runciman, W. G. (1966). Relative deprivation and social justice. London: Routledge and Kegan Paul.Schokkaert, E. (2007). The capabilities approach. CES Discussions Paper Series (DPS) 07.34.Sen, A. (1983). Poor, relatively speaking. Oxford Economic Papers, 35, 153–169.Sen, A. K. (1993). Capability and well-being. In M. Nussbaum & A. K. Sen (Eds.), The quality of life.
Oxford: OUP.Sen, A. (1999a). Development as freedom. New York: Alfred A. Knopf.Sen, A. (1999b). Commodities and capabilities. Oxford: Oxford University Press.Sen, A. K. (2004). Capabilities, lists and public reason: Continuing the conversation. Feminist Economics,
10(3), 77–80.Sen, A. K. (2005). Human rights and capabilities. Journal of Human Development, 6(2), 151–166.Stiglitz, J., Sen, A., & Fitoussi, J.-P. (2009). Report by the commission on the measurement of economic
performance and social progress. Brussels: European Union.van Praag, B. M. S., & Ferrer-i-Carbonell, A. (2004). Happiness quantified: A satisfaction calculus
approach. Oxford: Oxford University Press.Winkelmann, L., & Winkelmann, R. (1995). Happiness and unemployment: a panel data analysis for
Germany. Konjuncturpolitik, 41, 283–307.
Capabilities and Choices 1185
123