capacity planning in specialized healthcare
TRANSCRIPT
THESIS FOR THE DEGREE OF DOCTOR OF PHILOSOPHY
Capacity Planning in Specialized Healthcare
AGNETA LARSSON
Department of Technology Management and Economics CHALMERS UNIVERSITY OF TECHNOLOGY
Gothenburg, Sweden 2018

Capacity Planning in Specialized Healthcare
AGNETA LARSSON
ISBN 978-91-7597-829-1
© AGNETA LARSSON, 2018
Doktorsavhandlingar vid Chalmers tekniska högskola
Ny serie nr 4510
ISSN 0346-718X
Department of Technology Management and Economics
Chalmers University of Technology
SE-412 96 Göteborg
Sweden
Telephone + 46 (0)31-772 1000
Printed by Reproservice, Chalmers University of Technology
Göteborg, Sweden 2018

I
AbstractThe purpose of the thesis is to contribute to the knowledge of healthcare capacity planning for effective use of resources. Capacity planning concerns the balancing of the demand for capacity with the available capacity of the production system. Within the healthcare setting, various studies report on the difficulties of providing healthcare services according to patient demand. So, how can the balance between required and available capacity be achieved? How can we use our resources in accordance with what the patients need?
The research presented in this thesis is based on five research questions which are answered by the results of five case studies made at Swedish hospital departments. The research questions concern how discrepancies between practice and capacity planning theory may affect production performance; what a tactical capacity planning framework in healthcare would comprise; on what conditions rough-cut capacity methods (RCCP) are applicable in healthcare; the importance of including the knowledge of the surgeons when estimating required capacity; and if a team-based workflow can be employed without compromising production performance. The five research questions are answered through five individual studies, all with a case study approach.
The findings presented in this thesis provide knowledge regarding the structure of capacity planning processes; more specifically regarding the linkages between capacity planning processes and their effects on production performance. Furthermore, the research provides a step-by-step framework for tactical capacity planning to improve production performance by keeping a long-term perspective when planning. The tactical framework describes the structure of the capacity planning process and its included activities. Additionally, the framework gives an account of required information for the planning process and proposes possible adjustment to balance demand and supply. The output of the planning process is also described. To support the task of balancing required and available capacity two studies contribute to the interpretation of patient demand into required capacity. First, conditions under which rough-cut capacity planning methods are applicable in a healthcare setting are studied and discussed. Second, the research extends existing knowledge of the estimation of required surgery time, based on surgeons’ subjective knowledge of the patient condition and thereby decreasing the risk of exceeding the scheduled surgery time. As concerns assessing available capacity, the research studies the use of a team-based work method, which shows an increase of productivity compared with a functionally divided production system, while maintaining the same level of resources. In a capacity planning perspective, the use of teams simplifies the assessment of available capacity by reducing the number of planning points from individual workers to the number of teams.
Keywords: Capacity planning, healthcare, resources, effectiveness

II

III
ListofappendedpapersThis thesis is a compilation of papers and consist of five appended papers. The papers are referred to by Romans numbers and are listed below. Further down, Table 1 lists the appended papers and descries the contribution of the authors.
Paper I
Larsson, A., and Johansson, M. I. (2007) Healthcare Planning – a case study of a surgery department.
An earlier version of this paper was published in Proceedings of PLAN conference, 5-6 sept. 2007, Jönköping, Sweden
Paper II
Larsson, A., Fredriksson A. (2018) Tactical Capacity Planning in Hospital Departments. Accepted for publication in International Journal of Healthcare Quality Assurance.
The article is scheduled for Volume 32, Issue 7, due Aug 2019
Paper III
Larsson, A., Medbo, P., and Johansson, M.I. (2018) Conditions for using rough-cut capacity planning methods within healthcare
Manuscript submitted
Paper IV
Larsson, A. (2013) The accuracy of surgery time estimations, Production Planning & Control, 24:10-11, 891-902, DOI: 10.1080/09537287.2012.666897
Paper V
Larsson, A., Johansson, M., Bååthe, F. and Neselius, S. (2012) Reducing throughput time in a service organisation by introducing cross-functional teams. Production Planning & Control, 23:7, 571-580, DOI: 10.1080/09537287.2011.640074

IV

V
Table 1 Researcher contribution in each of the papers
PAPER TITLE FIRST AUTHOR
CO-AUTHOR/S
RESPONSIBILITY OF THE AUTHORS
I Healthcare Planning: A case study of a surgery department
Larsson, A. Johansson, M. Principal responsibility for data collection.
Second author responsible for the design of the study.
Shared responsibility for data analysis and writing
II Tactical capacity planning in hospital departments
Larsson, A. Fredriksson, A.
Principal responsibility for study design and data collection.
Shared responsibility for data analysis and writing.
III Conditions for using rough-cut capacity planning methods within healthcare
Larsson, A. Medbo, P Johansson, M.
.
Principal responsibility for study design, data collection.
Shared responsibility data analysis with second author and writing with third author.
IV The accuracy of surgery time estimations
Larsson, A. - Sole author
V Reducing throughput time in a service organisation by introducing cross-functional teams
Larsson, A Johansson, M. Bååthe, F. Neselius, S.
Principal responsibility for study design (not designing work method), data collection, Shared responsibility of data analysis and writing with second author.

VI

VII
AcknowledgmentDuring my many years as a PhD student I have had the privilege to work with great people. All the medical staff at the hospitals and all the people in academia that I have encounter during these years. It is hard to fit them all into a short text like this one, but the two most influential persons in the PhD process are very special. These two are my supervisors; Mats Johansson and Anna Fredriksson. I want to thank you both for all the time and effort you have put into my studies and texts to improve the quality. Mats, I have said it before and I’ll say it again, your comments are razor sharp and it has found many of the weaknesses I have had in my thesis. You are the best at finding them and there is no one like you. Anna, you are priceless with your encouragement and understanding. Thank you for all the suggestions that has solved many of my troubled times. Per Medbo, I must mention you explicitly. You have been such a joy to work with, both in teaching and studies. Your much-needed humour and not least your knowledge in statistical matters have been a great support in almost all my studies. Furthermore, I would like to thank all my colleagues through the years and wish I could mention all of you by name since you all deserve to be mentioned. You have made this journey a true pleasure.
We were five PhDs that started our PhD journey together a long time ago in 2007; Linea Kjellsdotter Ivert, Christian Finnsgård, Robin Hanson, and Joakim Kalantari. You guys will always be special to me.
The personal acknowledgment will be to my husband and best friend; Simon E Larsson. ‘If they were to write a book of the story of my life. They would have to mention you on every page they’d write. You are the other side of me’. I would like to add the names of my treasures in life in my acknowledgments; Jennifer, Gabriella and Maximilian. The older I get the more I realise that you are the greatest people that have ever lived. There are no ones like you … ever. I am so proud of you.

VIII

IX
Table of content Abstract I List of appended papers III Acknowledgment VII 1 Introduction 1
1.1 Problem background ....................................................................................................... 1 1.2 Capacity management in healthcare ................................................................................ 2 1.3 Purpose ............................................................................................................................ 4 1.4 Thesis outline .................................................................................................................. 5
2 Empirical setting 7 2.1 The Swedish Healthcare system ...................................................................................... 7
2.1.1 County council ......................................................................................................... 7 2.1.2 Healthcare providers ................................................................................................ 8 2.1.3 Departments ............................................................................................................. 8 2.1.4 Units ......................................................................................................................... 9 2.1.5 Activity ...................................................................................................................10
2.2 Patient demand ...............................................................................................................10 2.2.1 Volume ...................................................................................................................11 2.2.2 Mix ..........................................................................................................................11 2.2.3 Urgency...................................................................................................................12 2.2.4 Diagnostic uncertainty ............................................................................................12
2.3 Patient pathway ..............................................................................................................12 3 Frame of Reference 15
3.1 Capacity .........................................................................................................................15 3.1.1 Healthcare resources ...............................................................................................15 3.1.2 Differentiating capacity ..........................................................................................16
3.2 Capacity Management ....................................................................................................17 3.3 Capacity planning process ..............................................................................................18
3.3.1 Hierarchy of planning processes .............................................................................18 3.3.2 Tactical planning ....................................................................................................20 RQ 1: ................................................................................................................................22 3.3.3 Conducting the planning process ............................................................................22 RQ 2: ................................................................................................................................23
3.4 Estimation of Required Capacity ...................................................................................23 3.4.1 Required activities: Rough-cut capacity planning (RCCP) ....................................23 RQ 3: ................................................................................................................................25 3.4.2 Required activity time: Surgery time ......................................................................25 RQ 4: ................................................................................................................................27
3.5 Assessment of Available Capacity .................................................................................27 3.5.1 Functionally divided production .............................................................................27 3.5.2 Team-based work method .......................................................................................28 RQ 5: ................................................................................................................................29
3.6 Positioning of research questions in Conceptual Framework ........................................30 4 Methodology 31
4.1 Research Process ............................................................................................................31 4.2 Research design of the studies .......................................................................................32
4.2.1 Research design of Study 1 – Planning process discrepancies ...............................33 4.2.2 Research design of Study 2 – Capacity planning process .......................................34 4.2.3 Research design of Study 3 – Rough-cut capacity planning (RCCP) .....................34 4.2.4 Research design of Study 4 – Surgery-time estimation ..........................................35 4.2.5 Research design of Study 5 – Team-based work method .......................................36 4.2.6 Summary of research design ...................................................................................37
4.3 Data collection in the studies .........................................................................................39 4.3.1 Data collection in Study 1 – Planning process discrepancies .................................39

X
4.3.2 Data collection in Study 2 – Capacity planning process .........................................40 4.3.3 Data collection in Study 3 – Rough-cut capacity planning (RCCP) .......................42 4.3.4 Data collection in Study 4 – Surgery-time estimation ............................................43 4.3.5 Data collection in Study 5 – Team-based work method .........................................44
4.4 Data analysis of the studies ............................................................................................45 4.4.1 Data analysis in Study 1 – Planning process discrepancies ....................................46 4.4.2 Data analysis in Study 2 – Capacity planning process ...........................................46 4.4.3 Data analysis in Study 3 – Rough-cut capacity planning (RCCP) ..........................47 4.4.4 Data analysis in Study 4 – Study of surgery-time estimation .................................47 4.4.5 Data analysis in Study 5 – Team-based work method ............................................48
4.5 Research quality .............................................................................................................49 4.5.1 Credibility ...............................................................................................................50 4.5.2 Transferability .........................................................................................................51 4.5.3 Dependability ..........................................................................................................51 4.5.4 Confirmability .........................................................................................................52
5 Results 55 5.1 Research question 1 .......................................................................................................55
5.1.1 Structured procedures .............................................................................................55 5.1.2 Hierarchy of planning levels ...................................................................................56 5.1.3 Master planning and the master production plan ....................................................57 5.1.4 Forecasting and Prioritising ....................................................................................58 5.1.5 Summary of how planning process discrepancies affect performance ...................58
5.2 Research question 2 .......................................................................................................60 5.2.1 Framework for tactical capacity planning...............................................................60 5.2.2 Applying the framework to different departments ..................................................61
5.3 Research question 3 .......................................................................................................63 5.4 Research question 4 .......................................................................................................66 5.5 Research question 5 .......................................................................................................70
6 Discussion 73 6.1 How do planning process discrepancies affect production performance? .....................73
6.1.1 The individual link between capacity planning discrepancies and production performance .....................................................................................................................73 6.1.2 Combined discrepancies’ link to production performance .....................................75
6.2 What would a tactical capacity planning framework in healthcare comprise? ..............75 6.3 On what conditions are the rough-cut capacity planning methods (RCCP) applicable when estimating future required capacity? ..........................................................................76 6.4 Does the knowledge of the surgeons reduce the uncertainty of estimated required capacity operation theatres? .................................................................................................78 6.5 How can a team-based working method support assessment of available capacity? .....79 6.6 Effective use of resources ..............................................................................................80
7 Conclusions and further research 83 7.1 Conclusions drawn from included studies .....................................................................83 7.2 Concluding remarks .......................................................................................................84 7.3 Further research ..............................................................................................................85
References 89
1
1Introduction- What computer system should be purchased to achieve better control of the growing surgery queues?
This question was proposed by a Swedish healthcare manager and became the starting point for my research quest within the Swedish healthcare system. The question illustrates the perplexity at the challenge of growing patient queues, which face many healthcare managers. This thesis concerns the balancing of the demand for healthcare resources with the supply of the same, namely, capacity planning in healthcare.
1.1ProblembackgroundThe Swedish healthcare system is currently a relatively well-functioning system with deficiencies in certain areas. A publication released by the Swedish Ministry of Finance (Ministry of Finance, 2010) and statistics from the OECD Economics Department (Rae, 2005; OECD, 2016) stated that the Swedish healthcare system is performing well with regard to medical quality. However, one of the main concerns with the system is the availability of specific specialist treatment (Rae, 2005; OECD, 2016). The often-used explanation of experiencing low availability refers to a lack of capacity to explain long patient waiting times. With regard to the quantity of doctors, Sweden has a relatively high ratio of doctors per citizen, although the number of doctor visits is low (Almlöf et al., 2013; OECD, 2016). Compared to other Nordic countries, Swedish hospitals have distinguished themselves by showing the lowest productivity (Stiernstedt et al., 2016b). The low productivity is visible as the production rate remains stable whilst the amount of staff continues to increase. A challenge facing the Swedish healthcare system is also the change in demographics. The elderly share of the population is steadily increasing, as well as the expected lifespan (Rae, 2005; Stiernstedt et al., 2016b; OECD, 2016). For the healthcare sector, the elderly population generates higher expenditures, as elderly patients tend to require more medical services than their younger counterparts (Etzioni et al., 2003). The demographic change leads to a smaller share of the population that is of working age. This leads to a decrease in funding through taxes and a decrease in the available workforce. The challenge of a changing demographic requires a different approach to the use of resources and to the traditional approach of increasing the amount of resources when facing an increase in demand (Stiernstedt et al., 2016b).
Interventions addressing problems with low healthcare availability can be executed in different ways. Implementing incentives can stimulate the development of healthcare production in a desired direction. Regulations can be used to direct the healthcare providers towards increasing the availability and desired production performance (Swedish Association of Local Authorities and Regions, 2017; Stiernstedt et al., 2016a). One example of such a regulation is the Swedish ‘healthcare guarantee’ implemented in 2010 (The National Board of Health and Welfare, 2018a), which demanded healthcare providers to provide the first visit at the specialist care within three months after the referral is received. The provider is thereafter required to offer specialist treatment within an additional three months after the first visit. In situations where the provider is unable to provide the care, the regulation enables the patients to seek specialist care from another healthcare provider, at the expense of the initial provider. This regulation is intended to motivate the providers to ensure that their

2
production processes perform according to the regulated delivery time. Interventions that focus on organisational and structural changes in the healthcare system are another way to improve availability. In a report by Stiernstedt et al. (2016b), a differentiation of care is proposed, focusing the care provided by the hospitals on the very ill patients. According to this report, the primary care providers are to be empowered to treat a broader variety of ailments, including less complicated specialist care. The suggestion in the report is to strengthen the primary care units with staff from different specialisations. Through a reorganisation of the healthcare system, specialist care is designed to be closer to the patients and, thereby, leave costly hospital care to the very ill patients. Interventions based on medical and technological research also contribute to the efficiency of providing specialty care, such as new treatment methods or developments in medical technology (e.g. Stiernstedt et al., 2016a; Region Skåne, 2016). There are various options available to address the present challenges of low availability in Swedish healthcare. This research focuses on the capacity planning the use of resources within the production system at hand. In the situation that the research is studying, strategically decisions are made and forms the frame in which the capacity planning is performed. Strategic decisions that are made includes that the regulated production goals are stated, the production system and processes are designed, and the medical and technological methods are chosen and implemented.
To illustrate the focus that this thesis has in contributing to better availability of care, the insights compiled by two large studies of the Swedish healthcare system are used (Stiernstedt et al., 2016b; Ackerby et al., 2010). The studies revealed that the notion that the cause of the problem is a lack of resources is most often not true, but rather the way they are used, namely, ineffectively. This phenomenon is not specifically Swedish, as it has also been reported in research performed in other countries (e.g. Tai and Williams, 2008). According to Tai and Williams (2008), the lack of balance between demand and supply of healthcare services is not solely due to a lack of capacity but also to inappropriate capacity allocation. Thus, in a situation in which the amount of capacity is not the cause of problem, the question is: How can the capacity be managed more effectively?
1.2CapacitymanagementinhealthcareThe task concerning establishing, measuring, monitoring and adjusting limits or levels of capacity is referred to as capacity management, according to the Association for Supply Chain Management (APICS, 2005). This description of capacity management (further elaborated on in Chapter 3), within the context of managing a production system, aims at ensuring available capacity at the right time and place in relation to the required capacity. The required capacity is derived out of demand, and the available capacity is generated by the resources of the production system. Finding the balance between required capacity and available capacity is achieved through capacity planning processes (Jonsson and Mattsson, 2009). In a situation where there is no capacity planning, achieving the stated goals occurs more by chance than by managing the system properly. Planning the usage of capacity in the production system requires the ability to both predict the amount of the required capacity and assess the available capacity, that is, to meet the demand for capacity. To balance these two capacities, there are various planning and control processes to use at different planning horizons (Slack et al., 2007). For example, capacity planning can be performed either with a short-term planning focus to solve the balance of capacities over the tasks performed in a week or with a longer perspective, measured in years, to ensure the balance of capacities (e.g.

3
Jonsson and Mattsson, 2009). One way of structuring the hierarchy of planning processes is the manufacturing planning and control system (MPC) (Jonsson and Mattsson, 2009). This way of structuring the planning processes is the underlying structure on which the research is based.
The way to manage a production system depends on the characteristics of the production system and the characteristics of the products or services that are being produced (Jonsson and Mattsson, 2003; Jacobs et al., 2011). In other words, it is dependent on the context in which the system is working. This research is performed within the Swedish healthcare context. In the Swedish system, the providers are assigned a geographic area with a population to provide with care. The healthcare provider is expected to meet all demand generated by the geographic area and is not entitled to refuse any citizen care. The aim of the capacity planning is, therefore, to balance all demand requiring capacity with the available capacity at hand. Imbalances between required and available capacity may be caused by an insufficient amount of capacity, leading to patient waiting time or excess of capacity, the latter of which is related to costs and waste of capacity. The amount of capacity may be appropriate but still cause an imbalance due to the timing of the availability of the capacity. The capacity planning process provides a sequence of activities and decisions to ensure that the use of resources is as intended. Instead of letting the production continue ‘as usual’, decisions regarding what to produce and when become a consciously made choice based on agreed upon production plans. For service organisation, a statement made by Sasser (1976) described a manager’s role as: ‘Managing demand and supply is a key task of the service manager’. In Figure 1, the task of the managers has been illustrated. The figure depicts the task of the capacity planning process as balancing the required capacity with the available capacity by choosing ways to adjust the balance. The required capacity is derived prior to the capacity planning process and is depicted as patient demand in Figure 1.The patient demand consists of forecasts and the patients already within the production system (Jonsson and Mattsson, 2009). On the right-hand side of Figure 1 is the supply of resources that provides the available capacity. In this research, these resources are already set, and the changes in the number of resources rely on the adjustment phase of Figure 1. Hereafter in this thesis, Figure 1 is of central importance and depicts the conceptual model that is associated with the studies and results of the research.
Figure 1. Capacity planning: the central conceptual model of the thesis
A fundamental challenge of achieving balance between required and available capacity resides in the fact that the number of patients is seldom a static amount, but rather a stochastic variable (Silvester et al., 2004). The number of patients is not the only thing

4
that varies, but also the mix of diagnoses, patient conditions and severity. A similar reasoning can be stated about the capacity of the resources that are used in the production system, as the resources primarily consist of the skills of individual professionals with varying levels of competence and experience. Therefore, citing what Sasser said in 1976: ‘Managing demand and supply is not a single event, but rather an ongoing monitoring and adjusting process to maintain a balance between both amounts of capacity’. Capacity planning and management of the production system is an iterative process and can be expected to be a central and a continuous occurring event within healthcare management.
1.3PurposeThe ability of balancing demand with supply resides in an organisation’s processes of capacity planning. To better adjust the capacity of the resources according to the demand of the patients, this thesis focuses on the balancing of the two capacities. Finding balance is a prerequisite for having an effective use of resources. ‘Effective use’ refers to the use of resources that are allocated according to the demand priority. Prioritising a patient group could be based on excessive waiting time or a patient group with urgent need of care. Hereby, the effective use of resources describes a use of resources in accordance with the characteristics of the patient demand. The purpose of the research is to better understand what capacity planning for an effective use of resources may entail, and the purpose of the thesis is hereby formulated as:
Contribute to the knowledge of healthcare capacity planning for effective use of resources
As the area of capacity planning is a vast topic, five research questions are posed to address this purpose. These research questions are generated and presented in Chapter 3. Five studies are designed to answer one research question each, and the results of the studies contribute in various ways to the knowledge of capacity planning for an effective use of resources. Research question 1 focuses on the hierarchical structure of capacity planning processes. Research question 2 focuses on one aspect of capacity planning, namely the master planning process. Research questions 3 and 4 focus on estimating the required capacity derived out of the patient demand. Lastly, research question 5 focuses on assessing the available capacity. The studies constituting the thesis are performed within the Swedish healthcare setting, with a focus on the planning processes at hospital specialist departments. Hereby, the research is made within the hospital setting and focuses on capacity planning the production of specialist treatment.

5
1.4ThesisoutlineThe outline of the thesis is as follows:
Chapter 1 (Introduction) introduces the research area and the problem background of the thesis. Furthermore, the chapter presents the central conceptual model of the thesis and the purpose whilst also providing an overview of the structure of the thesis.
Chapter 2 (Empirical setting) presents the characteristics of the empirical setting in which the research is performed.
Chapter 3 (Theoretical framework) presents a general theoretical introduction to the area of capacity management. The capacity planning process is described and broken down into the components of the conceptual model in Figure 1. In this chapter, the five research questions of this thesis are generated.
Chapter 4 (Methodology) describes the research methodology applied in the studies constituting the research.
Chapter 5 (Results) presents the results of the performed studies, answering the five research questions.
Chapter 6 (Discussion) discusses the results of the research in relation to the five research questions and to the overall purpose of the thesis.
Chapter 7 (Conclusions and further research) concludes the thesis and presents implications drawn from the results. It also suggests future research based on the work presented in this thesis.

6

7
2EmpiricalsettingThis chapter describes the empirical setting in which the research takes place. The purpose of the chapter is to provide the reader with an empirical description of the Swedish healthcare system, with some references to other national healthcare systems. Hereby, the reader is provided an understanding of the context and the parts of the healthcare system that the results are based upon.
The term healthcare refers to the provision of health-improving services based on well-established medical knowledge (Blomqvist, 2007). In practice, this refers to care services provided by staff with medical competence that are authorised by society. Other health improving services that may be well-established but lack the scientific testing and are not based on society-approved medical science are referred to as alternative medicine. These types of health-improving services are not included in healthcare. The organisation of the provision of healthcare services is referred to as the healthcare system. The system consists of various actors with different purposes and tasks, such as hospitals, clinics, practitioners, politicians and officials. The financing of the healthcare system is based on insurance that is activated in the moment of need. The way insurance premiums are paid worldwide differs from one national healthcare system to the next. The healthcare system that this thesis is based upon is the Swedish healthcare system, which will be described in more detail.
2.1TheSwedishHealthcaresystemTo describe the healthcare systems and attain a common terminology for this thesis, this section will present the parts of the Swedish healthcare system and the terms used in this thesis to describe the system.
2.1.1 County council The overall responsibility for the healthcare system in Sweden lies with the Swedish government. The government is the normative and controlling body that is responsible for supervising, providing knowledge support and giving financial grants (Stiernstedt et al., 2016a; Blomqvist, 2007). The political responsibility of providing healthcare in Sweden is delegated to the county councils. This has led to a situation where the Swedish healthcare system consists of numerous sub-organisations and is fragmented when it comes to production and financing of the system. The healthcare system consists of 20 county councils (Landsting/regioner) and 290 local authorities (Kommuner) that together are responsible for the provision of healthcare (Stiernstedt et al., 2016a). The county councils work together in regions concerning highly specialised care, which results in some hospitals being allocated a geographic area that includes more than one county council.
The financing of the healthcare system is made through a specific tax set by the county council. About 70-75% of the financing of the healthcare is collected through this tax system. Another 15-20% of the healthcare costs are covered by governmental funds, and the remainder of the costs are collected through an admission fee. The governmental funds are distributed according to two main principles: the listing principle (i.e. the number of patients listed at the provider) and in accordance with care delivery, where there is an agreed-upon list of charges for the treatment of certain ailments (Blomqvist, 2007). The latter system considers that some treatments are costlier than others and are, therefore, based on costs related to the diagnosis, with
8
points charged according to the diagnosis-related group (DRG points). For institutionalised providers, such as hospitals, the funds are allocated through budget proceedings where a certain amount is given per time period, often on the basis of previous expenses (Blomqvist, 2007). The task of converting the allocated budget and politically formed production goals into production is under the healthcare managers. The planning processes through which this conversion is made is the area of knowledge where this thesis will contribute with research findings.
2.1.2 Healthcare providers The Swedish healthcare system consists of both publicly owned healthcare providers and a rising number of privately owned providers (Blomqvist, 2007; Öhrming, 2008). The healthcare providers may vary in size and in range of specialty. The healthcare system includes a nationwide network of general practitioner clinics that provide care for less severe ailments. These care centres work as a first contact point for patients. In cases when specialised care is required, patients are referred to the parts of the system with specialised care. This type of care is provided at hospitals and private clinics that have specialised resources for the specific ailment. Larger-sized hospitals are in general publicly owned, whilst the middle-sized and small-sized healthcare providers are a mixture of privately and publicly owned providers (Blomqvist, 2007). The larger hospitals are also often closely connected to medical faculties at the universities. Research and education in medicine is, therefore, an often-occurring part of the daily activities at these hospitals.
2.1.3 Departments Departments are managerial subdivisions of larger healthcare providers. Hospital organisations are, like many other organisations, functionally divided. Functions such as finance, marketing, operations and human resources are present in healthcare providers. The clinical operations are traditionally also functionally divided according to medical specialty. The expertise of a department may, for example, be within orthopaedics, oncology, paediatrics or other areas of medicine. The functional organisation that is based on medical specialisation results in consolidating required resources in one subdivision of the organisation. This includes staff with common educational specialisation and training and may include specific facilities and technology. In this way, the department is equipped with required resources to provide care within its expertise. For university hospitals, the focus of expertise and equipment in a sub-organisation contributes to an environment where the teaching, provision of care and performed research in the medical area of specialisation contribute to each other in a beneficial way. The division into functions works well from an organisational perspective. From a patient perspective, this may cause difficulties for patients or patient groups requiring resources from multiple functions. The capacity planning is often made within the department according to patient demand within its specialisation, which, in the case of multi-functional patients, results in fragmented planning of the patient process.
The division of the healthcare organisation according to medical specialisation often results in the managerial responsibility of a department being given to a senior physician. The task of the department manager involves transforming the department’s allocated finances and the available resources into healthcare services in accordance with production goals. In this respect, hospital departments are similar to small

9
businesses within the healthcare organisation, containing resources, objectives and performance measurements of their own (de Vries et al., 1999).
Shared resources There are some departments that have a characteristic that differentiates them from other departments, that is, when the department resources are so-called shared resources. Examples of departments with shared resources are the radiology department and operating theatres. The resources of these departments are to serve other departments. The resources associated with operating theatres and radiology departments are cost intensive, whether they are regarding staff, equipment or facilities. These departments are often centralised in hospitals as a shared resource. The capacity planning of shared resources includes fitting the demand of the departments employing the shared resources. For these types of departments, the demand for resources are generated by other departments. The primary production goal is to provide as much capacity to other departments as possible, in accordance with the requirements of each department.
A department may also be shared within a geographic region and thereby shared between different healthcare providers. This means that the resources that are shared are not available at all healthcare providers. Regionally shared resources may be due to a shortage of specialists in specific medical conditions, or the scarcity of certain technologies for treatments or diagnostics. Regionally shared resources may also be used when the use of resources becomes inefficient, as the resources are used by a relatively small number of patients dispersed amongst many healthcare providers. In these cases, the resources of a department may be shared by multiple healthcare providers.
Emergency department The emergency department is a different department compared to traditional departments such orthopaedics, urology and other specialisation areas. The emergency department is different in the sense of comprising multiple medical specialisation areas and due to the characteristics of the treatment provision, that is, the specialisation in first aid and initial treatment. The medical expertise of the emergency department is provided by physicians from other specialised departments, such as the orthopaedic department and the paediatric department. However, there are initiatives for creating a specialisation track within emergency care. When the physicians at the emergency department are provided by other departments, it causes managerial challenges for the managers at the emergency department. The managers of the emergency department oversee the nurses, assistant nurses, administrative staff, facilities and equipment, whilst the physicians are managed by a different department. The challenges rely on the fact that the medical expertise of the physicians is decisive in the diagnostic activities, which controls the flow of patients through the resources. Lacking determinative decisions for this critical resource constitutes a managerial challenge.
2.1.4 Units The units are the smaller parts that, together, constitute a department. Units are specialised according to their operational characteristics, which are the care and treatment that are provided (de Vries et al., 1999). Units are, for example, clinics, ward units and specialised care units, such as the post-anaesthetic care unit and the intensive care unit. The clinic is one example of a unit specialised in providing outpatient care to patients able to leave the clinic after visits. Unlike the clinic that discharges the patients
10
at the end of the day, the specialisation of the ward unit is to provide inpatient care over a longer time span. Patients are cared for 24/7 until they are discharged. Outpatient care can be contrasted to the care provided by the ward unit, as the latter provides full-time care for inpatients.
2.1.5 Activity The term ‘activity’ is used in this thesis for the point of contact between the healthcare system and the patients. An often-used term for this small part of a production system is the term operation. To eliminate the risk of misunderstanding, the term operation is not used due to its similar meaning to the term surgery. Hence, the term activity is used. The level of detail in the term activity can vary, depending on the studied level of detail. An activity within an outpatient clinic may be registration, followed by a doctor’s visit, and a visit to the nurses for a blood sample followed by discharge. The activities at a department level may refer to admission at the ward unit, pre-surgery tests, surgery, post anaesthetic care unit, and a stay in the ward unit followed by discharge.
Healthcare activities, together with waiting time, constitute the patient pathway through the healthcare system. To provide the required treatment, the resources may have to be combined and used simultaneously or sequentially to deliver care in accordance with the needs of the patients. The combination of resources within an activity may be, to a greater or lesser extent, dependent on the task. For example, the physician is a vital resource that may be considered a sufficient resource in the task of diagnosing patients. However, it is a vital but insufficient resource for the patients at the operating theatre. Therefore, a resource may represent the capacity of the activity on its own, for example, the diagnosing physician, whilst the capacity of another activity, such as surgery, requires a combination of resources.
2.2PatientdemandThe term ‘patient demand’ is used in this thesis to describe the population’s need for healthcare services. The term emphasises that the demand placed on the healthcare system is generated by the patients’ needs, not by politically stated production goals or what the management choose to highlight in healthcare production. Swedish healthcare providers are commissioned to meet all demand within their geographic area; therefore, the characteristics of the population decide what the system is required to produce. This section will describe some general characteristics of the patient demand that influence the way healthcare providers manage their resources to produce the required capacity. The characteristics and variation of the demand decide what adjustments are suitable in different situations that occur.
There are different ways to describe the demand placed on the healthcare production system. In the works of Lillrank et al. (2010), the variety of patient conditions is divided into groups (modes) based on required care made by the healthcare system. These patient groups are prevention (support to patient requiring lifestyle changes to prevent disease), emergency (requiring immediate care), one visit (can be treated at the visit), project (requiring case-specific coordination of resources), elective process (having a predefined treatment process), cure process (demand for resources is revealed along the patient pathway) and care (chronic condition with no end date). Christensen et al. (2009) divided the variety of patient conditions into fewer categories and made a distinction between precision medicine, intuitive medicine and chronic diseases. Precision medicine refers to when a case can be treated in a predictable sequence of

11
activities, whereas intuitive medicine relies on clinical judgement and iterative processes to find proper cure. The chronic patients are the patients that require a lifelong care process. The categorisation of patients presented in Lillrank et al. (2010) and Christensen et al. (2009) both described how the properties of the patients affect the demand and the production of care. The properties of patient demand affect the duration of the diagnostic phase and treatment phase. The categorisation of patients presented in Lillrank et al. (2010) and Christensen et al. (2009) is used in this chapter to show the broad range of patient conditions treated and, thereby, how differentiated the care needs to be.
To describe the patient demand in general terms, such as patient groups, the following sections will use broader characteristics of patient demand to describe variety facing managers. These general characteristics of the patient demand is the variation in demand in terms of: volume (number of patients), mix of diagnoses (number of diagnoses), level of urgency (required delivery lead-time of treatment) and level of diagnostic uncertainty (what treatment is required).
2.2.1VolumeThe volume of demand is of importance to match the available capacity to the anticipated required capacity. For some patient groups, the amplitude of patient volume is relatively stable and within the range of what the available capacity is capable of treating. For other patient groups, the required capacity varies largely over time and requires adjustments to avoid excessive capacity or lack of capacity. The cause of variations in volume may differ. Within one patient group, the ailments may be season-bound and vary depending on the time of the year (e.g. bone fractures during winter). Other anticipated variations in patient volume may be related to social and political changes, such as increased governmental child support leading to an increase in the number of pregnancies or political decisions regarding nationwide vaccinations. Cases with large, unanticipated changes in patient volume require a large amount of excess capacity or a production system with high flexibility in capacity levels. Having excess capacity or flexible production system makes it possible to adjust according to demand. Variations may also occur in the frequency of changes. In contrary to changes in volume for season-bound variations, where the frequency is measured in years or months, the variations may also be measured in weeks, days and hours, where highs and lows are dependent on the days of the week or the time of day.
2.2.2 Mix The allocation of patient groups to a department or a provider is traditionally made according to medical specialisation, where the medical specialisation concerns both the characteristics of the patient condition (diagnosis) and the medical specialisation of the resources (staff, facilities and technology). For example, in a cardiology department, patients with heart and vascular disorders are treated by specialised cardiologists and specialised technology for this medical field. Despite the common requirement for specialisation within cardiology, the requirement for diagnostic and treatment activities may differ according to the diagnosis within the specialisation field. Hence, when describing the patient demand, the mix of patients refers to the variety in resource requirements between patient groups. To supply resources properly amongst patient groups, this variety needs to be considered.

12
2.2.3 Urgency The urgency of delivery varies between elective patients and acute patients. The category of elective patients can be denoted to patients that are scheduled in advance and allocated resources. Acute patients are those requiring immediate care, such as the provision of urgent care to patients in the emergency department. However, acute care episodes may occur during elective patient processes or as part of a chronic care process, which means that the acute and elective cases are not clearly segregated. There are also patients with semi-urgent conditions that require prompt treatment to prevent the condition from evolving into something more severe. Conditions like these may be exemplified by aggressive cancerous conditions or similar diagnoses.
2.2.4 Diagnostic uncertainty This category of variation in patient demand concerns the condition of the patient’s ailment and the ability to diagnose and determine proper treatment. As an example of the variation of diagnostic uncertainty, the differences in treatment between a patient with a fractured leg and the treatment of a patient with diffuse abdominal pain require dissimilar diagnostic approaches. The first case the treatment options can be predefined in its diagnostic phase (precision medicine in Christensen et al., 2009 and elective process in Lillrank et al., 2010). The latter case with diffuse abdominal pains may be more demanding in its diagnostic requirements as well as the therapy options (intuitive medicine in Christensen et al. (2009) and cure process in Lillrank et al. (2010)). Uncertainties like the latter case, compared to the predefined patient process of a fractured leg, put different strains on the production system, most of all when striving to achieve effective management of the system. The undefined requirements of the latter case make it difficult to know the available capacity to dedicate to the patient group.
2.3PatientpathwayThe patient pathway is the chain of interactions between healthcare providers and patients through the healthcare system. As illustrated in Figure 2, the patient pathway consists of a mixture of diagnostic and treatment activities. Depending on the patient condition, the mixture of activities varies. As described above, some conditions are more difficult than others to diagnose and require multiple diagnostic activities and testing of treatment alternatives to find the right treatment. According to the categorisation of demand by Lillrank et al. (2010), the patient pathway of these types of patients requires an elective process.
The initial contact between the healthcare system and patients in the Swedish healthcare system is at the general physician clinic or other outpatient clinics. Another entrance point into the system is through the emergency department, either by walking in or entering by an ambulance. In some cases, the patient is diagnosed and treated at this first contact with the healthcare system, referred to as ‘one visit’ in Lillrank et al. (2010). In other cases, the patients’ conditions require further treatment. The patient is referred onward in the system for specialist treatment (see Figure 2) and may hereby pass through different healthcare providers in the system. A third entrance point into the healthcare system is through screening programmes. For identified sick patients in these programmes, the patients enter standardised patient processes for the specific ailment (Standardiserat vårdförlopp, SVF) (The National Board of Health and Welfare, 2018b). The standardised patient processes are designed for cancerous patient groups to minimise the waiting time and treat the cancer as early as possible.

13
Figure 2. Example of a simplified patient pathway consisting of a mix of diagnostic and treatment activities, passing through three healthcare providers
At first contact, there is always some sort of triaging activity, whether it is with the general physician or at the hospitals. The triaging may, for example, be performed at the emergency department or by triaging incoming referrals at the department. The purpose of the triage is to identify the patients at risk of becoming more severely ill during the patient pathway. Therefore, triaging of new patients, as well as a first visit to the physician, is commonly used as the first step of the patient pathway, regardless of patient group or diagnosis.
The diagnosis and treatment plan may be shorter or longer in length, depending on the diagnosis and the ability to diagnose the patients. According to the outcome of the diagnostic activities, a treatment plan or process is formed and further required activities are identified. The treatment process contains required resources and activities identified as necessary to treat the ailment. The decision of how the treatment is constituted is up to the physician engaged in the diagnostic activities. The process and its activities may, however, change over time when alteration is required due to test results or changes in the condition of the patient. For some patient groups, the treatment process is rather standardised and easy to know in advance. Other patient groups are more difficult to diagnose and rely heavily on the skill and experience of the physician to identify patterns in symptoms, i.e. requiring intuitive medicine (Christensen et al., 2009). The latter case creates a patient pathway with frequent alternations between diagnostic and treatment activities.
Treatment activities (e.g. Medicine, Surgery, Therapy)
General Physician Hospital General Physician, Nursing home
Diagnostic activities (e.g. Laboratory tests,Radiology)
Patient pathway

14

15
3FrameofReferenceThis chapter presents theory relevant to the research area presented in this thesis. The first two parts, sections 3.1 and 3.2, are dedicated to two of the three central terms of the research area, namely, capacity and capacity management. The third central term of the thesis is the capacity planning process, Section 3.3. In this section the first (RQ1) and second (RQ2) research questions are derived. Section 3.4 examines the estimation of required capacity. In this section, RQ3 and RQ4 are derived. Section 3.5 discusses the assessment of available capacity, and in this section the fifth (RQ5) research question is derived. The last part, section 3.6, summarizes and positions the research questions in the conceptual framework of the thesis.
3.1CapacityThe capacity of a production system, a work station or an individual worker is the capability of that resource to perform according to its expected function (APICS, 2005). Capability denotes the output that the resource is able to produce in a given time period (APICS, 2005). In a healthcare setting, where services are being produced, the capacity may be rearticulated to the maximum level of output of performed activities over a period of time (Slack et al., 1998). To get a valid measure of a resource capacity, the level of capacity is measured as the delivery of activities performed under normal operational conditions and not during short-term intensive bursts (Slack et al., 1998). Conducting research on healthcare delivery capacity involves the study of healthcare resources’ capability to provide the required production of care, and the study of resource management to ensure supply of the required capacity.
3.1.1HealthcareresourcesA general description of a resource is that it is something that adds value to goods or services in its creation, production or delivery (APICS, 2005). At a strategic level, resources may come in the form of financial means which are used for acquiring resources such as facilities, workforce and equipment. Resources used within the healthcare production system involve a complicated system of staff, equipment, tools, facilities, clinical material, administrative and clinical technology and more. The production system at the healthcare providers does not only include the production system of diagnostic and treatment activities but also the required supporting processes. The latter may include financial activities, material deliveries, technology and facility maintenance. This thesis will not include all the activities required by the production system at a healthcare provider but will focus on the diagnostic and treatment activities that are used along the patient pathway. Political decisions and budget allocation, made at the strategic level, are considered as being made outside the scope of this research. These types of decisions form the conditions in which the management of resources and capacity planning are made.
According to the literature of healthcare management, one way of describing resources in a healthcare system is as the system’s capacity, its materials and its services (de Vries et al., 1999). However, this definition of healthcare resources is problematic from a capacity planning perspective. Services, for example, can be of different types, where some services are of a supportive kind, such as software services (Vissers et al., 2001). Talking about the services of a production system rather considers a product of the resources. When it comes to material as a resource, the decision not to focus on material is due to the complexity of the material supply processes. Including the material supply
16
processes would make the scope of the thesis too vast. The choice of excluding the material supply when capacity planning is supported in the literature (Vissers and Beech, 2008). The purpose of employing capacity planning processes is to find a method to link the daily operation to the strategically set goals and to achieve those goals. The planning of the daily operations concerns who does what, where and when. This has led to the resources that are included in this research being those included in the definition stated by Smith-Daniels et al. (1988), namely, facilities, equipment and workforce. Exemplifying each category of healthcare resources would be examination rooms and operating rooms (facilities), surgery and radiology equipment (equipment), and nurses and physicians (workforce). Together, the resources are important parts of the system which delivers the healthcare
Resource ownership The ownership of the resources relating to healthcare vary depending on the type of the resource. As described in the chapter regarding the empirical setting, Chapter 2, resource can be shared where the ownership and management of the resource are under one organisational structure, while decisions concerning use of the resources are made by other departments and units (Vissers et al., 2001; Vissers and Beech, 2008). The capacity planning of a shared resource must consider the requirements of different stakeholders. For example, the management of a shared resource, such as a radiology department, must consider the combined capacity requirements of other departments within the radiology capacity.
A resource may also be shared between activities. Sharing capacity at a level concerning activities implies that the resource is likely managed by a single manager. An example of a shared resource between activities is the physician, who is required in diagnostic activities at a clinic and in the treatment activities at various units, such as a ward unit or an operating theatre. This is due to the physicians’ multifunctional character (Vissers et al., 2001). Physicians can be shared between departments as in the case of an emergency department. In this case, the physician is shared between the emergency department and its specialized ‘home’ department.
In contrast a dedicated resource is fully managed by the system that it is dedicated to. A dedicated resource could, for example, be equipment or facilities. Nurses are in general dedicated to a certain department and a specific set of activities that may be performed at a ward unit. But as all rules have exceptions, this categorisation of resources has, too. A resource may be considered as a dedicated resource when considering the departmental level but considered as a time-shared resource when considering activities performed at the departments, as in the case of physicians.
3.1.2DifferentiatingcapacityCapacity is a measure of output per time unit for a specific resource or group of resources (Vissers and Beech, 2008; APICS, 2005). Different types of capacity are distinguished in this section of the thesis. Terms like ‘theoretical’ and ‘calculated capacity’ are used in the manufacturing industry (e.g. APICS, 2005). In this thesis, the differentiation made by Vissers and Beech (2008) is used due to its application in a healthcare context, as follows:
Potential capacity is the capacity representing the situation when the total amount of one type of available resource is all used for production. To provide an example drawn

17
from the healthcare setting, the potential capacity of an operating theatre is the total number of surgery rooms, fully equipped, and ready for production, at every hour.
Available capacity (the concept of this thesis) denotes the capacity that is chosen to be available for use. It thus equals non-available capacity subtracted from the potential capacity. In the healthcare setting, this could represent time that the surgery department does not utilise during evenings or weekends. It could also be loss of capacity due to the decision to withdraw some of the rooms from use for other reasons. This diminishes the potential capacity to the so-called available capacity.
Usable capacity is the capacity that remains after removing non-usable time, which is that required for scheduled maintenance and scheduled time reserved for additional production. In the operating theatre, the reserved time could include time reserved for emergency surgeries or other time slots dedicated to specific production plans. In the manufacturing setting, this could include time dedicated for re-production of components originally made but found to be of deficient quality.
Utilised capacity is the capacity that is used for production. The idle time is the loss of capacity due to scheduled sessions that are cancelled, or the time left when sessions take less time than estimated. Included in the utilised capacity is also non-productive time that is necessary for production. For the operating theatre, non-productive time is used for setup time between surgeries, that is, necessary time but not productive. The remaining capacity, after removing the non-productive time, is called the productive capacity.
3.2CapacityManagementIn a literature study of the field of capacity management research during the time period 1986-2006, the synthesis of research topics within the field presented models for capacity management, workforce management, capacity utilisation, subcontracting and information technology (Jack and Powers, 2009). These topics were a development out of the previous research focus which could be synthesized as concerning acquisition and allocation of resources (Smith-Daniels et al., 1988). The research presented in this thesis contributes to the first three categories presented by Jack and Powers (2009), which are capacity management models, workforce management and capacity utilisation. Subcontracting and information technology are not in focus but are touched upon briefly in the research.
The definition of capacity management used in this thesis is that it is ‘the function of establishing, measuring, monitoring and adjusting limits or levels of capacity in order to execute all manufacturing schedules’ (APICS, 2005). Here, the core task of the capacity management task is to balance the required capacity (derived by patients already in the production system and the forecasted demand) with the available capacity provided by the supply of resources. What is referred to as ‘function’ in the definition is not clearly stated. The term ‘function’ is easily associated with organisational functions, such as finance, human relations or sales. However, such a capacity management function can hardly be found in an organisation. Instead, it refers to the managers within the organisation that are given the task of managing the capacity.
The characteristics of a healthcare production system inherit the challenges that service production systems encounter. One prominent characteristic of service production systems is their inability to store capacity for future need (e.g. Fitzsimmons and

18
Fitzsimmons, 2006; Johnston and Clark, 2001). This refers to the inability to store diagnostic or treatment procedures. This kind of moment-bound capacity leads to waiting time when a lack of sufficient capacity exists. Even though the average amount of available capacity corresponds to the average amount of required capacity, the result could still be periods of time when capacity is lost. This is due to variations in either demand or supply, or both. Thus, the matching of the capacities, in both time and amount, becomes an important task within capacity management in healthcare (Silvester et al., 2004).
3.3CapacityplanningprocessThis section looks further into the process of capacity planning which can be defined as the ‘process of determining the amount of capacity required to produce in the future’ (APICS, 2005). This definition seems to reduce capacity planning to a process of purely estimating and seizing future required capacity, thereby lacking activities to ensure the presence of available capacity when required. When mentioned in this thesis, the term ‘capacity planning process’ includes more than the above definition, by referring to the process in which capacity management is performed. Taking the definition of ‘capacity management’ (Section 3.2) and combining it with the definition of ‘capacity planning process’, the result would be the process of determining future required capacity, establishing, measuring, monitoring and adjusting limits or levels of capacity. The purpose of this process is to achieve a feasible production plan (Olhager and Wikner, 2000; Olhager et al., 2001; Browne et al., 1996; Johnston and Clark, 2001). This definition of capacity planning is analogous to the description of capacity planning made by Jonsson and Mattsson (2009) who describe it as calculating the need for capacity and comparing it with currently available capacity. After comparing the two capacities, adjustments are made until an acceptable balance between the two is obtained by adjusting either available capacity or (and) demand for capacity.
3.3.1HierarchyofplanningprocessesProduction planning is often described as a hierarchal structure of processes on the strategic, tactical and operational levels (e.g. Jack and Powers, 2009; Rhyne and Jupp, 1988; de Vries et al., 1999; Roth and van Dierdonk, 1995; Hans et al., 2011). The strategic level includes the long-term planning made by top management (Vissers et al., 2001) with a focus on structural decisions (Hans et al., 2011). Within the Swedish healthcare system, the political responsibility of providing healthcare and the financing of its provision lies with the county councils (Blomqvist, 2007). Political decisions made at the strategic level form production performance goals for the part of the healthcare system, which is subject to the county councils and provides the financial means for managing healthcare production. Additionally, decisions regarding the allocation of the finances within the healthcare organisations are made by the top management of the healthcare providers (Blomqvist, 2007). In this way, the strategic planning level spans the county councils and top management of the healthcare providers, in which production goals are stated and allocation of means to perform according to the stated goals (see top level in Figure 3).

19
Figure 3. Hierarchical system of capacity planning processes in the healthcare setting.
At the tactical planning level, strategic planning is disaggregated into a master production plan. At this level, decisions regarding the organisation of operations and the delivery process are considered (Hans et al., 2011). The purpose of the planning process at this level is to produce a master production plan that interprets stated production goals into a production rate, balanced with available resources (Blackstone, 1989). The focus of tactical planning is on product or service group where the capacity planning process results in a rough-cut capacity plan (Jonsson and Mattsson, 2009). Within the groups, individual products or services are categorized according to similarity in properties, such as comprised components or resource requirements. Within healthcare, the groups are often based on the Diagnostic-Related Groups system (DRG) which are based on the resource requirements for treating different kinds of diagnoses (Blomqvist, 2007; Roth and van Dierdonk, 1995; Fetter and Freeman, 1986). This system is often used as the basis for calculating the costs related to healthcare production (Blomqvist, 2007). The planning horizon of the tactical planning process varies among organisations depending on the lead times of products or services (Grimson and Pyke, 2007). It can span from less than six months to over 18 months (Tavares Thomé et al., 2012). The frequency of tactical planning is usually monthly or quarterly (Feng et al., 2008; Jonsson and Mattsson, 2009).
Tactical planning, that is, the master production scheduling, is in turn broken down even more into planning individual products or services, and operations at the operational level (Butler et al., 1996; Olhager and Wikner, 2000). At this level, the planning period becomes shorter (weekly or daily) with a planning horizon of approximately six months. The master production schedule produced at the tactical level is here filled with specific orders (denoted as order scheduling in Figure 3) and allocated specific resources. An important function in linking the planning levels together is the disaggregating of plans of higher planning levels to lower planning levels, and the function of providing feedback to higher planning levels, with information regarding the feasibility of the plans and the production performance (Olhager and Wikner, 2000) (see the right-hand arrows in Figure 3). After the operational plans are set, the execution of the schedules is made. At this level, daily adjustments are made when required.
Many studies of capacity planning in healthcare have focused on finding a method for making optimal scheduling of patients to get the best use of available resources. For example, studies performed on the operational level concern studies of suitable routing of patients through an intensive care unit (Ridge et al., 1998), operating theatre scheduling (Cardoen et al., 2010), the impact of the mix in daily admissions planning (Adan and Vissers, 2002), a simulation model for matching demand and supply of resources (Gupta et al., 2007) and the effects of integrating capacity aspects, patient

20
flow and scheduling when planning (White et al., 2011). Less attention is given to the tactical planning level at which the linkage between strategic planning and the everyday production is made. The importance of the tactical planning level lies in its function of realising stated production goals by balancing supply of resources with the demand for services. At this level, the control of production performance according to goals is also made. Therefore, the next section is devoted to the tactical planning level.
3.3.2TacticalplanningThis section focuses on the tactical level and its crucial role in achieving production goals. Tactical planning provides the operational level with a master production schedule which transforms the stated goals at the strategic level into daily activities at the operational level. The tactical level constitutes the link between decisions on the strategic level with the decisions on the operational level (Hans et al., 2011). To better understand tactical capacity planning, require an understanding of its connections to both the upper planning level (the strategic) and the planning level below (the operational).
The structure used in this thesis to describe the hierarchy of planning processes is drawn from the manufacturing planning and control system (MPC) as described in Jonsson and Mattsson (2009). In the hierarchical MPC structure (Figure 4), the sales and operations planning (S&OP) process lies at the top as a tactical planning process, having a planning horizon up to about two years (Jonsson and Mattsson, 2009). The output from the S&OP process typically includes a production plan, together with a sales plan, and, depending on the context of the operations, additional plans such as a financial plan or a delivery plan. The production plan is at the next lower level in the planning hierarchy disaggregated into a master production schedule. The literature differs as to whether the S&OP process resides at the strategic level or at the tactical level, or tries to cover both (Tavares Thomé et al., 2012; Olhager et al., 2001). However, the dominant perception is that S&OP is considered a tactical process (Tavares Thomé et al., 2012).
The S&OP planning process is used to develop tactical plans that provide management with the ability to direct its business (APICS, 2005) and links plans made by different functions of the organization into one integrated set of plans (APICS, 2005). In manufacturing companies, the functions are, for example, production, marketing or finance. In healthcare organizations, the focus of coordination is rather used in coordinating units of production along the pathway of the patient groups. The aim of the S&OP process is to create consensus regarding goals and to generate feasible plans to achieve the goals (Feng et al., 2008). Commitment to coordinated plans are made in the S&OP process and the balance between capacity and production requirements is set (Proud, 1994). A properly executed S&OP process constitutes the link between the strategic business plans and their execution (APICS, 2005; Tavares Thomé et al., 2012).

21
Figure 4. The manufacturing planning and control (MPC) structure, based on Jonsson and Mattsson (2009).
In practice, the S&OP process and the MPC process are not always two separate processes but are merged into one tactical planning process. This may be the case when the planning processes are difficult to separate, or it is not desirable to separate them. When this happens, this is denoted as a master planning process and includes demand management, production planning, resource planning, master production scheduling and rough-cut capacity planning (APICS, 2005; Olhager and Wikner, 2000) (see Figure 5).
Figure 5. Area of the MPC structure that defines a master planning process, based on Jonsson and Mattsson (2009).
The literature concerning tactical planning contains studies with analytical models or methods providing decision-supporting tools regarding capacity planning. Studies treating tactical capacity planning in healthcare can be roughly categorized into two dominant groups: research that focuses on how to utilise resources in an effective or optimal way, and studies that focus on how to dimension and design the resources to create a better flow of patients through the resources. Examples of such studies are methods for finding the required number of beds (Ridge et al., 1998), methods for determining the level of available resources, both analytically and by queuing theory (Utley and Worthington, 2012), the effects of different nursing strategies (Bloom et al., 1997), dimensioning of operating rooms to post-anaesthetic care unit resources (Sokal et al., 2006), strategies for flexibility (Jack and Powers, 2004), models for optimal

22
resource investments (Tai and Williams, 2008) and building surgery schedules for levelled bed occupancy (Beliën and Demeulemeester, 2007). These decision-support tools and models are beneficial both when finding good use of resources and when deciding on proper adjustments to find the balance between required and available capacity.
The first area of contribution that this thesis is focusing on is the structure of capacity planning. Theories, like the structure of the MPC system, provide guidance on designing a capacity planning system to produce according to strategically made decisions. Though this type of knowledge exists, healthcare managers struggle with patient queues and lack of knowledge of how to capacity plan to keep the queues in check. To explore the use of hierarchical capacity planning in practice, the initial study of the research is focusing on this specific topic. The first research question stated for this thesis, exploratory in its nature, strives to find the connection between planning activities, or the lack of them, and production performance. In other words, what discrepancies between theory and practice could be generating the inability to achieve production goals? The focus of the research question is not solely on the tactical planning process but also on operational planning and the interchanges between the tactical and operational processes. The first research question is hereby formulated as
RQ1: How do planning process discrepancies affect production performance?
3.3.3ConductingtheplanningprocessA central function of the hierarchical structure of planning processes is the disaggregation of plans and provision of performance feedback according to plans. Within the manufacturing industry, a large amount of research has been performed regarding capacity planning, both on the hierarchical planning system as a whole (e.g. the MPC system of Jonsson and Mattsson, 2009) and on the planning processes per se (e.g. Tavares Thomé et al., 2012). This knowledge has to some extent also been transferred and applied to the healthcare setting. The application of manufacturing theory onto the healthcare setting has been as a complete capacity planning structure, with focus on the structure and not the activities of the individual planning processes. Rhyne and Jupp (1988) apply the manufacturing resource planning system (MRP-II) from the manufacturing industry to the healthcare setting to create a healthcare planning system, based on healthcare specific requirements (HCRPS). HCRPS was created as a planning support system for top and middle management in healthcare and comprises all planning levels in the planning hierarchy. Van Merode et al. (2004) use the enterprise resource planning (ERP) system from the manufacturing industry as a comprehensive model for how to support healthcare delivery organizations in using a hierarchy of planning processes. This structural model does not concern the execution of the planning processes at the hierarchy levels. There is an absence of literature describing the capacity planning process out of a managerial perspective, with ‘managerial perspective’ referring to the actual planning actions of balancing demand and supply. This lack of theoretical guidance in conducting the capacity planning process is specifically visible at the tactical level, while the operational provides many scheduling studies and routing (Ridge et al., 1998; Cardoen et al., 2010). When searching for theory on how to capacity plan at the tactical level for healthcare production systems, the answer is not to be found in the literature. A framework for how to conduct this process would not only fill the gap in theory but also practically support practitioners in their attempt to produce according to the strategic goals. The

23
second research question will address this gap in theory by stating the following research question:
RQ2: What would a tactical capacity planning framework in healthcare comprise?
3.4EstimationofRequiredCapacityIn the task of managing capacity, estimating the required capacity is an essential part of finding equilibrium with the available capacity. This section focuses on the area of required capacity that patient demand represents (Figure 6).
The research in this thesis concerning estimation of required capacity has been divided into two parts. The first part concerns the required capacity, when it comes to the set of activities that together create the treatment process. Required activities are related to the condition of the patient groups. The second part of this section focuses on the estimation of required capacity within a single activity and will focus on the time requirements in surgery and the time allocation of the resources engaged in the activity. The study examines the ability of specialized staff to contribute to the capacity planning process by improving the estimates of activity time using their knowledge and experience.
Figure 6. The left-hand side of the conceptual model denotes the area of required capacity, which is the focus of this section.
3.4.1Requiredactivities:Rough‐cutcapacityplanning(RCCP)For healthcare providers, the task of finding the balance between available capacity and demand requires knowledge of anticipated demand as early as possible. In healthcare, anticipated demand is generally forecast by studying historical data and comparing it to the available capacity in order to identify imbalances between supply and demand. Identifying imbalances in advance provides time for proactive action instead of short-term solutions, which managers are inclined to fall back on when faced with operational problems (Hans et al., 2011).
The tactical planning level typically has a 12-18-month planning horizon and a planning period length of a month. At the tactical level, there exist capacity planning solutions called Rough-Cut Capacity Planning methods (RCCP). These methods are simple to apply by the introduction of simplifying assumptions, but they are still accurate enough for calculating required demand at the tactical planning level, that is, for aggregated production volumes and for low resolution in time. Simplifications can be made, such as regarding the effect of mix of products and by neglecting the lead-time between consecutive stages of production. Whether the method then produces feasible results or not depends on the characteristics and circumstances of the operations. The general procedure of using RCCP at the tactical planning level is to calculate the required capacity of resources for future planning periods by converting the master production plan into resources required for the realization of the plan.

24
RCCP methods come in three basic types that are based on overall factors (RCOF), bill-of-resources (RCBOR) or resource profiles (RCRP) (Vollman et al., 2005). The RCCP that is based on the overall factor (RCOF), is the simplest of the three methods. The RCOF requires also least data. The method can be applied in several versions, where the simplest expresses required capacity in the number of production units to be processed for each planning period (Jonsson and Mattsson, 2009). A possible and often used way of planning surgery is to allocate a certain number of ‘patient slots’ for the future planning periods for certain types of surgeries (Alvekrans et al., 2016). The RCBOR method adds together instances of a certain resource required for the completion of a certain end product, after which this resource requirement is multiplied by the number of end products to complete in the planning period. The RCOF method allocates all capacity requirements to one planning period. Typically, this is the period at which the end product is to be completed. In a healthcare setting, having the intention of assessing downstream resource requirements from incoming referrals, it is possible to either allocate all capacity requirements to the period at which the referral arrives, or to a later period when a “core” or “main” activity is expected to be performed. This calls for a known structure of operations required for the completion of the product, and that the resources utilised in these operations are known. All resources are assumed to be needed within the same planning period, corresponding to a single level in the BOR structure, which means that the calculation of required resources does not consider that the resources may be required in several or different planning periods. RCRP is like RCBOR, but in this case the resource requirement is time-phased, that is, the projected resource consumption is allocated to the planning period when the resources are required, enabling a resource consumption in different planning periods.
In healthcare the RCBOR method and the RCRP method for RCCP has been proposed by Roth and van Dierdonk (1995), where the methods are seen as a way to define the resource requirements related to diagnostic-related patient groups, so-called DRGs.. Patient groups are formed according to process homogeneity, meaning the services delivered within the patient groups use the same constellation of resources (Van Merode et al., 2004). In a similar way, Vissers et al. (2010) and Alvekrans et al. (2016) point at the need of aggregating the demand at a tactical planning level. A common method for categorizing patients is the diagnostic-related groups (DRGs) (Roth and van Dierdonk, 1995; van Merode et al., 2004; Fetter and Freeman, 1986), which are based on the patients’ homogeneity in resource consumption (Fetter and Freeman, 1986, Roth and van Dierdonk, 1995)
The ability to produce forecasts of future demand with high enough accuracy is crucial for all RCCP methods to be effective. For many healthcare providers, the future demand for elective healthcare services is forecast by using historical data (Hans et al., 2011). The use of historical data presents a predisposition depending on the kind of data that is used. If the forecast is based on patient data after admittance into the production system, the historical data will be a product of how well previous plans were made and the set of resources that were available within that planning period. Historical data is also a product of how clinical work was performed at that time. Interpreting required capacity requires that the gathered data is as close to the origin of when the need for specialized treatment was discovered. Within healthcare such data could be represented by the incoming of referrals. Referrals represent the demand for admittance to the specialized healthcare production system. Referrals can be considered as initial customer orders that represent a constellation of the required resources and when the
25
required capacity is needed. In this way, the forecast of referrals may be used as an input of customer orders into the RCCP methods, meaning that anticipated and unconstrained future capacity requirements might be derived by converting the number of referrals (on hand and forecast) into required resources. The calculated required resources can then be balanced with the supply of resources.
As healthcare can be considered a service organisation, the ability to store services to hedge against variations in demand and supply, is not a possibility (Fitzsimmons and Fitzsimmons, 2006; Johnston and Clark, 2001). Therefore, the forecasting of demand is a vital part of capacity planning. Forecasting variations in demand can to some extent be made by the variations in incoming referrals. The incoming of referrals shows seasonal changes and variations in distribution between patient groups, which can be detected on the specification of the referrals. Using the referrals as initiating the required capacity can forecast variations in patient demand and exclude variations due to the production systems set up or previous utilisation production resources.
There are some important conditions regarding the production system and the patient groups to make that the RCCP methods hold. For example, the use of the RCBOR method requires knowing the required activities for a certain patient group to complete the delivery of the required treatment. Knowing in advance the required activities can be defined as knowing the activity constellation for the patient groups. Another consideration when applying a RCCP method that includes a forecast of multiple activities are the consideration of whether the activity constellation varies within the patient groups. If so, what is the magnitude of the variations and is to relatively small that it does not affect the capacity planning of the planning periods. The applicability of the RCCP methods in healthcare is discussed in literature, but merely in general terms. Roth and van Dierdonk (1995) put forward the assumptions and relate them to the healthcare environment but do not test empirically whether the assumptions hold. Therefore, by means of empirical data from two selected patient groups, the third research question sets out to assess if the conditions are such that the RCCP method is applicable for estimation of future required capacity. The third research question is formulated as:
RQ3: On what conditions are the rough-cut capacity methods (RCCP) applicable when estimating future required capacity?
3.4.2Requiredactivitytime:SurgerytimeThis second section of estimating the required capacity focuses on the capacity required for one activity. For many patients in need of specialist treatment, the patient pathway includes activities in the operating theatre.The duration of surgery is not a static, predefined time value. The difficulty of estimating the duration of surgery accurately lies in several different sources of variability. The variability may reside in the resources, such as the anaesthesiologist, the type of anaesthesia, the performed procedure or the risk classification of the surgery. The variation may also be related to the recipient of the service, such as the patient’s age and condition. A study concerning these sources of variability identifies the surgeon as the single most important source of variability (Strum et al., 2000). According to the same study, surgeons work at an individualised rate. Deviation in surgery time between peers is most noticeable in the longer cases, where a difference in required surgery time becomes grater (Strum et al.,

26
2000). A difference measured in single minutes for shorter surgeries may add up to a difference measured in tens of minutes or more for longer cases. Disregarding the variation of the surgeons creates a deceptive idea of the required capacity.
From a planning perspective, errors in surgery estimation times not only affect the flow of patients within the operating theatres. Rotation of surgery staff between surgeries and the supportive activities that prepare and deliver tools and material for each surgery are affected by changes in surgeries due to estimating errors. The workload of the operating theatre, such as the number of patients, also affects the coordination of activities in conjunction with operating theatres (e.g. Beliën and Demeulemeester, 2007; Vissers and Beech, 2008; Vissers et al., 2001). The disturbances due to estimating errors also affects activities performed at other units, such as the post-anaesthesia care unit or pre- and post-surgery activities at the ward units.
The literature on surgery planning suggests different ways for effective operating theatre utilisation. Suitable statistical models are presented for time estimation of a series of surgical cases (Dexter et al., 1998). Studies have focused on the underestimation of surgery time and the resulting costs (Dexter et al., 2007). Researchers have discussed methods using computer-based methodology for estimating the duration of surgery procedures, based on the information in the anaesthesiology billing records (Redelmeier et al., 2008). It has also been discovered how to use data mining of computer systems when estimating surgery duration in order to support decisions for scheduling patients in operating theatres (Combes et al., 2008). Common for such studies is the importance of having accurate estimates of surgery times, since the planning of surgery is only as good as the information on which it is based.
The fact that a large part of the variation in surgery time can be attributed to the surgeon factor (Strum et al., 2000) makes it relevant to look at how these variations can be dealt with when estimating surgery times. How this is made differs among healthcare providers. Some providers use estimating software systems basing the estimated time on the historical record of the performing surgeon for a specific procedure. Other healthcare providers rely on the ability of the surgeons to manually estimate surgery time for future procedures. In combination with the competence and experience of the surgeons, the condition of the patients is decisive for estimating the surgery time. Factors such as multiple diseases and ailments or cases where the patient has a high BMI are likely to complicate the procedure and challenge the skill of the surgeon, thereby affecting the duration of the surgery. In the mathematical estimating software such patient-related factors are not considered.
The results of previous research are divided regarding the importance of using the surgeon’s knowledge of patient condition when estimating future surgery time. A study made by Shukla et al. (1990) argues that estimations made by historical data are expected to be more accurate since they rely on actual outcomes, rather than subjective estimations relying on human memory. Zhou et al. (1999), on the other hand, find that relying only on historical data is insufficient when accurately predicting surgery time. This notion is supported by the results of the study made by Wright et al. (1996) which emphasizes the need for including the subjective knowledge of the surgeon. In the manufacturing industry the significance of including the operator’s knowledge is supported. Research indicates that the reliability of schedules improves when including operator knowledge (Szelke and Kerr, 1994). The second research question of
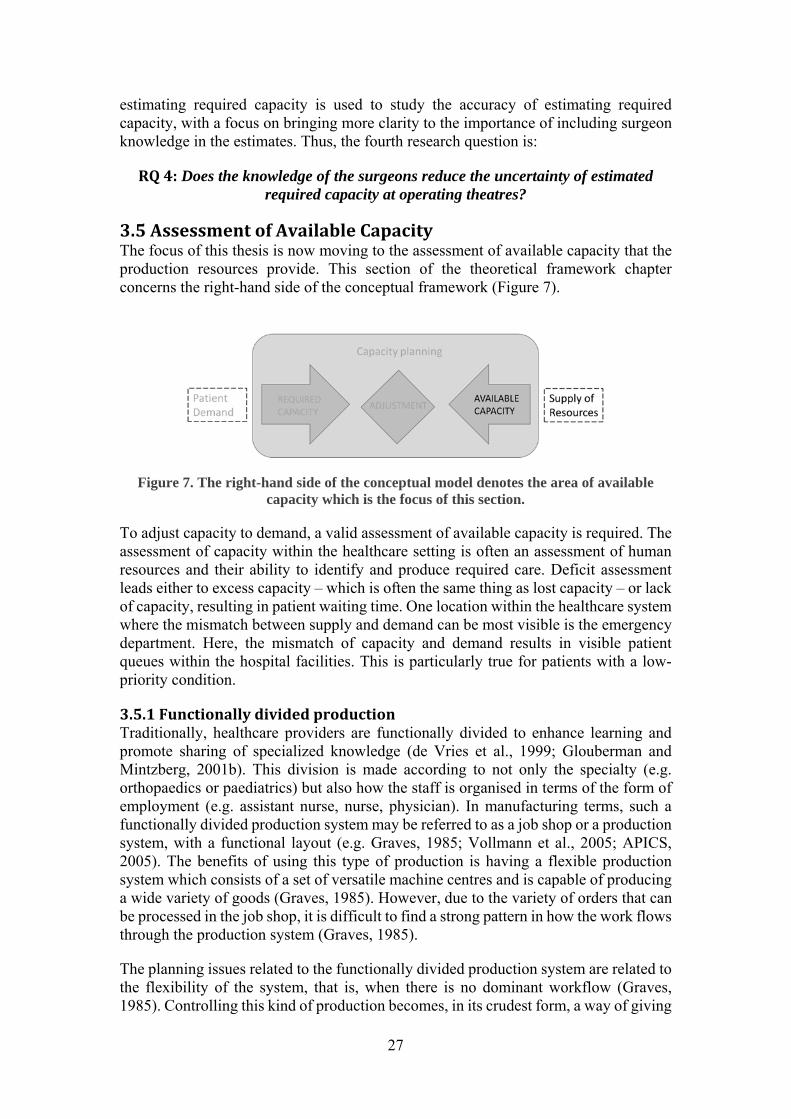
27
estimating required capacity is used to study the accuracy of estimating required capacity, with a focus on bringing more clarity to the importance of including surgeon knowledge in the estimates. Thus, the fourth research question is:
RQ4: Does the knowledge of the surgeons reduce the uncertainty of estimated required capacity at operating theatres?
3.5AssessmentofAvailableCapacityThe focus of this thesis is now moving to the assessment of available capacity that the production resources provide. This section of the theoretical framework chapter concerns the right-hand side of the conceptual framework (Figure 7).
Figure 7. The right-hand side of the conceptual model denotes the area of available capacity which is the focus of this section.
To adjust capacity to demand, a valid assessment of available capacity is required. The assessment of capacity within the healthcare setting is often an assessment of human resources and their ability to identify and produce required care. Deficit assessment leads either to excess capacity – which is often the same thing as lost capacity – or lack of capacity, resulting in patient waiting time. One location within the healthcare system where the mismatch between supply and demand can be most visible is the emergency department. Here, the mismatch of capacity and demand results in visible patient queues within the hospital facilities. This is particularly true for patients with a low-priority condition.
3.5.1FunctionallydividedproductionTraditionally, healthcare providers are functionally divided to enhance learning and promote sharing of specialized knowledge (de Vries et al., 1999; Glouberman and Mintzberg, 2001b). This division is made according to not only the specialty (e.g. orthopaedics or paediatrics) but also how the staff is organised in terms of the form of employment (e.g. assistant nurse, nurse, physician). In manufacturing terms, such a functionally divided production system may be referred to as a job shop or a production system, with a functional layout (e.g. Graves, 1985; Vollmann et al., 2005; APICS, 2005). The benefits of using this type of production is having a flexible production system which consists of a set of versatile machine centres and is capable of producing a wide variety of goods (Graves, 1985). However, due to the variety of orders that can be processed in the job shop, it is difficult to find a strong pattern in how the work flows through the production system (Graves, 1985).
The planning issues related to the functionally divided production system are related to the flexibility of the system, that is, when there is no dominant workflow (Graves, 1985). Controlling this kind of production becomes, in its crudest form, a way of giving

28
priority to orders in the queues to the work centres (Graves, 1985). Managing a job shop becomes a matter of management of a network of queues, which is counterproductive in the healthcare setting, where the aim is to increase availability. Controlling the queues in a job shop is even more difficult when work centres receive input from multiple sources (Wight, 1970). This is the case at the emergency department where the patients directed in-between a variety of staff members within the production system which becomes many caregiving workstations (e.g. nurses and other physicians, laboratory, radiology, physiotherapists).
The capacity assessment is made difficult when nurses and physicians are functionally divided and working as many decision-making entities, interacting with each other in many different constellations. For example, it is difficult to assess how much the capacity increases or decreases with the addition or removal of a nurse or a physician. Managing an emergency department is further complicated by the physicians’ clinical decisions, routing patients through diagnostic and treatment activities. In this respect, the managers are limited in their ability to control the patient flow through the department. The managers’ limited influence on the patient flow is described by Glouberman and Mintzberg (2001a) as problematic healthcare becomes different worlds (care, cure, control and community). However, healthcare managers can limit and direct the medical aspects of the patient pathway to achieve the production goals (Glouberman and Mintzberg, 2001a). The research presented in this section of the thesis, regarding the assessment of available capacity, will focus on managing two types of work methods. Since an emergency department is expected to adjust rapidly to patients with urgent needs, the flexibility in production becomes important if demand varies. The two methods being compared are a team-based work method and the traditional functionally divided system.
3.5.2Team‐basedworkmethodThe literature shows different approaches to adjusting resources to better cope with demand and to reduce waiting time at emergency departments. A well-documented method is the fast-track approach, drawn from manufacturing industry theory (O'Brien et al., 2006), meaning patients with ailments that require small amounts of resources are processed in a separate patient flow in accordance with Skinner’s focused factory approach (1974). Good results are reported when using the fast-track approach in reducing throughput time at emergency departments (Combes et al., 2007; Fernandes and Christenson, 1995). In Patel and Vinson's (2005) study of an emergency department, the team-based work method was implemented. In their study, the team-based work method improved the workflow through the production system and decreased the time-to-doctor while increasing patient satisfaction.
The team-based work method has the same underlying principle as the focused factory of forming units dedicated to a certain range of products or services. The cell in itself consists of resources specifically selected for handling a narrow range of products (diagnoses) processed by the cell (Wemmerlöv and Hyer, 1987; APICS, 2005; Walley, 2003). The teams are similar to a manufacturing cell, where workstations, equipment and machines for processing certain products are grouped together as a cell (e.g. Bhat, 2008; APICS, 2005). In each team, the required staff, machines and material are gathered in a single unit. The units within the cellular manufacturing principle divide the resources of a job shop into smaller production cells (Greene and Sadowski, 1984) (Figure 8). Instead of coordinating the routing of the workflow between the functions
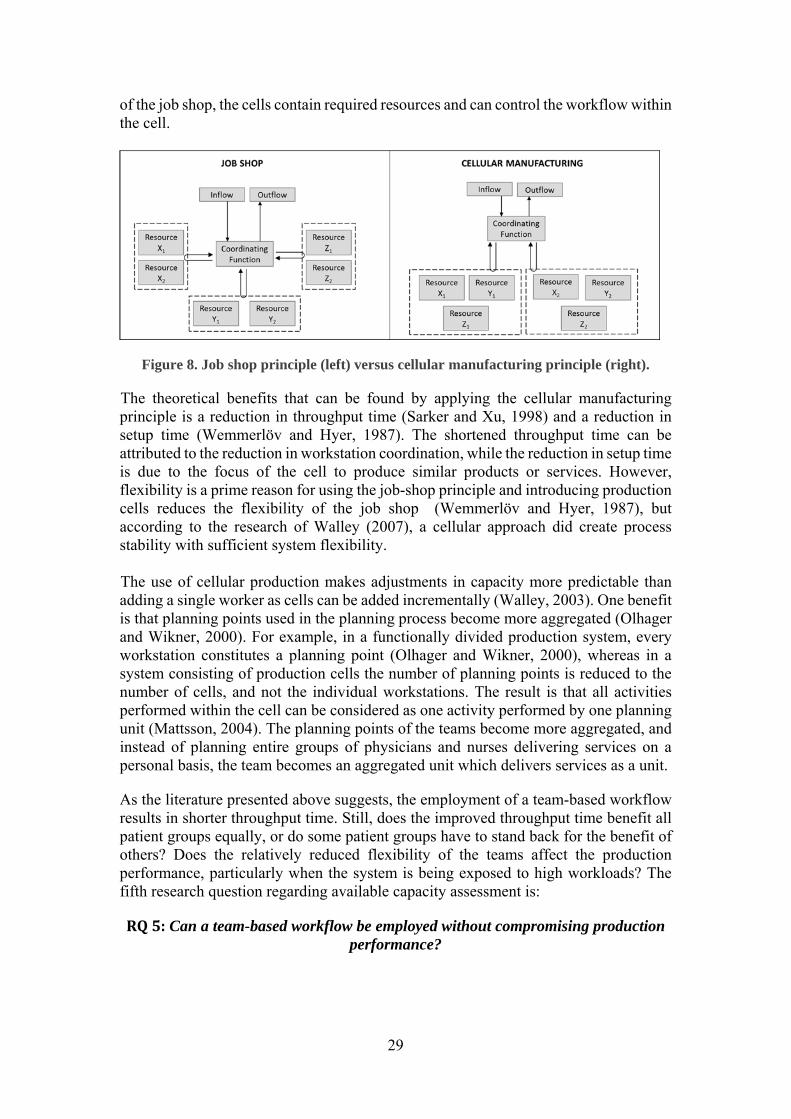
29
of the job shop, the cells contain required resources and can control the workflow within the cell.
Figure 8. Job shop principle (left) versus cellular manufacturing principle (right).
The theoretical benefits that can be found by applying the cellular manufacturing principle is a reduction in throughput time (Sarker and Xu, 1998) and a reduction in setup time (Wemmerlöv and Hyer, 1987). The shortened throughput time can be attributed to the reduction in workstation coordination, while the reduction in setup time is due to the focus of the cell to produce similar products or services. However, flexibility is a prime reason for using the job-shop principle and introducing production cells reduces the flexibility of the job shop (Wemmerlöv and Hyer, 1987), but according to the research of Walley (2007), a cellular approach did create process stability with sufficient system flexibility. The use of cellular production makes adjustments in capacity more predictable than adding a single worker as cells can be added incrementally (Walley, 2003). One benefit is that planning points used in the planning process become more aggregated (Olhager and Wikner, 2000). For example, in a functionally divided production system, every workstation constitutes a planning point (Olhager and Wikner, 2000), whereas in a system consisting of production cells the number of planning points is reduced to the number of cells, and not the individual workstations. The result is that all activities performed within the cell can be considered as one activity performed by one planning unit (Mattsson, 2004). The planning points of the teams become more aggregated, and instead of planning entire groups of physicians and nurses delivering services on a personal basis, the team becomes an aggregated unit which delivers services as a unit.
As the literature presented above suggests, the employment of a team-based workflow results in shorter throughput time. Still, does the improved throughput time benefit all patient groups equally, or do some patient groups have to stand back for the benefit of others? Does the relatively reduced flexibility of the teams affect the production performance, particularly when the system is being exposed to high workloads? The fifth research question regarding available capacity assessment is:
RQ5: Can a team-based workflow be employed without compromising production performance?

30
3.6PositioningofresearchquestionsinConceptualFrameworkDepicted in Figure 9 is the positioning of the five research questions in the conceptual/analytical framework of the thesis.
Figure 9. Positioning of research questions in the conceptual framework of the thesis.

31
4MethodologyThis chapter describes the methodology used in the research process and the methodological choices that were made throughout the progress of the research process. Section 4.1 describes the research process and the order in which the studies were performed. Section 4.2 describes the research design and the methodological choices for the individual studies. The data collection and data analysis are described in greater detail in sections 4.3 and 4.4, respectively. The chapter ends with section 4.5 evaluating the research quality.
4.1ResearchProcessThe research process has had the privilege of being separate from certain funded research projects and has, therefore, not been limited by predetermined project-specific aims and goals. Instead, the research process has evolved over time based on insights that emerged along the way. Several of the practical issues revealed during the first exploratory study, Study 1, led to the research focus adopted for the following studies.
This thesis is the result of research performed over the course of 10 years; see Figure10. This expansion of process has benefits as well as downsides. Benefits that have accompanied this extended research time include that it has provided time for both reflection and contemplation of the performed studies. A downside is the changes in context that have occurred in the studied cases due to organisational development. The interruptions in time did, however, occur during the design and writing phase of the studies and thus did not interfere with the data collection phase where the changes in context could have caused validity problems in the data. Reconnecting to the research design and the data analysis following the interruptions required thinking through the design and analysis twice. Time wise, this can be considered a downside, but it also provided additional time for consideration of the research design and analysis. Since the aim of the studies has been to examine a specific phenomenon in a specific time frame, the changes that occurred following data collection of the phenomenon are irrelevant to the results. If the aim for the studies had been to study the long-term effects of the phenomenon or how interventions were implemented in the studied organisations, then changes due to organisational development would have been important to consider.
The numbering of the individual studies and papers was not done according to the chronology of when they were performed but rather because of the presentation design of the research displayed in the thesis. The reason was to achieve a logical structure of the results and relate them to each other and to the area to which they contribute. The chronology for the studies and writing the papers is, accordingly: Study 1 (2007), Study 5 (2007–2012), Study 4 (2008–2011), Study 2 (2011–2016), Study 3 (2014–2018).
In January 2011, the author of this thesis presented a licentiate thesis that reported research results midway through the PhD process. The purpose of the licentiate thesis was to contribute to the understanding of planning and control in healthcare services impact patient waiting time. The licentiate thesis included Paper I of this thesis together with earlier and unpublished versions of Paper IV and Paper V.

32
Figure10. The chronology of the research process (CP = Conference Paper)
As part of the research process, a ten-week period in the summer of 2014 was spent visiting McGill University in Montreal, Canada. During this time, the structure of the cover paper, Chapter 2 of this thesis, and a conference version of Paper II were written, and the literature search for the theoretical gap in regard to Study 3 was performed. This exposure to different research environments provided insights into their quantitative approaches to healthcare research and interesting responses to this thesis, primarily the use of qualitative research approaches.
4.2ResearchdesignofthestudiesThe research presented in this thesis was designed to allow each research question to be investigated in an individual study, according to the structure depicted in Figure11. The results of the studies are reported in corresponding paper, appended in this thesis. This section is structured according to the stated research questions, and subsections 4.2.1–4.2.5 present the methodology chosen to answer the research questions. Sections 4.3 and 4.4 further supplement the presentation of the research design with more details regarding data collection and data analysis. At the end of this section, subsection 4.2.6, a summarizing table concludes the research design.
Figure 11. Relationships between research questions, studies, and papers. In this chapter, the focus is on the studies.

33
4.2.1ResearchdesignofStudy1–PlanningprocessdiscrepanciesThis section presents the research design of Study 1, answering research question 1.
What was studied? The research question for Study 1 aimed to explore discrepancies between production planning theory and practice and the effect of discrepancies on production performance. The studied department’s planning processes were examined regarding their content (e.g. information input, decisions to make), activities (e.g. meetings, staff responsibilities), and IT support systems (how the system worked and was used). As the research question was quite broadly stated, both tactical and operational planning levels were studied, as well as the execution of plans. How and why strategic political decisions regarding budget and production goals were not included in the studied phenomenon. Instead, these decisions were included as prerequisites to the studied planning processes. This choice was adopted to delimit the research area and focus on the capacity planning realised at the departments.
How was it studied? The study started with an expressed practical problem of growing surgery queues that required attention, as stated in the introduction. This early in the research process, the research area was decided to be within production planning and control of healthcare services. An initial exploratory study was designed to improve the researcher’s understanding of the research area, in both theory and practice, where a comparison between production planning theory and practice was made. The study was performed as an exploratory single case study in which the planning processes of the studied department were mapped. The choice to undertake an exploratory case study was made not only to increase the researcher’s understanding but also due to the uncertainty of what would be found in the planning processes among the practitioners. The choice of using an exploratory single case study provided an opportunity to gain a deeper understanding (Voss et al., 2002) of the planning processes in use and, compared to theory, what planning process discrepancies were present. A deeper understanding can be and was achieved by using a case study approach, in which the phenomenon was studied within its real-world context (Yin, 2009; Ellram, 1996). This in-depth study of the planning processes was used not only according to the stated research question for the study but also as a method to explore the research area of capacity planning for future studies. According to methodological theory, this is suitable for early investigations with unknown variables (Voss et al., 2002).
Where was it studied? The strategy for selecting the case for the exploratory study was a natural choice, due to the need for help with surgery queues expressed by a Swedish university hospital. The planning processes that were studied were at a General Surgery Department with difficulties providing surgical treatment within the stated time limit for surgery waiting time (in Sweden, this is three months after being approved for surgery). This type of opportunity-driven activity (Hill et al., 1999), which originated from the studied organisation, has been beneficial since it has provided highly relevant research and free access to required data. The expressed need provided a unique opportunity to perform a thorough exploratory study, with openness from the case department to share data and fully participate in the study.

34
4.2.2ResearchdesignofStudy2–Capacityplanningprocess This section presents the research design of Study 2, answering research question 2. The study was designed to provide knowledge about how capacity plan at the tactical planning level as a healthcare manager.
What was studied? The phenomenon concerning the composition of a capacity plan became essential to study, as the results of Study 1 showed a clear deficiency in structure and knowledge of how to plan and what to consider. These questions were especially relevant at the tactical capacity planning level. The research question for this study, hence, became: What would a tactical capacity planning framework comprise? The phenomenon studied here is on the tactical capacity planning level and concerns the planning process per se, i.e. un understanding of how to plan at the tactical level, the anticipated output of the planning, and the required input and activities of such a process.
How was it studied? To answer the research question, a descriptive study was designed which included two parts. The first part deductively formed a conceptual framework for tactical planning based on existing theories. The second part of the study validated the framework and found contextual variations in applicability. This was accomplished through a multiple case study, in which each case was the tactical planning process of a department. Three cases were selected from various specialities to represent various forms of healthcare production systems. The variety of the production system was in their resources, which had different amounts of reliance on technological resources and the experience and knowledge of the staff.
Where was it studied? The departments were selected to validate the generated framework due to their differences in speciality (cardiology, urology, psychiatry) and the collection of resources to be managed. Cardiology utilised a large amount of technology, whereas the urology department used a relatively equal mix of human resources and technology. However, the psychiatric department had almost no technological resources to manage, apart from a few treatment options that were not standard procedure; instead, this production system was highly human-based. The reason for selecting cases based on their differences was to not limit the validation of the framework to certain specialities or production systems with certain types of resources.
4.2.3ResearchdesignofStudy3–Rough‐cutcapacityplanning(RCCP)This section presents the research design of Study 3, answering research question 3. The study was designed to provide knowledge in the research area of estimating required capacity.
What was studied? Study 1 highlighted a deficiency in the understanding among planning staff regarding how decisions on capacity use and capacity adjustments made today affected future required capacity. An example of encounter such a situation was when sufficient surgery capacity was not allocated for hernia patients who had been referred to the department three months earlier. Could this information have been used earlier to estimate required capacity when making long-term plans? This practical issue served as the origin for Study 3, which studied the link between the referrals and the chain of activities that follows, known in the literature rough-cut capacity planning methods

35
(RCCP). Within studied literature, RCCP methods were mentioned as a method to predict required capacity in an healthcare setting (e.g. Fetter and Freeman, 1986; Roth and van Dierdonk, 1995; Van Merode et al., 2004).
The research question stated for the third study considered the conditions for applying rough-cut capacity plans (RCCP) methods in the capacity planning process. The use of RCCP methods to estimate future capacity requirements requires that activities related to patients and patient groups be similar and expected to have homogeneity in resource requirements and follow a similar structure of employing the resources in the treatment processes. Therefore, the studied phenomenon investigated two groups of referrals which each referral group was homogeneous in its patients’ referred ailment (i.e. hip prosthesis vs knee prosthesis) and their subsequently performed activities. The referrals were received at hospital specialist department in orthopaedics, during a period of twelve months.
How was it studied? A deductive approach for this study was used to find if the theoretical idea of using RCCP methods was suitable in estimating the required capacity of patient groups. The applicability of RCCP methods in practice was tested by studying incoming referrals for two referral groups and analysing whether the activities performed after referral could be predicted by correlating the income of referrals to required activities for a specific patient group. This way, an incoming referral could be used as a production order for certain activities. For example, the study might indicate that a third of one patient group required surgery, while almost every referral in the second group might lead to surgery. Using two referral groups aimed to give a more differentiated understanding of the connection between the referrals and required activities. The choice of using case studies in this manner to verify and validate conceptual frameworks or theoretical ideas in an empirical setting is supported by methodological theory (e.g. Voss et al., 2002).
Where was it studied? The cases chosen for the statistical analysis was two groups of referrals regarding prosthesis patients. The two cases were referrals for knee prosthesis and hip prosthesis, with a yearly volume of 400 knee surgeries and 620 hip surgeries. The treatment process includes an initial evaluation made by a physician resulting in either a surgery application, or not. In total, the treatment process for patient undergoing surgery, typically includes a minimum of 3 doctor’s visits, which may vary dependent on the condition of the patients. The expected required stay at ward unit is 2-3 days before being discharged. The rationales for selecting these referral groups as cases were the binary character of dividing the referrals in two sections, surgery or no surgery, and the standardised treatment process for patients undergoing surgery. The rationales make the two cases apt for using RCCP methods as a forecasting method for required capacity.
4.2.4ResearchdesignofStudy4–Surgery‐timeestimationThis section presents the research design of Study 4, answering research question 4. The study was designed to be the second study to provide knowledge in the research area of estimating required capacity within an activity.

36
What was studied? The practical issue that became the studied phenomenon for Study 4 was that a department manager discussed the possibility of identifying, in advance, surgical cases that disrupted and altered surgical schedules. This identification could be made by using the surgeons’ ability to identify atypical patients, i.e. patients requiring more surgery time. According to the manager, these patients could often be identified as early as the first examination. When studying the literature, the findings regarding the value of including the surgeon’s subjective knowledge when estimating surgery time were divided. The study aims to deductively bring clarity and provide knowledge to the area of valid estimation of capacity requirements regarding required surgery time.
How was it studied? To answer the stated research question, by verifying the surgeons’ ability to identify atypical patients, a hypothesis test was performed. The hypotheses were deductively stated, and the data used in the hypothesis test were drawn from a single case study. The first part of the test focused on the overall performance of a manual estimation system, based on surgeon estimates. The manual estimation system was then tested and compared with a computational estimation system, based on average surgery time for previous cases, i.e. surgeries with the same procedure and the same performing surgeon (further description in Section 4.3 and Paper IV).
The second part of the hypothesis test was focusing on the estimation of surgery time for patients with the longest surgery time compared to other surgeries with equivalent procedures. The proposition for the hypotheses in the test was that surgeons could identify cases with high risks of complications and would thereby compensate for these in their estimates of surgery time. To determine whether surgeons’ estimations deviated from their normal patterns of estimating surgery time, i.e. by accommodating probable complications, the estimates were again compared to the computational estimation system. The average value estimation, therefore, constituted a ‘normal’ value that would have been relevant if the case had not involved an atypical patient (further description in Section 4.3 and Paper IV). Comparing the estimation errors between the actual surgery time to both the computational average values and the manual surgeon estimates would demonstrate whether surgeons adjusted surgery time based on the patient’s condition. By adjusting the times for the longest surgeries for a specific procedure, the manual estimation system would provide estimates with less estimation errors compared to the computational average system.
Where was it studied? The case was chosen due to an existing planning system based on manual surgeon estimations. The existing system provided a unique opportunity to compare the current surgeon-based estimating system to a system that estimated through calculated time values, based on historical surgery times, specific for each surgeon.
4.2.5ResearchdesignofStudy5–Team‐basedworkmethodThis section presents the research design of Study 5, answering research question 5. The study was designed to provide knowledge in the research area of assessing available capacity.
What was studied? The practical issue behind the last study of the thesis concerned the organisation of resources and the assessment of their capacity. The difficulty of assessing capacity lies

37
in the workmanship of the professions (i.e. individual skilfulness, experience, and decision making) and the routing of patient pathways based on patients’ conditions. The phenomenon that became the focus of this study was whether the use of a team-based work method instead of a functionally divided production system could maintain production performance and through the use of teams facilitate the assessment of capacity. The production performance for the production system was important in this study, as was whether the production performance was maintained regarding less-prioritised patients.
How was it studied? The study was inductively generated by an initiative at an emergency department to change from a functionally divided production system to a team-based work method. The design of the study was to examine the production performance of the changed production system, working in teams, and to compare the performance of the team-based system to that of the functionally divided system. Thus, the measures taken by the functionally divided production system worked as a reference to reveal improvements that occurred in the new system. Production performance measures used in the analysis were the throughput time of patients, the time it took to see the doctor, and the number of patients treated, i.e. discharged. The time periods used in the analysis were the periods of the test with teams and a reference period equal in length to the test period and adjacent in time to the test period. The choice of having the reference time period adjacent to the test period was important to ensure that the old and new work methods were operating under similar circumstances. Since the study compared a ‘before’ and ‘after’ scenario in its real-life setting, the study characteristics became similar to an experimental design, also referred to as quasi-experimental (Bryman and Bell, 2007; Shadish et al., 2002). An alternative approach to investigate plausible benefits of using teams would be to use simulations of the production system. Due to the complexity of the routing of patients through the functionally divided department and the distribution of work among staff, a valid simulation would have been difficult to replicate. (However, a simulation of the system was created as part of a course but not used as a tool in the study.)
Where was it studied? Like the case selections for Studies 1 and 4, the case selection for Study 5 was also based on uniqueness. The case department provided an opportunity to study differences in work methods in a real-life context and with the goodwill and cooperation of the department, resulting in accessibility to collect data through interviews, observations, archival files, and time measures (see Section 4.3 and Paper V for more details about data collection and analysis). The case selection also contributed to the findings of the thesis by including knowledge about the management of emergency care where the previous studies had mainly been concerned with the management of elective care.
4.2.6SummaryofresearchdesignThis section provides a summary table of the characteristics of the performed studies presented in sections 4.2.1–4.2.5 (Table 2). A description regarding the data collection and analysis follows in the next section.

38
Table 2. Summary description of the characteristics of the performed studies
Study 1 – Planning process discrepancies
Study 2 – Capacity planning process
Study 3 –Rough-cut capacity planning
Study 4 – Surgery-time estimation
Study 5 – Team-based work method
Phenomenon Discrepancies in structure of capacity planning processes, related to production performance
The tactical capacity planning process
The link between referral and required capacity
The accuracy of surgery-time estimations
Production performance in two work methods
Research approach
Inductive Deductive Deductive Deductive Inductive
Type of study Exploratory study through single case study
Conceptualising study – Developing a framework through literature study and multiple case study
Verifying study through multiple case study
Verifying study through single case study
Experimental study through single case study
Case selection Unique case (Opportunity driven)
Variety in type of resources
Plausible fit for use of rough-cut capacity plan
Unique case Unique case
Research area in conceptual framework
Healthcare capacity planning structure
Tactical capacity planning process
Estimation of required capacity
Estimation of required capacity
Assessment of available capacity
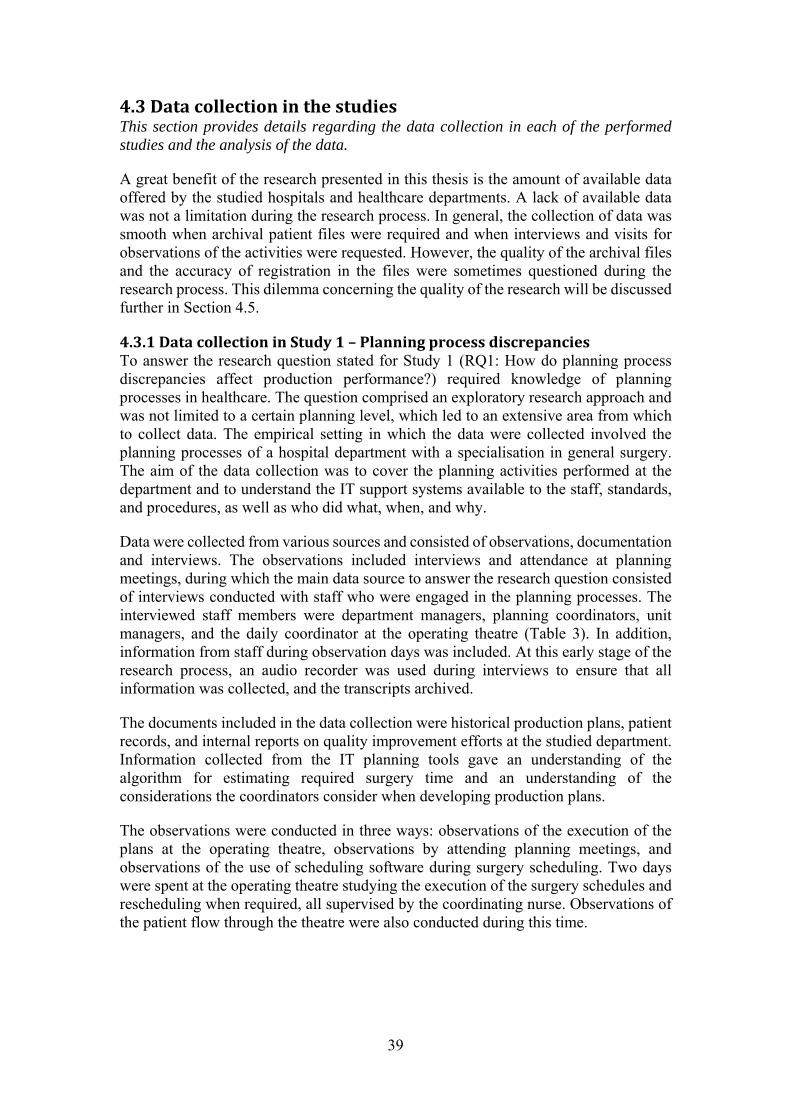
39
4.3DatacollectioninthestudiesThis section provides details regarding the data collection in each of the performed studies and the analysis of the data.
A great benefit of the research presented in this thesis is the amount of available data offered by the studied hospitals and healthcare departments. A lack of available data was not a limitation during the research process. In general, the collection of data was smooth when archival patient files were required and when interviews and visits for observations of the activities were requested. However, the quality of the archival files and the accuracy of registration in the files were sometimes questioned during the research process. This dilemma concerning the quality of the research will be discussed further in Section 4.5.
4.3.1DatacollectioninStudy1–PlanningprocessdiscrepanciesTo answer the research question stated for Study 1 (RQ1: How do planning process discrepancies affect production performance?) required knowledge of planning processes in healthcare. The question comprised an exploratory research approach and was not limited to a certain planning level, which led to an extensive area from which to collect data. The empirical setting in which the data were collected involved the planning processes of a hospital department with a specialisation in general surgery. The aim of the data collection was to cover the planning activities performed at the department and to understand the IT support systems available to the staff, standards, and procedures, as well as who did what, when, and why.
Data were collected from various sources and consisted of observations, documentation and interviews. The observations included interviews and attendance at planning meetings, during which the main data source to answer the research question consisted of interviews conducted with staff who were engaged in the planning processes. The interviewed staff members were department managers, planning coordinators, unit managers, and the daily coordinator at the operating theatre (Table 3). In addition, information from staff during observation days was included. At this early stage of the research process, an audio recorder was used during interviews to ensure that all information was collected, and the transcripts archived.
The documents included in the data collection were historical production plans, patient records, and internal reports on quality improvement efforts at the studied department. Information collected from the IT planning tools gave an understanding of the algorithm for estimating required surgery time and an understanding of the considerations the coordinators consider when developing production plans.
The observations were conducted in three ways: observations of the execution of the plans at the operating theatre, observations by attending planning meetings, and observations of the use of scheduling software during surgery scheduling. Two days were spent at the operating theatre studying the execution of the surgery schedules and rescheduling when required, all supervised by the coordinating nurse. Observations of the patient flow through the theatre were also conducted during this time.

40
Table 3. Description of performed interviews in the study of capacity planning at the General Surgery Department
Respondent title Respondent function Interaction Manager - Central Operating Theatre
In charge of the department and its equipment, facility and staff Provides functioning and staffed surgery rooms (excl. surgeons), Post-anaesthetic care unit included in tasks
Two interviews
Manager – General Surgical Department
In charge of the general surgical department; responsible for the provision of medical expertise in the area of general surgery; responsible for the performance of the surgical department to meet required capacity
Two interviews and additional contact by telephone
Unit Manager – Central Operation Department
In charge of the operation department One interview
Assistant Unit Manager – Central Operation Department
Assists the management of the operation department
One interview
Unit Manager – General Surgery Ward Unit
In charge of ward unit at the general surgery department
One interview
Quality Coordinator In charge of the quality development at the general surgery department
One interview
Surgery Coordinators (Schedulers)
Responsible for scheduling surgeries One meeting with all coordinators and continuous contact and validation during and after the study
Expert of the Surgical Scheduling Software
Responsible for technical solutions in computer-based surgery scheduling software
Participation in meetings regarding scheduling software and an additional telephone interview
Expert of the Implementation of the Surgery Schedule Software
One of the designers of the surgery schedule computer software
One interview and additional contact in specific questions by phone
Operating Theatre Coordinator
Responsible for the daily execution of the schedules at the operating theatre
One interview and one day’s direct observation of the work tasks
Surgery Nurses Staff the operating rooms and manage the rotation of patients in the central operating theatre
Two half-days of direct observations of the work tasks performed by the nurses at the operation theatre
4.3.2DatacollectioninStudy2–CapacityplanningprocessThe normatively stated research question for Study 2 (RQ2: What would a tactical capacity planning framework in healthcare comprise?) led to data collection that was executed in two parts with two purposes. The first part was to create a conceptual framework for tactical capacity planning, containing input into the planning process, activities constituting the process and the output of the process. Data collection in this part consisted of studying capacity planning literature. The framework was structured according to one main reference (Tavares Thomé et al., 2012) to which other theories regarding tactical capacity planning were added. Relevant literature was gathered by

41
searching (journal databases and Google Scholar) for literature concerning capacity planning, sales and operations planning, and production planning. Literature was both specifically for healthcare production and production in general. Additional literature was found through snowballing the reference lists and citations of the gathered literature.
The second part of the study concerned the validation of the framework. In this part, the data collected were from three hospital departments. Collected data were mainly interviews conducted with the department managers, and in one case, one unit-manager working closely with the department manager in the planning process. The interviews were semi-structured, with questions based on the previously generated theoretical framework (see interview description in Table 4). Semi-structured questions were chosen to accommodate unexpected answers and context-related interpretations of the questions, e.g. what is “long-term” or “frequent planning” as regarded by this department.
The interviewed quality developer was contacted in the early stage of the study when the departments to study were selected. When designing the study, the aim was to find planning processes with different conditions. Through the quality developer’s understanding of the characteristics of the planning processes of various departments, the three departments were chosen so that they represented various levels of a technology-based production system versus a staff-based production system. In the cardiology department, most of the diagnostic and treatment activities involved highly technical equipment, while at the psychiatric department, the diagnostic and treatment activities were the result of the specialisation of the staff. Somewhere in between the technology-based production system of the cardiology department and the human-based production system of the psychiatric department was the urology department.
The data collection also included documents to obtain a better understanding of how the planning procedure was currently utilised. These documents consisted of previously made production plans (when applicable), planning templates and internal reports. During the interview with the manager at the urology department, the software planning system was also demonstrated.

42
Table 4. Description of performed interviews in the study of the capacity planning process
Department Respondent title Respondent function Interaction Quality Management
Quality Developer Supports department managers to improve capacity planning process
One interview (proofread)
Cardiology Department Manager
Responsible for the management and results of the department
Two visits with interview (proofread) and additional contact by mail during the study
Urology Department Manager
Responsible for the management and results of the department
Two visits with interviews (proofread) and additional contact by mail during the study
Psychiatrics Department Manager
Responsible for the management and results of the department
Two visits with interviews (proofread) and additional contact by mail during the study
Unit Manager Part of the capacity management at the department,
One interview (proofread)
Central Operation
Department Manager
Responsible for providing staffed surgery rooms to surgery performing departments (e.g. urology)
One interview (proofread)
4.3.3DatacollectioninStudy3–Rough‐cutcapacityplanning(RCCP)To answer the research question stated for Study 3 (RQ3: On what conditions are RCCP methods applicable when estimating future required capacity?), two referral groups were studied. The data collection included compiling data files that covered all activities of the treatment process related to the two types of prosthesis referrals. These data files included the records of activities performed within the referral administration system and records of activities made at the orthopaedic clinic, operating theatre and ward units. The records were compiled into one single file for each referral (patient case) that described all resulting activities and their timing downstream from the treatment process.
The data included all referrals entering the system from 2011-11-01 to 2013-10-31, which resulted in data ranging over two years. However, to include only completed cases in the analysis, referrals arriving after 2012-10-31 were removed, together with all other unclosed cases. That is, the second year of data was only used to find the timing of activities for referrals arriving during the first year. Thus, the incoming referrals that were analysed arrived between 2011-11-01 and 2012-10-31.
Prior to the analysis, the data file was reduced by removing referrals that lacked sufficient data. This was done to improve the reliability of the analysed data. For example, removed referrals included patients beginning their specialist treatment process at another provider and patients with no referral listed in the patient file. To further increase the reliability of the analysis, interviews were conducted to verify the

43
compilation of data files originating from different data systems and to verify our interpretation of the data. The resulting number of referrals included in the analysis was 598 for knee prosthesis and 536 for hip prosthesis.
The data set contained many types of activities, many of which occurred in low frequency or were performed in connection to other, more frequent, activities. From the complete data, the six most frequently occurring activities during the treatment processes were selected to be included for the analysis of the patient pathway. This was the same type of activities for both knee and hip prosthesis. The studied activities were first visit, pre-surgery visit, surgery, follow-up visit, in-patient stay at ward unit, and telephone contact. Other activities occurred with much lower frequency and were not included in the analysis. The occurrence of these remaining activities, in total, added up to less than ten percent of the total activity occurrences.
4.3.4DatacollectioninStudy4–Surgery‐timeestimationThe data used in Study 4 (RQ4: Does the knowledge of the surgeons reduce the uncertainty of the estimated required capacity at operating theatres?) were mainly historical patient records that specified the number of patients, incision times, finish times, estimated operation durations (made by the surgeons), performing surgeons, dates, and operation codes.
Two estimation systems were studied: the manual surgeon-based system and an analytical system based on the average value of historical cases. To better understand both systems, the surgeon-based system was studied by being guided through the planning activities and conducting interviews with surgeons and planning staff. The researcher performed observations during one day’s surgeries. The purpose of the performed observations was to increase the understanding of when the time records in the patient files were logged and by whom. These time records are the historical data files later used for emulating a calculation system.
Table 5. Description of performed interviews in study of surgery-time estimation
Department/ organisation
Respondent title
Respondent function Interaction
Hospital Management
Hospital Quality Manager
Responsible for quality development at the hospital
Interview and continuous contact by mail during the study
Consultant Organisation
Project Leader
Contact person at the consultant organisation, responsible for the surgery scheduling system
Interview by telephone
Orthopaedics Physician Performs surgeries and estimates surgery time
One interview (not proof-read)
General Surgery Physician Performs surgeries and estimates surgery time
One interview (not proof-read)
The interviews, further specified in Table 5, were semi-structured to accommodate unexpected answers and aspects unknown to the researcher. To increase the understanding of the analytical estimating system, based on previously performed surgeries, the developer of a software system at an IT firm was interviewed. The software system was the IT-based alternative to scheduling surgeries in this region of

44
Sweden. The information gathered in this interview consisted of the algorithm to calculate the average value of the surgery time.
Time records were gathered from orthopaedic and general surgery departments. These departments were the two largest specialities at the hospital, comprising the majority of operations performed at the hospital (77%) and, thus, providing many cases for analysis. The cases utilised were surgeries performed between 30 October 2007 and 20 October 2008. The final number of Orthopaedics and General Surgery cases with the required data for analysis was 547.
4.3.5DatacollectioninStudy5–Team‐basedworkmethodThe data collection formulated to answer the research question stated for Study 5 (RQ5: Can a team-based workflow be employed without compromising production performance?) was divided into two phases. The first occurred during the pilot phase of the introduction of a team-based work method. The aim of this phase of the research was mainly to comprehend the design of the method and what, where, and when times were logged into the computer system. This understanding was important for the analysis to validate that the new method of logging the patient’s process at the department was correctly interpreted in the analysis.
To better understand the team-based work method, observations were made of the workflow and included manual time measures of performed activities during two pilot days of the new work method. This first phase of the study also included data collection and mapping of the old functionally divided work method to improve understanding of work procedures and patient flow prior to the change in work methods. These observations were completed for one week and consisted of following staff through their everyday tasks in triage, surveying how the patients were directed between activities, noting how and when data were recorded into patients’ files, and monitoring the transfer of patient-specific information between the functionally divided staff. Formal interviews were also conducted to better understand the manager’s perspective of overseeing the production system and the doctors’ perspective of the work methods, as well as to discuss matters with the nurses and assistant nurses. Table 6 specifies information regarding the formal interviews.
The interviews and observations provided an understanding of the current state of the planning conditions of the studied emergency department. Archival patient files were collected to be part of the analysis to make a current analysis of the patient flow at the department and to provide a perception of the demands placed on the department. Documents regarding the staffing of physicians, nurses, and assistant nurses were collected to represent the amount of available capacity at the department.
The second phase consisted mainly of gathering data from the patient files during the test period from 5 November to 21 December 2007. The patient files included data records of the patient flow in the team-based work method and the functionally divided system. Informal interviews with staff and patients were conducted during this time. These interviews mainly concerned how the work method was functioning according to the experience of the staff.

45
Table 6. Description of interviews conducted in the study of a team-based work method at the emergency department
Respondent title Respondent function Interaction Emergency Department Manager
In charge of the emergency department
Formal interviews at two occasions, several follow-up discussions throughout study
Unit Manager Responsible for the emergency department and its staff
One formal interview, several follow-up discussions throughout study
Doctors Responsible for the medical treatment of patients
Three interviews with three doctors, several follow-up discussions throughout study
Nurses Responsible for providing care according to profession
Two formal interviews, several follow-up discussions throughout study
Assistant Nurses Responsible for providing care according to profession
One formal interview, several follow-up discussions throughout study
4.4DataanalysisofthestudiesThe five study analyses performed in this thesis utilised both qualitative and quantitative methods. The methods used in the two first studies compared theory and practice. The purpose of the comparison in Study 1 was to explore the differences between theory and practice regarding production planning and control of the production system. In Study 2, the purpose of the comparison was to validate the conceptual framework that had been generated in the first part of the study.
The three remaining studies used quantitative analyses. In Study 3, the statistical method was used to verify whether RCCP methods were applicable in practice and under what conditions the methods were suitable. The use of statistical methods in Study 4 was made in a hypothesis test, where two theoretical ideas were tested. In Study 5, concerning the use of a team-based work method, a statistical analysis method was used to evaluate differences in efficiency between the work methods. Table 7 summarises the description of the included studies data analyses.
Table 7. Description of the data analysis of the included studies
Purpose of Analysis Analysis Method Study 1 Planning process discrepancies
Explore phenomenon Qualitative Analysis
Case study of actual planning activities and their relation to MRP-II theory
Study 2 Capacity planning process
Validation of conceptual framework
Empirical testing of theory
Study 3 Rough-cut capacity planning (RCCP)
Verifying theory Quantitative Analysis
Statistical methods – ANOVA
Study 4 Surgery-time estimation
Hypothesis test Statistical methods - T-test
Study 5 Team-based work method
Statistical test Statistical methods – T-test
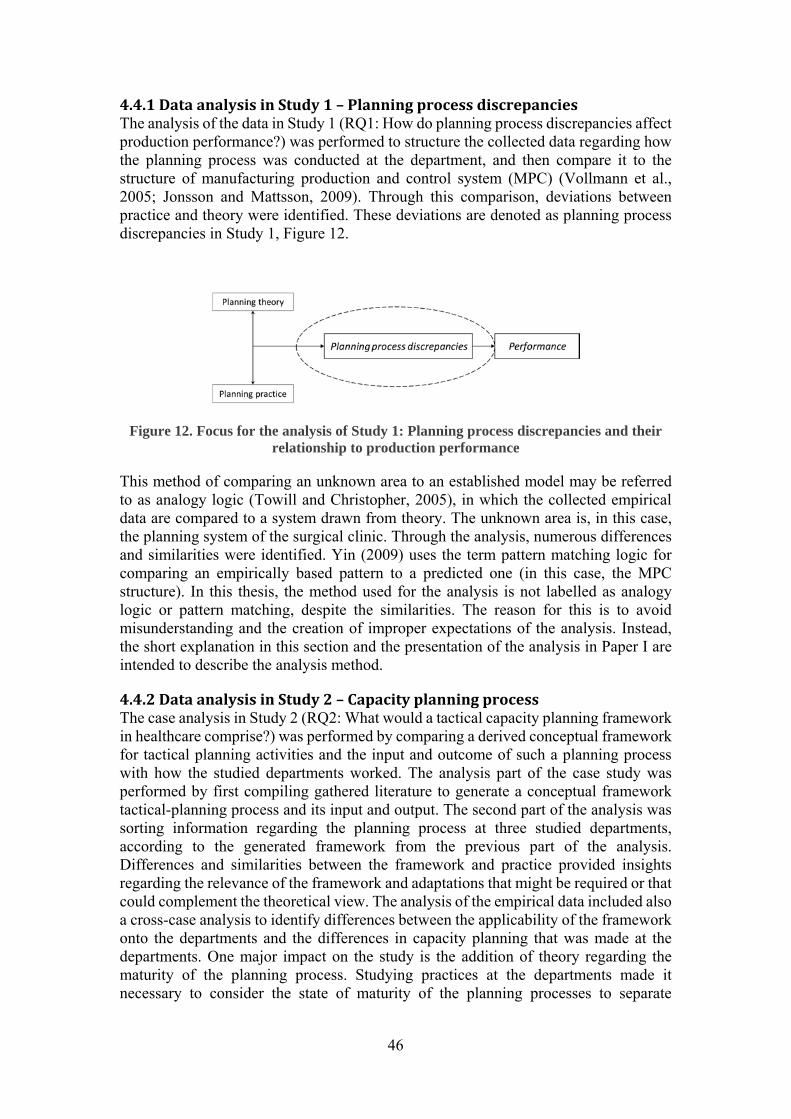
46
4.4.1DataanalysisinStudy1–PlanningprocessdiscrepanciesThe analysis of the data in Study 1 (RQ1: How do planning process discrepancies affect production performance?) was performed to structure the collected data regarding how the planning process was conducted at the department, and then compare it to the structure of manufacturing production and control system (MPC) (Vollmann et al., 2005; Jonsson and Mattsson, 2009). Through this comparison, deviations between practice and theory were identified. These deviations are denoted as planning process discrepancies in Study 1, Figure 12.
Figure 12. Focus for the analysis of Study 1: Planning process discrepancies and their relationship to production performance
This method of comparing an unknown area to an established model may be referred to as analogy logic (Towill and Christopher, 2005), in which the collected empirical data are compared to a system drawn from theory. The unknown area is, in this case, the planning system of the surgical clinic. Through the analysis, numerous differences and similarities were identified. Yin (2009) uses the term pattern matching logic for comparing an empirically based pattern to a predicted one (in this case, the MPC structure). In this thesis, the method used for the analysis is not labelled as analogy logic or pattern matching, despite the similarities. The reason for this is to avoid misunderstanding and the creation of improper expectations of the analysis. Instead, the short explanation in this section and the presentation of the analysis in Paper I are intended to describe the analysis method.
4.4.2DataanalysisinStudy2–CapacityplanningprocessThe case analysis in Study 2 (RQ2: What would a tactical capacity planning framework in healthcare comprise?) was performed by comparing a derived conceptual framework for tactical planning activities and the input and outcome of such a planning process with how the studied departments worked. The analysis part of the case study was performed by first compiling gathered literature to generate a conceptual framework tactical-planning process and its input and output. The second part of the analysis was sorting information regarding the planning process at three studied departments, according to the generated framework from the previous part of the analysis. Differences and similarities between the framework and practice provided insights regarding the relevance of the framework and adaptations that might be required or that could complement the theoretical view. The analysis of the empirical data included also a cross-case analysis to identify differences between the applicability of the framework onto the departments and the differences in capacity planning that was made at the departments. One major impact on the study is the addition of theory regarding the maturity of the planning process. Studying practices at the departments made it necessary to consider the state of maturity of the planning processes to separate
47
conscious adjustments from immature decisions. Hence, an addition in maturity theory was included in the planning-process framework (Lapide, 2004).
4.4.3DataanalysisinStudy3–Rough‐cutcapacityplanning(RCCP)The data analysis conducted in Study 3 (RQ3: On what conditions is RCCP methods applicable when estimating future required capacity?) was executed using statistical analysis methods.
The text below presents four assumptions important for the effective use and applicability of the RCCP methods in the healthcare context. The text below includes also a description of how the data were analysed to test whether the assumptions hold for the two patient groups in the case study.
Condition 1 - Activities generated by a set of referrals show stability in terms of their resulting activities: The analysis was made by using linear regression to find the relationship and explanatory power (R2) between the incoming number of referrals and the frequency of occurrence of the six activity types downstream from the treatment process. The independent variable was the weekly number of referrals for knee and hip prosthesis, respectively, which resulted in 52 observations for each of the patient groups.
Condition 2 - All critical activities from a planning perspective are performed within the same planning period: The typical length of the planning period at the master planning level (12-–18 months planning horizon) is one month. This means that the analysis simply had to identify the total lead time from admittance to the last activity related to the referral and compare this with the planning period length. However, it can be argued that the later activities of the treatment process, for example, the follow-up visit, are less critical in terms of timing. For this reason and for the test to be in favour of the assumption, it was chosen to measure the time between the first visit activity and the surgery activity. By doing so, it can be argued that the true conditions are always worse than in the test. The patients included in this analysis were the patients for whom surgery was performed. The result is presented as descriptive statistics, showing the average and median values of the lead time, together with a histogram providing a visual overview.
Condition 3 - Lead time from admittance to the planning period for which capacity requirements are allocated is stable or predictable: This condition can be tested with the same data as for Condition 2, but by presenting instead the standard deviation in lead time between the two activities (first visit – surgery). Additionally, a histogram is presented to visualize the result.
Condition 4 - Known structure of activities for a patient group: There are two aspects of structure: which activities and which sequence of activities. The first aspect is covered by the test of Condition 1. For testing the stability of the sequence, a qualitative judgement was applied, comparing the actual variation in sequence between activities with the sequence stated in the standardized treatment plan. In the latter, all patients follow the same sequence of activities from referral to discharge.
4.4.4DataanalysisinStudy4–Studyofsurgery‐timeestimationThe focus of the data analysis in Study 4 (RQ4: Does the knowledge of the surgeons reduce the uncertainty of the estimated required capacity at operating theatres?) was

48
focusing on the deviation,Dµ, between the studied estimation system and the actual outcome of surgery duration. The analysis was designed as a hypothesis test, divided into two tests. The first test was to examine the relative overall accuracy of the two estimation systems. The null hypothesis and the hypothesis for the first test of the analysis were formulated as:
H0: The surgeon-estimated time (SET) and the calculated average value (CAV) have an equal absolute deviation, Dµ, from the actual surgery time.
|Dμ | |Dμ | 0
H1: The surgeon-estimated time (SET) gives less absolute deviation, Dμ , from the actual surgery time than the calculated average value (CAV)
|Dμ | |Dμ | 0
The second test of the analysis focused on the estimation error for long cases, in which the underlying assumption was that the longer the surgery, the higher the chance that additional factors affected the surgery-time outcome. The null hypothesis and the hypothesis for the second test of the analysis were formulated as:
H0: The surgeon-estimated time (SET) and the calculated average value (CAV) both give equal absolute deviation, μ, from the actual surgery time for long cases
|D μ | |D μ | 0
H1: The surgeon-estimated time (SET) gives a lower absolute deviation, μ, from the actual surgery time for long cases than the calculated average value (CAV)
|D μ | |D μ | 0
Both tests were analysed in SPSS software using a paired two-tailed T-test with an alpha of 0.05. The second test was performed for three groups of patients: all patients, surgeries with longer times than the median value, i.e. belonging to the 50th percentile, and surgeries belonging to the 75th percentile. Dividing the analysis into these groups was done to investigate whether the surgeons’ estimation errors decreased compared to the average value error for the longest surgery durations. For further insights into the statistical analysis, see appended Paper IV.
4.4.5DataanalysisinStudy5–Team‐basedworkmethodThe first analysis stated in Study 5 (RQ5: Can a team-based workflow be employed without compromising production performance?) was established before the new work method was introduced. This was implemented to attain a perception of the demand placed on the production system and to position it in relation to the available capacity of the department. The demand, i.e. the required capacity, was analysed by studying archival patient files and the variation of patient inflow over time, i.e. months, weeks, and hours.

49
The efficiency analysis of the two work methods focused on time measures, throughput time and time-to-doctor. Measuring the throughput time and time-to-doctor was selected to have a measure for the delivery time of the required treatment for both work methods and was used to compare delivery efficiency. Time-to-doctor was chosen as a measure to compare the efficiency of the work methods to deliver physician expertise in the treatment process. This measure was important because of the physician’s role of diagnosing patients and deciding on the necessary activities for further treatment. The efficiency measured in number of patients was also included in the analysis.
The results from the test period of the team-based work method, in terms of throughput time and time-to-doctor, were quantitatively compared to the efficiency of the functionally divided work method prior to the test period (17 September–4 November). When choosing a comparable period, the test period adjacent to the experimental period was considered as the most suitable since the organisational, weather-, and society-related factors were similar. It is difficult to distinguish conditional differences compared to a previous period that dates back considerably, which was also one of the reasons why the aforementioned period was chosen. An additional test was employed to investigate whether the test period results would be influenced by seasonal changes. Therefore, an ANOVA test was conducted regarding the number of patients arriving per month for 2.5 years, using Scheffé’s method with an alpha of 0.05 as the post hoc test. The test showed no significant seasonal trends.
The quantitative analysis of the data was performed by comparing the arithmetic mean value and the median value of both the throughput time and the time-to-doctor. The quantitative analysis of the mean throughput time and mean time-to-doctor was determined using T-tests, assuming unequal variances, and deciding significance based on two-tailed probability. The emergency department’s main problem was that many low-priority patients needed to wait a very long time before being treated and discharged. A focused analysis was made on ‘green’ patients, the second-least prioritised patient group, to detect efficiency improvements for patients who waited for the longest time at the emergency department. For this analysis, the 90th percentile was used as a limit in throughput time and time-to-doctor to detect changes for ‘green’ patients.
The last analysis made was to eliminate possible slack in the system that could affect the time measures of efficiency. Therefore, the analysis studied patients arriving between 11:00 and 16:00, regarding all patients in general and the group of ‘green’ patients. As this time of day was demonstrated to have the highest number of patients entering the system, possible slack time was eliminated, and an even workload of the systems was established.
4.5ResearchqualityThis section of the methodology chapter discusses the research quality of the thesis. Since all the studies executed during the research process utilised a case study approach, the categories chosen to evaluate quality were taken from qualitative methodology theories (Halldórsson and Aastrup, 2003; Bryman and Bell, 2007). More specifically, this section discusses the credibility, transferability, dependability, and confirmability of the research.

50
4.5.1CredibilityThe credibility of the research concerns the degree to which the data are properly collected and represent the phenomenon being studied (Halldórsson and Aastrup, 2003; Bryman and Bell, 2007). The two main sources of data collection during the studies were interviews and patient data files. To ensure the credibility of the research, respondent validation and triangulation were used, triangulating information sources and triangulating by engaging other researchers to reduce the risk of bias.
The interviews conducted during the studies underwent respondent validation (Ellram, 1996), during which the interviews were transcribed and sent to the respondents (or they were revisited) to correct any misunderstandings. The feedback of the transcribed interviews has led to the correction of misunderstandings and additional information given by the respondent and has provided a fuller understanding of the topic that the interviews aimed to address. Respondent validation was not fully in use during the first study, Study 1; however, the interviews were recorded, transcribed, and archived.
The second method of ensuring credibility comprised the triangulation of sources and researchers. The triangulation of sources has been a frequently used tool in this research. One area where triangulation has been valuable is regarding the quality of the data analyses. The availability of data has not been an issue limiting the research, while the interpretation of quantitative data has required an understanding of what is logged into patient files and under what labels. For example, in the RCCP method study, the labels of patients being treated at a ward unit were different whether registered by the ward unit itself or by staff working at the out-patient clinic. This type of misunderstanding required an understanding of what and by whom the time measures in the patient files were made. Triangulation has also provided a second opinion on a situation. For example, during the study at the emergency department, the staff’s subjective opinion of a largely varying rate of patient arrivals could be contrasted with historical data on arriving patients, which revealed a pattern of patient arrival. The large fluctuations in patient volume occurred instead after the patients entered the production system at the department. The cause of the volume fluctuations was not due to the arrival of patients but to something else within the production system. The triangulation can hereby confirm, discard, or alter the information gathered in subjective interviews.
Observations have contributed to the triangulation of sources and the interpretation of patient files by collecting data regarding how and when the data were recorded in the data systems. This also created an understanding of required information sharing between activities, units and departments along the patient pathways. Another area where the observations contributed by triangulation was in regard to the interviews. A respondent familiar with the environment may not question the manner in which tasks are performed or perceive it as unimportant to mention during an interview. Through the observations, certain situations were noticed or questioned as a result of the observer role that researcher(s) had. Data sources used in the triangulation also included organisational documents, i.e. templates or stated organisational principles, in addition to the body of production planning theory and published studies within the research area.
The triangulation of researchers includes engaging other researchers in the studies or having the work reviewed by other researchers. This strategy for increasing the number of viewpoints in the study improves its credibility and decreases the risk of bias (Patton, 1999). The triangulation of researchers was applied whenever multiple researchers

51
were available, i.e. throughout Study 5 at the emergency department and in Studies 1 (planning process discrepancies) and 3 (RCCP methods). The involvement of multiple researchers provided multiple interpretations of the observations and answers given by the respondents. In Study 2 (capacity planning process), two researchers performed the case analysis, while the data collection was performed by one researcher. In the data collection, triangulation of sources and respondent validation was used to reduce bias. Multiple researchers could then be used in the analysis part, and a summary of the study was reviewed and presented at a research conference. Study 4 was decided to be conducted by a single researcher. Study 4 was submitted to a journal in the theoretical field of production planning and control.
4.5.2TransferabilityThe transferability of the research refers to the degree to which the findings can be transferred to other settings (Bryman and Bell, 2007). To improve the possibility of transferring the results and insights of the research, a goal was to strive for transparency in methods and case setting. The anticipation is that, through this transparency, a transfer of the results to another setting can be assessed by the reader. In the first study, Study 1, an exploratory study, compares the practice of capacity planning with the theory. This way of comparing theory and practice to identify discrepancies can be used by other providers to identify unique discrepancies. Lessons can also be learned from the discrepancies found in the study and how these discrepancies contributed to problems achieving production goals. Since the framework for capacity planning provided in Study 2 was generated from theory and not fixed for a certain department setting or specialty, it leaves room for case-specific alterations. This was also shown by the application of the framework to three case departments in the validation phase of Study 2.
Study 3 provides insights into the conditions for when rough-cut capacity plans (RCCP) may be used. These conditions can be used as a model for requirements to implement RCCP methods in a capacity planning system. The results of Study 4 provide more differentiation in the discussion of the value of including subjective evaluations in surgery-time estimates. As discussed in the study (see Paper IV), the potential contribution that surgeons’ knowledge may provide is related to the design of the estimation system, both the size of the time modules used for estimates and the feedback system of estimation errors. Time modules that are too large may conceal the adjustments surgeons employ in the estimates, and an incorrect feedback system might ‘reward’ overestimations with unplanned breaks instead of exhibiting efficiency. This insight can be used by others when designing an estimation system. In Study 5, the use of a team-based work method shows an alternative to the functionally divided staff that is often utilised in healthcare organisations. The benefits of applying a team-based work method in this study may provide valuable insights of the effect that the work methods have on production performance and, as an extension of knowledge, to the assessment of available capacity. However, the implementation of a similar method at another organisation may require case-specific adjustments.
4.5.3DependabilityThe dependability of the research concerns the stability of data, meaning that the same results would emerge if the study were conducted a second time. Ensuring dependability requires that the studied phenomenon is frozen in time and thus prevents the alteration of data to be collected. This ‘conservation’ of a study can be ensured by

52
conserving all the collected data and the choices employed during the research process (Halldórsson and Aastrup, 2003). Specifically, for this research process, dependability was ensured using research diaries, saved transcribed interviews with comments from respondent validation, saved documents provided by the studied organisation, and saved patient files with performed analyses and adherent logbook comments included in the files.
4.5.4ConfirmabilityConfirmability concerns research bias, meaning that the researcher altered the findings according to personal values (Halldórsson and Aastrup, 2003; Bryman and Bell, 2007). The bias aspect has already been touched upon when discussing the triangulation of researchers, during which multiple researchers in the writing process and during data collection and analysis phases contribute by differentiation, e.g. viewpoints during observations or perceptions of interview answers, and counteract the risk of bias. Other measures taken to counteract research bias consist of presenting the way the research questions are generated, methodological choices, and research results at various forums. These research forums were conferences, reviewing processes for journals and conferences, international and domestic PhD seminars and courses, internal seminars at the university department and the guidance of my supervisors. Table 8 below summarises the dimensions of research quality specified per study.

53
Table 8. Summary of the dimensions of research quality of the studies
Study Credibility Transferability Dependability Conformability 1 Planning process discrepancies
Triangulation in sources and analysts respondent validation for some interviews
Highlighting the need for long-term planning and the effects on delivery ability when lacking
Documentation of data collection and analysis and preserved data files Research diary
Conference publication and presentation Two researchers
2 Tactical capacity planning process
Triangulation in sources and analysts Respondent validation
A framework suitable for various medical specialties
Documentation of data collection and analysis and preserved data files Research diary
Conference publication and presentation Journal publication with reviewing process Two researchers
3 RCCP methods
Triangulation in sources and analysts Respondent validation
Conditions for using RCCP methods
Documentation of data collection and analysis and preserved data files Research diary
Three researchers (Journal submission with reviewing process)
4 Surgery-time estimation
Triangulation in sources Respondent validation
Differentiation of the value of including subjective estimations
Documentation of data collection and analysis and preserved data files Research diary
Journal publication with reviewing process
5 Team-based work method
Triangulation in sources and analysts Respondent validation
Valuable insights for healthcare providers with functionally divided staff, regarding both patient flow and capacity assessment
Documentation of data collection and analysis and preserved data files Research diary
Conference publication and presentation Four researchers Journal publication with reviewing process

54

55
5Results This chapter presents the results of the research presented in the appended papers of this thesis. Each section of the chapter summarises the relevant results from the five studies and how the findings answer the related research question.
For each of the five research questions, one study was conducted to answer the question. This chapter addresses each of the research questions in order and the results of the studies.
5.1Researchquestion1The first research question involved the area of the structure of capacity planning processes and asked: How do planning process discrepancies affect production performance?
The mapping of planning practice onto the planning theory in Paper I identified differences between theory and practice in the studied planning processes. These differences are labelled as planning process discrepancies. The identified planning process discrepancies of Paper I are listed in Figure 13, as well as the performance measures against which the production system was evaluated. The effect that the planning process discrepancies contributed to regarding production performance concerned the ability to stay within budget, staying below maximum patient waiting time, and producing in accordance with stated production volumes, for example, the number of surgeries or patient admissions.
Figure 13. Findings of Paper I: The identified planning process discrepancies and studied performance measures.
5.1.1Structuredprocedures One planning process discrepancy identified in Study 1 was the lack of structured, defined procedures for planning. Regardless of what planning process was studied or the planning level at which it was implemented, there were no standardized structured procedures. As a result, the manager and planning staff performed to the best of their personal abilities. Whether this lack of structured procedures was due to deficient

56
management, ignorance, or an indistinct scope of responsibility among managers was not revealed in the study. The lack of structure for the planning procedures resulted in strong reliance on the skills and experience of the staff, with the effect that the feasibility of the plans was dependent on which individual scheduler was doing the planning.
5.1.2HierarchyofplanninglevelsThe findings in Study 1 revealed planning process discrepancies regarding the linkage between planning processes – that is, the downward disaggregation of plans in a hierarchical planning structure – and the upward feedback on performance in such a structure. According to theory (Jonsson and Mattsson, 2009; Jacobs et al., 2011), the structure of the hierarchical planning system transforms business plans into daily activities through a system of disaggregated planning processes. The planning processes ranges from extended planning horizon for groups of resources and products to detailed plans for individual products/services and resources with a shorter planning horizon.
Decisions made at the strategic planning level were taken by hospital management and county councils (Landsting). In practice, the disaggregation of the strategic plan into the daily production concerned the interpretation of the allocated budget and the production goals set for production. The production goals were formulated as number of surgeries, number of admissions, and amount of specialist care, formulated as diagnostic-related group (DRG) points. The budget defined the financial limits within which these production goals were expected to be delivered. The way the budget was allocated towards production activities, namely, to enable delivery of care according to set production goals, was entirely up to the department managers.
Tactical planning, that is, master planning, was disregarded so that the planning contained few activities related to managing capacity according to demand. No master production plan was produced to guide the planning at the operational planning level. The disregarded master planning led to the strategic production goals not being transformed into a feasible production master plan. Lacking this transformation of strategic goals resulted in the managers being uninformed of the different types of treatment and quantity of services they were required to produce on a daily and weekly basis. The theoretical purpose of master planning and the existent content of the case master planning is further elaborated in Section 5.1.3.
The upwards connection between planning levels in the hierarchy is formulated by providing feedback on performance (Butler et al., 1996; Butler et al., 1992). Discrepancies were found in the feedback system of the planning hierarchy. The lack of connection amongst the planning levels, such as disaggregation of plans and feedback on performance, deprived the managers of the ability to check the production performance in accordance with long-term plans. Establishing a long-term perspective of proper master planning would diminish the short-term reactive adjustments of capacity, which often includes extra expenditures to hire extra staff or to fund overtime work. With no feedback on an overall plan, the purpose of which is to provide a feasible production plan to achieve goals, the only feedback on performance that was available to the managers was the length of patient queues, the number of treated patients, and the consumption of financial means.
57
5.1.3MasterplanningandthemasterproductionplanThe aim of master planning is to reach a consensus regarding goals and generate feasible plans to achieve stated goals (Feng et al., 2008; Proud, 1994). In the studied planning processes, strategic decisions regarding production goals were already taken as part of political and hospital management processes. In the study, the stated goals were considered as input to the master planning process provided by the strategic planning level. At this planning level consensus had to be reached between producing units. In Study 1, this consisted of agreements between the management of the operating theatre and the management of the general surgery department, which employed the shared resources of the operating theatre department. The present use of the master planning process was to ensure capacity at the operating theatre and the scheduling of staff over a three-month period. In this way, the master planning process provided no feasible plan to achieve stated production goals (i.e. maintain budget and provide timely and sufficient care). The output of the deficient master planning process was rather a schedule covering available staff and allocated capacity at the operating theatre.
Balance The master planning process is the procedure through which balance is established between available capacity and required capacity (Proud, 1994; Jacobs et al., 2011). The studied master planning process did not focus so much on interpreting the required capacity as it did on the available capacity. In practise, this meant that the planning that was realised focused mostly on the amount of capacity that was available and very little on how the available capacity could be allocated among patient groups to mirror the characteristics of the required capacity. As an example of not allocating capacity according to demand, some patient groups had long waiting times, while other patient groups had hardly any waiting time at all. This imbalance of not focusing on both available and required capacity resulted in the mistaken belief that resources were being effectively used, even though patient queues were increasing. Therefore, managers had a perception of a capacity shortage, while the problem could have arisen from not estimating the required capacity and allocating available capacity accordingly.
Long-term perspective The long-term perspective of master planning is used to adjust available capacity in time according to the requirements of the demand. The long-term perspective was not applied in the studied planning processes and neither was the match between required and available capacity. Instead, the focus of the planning activities performed was on the scheduling of staff, with isolated planning for each staff category. The deficient long-term planning led to lost capacity, such as situations when allocated facility capacity did not match staff scheduling (e.g. no available surgeons or anaesthesiologists), or when nurse scheduling was not coordinated with physician scheduling leading to an excess of nurses. For example, capacity loss was caused by important medical seminars with insufficient available surgical capacity, resulting in increased patient queues and reduced production volumes. This sort of strong reduction in capacity was not the main problem of the master planning process; instead the problem stemmed from the lack of foresight in such situations and the failure to adjust production plans to compensate for a period of low-producing capacity.
The starting point throughout the current master planning process consisted of the use of available resources with limited focus on how well it balanced the demand. Therefore, there was no warning regarding any imbalances between the available and

58
the required capacity prior to manifestation and required re-planning when having capacity losses was deficient. This resulted in reactive short-term adjustments, leading to demand for extra capacity and, thereby, additional costs.
5.1.4ForecastingandPrioritisingAs an input to the master planning process, preparatory work to forecast future demand is required. In such preparation the forecasting recognises all demand and, which can be prioritised if required (APICS, 2005). Prioritising amongst patient groups might be required when capacity is insufficient to meet all demand. Forecasting may also be used to identify excessive capacity, which may be used for other purposes when this information is brought to the master planning process. Neither structured forecasting nor were prioritising activities present in the studied planning processes. The existing forecasting consisted of previously performed surgeries as a way of forecasting required capacity. Even though relevant information for quantitative forecasting was available in the information systems – such as the number of received referrals – this was not used as part of the forecasts. The historical production provided the managers with information of what they produced the previous year but left them unaware of the expected volumes of patients and their characteristics in future demand.
The lack of forecasting also deprived the managers of the opportunity to adjust accordingly. Without a proper perception of anticipated demand – and thus the required capacity – the need to prioritise amongst patient groups was not systematically considered. One of the problems at the studied department was long waiting times that certain patient groups suffered from, while others experienced hardly any waiting time. This situation may have been a result of no active prioritising of patient groups. Proper prioritisation amongst patient groups might have levelled out patient waiting times by allocating capacity to patient groups with long waiting times. In combination with a deficient master planning process, which was mostly concerning the scheduling of staff, the present planning processes resulted in a capacity use that did not reflect the actual demand for capacity.
Regarding the decision-making in the planning processes, planning tools and policies were also lacking. For example, there were no proper tools (manual or software) for visualizing how the current production performance affected budget, production volume, or patient waiting time. Regarding planning policies, there was, for example, no policy concerning how long waiting lists could become before any serious actions were taken to shorten them.
5.1.5SummaryofhowplanningprocessdiscrepanciesaffectperformanceTable 9 presents a summary of the discrepancies revealed in Study 1, by listing the connections that the planning process discrepancies have on the performance measures. ‘Direct effects’ are the results of the discrepancies, while ‘Effects on performance’ are the impacts the direct effects have on performance. In Study 1, all studied planning processes experienced a general lack of structured procedures. This discrepancy is not explicitly denoted as an area of discrepancy in Table 9 but is rather regarded as part of all the other discrepancies.

59
Table 9. Table of the differences between theory and practice, i.e. the discrepancies, and their related effects.
Area of discrepancy
Theoretical propositions
Discrepancies Direct effects Effects on performance
Hierarchy of planning levels
A structured hierarchy of disaggregating business plan to daily, weekly, and monthly activities, together with providing feedback on production and planning performance
No structured planning processes Disregard of master (tactical) planning level Incomplete operational planning with focus on capacity
Feasibility of plans dependent on individual staff No ability to convert long-term production goals into activities No feedback on performance according to set production goals
Long patient queues (patient waiting time) Problems staying within budget due to reactive response to required extra capacity Inability to produce according to stated production volume for some patient groups
Master planning
Reach consensus on production plans
Reach consensus regarding providing capacity and what to produce
No feasible plan stating required daily and weekly production to achieve production goals
No plan designed to stay within budget, counteract patient waiting time and achieve production volume
Find balance between required and available capacity
Focus on utilisation of available capacity
Imbalance where the available capacity did not reflect the required capacity Planning to have high utilisation of presumed bottleneck
Increased patient waiting time through an imbalance of required and available capacity Potential to be misled when planning, adjusting for bottlenecks that might not exist. Affects patient waiting time and production volume
Long-term perspective
Focus on short-term planning
No time for adjusting when contingencies occur No warning received for insufficient capacity or capacity losses
Lost capacity could have reduced patient waiting time, increased production volume, utilised existing resources within budget (less need for extra costs) Increased patient waiting time Reactive adjustments (increase in capacity) – extra costs
Forecasting Forecast anticipated demand
No forecasting or use of available data for forecasting
Lack of awareness of future demand to be met No possibility to adjust capacity accordingly
Potential lack of capacity affecting patient waiting time and production volume Potential loss of capacity, requiring extra capacity affecting budget
Prioritising between patient groups
Prioritise resource use between patient groups
No use of giving priority to patient groups when allocating resources
No awareness that prioritising amongst patient groups is possible or necessary
Uneven patient waiting times amongst patient groups Not achieving production volume for certain surgery procedures

60
5.2Researchquestion2The research question stated regarding the tactical capacity planning process is: What would a tactical capacity planning framework in healthcare comprise?
The findings of the literature review of Study 2 shows that an active tactical planning process enables managers to move away from the current short-term, costly damage-control measures to a more proactive manner of capacity adjustment. Changing over to a proactive method provides department managers with the possibility of adjusting production well enough in advance to maintain the budget, while keeping waiting times and queues within limits. So, if tactical planning is such an important part of production planning, how is it done?
5.2.1FrameworkfortacticalcapacityplanningThe first part of the results in Study 2 represent the compilation of theory to generate a framework for tactical capacity planning at hospital departments. The framework is primarily based on the structure for sales and operation planning presented by Tavares Thomé et al. (2012) and consists of four categories: the structure and activities, input, adjustments, and output. These categories are intended to differentiate between what needs to be decided upon, by whom, and when the decision is required (structure and activities), required incoming data (input), what can be made to establish a balance between available and required capacity (adjustments), and the expected output of the process (output).
The content of the four categories is derived from previous studies (accounted for in Paper II) and compiled in the framework presented in Table 10. The first column in Table 10, ‘Structure and Activities’ defines the organisation of the planning process. Firstly, the frequency of the meetings and the participants in the meetings are discussed (Tavares Thomé et al. (2012); Lapide (2004)). Supplementing these points is the planning perspective of the meetings, here defined by the planning horizon and the planning objectives (Tavares Thomé et al. (2012) Jonsson and Mattsson (2009)). The process steps of the tactical capacity planning process are denoted as activities and are derived from the manufacturing planning and control model (MPC) (Jonsson and Mattsson, 2009). In the category of structure and activities also lie the support systems for planning processes.
The second column of the planning process framework, in Table 10, is the ‘Input’ into the process. Here data concerning the demand is considered as well as the supply of resources that are to deliver according to demand. At the tactical planning level, plans regarding the supply of resources are referred to as a rough-cut capacity plan, or RCCP (Jonsson and Mattsson, 2009). Restrictions linked to allocated budget, decisions taken at the strategic planning level and operational constraints are all necessary inputs. The restrictions are considered in this category to ensure the feasibility of the produced output of the planning process, which is the production plan. Targets listed in the inputs are related to defining the production performance that the production system is targeting. This means that the targets decide the when, where, with what and to whom services are planned to take place to achieve the stated goals. The tolerance levels are a decided policy of what to do if production deviates from plan. One example of a tolerance level is the length (measured in time or number of patients) we allow the patient queue to reach before taking measures.

61
The third column in Table 10, is the consideration of possible ‘Adjustments’ to either the available capacity or the required capacity on the demand side of capacity planning. Adjustments are derived from production planning theory and healthcare research. The principal output and the last stage of the planning process is the tactical production plan, drawn up by representatives of the concerned parties and setting demand, supply of resources, restrictions, targets and tolerance levels. The net result is a feasible production plan to which adjustments can be made to balance demand and supply. The output of the process also includes the feedback concerning both the production and the performance of the planning process.
Table 10. Tactical capacity planning framework developed in Study 2 and presented in Paper II.
Structure and Activities
Input Adjustments Output
Meetings Frequency Participants Planning horizon Planning object Activities Calculate available
and required capacity Compare available
capacity with required capacity
Choose suitable measures considering targets
Adapt the delivery plan and/or the production plan
Establish delivery plan, production plan and actions taken at the tolerance levels
Analytical methods Spreadsheet IT system support Mathematical models
Future demand Production plan based on: Unconstrained and
consensus-based forecast Downstream demand Backlog/waiting lists
Available capacity RCCP – including
anticipated capacity cut downs
Restrictions Budget (available funding) Strategic planning Operational constraints
Targets Throughput (time and
volume) Waiting time Length of waiting lists Resources utilization Costs (change in budget) Tolerance levels
Capacity adjustments Overtime Extra staff Sub-suppliers, i.e.
buy care from other healthcare provider
Moving capacity Cross-training Demand adjustments Medical priority Re-scheduling Building queues Admissions
planning Scheduling rules
Feasible production plan Feedback To upper
planning level To the next
round of planning
5.2.2ApplyingtheframeworktodifferentdepartmentsThis section concerns how the presented framework can be relevant to hospital departments with different production systems, ranging from high-tech resources to a system based on the staff’s experience and skill with little engagement of technological resources. The study shows context-related variations between the applicability of the framework for tactical planning process for hospital departments. These variations imply that within the context of healthcare there are differences affecting the tactical

62
planning process. These contextual differences can be found in all four categories of the framework
Structure and activities In this category of the framework, the maturity of the process had a large impact on how to take proper actions in improving or correcting the content and structure of the process (Lapide, 2005b). One of the studied department processes was in an immature state with little or no activity of the framework. This resulted in little need for input into a planning process that was not in place, and no expectations and use of planning process output. The adjustments, however, were frequently used in a reactive way.
The findings of Study 2 included other context-related factors, such as the size and dispersion of the department. A relatively large department resulted in a planning process that was divided into two layers, that is, planning locally at the geographically dispersed units which was later combined in a regional planning process. This resulted in an alternative list of activities and affected also the participants of the meetings.
Input In the category of input, the maturity of the planning process resulted in what input was used in the process. The urology department was searching and using all accessible information from the database systems in their planning process. The cardiology department had access to information but did not know how to use it. The psychiatric department encountered a different dilemma when the database system did not record information that was relevant to the planning process of psychiatric patients. In their case, the design of the database system constituted an obstacle for proper planning.
Adjustments The constraints on adjustments for the departments were also context related, where supply of specialized staff was delimiting capacity adjustments for two out of three departments. This resulted in limited options for capacity adjustments. Another context-related difference in capacity adjustments was, for example, in the provision at the psychiatric department. At this department, it is harder to adjust the demand side of the balance since the type of care provided requires continuity, both in the frequency of contact and in the individuals, who are treating each patient. Moving patients between care providers or letting patients wait are not suitable adjustments within the psychiatric department, compared to cardiac patients who rely more on the procedure than the staff performing the procedure. In addition to the requirement of continuity, the psychiatric department has a problem estimating the number of visits a patient will require, making it hard to forecast the demand of resources. The capacity requirements of the cardiology and the urology departments are easier to estimate, with the capacity demand stemming from the properties of the diagnosis.
Output The output of the planning process was actively used in two out of three departments. This was decidedly a result of the maturity of the process. At the urology department, the production plan was used as an outline for the operational scheduling and it was adjusted when contingencies in production arose. The psychiatric department also used the production plan as an outline for operational planning and further evaluated their planning process according to how feasible the produced plans were.

63
The application of the framework at different departments revealed contextual variations. The findings also highlight the necessity to keep the state of maturity of the process in mind. The devotion of the manager was the paramount feature affecting the performance of the planning process. The manager’s role was decisive regarding the activities performed, the frequency of meetings, the planning targets and tolerance levels, the choice of measures and the use of the planning process output.
5.3Researchquestion3The research question stated for Study 3, in the area of estimating required capacity is: On what conditions is RCCP methods applicable when capacity planning in healthcare?
To answer the research question of the study, the analysis empirically examines the relationship between the weekly incomes of referrals with the requirement for certain activities. The first condition was tested by analysing the strength of the relationship between the number of referrals and their resulting number of activities for the six most frequent activity types, by employing linear regression. The result of the analysis is presented in Table 11.
The descriptive statistics in Table 11 describes the average number of incoming referrals during the 52 weeks included in the analysis and their resulting average number of activities, regardless of when these activities were performed after admission of the patient. For example, there is an average number of 10.3 referrals per week for hip prosthesis, resulting in an average number of 9.38 first visits. The follow-up visit, and the telephone contact differ from the four other activities in that they may occur several times for one and the same referral. The R2 value listed in Table 11 is the explanatory power of the independent variable (number of referrals) for the estimation of the frequency of occurrence of the activity types, that is, how well the number of incoming referrals explains the resulting capacity requirements.
To test the second and third conditions, the average, median, and standard deviation of the lead-time between the first visit activity and the surgery activity were calculated. The result is presented in Table 12, and the corresponding histograms for Hip and Knee are presented in Figure 14 and 15, respectively.

64
Table 11. The result of the analysis of the six most frequent activities, for the two patient groups, Hip and Knee prosthesis. The table presents the average number of incoming referrals for the 52 weeks analysed and the average number of resulting occurrences from these referrals. The explanatory power, R2, of each of the independent variables (activity types) in the linear regression model is presented.
Descriptive Statistics [Average number per week]
Patient group
Activity Number of
incoming referrals Number of
performed activities R2
Hip
First visit
10.3
9.38 0.92 Pre-surgery visit 4.38 0.52 Hip surgery 4.85 0.57 Stay at ward unit 4.69 0.54 Follow-up visit 9.23 0.34 Telephone contact 3.06 0.07
Knee
First visit
11.50
10.83 0.98 Pre-surgery visit 3.44 0.38 Knee surgery 3.12 0.42 Stay at ward unit 3.35 0.37 Follow-up visit 8.12 0.39 Telephone contact 2.56 0.18
Regarding Condition 2, Table 12 shows that both average and median values by far overrun the planning period length of one (1) month, for both patient groups. The histogram in Figure 14, shows that 96 per cent of the hip prosthesis cases are having a lead-time of more than one month, whereof 69 per cent exceeding three months. For knee prosthesis cases, the corresponding numbers are 91 and 52 per cent. From this, it can be stated that Condition 2 is not met for the two case patient groups in the study.
Table 12. Descriptive statistics of the lead-time between first visit and surgery for hip and knee prosthesis
Patient group No. of patients Average Median Standard deviation
Hip 338 122 days 93 days 101 days Knee 228 152 days 131 days 99 days
Condition 3 concerned the stability of the lead-time from incoming referral to the capacity requirement of an activity. The standard deviation of the lead-time from first visit to surgery was analysed to test this condition and is presented in column 5 in Table 12. The standard deviation is 101 days for hip prosthesis and 99 days for knee prosthesis. This means that the standard deviation of the lead-time between these two activities along is equivalent to the length of about three planning periods. Also, from the histogram in Figures 14 and 15 it becomes clear that the variation is high. For knee prosthesis, for example, about nine per cent of the cases are having a lead-time less than one month, while about ten per cent are having a lead-time of more than eight months.

65
Therefore, from the test applied in this study, it is clear that Condition 3 is not met for the two case patient groups in the study.
Figure 14. Histogram for hip prosthesis, showing the shares of patients for intervals of lead-time between first visit and surgery.
Figure 15. Histogram for knee prosthesis, showing the shares of patients for intervals of lead-time between first visit and surgery.
The fourth condition was tested in a more qualitative way, by comparing the actual sequence of activities with the standardized treatment processes. By definition, most activities have to be performed in the sequence shown in Figure 16. For example, a follow-up visit cannot precede a first visit. Nevertheless, treatment for many patients does not strictly follow the indicated process. Common examples of deviations from the standard are that a follow-up visit precedes the pre-surgery or surgery activity, that several follow-up visits are scheduled, and that telephone contact takes the place of the follow-up visit after surgery. Overall, 25 per cent of the total number of patients performing surgery as the first activity after the pre-surgery visit followed the standardized process depicted in Figure 16.

66
Figure 16. The standardized treatment process for the two patient groups. The numbers at the arrows going into each box (activity) show the share of patients entering this box according to the standard.
5.4Researchquestion4The second research question stated in the area of estimating required capacity is: Does the knowledge of the surgeons reduce the uncertainty of estimated required capacity at operating theatres?
This section presents the findings of Study 4, a theory-testing study of the surgeons’ ability to identify atypical surgeries within a patient group. The test is conducted by comparing a manual estimation system of surgery time made by the surgeons themselves – that we denote surgeon-estimated time (SET) – and a calculated average value (CAV) based on previously made surgeries for the same procedure performed by the same surgeon.
The findings of Study 4 show that there is a significant difference between the estimates made by both the SET and the CAV systems compared to the actual surgery time. This means that these two estimation systems both deviate enough from actual times to show a significant difference in surgery time, considering all analysed cases. The mean value of the SET system, 63.2 minutes, and the mean value of the CAV system, 54.1 minutes. These values are on opposite sides of the actual mean value, 57.4 minutes. Compared to the actual outcome, the high SET mean value indicates that surgeons tend to overestimate surgery time, whereas the CAV mean value, on the other hand, implies an underestimation of surgery time.
To better understand the relationship between the actual outcome and the estimated mean values of the two systems, Figure 17, shows the relationship between these by superimposing normalised mean values of the SET and CAV systems onto the distribution of the normalised actual surgery time, for all cases. The normalised value makes it possible to compare and summarize the estimation error for short procedures with the estimating error for longer procedures. The actual mean values of the procedures range from a mean of 13 minutes to a mean of 136 minutes.

67
Figure 17. Mean values of the two estimation systems superimposed on the distribution of the normalised actual outcome for all surgeries.
The position of the normalised mean value for the CAV system, 0.95, is close to the peak of the distribution for actual surgery time, which has a mean value of 1. The normalised mean value of the SET system is 1.26, indicating that the normalised estimation error of the SET system is 0.26, compared to 0.05 for the CAV system. Table 13 presents the estimation errors of the two systems for all cases, both measured in minutes, and their normalised values.
Table 13. Mean and standard deviation of the estimation error of the two systems for all cases.
Estimating error Minutes
Estimating error Normalised values
SET – Actual
outcome
CAV – Actual
outcome SET – Actual
outcome CAV – Actual
outcome
Mean value 5.8* 3.3* 0.26** 0.05**
Standard deviation
27.0 26.4 0.55 0.46
Notes: *Significance between the estimating errors of the systems measured in minutes, p-value < 0.001. **Significance between the normalised estimating errors of the systems, p-value < 0.001.
The second part of the analysis consisted of an investigation of surgeons’ ability to identify long cases by considering additional factors in their estimates (Table 14). The first row of the table shows how the estimation errors of the two systems for all procedures change depending on the length of surgery. The results of the analysis of all procedures are presented as normalised measures. The normalised values are used to allow the estimation error for each procedure to contribute equally, regardless of surgery duration. The surgery duration of the cases in Table 14 is divided into three categories: all cases, surgery durations above the 50th percentile and surgery durations above the 75th percentile.

68
Analysis of the estimation error for all procedures (first row of Table 14) shows that, compared to the CAV system, the SET system improves its estimation accuracy when surgery duration increases. Since the SET system shows a tendency to overestimate surgery time, with a mean normalised value of 0.26, the analysis is complemented with a calibrated analysis of all procedures. In this analysis 0.26 was subtracted from the normalised value for each case, to compensate for systematic overestimation (second row of table 14). The results (see the second row of Table 14) show that compared to the CAV system, the SET system generates a significantly smaller absolute estimation error when the surgery time increases. The standard deviation of the SET system is greater than that of the CAV system above the 50th percentile – but becomes equally large for surgeries above the 75th percentile.
To identify differences in estimation errors between procedures, the estimating errors of the four largest procedures are presented in Table 14. The procedure-specific numbers in the last four rows of Table 14 show that the CAV system produces smaller estimation errors for all four procedures than the SET system, when analysing the estimation accuracy for all surgeries. Two procedures show smaller standard deviations for all cases, while knee arthroscopy shows equal standard deviation and varicose veins larger standard deviation. To summarise, the results from all cases, for the four largest procedures, show that the mean estimation error is smaller for the CAV system, while the smallest standard deviation for the CAV and SET systems varies between procedures. Studying how the mean estimation error for the four procedures changes as surgery time increases shows that the SET system more accurately predicts surgery times over the 75th percentile. There is no clear improvement in standard deviation, and the smallest standard deviation of the estimation error shifts between systems. That the mean estimation error of the SET system is smaller than the same for the CAV system, for longer cases, is distinguished for all four procedures. However, the difference between the estimation errors made by the SET and CAV systems cannot be significantly confirmed for one of the four procedures – varicose veins.
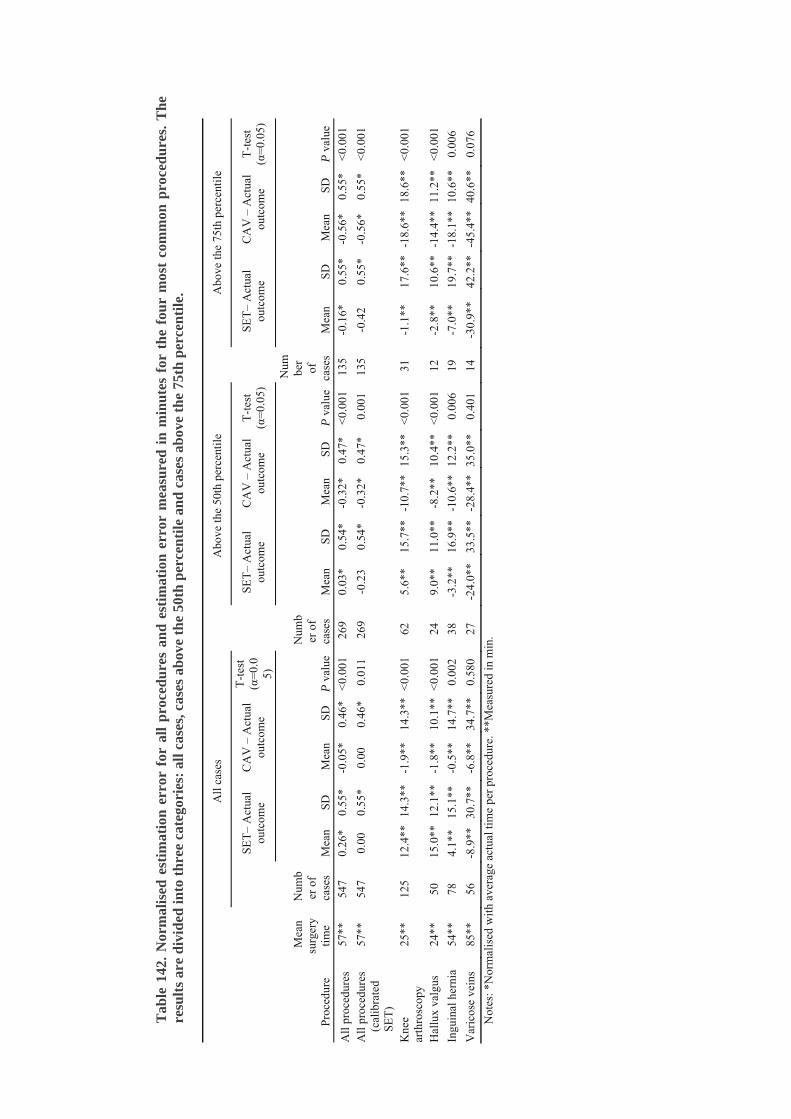
Tab
le 1
42.
Nor
mal
ised
est
imat
ion
err
or f
or a
ll p
roce
du
res
and
est
imat
ion
err
or m
easu
red
in
min
ute
s fo
r th
e fo
ur
mos
t co
mm
on p
roce
du
res.
Th
e re
sult
s ar
e d
ivid
ed in
to t
hre
e ca
tego
ries
: al
l cas
es, c
ases
abo
ve t
he
50th
per
cen
tile
an
d c
ases
ab
ove
the
75th
per
cen
tile
.
All
cas
es
A
bove
the
50th
per
cent
ile
A
bove
the
75th
per
cent
ile
SET
– A
ctua
l ou
tcom
e C
AV
– A
ctua
l ou
tcom
e
T-t
est
(α=
0.0
5)
SET
– A
ctua
l ou
tcom
e C
AV
– A
ctua
l ou
tcom
e T
-tes
t (α
=0.
05)
SET
– A
ctua
l ou
tcom
e C
AV
– A
ctua
l ou
tcom
e T
-tes
t (α
=0.
05)
Pro
cedu
re
Mea
n su
rger
y ti
me
Num
ber
of
case
s M
ean
SD
Mea
n SD
P
val
ue
Num
ber
of
case
s M
ean
SD
Mea
n SD
P
val
ue
Num ber
of
case
s M
ean
SD
Mea
n SD
P
val
ue
All
pro
cedu
res
57**
54
7 0.
26*
0.55
* -0
.05*
0.
46*
<0.
001
269
0.03
* 0.
54*
-0.3
2*
0.47
* <
0.00
1 13
5 -0
.16*
0.
55*
-0.5
6*
0.55
* <
0.00
1
All
pro
cedu
res
(cal
ibra
ted
SET
)
57**
54
7 0.
00
0.55
* 0.
00
0.46
* 0.
011
269
-0.2
3 0.
54*
-0.3
2*
0.47
* 0.
001
135
-0.4
2 0.
55*
-0.5
6*
0.55
* <
0.00
1
Kne
e ar
thro
scop
y 25
**
125
12.4
**
14.3
**
-1.9
**
14.3
**
<0.
001
62
5.6*
* 15
.7**
-1
0.7*
* 15
.3**
<
0.00
1 31
-1
.1**
17
.6**
-1
8.6*
* 18
.6**
<
0.00
1
Hal
lux
valg
us
24**
50
15
.0**
12
.1**
-1
.8**
10
.1**
<
0.00
1 24
9.
0**
11.0
**
-8.2
**
10.4
**
<0.
001
12
-2.8
**
10.6
**
-14.
4**
11.2
**
<0.
001
Ingu
inal
her
nia
54**
78
4.
1**
15.1
**
-0.5
**
14.7
**
0.00
2 38
-3
.2**
16
.9**
-1
0.6*
* 12
.2**
0.
006
19
-7.0
**
19.7
**
-18.
1**
10.6
**
0.00
6
Var
icos
e ve
ins
85**
56
-8
.9**
30
.7**
-6
.8**
34
.7**
0.
580
27
-24.
0**
33.5
**
-28.
4**
35.0
**
0.40
1 14
-3
0.9*
* 42
.2**
-4
5.4*
* 40
.6**
0.
076
Not
es: *
Nor
mal
ised
wit
h av
erag
e ac
tual
tim
e pe
r pr
oced
ure.
**M
easu
red
in m
in.
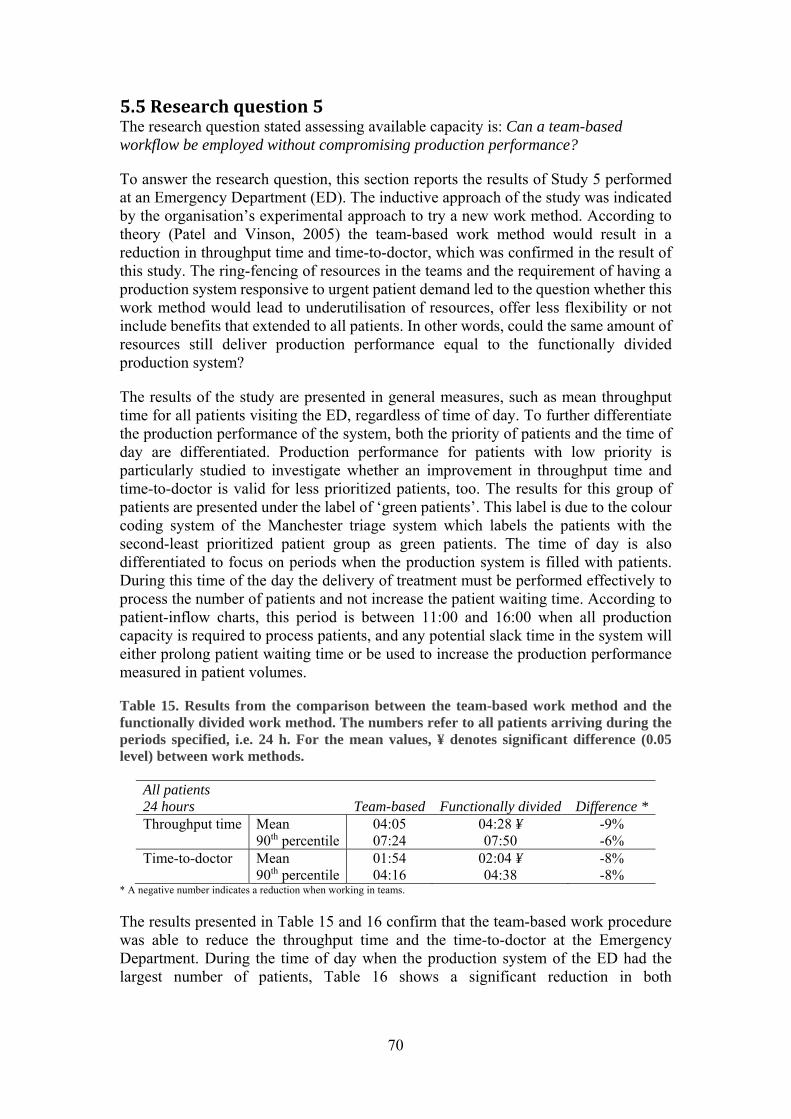
70
5.5Researchquestion5The research question stated assessing available capacity is: Can a team-based workflow be employed without compromising production performance?
To answer the research question, this section reports the results of Study 5 performed at an Emergency Department (ED). The inductive approach of the study was indicated by the organisation’s experimental approach to try a new work method. According to theory (Patel and Vinson, 2005) the team-based work method would result in a reduction in throughput time and time-to-doctor, which was confirmed in the result of this study. The ring-fencing of resources in the teams and the requirement of having a production system responsive to urgent patient demand led to the question whether this work method would lead to underutilisation of resources, offer less flexibility or not include benefits that extended to all patients. In other words, could the same amount of resources still deliver production performance equal to the functionally divided production system?
The results of the study are presented in general measures, such as mean throughput time for all patients visiting the ED, regardless of time of day. To further differentiate the production performance of the system, both the priority of patients and the time of day are differentiated. Production performance for patients with low priority is particularly studied to investigate whether an improvement in throughput time and time-to-doctor is valid for less prioritized patients, too. The results for this group of patients are presented under the label of ‘green patients’. This label is due to the colour coding system of the Manchester triage system which labels the patients with the second-least prioritized patient group as green patients. The time of day is also differentiated to focus on periods when the production system is filled with patients. During this time of the day the delivery of treatment must be performed effectively to process the number of patients and not increase the patient waiting time. According to patient-inflow charts, this period is between 11:00 and 16:00 when all production capacity is required to process patients, and any potential slack time in the system will either prolong patient waiting time or be used to increase the production performance measured in patient volumes.
Table 15. Results from the comparison between the team-based work method and the functionally divided work method. The numbers refer to all patients arriving during the periods specified, i.e. 24 h. For the mean values, ¥ denotes significant difference (0.05 level) between work methods.
All patients 24 hours
Team-based Functionally divided Difference *
Throughput time Mean 04:05 04:28 ¥ -9% 90th percentile 07:24 07:50 -6% Time-to-doctor Mean 01:54 02:04 ¥ -8% 90th percentile 04:16 04:38 -8%
* A negative number indicates a reduction when working in teams.
The results presented in Table 15 and 16 confirm that the team-based work procedure was able to reduce the throughput time and the time-to-doctor at the Emergency Department. During the time of day when the production system of the ED had the largest number of patients, Table 16 shows a significant reduction in both

71
measurements. According to Table 16, the team-based work method has the largest reduction in time during this time of the day.
Table 163. Results from the daytime comparison between the team-based work method and the functionally divided work method. The numbers refer to all patients arriving between 11:00 and 16:00. Significant difference (0.05 level) between work methods is denoted with ¥.
All patients, 11.00 – 16.00 Team-based Functionally divided Difference * Throughput time Mean 04:35 04:59 ¥ -8%
90th percentile 08:03 08:20 -3%Time-to-doctor Mean 02:12 02:31 ¥ -13%
90th percentile 04:44 05:35 -15%* A negative number indicates a reduction when working in teams.
When focusing on the effects the team-based work method has on the less prioritized patient group – in this case the ‘green’ second-least prioritized patients – the improvement in through-put-time and time-to-doctor remains. The results show that when compared to the functionally divided work method, the ‘green’ group of patients got to see the doctor at earlier stages of the pathway (Table 17). The fact that the doctors were able to evaluate all patients earlier than before – including the less prioritized green patients – indicates an improvement in treatment quality, with the condition properly evaluated by medical expertise earlier in the process. With the improvement in time for all patients, the green patients gained the most in time reduction during the high-pressure hours of the afternoon (Table 18).
Table 17. Results for patients given the green colour as triage group, that is, patients in the second-least severe group. The numbers refer to all green patients arriving during 24-hour period. Significant difference (0.05 level) between work methods is denoted with ¥.
Green patients 24 hours Team-based Functionally divided Difference *
Throughput time Mean 04:05 04:34 ¥ -11%90th percentile 07:30 08:16 -9%
Time-to-doctor Mean 02:12 02:32 ¥ -13%90th percentile 04:33 05:35 -19%
* A negative number indicates a reduction when working in teams.
Table 184. Results for patients arriving between 11:00 and 16:00 and given the green colour as triage group, that is, patients in the second-least severe group. Significant difference (0.05 level) between work methods is denoted with ¥.
Green patients, 11.00 – 16.00 Team-based Functionally divided Difference *
Throughput time Mean 04:39 05:15 ¥ -11%90th percentile 08:25 08:51 -5%
Time-to-doctor Mean 02:32 03:07 ¥ -30%90th percentile 05:09 06:22 -19%
* A negative number indicates a reduction when working in teams.
To conclude, the use of teams decreases the time patients spend waiting for the physician. The risk of missing diffuse but severe medical conditions is reduced through

72
the reduction in time-to-doctor, which is the waiting time from arrival to the first visit with the doctor. This means that a proper medical evaluation is made earlier in the patient process. The production performance was maintained and even improved when using the team-based working method. This was accomplished with no addition of resources. That is, the team-based organization did not negatively affect the patient throughput time or the time it took for patients to see the doctor, though ring-fencing resources in the teams. The control of the planning system was also improved. From a planning perspective, the use of teams provided fewer planning points when planning the production, compared to the many entities in a functionally divided system. This was achieved by letting each of the teams become a singular planning point.

73
6DiscussionIn this chapter, both the theoretical and the practical contributions of the thesis are discussed by answering the five research questions with the results of the five studies, section 6.1 – 6.5. The studies’ contribution to the thesis’ overall purpose are discussed in section 6.6.
6.1 How do planning process discrepancies affect productionperformance?In Paper I, the problems of achieving production performance were studied from a production planning perspective. In this study, the contribution to knowledge is made by identifying problems caused by planning discrepancies, which are deviations between practice and planning theory. The planning theory that was used in the comparison to practice was the hierarchical structure of the MPC model, as described in Jonsson and Mattsson, (2009). The studied hospital department had problems with production performance regarding the ability to stay within budget, produce according to set production volumes and keep patient waiting time short. A summary of the proposed linkage between identified planning discrepancies and production performance is presented in Chapter 5.1 (Table 9).
In the two following sub-sections, the contribution of the study is discussed. Theoretical contributions relate both to the individual areas of the identified discrepancies (section 6.1.1) and to discussion of the combination of discrepancies and their link to production performance (section 6.1.2). The application of planning theory in the healthcare setting broadens the knowledge of planning theory by adding application onto a system of healthcare production.
The practical contribution in Paper I is the identification of the linkage between planning discrepancies and production performance. In the studied case, the perceived production performance was low availability to surgery. The propositions on linkage represent the problems that can occur when planning is poor, and therefore these identify problem areas that may hamper an effective use of resources. The identification of discrepancies between theory and practice provides guidance on how to set up the planning process to realise production goals. The reasoning of the linkage between the planning discrepancies and production performance provides practitioners with knowledge of the importance and function of planning processes.
6.1.1 The individual link between capacity planning discrepancies andproductionperformanceAn overall discrepancy between planning theory and practice was the lack of structure in the individual capacity planning processes and no for hierarchical planning processes with different planning horizons. The lack of structure for the individual planning processes was present at both the tactical and the operational planning levels. The operational planning that was made relied on the skills and knowledge of individual staff, which resulted in processes with little standardization and made the outcome of the operational planning vulnerable due to irreplaceable planning staff.
In Chapter 3, the purpose of the capacity planning process is to “determine future required capacity and to establish, measure, monitor and adjust limits or levels of capacity to execute feasible production schedules” (based on APICS, 2005; Jonsson
74
and Mattsson (2009). The lack of hierarchical planning structure resulted in no disaggregation of tactical planning into operational planning. Thus, the operational planning had no guidelines through a master production schedule. The results in Paper I show that not having a proper master planning process resulted in difficulties to stay within budget. In addition, it resulted in difficulties in keeping the patient waiting times short and achieve required production volumes as stated in the production goals.
The results in Paper I showed that the operational and tactical planning processes had a strong focus on the utilisation of resources. The planning processes had little action devoted to determining the required supply of capacity to achieve production goals. In all studies of this thesis, it was observed a strong focus on resource utilisation. The perception was that a high utilisation of resources automatically leads to the highest performance that can be achieved with the resources. Therefore, a common interpretation of the low production performance was that there was a lack of capacity since “we work as hard as we can”. A practical contribution of the results in this study was that a capacity planning process with a strong focus on the resources results in planning that adjusts demand according to how the resources are chosen to be utilised, not according to what is required to be produced. A capacity planning process with a strong resource focus at an operational level can be planning that follows the scheduling of physicians or other scheduled key actors. This focus of the planning may deliver a high utilisation of the resources but will have little to do with the requirements of the demand.
To provide the planning process with the possibility of adjusting the capacity according to demand requires a forecasting system for the anticipated demand. The operational planning process in the studied system estimated surgery time by calculating an average value of previously performed incisions. The studied tactical planning processes included no proper forecasting activities and no proper estimation of anticipated demand. The lack of forecasting and estimation of required capacity caused both a lack of and loss of capacity. Using forecasting could improve the adjustment of capacity and manage the balance between required and available capacity to reduce patient waiting time and improve production volume. According to Blackstone (1989), the lack of a structured use of tactical planning deprives managers of interpreting production goals into production rates and prevents them from balancing production rates with available resources. Neglecting the tactical planning level results in a reactive response to changes in required or available capacity. The reactive response leads to short-term solutions due to capacity imbalances and to extra costs, so that staying within budget becomes a problem.
Prioritizing the allocation of resources to patient groups was not structurally used in the planning processes except by prioritising according to medical urgency. In the studied planning processes, imbalances between patient groups could be seen where the production goals were achieved for some patient groups at the cost of other patient groups. With highly specialized resources, distribution of resource supply between patient groups can be impossible. The studied department did have the possibility of changing the allocation of resources between some patient groups. However, due to the lack of actively give priority to patient groups requiring more resources, this possibility was not utilised. Utilising the possibility prioritize between patient groups, could benefit the production performance by directing resources to support production of care to patient groups that need it more than other patient groups, for example, due to the length of the waiting lines.

75
6.1.2Combineddiscrepancies’linktoproductionperformanceThe identified discrepancies in Paper I could all be related to the tactical planning level (the master planning process). By disregarding the tactical capacity planning, management lacks the process in which strategic decisions are integrated into the weekly and daily operations (Jonsson and Mattsson, 2009; Jacobs et al., 2011). In this way, the top–down linkage in the hierarchical production planning and control system is broken as well as the upward feedback on performance (Butler et al., 1992; Butler et al., 1996). Furthermore, according to theory (Feng et al., 2008; Proud, 1994), the development of the master planning process is a way to create a planning process which balances required and available capacity. The master planning process should create this balance of capacities to achieve set production goals, which in the current case study was the problem that initiated the study in the first place. The use of a tactical planning process leads to an awareness of information that is required in the process. For example, if one does not have a tactical process in place it is difficult to understand the importance of a forecast of the demand which is translated into required capacity. Through a structured capacity planning framework, such as the one provided in Paper II, there are a great potential that more focus could be put in prioritising between patient groups when allocating resources, something that is missing today. In order to balance required and available capacity one need to understand the future demand and translate this demand into required capacity.
The imbalance due to the absence of structured capacity planning leads to the need to solve capacity deficiency by arranging additional temporary resources which inevitably results in extra costs. In combination with the deficit forecasting and the possibility to give priority to patient groups, deprives managers of the option of adjusting available capacity between segments of patient demand.
6.2 What would a tactical capacity planning framework inhealthcarecomprise?Looking back to the findings of RQ1, the first contribution of having an effective capacity planning process is to identify the need to make a master plan and its effects on production performance. The contribution made by answering RQ2 is how the master planning is performed in healthcare departments. The tactical planning framework provided in Paper II contributes to theory by consolidating and structuring previous research in capacity planning outside healthcare, as well as more healthcare-specific research. From the production planning theory, input on how to structure the planning process as such and to illustrate what a tactical planning process includes was taken. The healthcare-specific theory, consolidated into the previously mentioned structure of tactical capacity planning, provides a planning process for effectively managing capacity at a healthcare department, with a long-term perspective to ensure available capacity.
To change the perspective from reactive to proactive requires linkage between the lower and the higher planning levels (Butler et al., 1996; Olhager and Wikner, 2000). This is achieved through the tactical capacity planning level. The question therefore becomes how to perform a tactical capacity planning process. The practical contribution of RQ2 is to provide a framework for performing a tactical planning process. The framework presents a foundation for the structuring of the planning process, with its activities and possible adjustments. The framework shows what to deliver as output from the planning
76
process and the purpose of delivering the output, such as feedback on performance or planning quality.
Variations in applicability of the theoretical framework were identified from the application in the existing tactical capacity planning process. It was seen that these originated from the departmental speciality and its set of specific resources, as well as the level of maturity of the planning process. The identified differences of applicability of the framework regarding structure and activities could mainly be derived from the immature planning process. Two out of three departments had a similar structure and activities, while the last department lacked a structured planning process. Regarding the input into the planning process, the variations originated from the speciality of each department. The same effect could also be seen regarding the adjustments made in the capacity planning process where the available adjustments and the choice of adjustments were related to the departmental speciality. The ability to alter the tactical capacity planning framework indicates that the framework may be used in different contexts as it is possible to adjust according to circumstances. The variations regarding the output of the planning process were primarily due to the expectations of department managers and what the managers intended to achieve with the planning process. Some managers expected to receive a feasible master production plan, while others expected help with the tracking of budget consumption.
Through the literature review in Paper II, the maturity of the planning process is presented (based on Lapide, 2005b). The differences between framework and practice suggest changes to the planning process and improvements to the process and its content. With the capacity planning framework in Paper II as a foundation, healthcare capacity planning processes may be improved and developed with support from the maturity framework of Lapide (2005b) and the framework created by Grimson and Pyke (2007). In a less mature planning process, the comparison between the framework of Paper II and practice can be used as a model to support the design and structure in the creation of a new planning process.
6.3 On what conditions are the rough‐cut capacity planningmethods (RCCP) applicable when estimating future requiredcapacity?The theoretical contribution in Paper III (and in Paper IV in section 6.4) concerns the estimation of required capacity by testing methods proposed in theory. In Paper III the RCCP methods and their application in practice are tested. Through a study of theory regarding RCCP methods and their requirements for application, four conditions were identified and were tested in a healthcare setting. Every distinct RCCP method has a combination of three to four conditions that needs to be fulfilled for an effective use and applicability of the method. Following is a list of all the identified theoretical conditions.

77
o Condition 1: Activities generated by a set of referrals show stability in terms of their resulting activities.
o Condition 2: All critical activities from a planning perspective are performed within the same planning period.
o Condition 3: Lead time from admittance to the planning period to which capacity requirements are allocated is stable or predictable.
o Condition 4: Known structure of activities for a patient group, i.e., patients are following a standardized treatment process.
The first condition tested concerned the explanatory power (R2) of the number of referrals to estimate the number of various activities downstream from the treatment process. The results show that the ‘first visit’ activity exhibits a high R2 (0.92), while the number of referrals has very low explanatory power for the activity ‘telephone contact’ (0.07). The low R2 for telephone contact reveals that this type of patient contact is not routinely used in the treatment process but is used only in specific cases, for example, in exchange for a follow-up visit. The remaining four activities have moderately high R2 values of between 0.34 and 0.57. Having an explanatory power in this numerical range indicates that the number of referrals has a predictive value, even though there are no definite limits of the number itself to state the strength. However, considering that the referral groups were chosen to reflect the most suitable conditions to be found at the hospital and the logic of the treatment process, one could expect higher predictive value, for example, for the pre-surgery visit and the surgery activity. Plausible explanations for this are the variation in judgement and practice between physicians (Doyle et al., 2010) and changes in hospital policy during the observation period.
To assess the value from a practical significance perspective, the result of the regression model was compared to the naïve forecast of the activities being equally distributed over the year. This comparison showed that the forecast accuracy if using the regression values, measured by the mean absolute deviations (MAD), is generally better than for the naïve forecast. This naïve method would probably not be used, for example, concerning the number of surgeries. The praxis at the hospital, studied in Paper III, is to use the previous year’s number of surgeries in a quantitative model considering trend and seasonality. However, such a forecast does not basically reveal the true and unconstrained capacity demand but merely mirrors the actual production performed historically, which is more a question of the available capacity and decided production plans and that time.
The second, third and fourth tests all concerned the conditions regarding allocating the resource requirement to specific planning periods, that is, whether a time-phased profile of activities could be detected. Such a profile could not be found through the analysis of the data. The lead time throughout the process and between activity types is much higher than the length of a planning period, ruling out the RCOF and RCBOR methods that allocate all resource requirement to a single planning period. Moreover, the standard deviation in lead time between activities is high, meaning that it is not possible to use a variant of the methods where capacity requirements for main activities are allocated a certain number of planning periods ahead, or making use of RCRP that truly aims at allocating resource requirements between planning periods (time-phasing). The lack of time-phased profiles may be due to a lack of structured treatment processes or to the physician’s conformance to such a process. However, the most probable reason

78
in this study is the combination of long throughput times, the employed production planning procedure lacking functionality of lead time control, and variations in available capacity. These factors together make it virtually impossible in the studied cases to employ the RCCP methods for estimating required resources downstream the treatment process. Long total throughput time and its relation to uncertainties is well known and pointed out by research in manufacturing environments, for example, by Towill (1996) who concludes that “collapsing time throughout the supply chain greatly reduces the negative effect of uncertain demand by increasing confidence in market forecasts which now scan a much shorter time horizon” (p. 27). The relation between uncertain lead times, planning practices, and throughput time is also known from the so-called lead-time syndrome, describing a vicious circle between prolonged lead times and uncertainty in delivery time (Selçuk et al., 2009). This means that also in healthcare systems having a high conformance to standardized treatment processes, lead times need to be short and controlled in order to effectively make use of the RCCP methods.
6.4Doestheknowledgeofthesurgeonsreducetheuncertaintyofestimatedrequiredcapacityatoperationtheatres?Most of the services that healthcare providers produce is through the skills and workmanship of their staff. The findings in Paper IV address this central aspect of providing healthcare by studying the variation in the service provision of manual work and the variety in required capacity due to the condition of individual patients. Paper IV contributes theoretically to the knowledge of healthcare capacity planning by increasing knowledge in how the estimation system of required capacity (here, surgery time) can increase its estimation accuracy. Even though the knowledge of the surgeons’ ability to identify atypical surgeries is well-known within the studied organisation, this information is not used as an asset to improve planning accuracy.
In the studied organisations, the information used when estimating surgery times is the quantitative information stored in administrative systems. The subjective knowledge of the surgeons regarding the specific patient is included in the estimation of the surgery. Research within manufacturing firms indicates that the significance of including the operator’s knowledge when scheduling improves the reliability of the schedules (Szelke and Kerr, 1994). Within the healthcare sector, previous research on including subjective knowledge when planning is documented and researched but with varying conclusions. Paper IV contributes to the existing discussion of the importance of including operator knowledge and tests the contradictory conclusions found in theory (Wright et al., 1996; Shukla et al., 1990).
The practical contribution of Paper IV is to improve the validity of surgery schedules. Paper IV implies that the knowledge of the surgeons regarding the patient’s condition would reduce the inaccuracy of estimated required capacity for patients with atypical conditions. Reducing the estimation error could in turn lead to better management of variations in surgery schedules, thus improving the use of the operating-theatre resources. The accuracy of the estimations by including subjective estimates of surgery time is, according to Paper IV, related to the design of the estimating system. More specifically, the accuracy is dependent on the size of the estimation modules that the estimations are based on. In a study by Shukla et al. (1990), surgeons’ estimations were made by adding 15-minute modules. In a study by Wright et al. (1996), surgeons used 30-minute modules. Both the estimation system used in Paper IV and the system in the report by Shukla et al. (1990) show that using 15-minute modules tends to overestimate

79
surgery time. The 30-minute modules used in the report by Wright et al. (1996) tend to underestimate surgery time. A plausible explanation is that surgeons using 15-minute modules tend to add an extra module for surgeries to cover the margin between two modules, while surgeons using 30-minute modules are more likely to thoroughly consider adding an extra module.
6.5Howcanateam‐basedworkingmethodsupportassessmentofavailablecapacity?The findings in Paper V contribute to the knowledge of assessment of available capacity. Deficit assessment leads either to excess capacity – which often is the same thing as lost capacity – or lack of capacity and additions to patient waiting time. The theoretical contribution in Paper V expands the focus of the research made by Patel and Vinson (2005) that studied the effects of team-based work methods on throughput time and time-to-doctor. According to theory, the use of teams tends to decrease resource utilisation and lower production flexibility (Wemmerlöv and Hyer, 1987). On the other hand, the benefits of teams should be to reduce throughput time (Sarker and Xu, 1998; Bhat, 2008), enhance teamwork and communication (Sarker and Xu, 1998), enhance visibility of the workflow (Sarker and Xu, 1998), and reduce set-up time (Wemmerlöv and Hyer, 1987). The functionally divided system enhances production flexibility but at the expense of production control due to the lack of a dominant workflow (Graves, 1985). Considering that the resource utilisation and the flexibility of the system is reduced by using grouping of resources (Wemmerlöv and Hyer, 1987), the question was whether the improvements seen in previous research (Patel and Vinson, 2005) concerned all patient groups or if the improved production performance was achieved for some patient groups at the cost of other patient groups, such as lower-priority patients. Paper V investigates whether the benefits of the team-based work method (Patel and Vinson, 2005) could be achieved with the condition that no extra resources were added.
The quantitative results in Paper V showed the expected reduction of throughput time and time-to-doctor that previous research showed (Patel and Vinson, 2005) and indicated that the improvement was also valid for low-priority patient groups. The benefits were significant for all patient groups and required no additional resources. Arranging the resources into teams created conditions for smooth and effective work processes, decreasing coordination problems between staff with different work roles and eliminating activities that were unimportant from a patient treatment point of view, thus reducing resource requirements. The teams enhanced coordination and communication between nurses and physicians. As a result, the teams required less administrative work to manage patient queues within the patient pathways. For the nurses, the reduced administrative work provided more patient-related work. An enhanced visibility of workflow was observed, as stated in theory (Sarker and Xu, 1998). The improved visibility permitted the location and activities of the other team members to be more easily detected, as well as the whereabouts of the patients, both their physical location in the building and their status in the treatment process.
The practical contribution regarding the assessment of available capacity in a production system is that the available capacity can be anticipated by the addition of teams. The capacity of a team is relatively predefined since it has a dominant workflow (Sarker and Xu, 1998). The addition of teams makes the adjustment of available capacity incremental, in accordance with Walley (2003) and contrary to functionally

80
divided production systems where the addition of an individual worker is harder to quantify regarding the increase in available capacity at the system level. The difficulty to assess the increase in capacity is due to the complicated network of interactions amongst staff members.
6.6EffectiveuseofresourcesSo how does this research contribute to an effective use of resources within healthcare, as was the purpose of the thesis? As stated by both national reports (Stiernstedt et al., 2016) and international reports (Rae, 2005; OECD, 2016), one of the concerns with the Swedish healthcare system is the availability to specialist treatment. Increasing accessibility can be approached in different ways, such as developing clinical methods and adding equipment to improve the treatment process. As stated by Stiernstedt et al. (2016), another way is by working with the structure of the healthcare system, the allocation of the patients among healthcare providers, and the flow of patients between healthcare providers in the system. The thorough study of the Swedish healthcare system made by Stiernstedt et al. (2016b) revealed that the notion that the cause of problems is a lack of resources is most often not true; rather the fault lies in the way the resources are used. The perspective of this research is from capacity planning point of view, where the effective use of resources is considered to improve with proper capacity planning. The research focuses on available resources and how to balance them in relation to the required capacity.
The combination of the results from the five included studies shows the importance of having and using all the planning levels in a hierarchical structure of planning processes, where Paper II focuses explicitly on the tactical capacity planning level. This research has not only provided an understanding of how improper capacity planning can be related to low production performance, but also contributed to the understanding of how the hierarchical structure can disaggregate strategic goals, to use the capacity according to required capacity of the patient demand (Paper II). Long-term planning was identified in Paper I as disregarded when planning the use of resources. Therefore, the research addresses the tactical planning process specifically to provide guidance at that stage and to contribute a framework providing foresight to allow proactive adjustment of capacity when required. To plan for the effective use of resources according to the needs of the patients, the required capacity must be known. This research addresses the difficulty of interpreting a varying demand into an estimation of required capacity. The estimation of required capacity is considered in Paper III and in Paper IV. In Paper III, an elective process is studied to consider the conditions for using established rough-cut capacity planning (RCCP) methods to estimate the required capacity downstream from the treatment process based on the forecasted number of referrals. The contribution of Paper III is an increased knowledge of the condition for the use of RCCP methods within a healthcare context. Theoretically, the use of RCCP methods can be considered as suitable for the estimation of required capacity. The referral groups chosen in Paper III were also considered suitable for the RCCP methods, with their perceived set of standardized treatment activities. However, in practice the application of RCCP methods were not as suitable as expected, when required condition for using the methods in practice were not fulfilled. No time-phased profile of activities could be detected and the lead time throughout the process and between activity types was much higher than the length of a planning period. Reasons for this might be due to a lack of structured treatment
81
processes or to the physician’s lack of conformance to such a process. Put together these factors make it virtually impossible to employ the RCCP methods when estimating required resources downstream the treatment process. In practice this means that a good plan can be ruined when practice is not provided in a predictable way.
On the operational level, the contribution is made by looking at the estimation of operation time that depends on the operator performing the activity in addition to the condition of the individual patient. The contribution is made by addressing the question of whether the knowledge and experience of the operator would contribute to the estimation of capacity. In a healthcare setting, the estimation of capacity in relation to the operator and the patient’s condition seems central when the main part of the healthcare provision is made by human resources and the services that are produced are dependent on the requirements of the patients.
The research regarding the assessment of available resources provides increased knowledge of using a team-based work method. In a capacity planning perspective, the use of teams facilitates the assessment of available capacity. Assessing the capacity of a divided system is difficult when the capacity of the system is determined by a combination of several categories of staff and their ability to cooperate. The contribution is thus made by introducing a team-based work method as an alternative to the functionally divided system. Not only does this method improve production performance, but it also improves the ability to assess the available capacity by reducing the number of planning points.
Each of the studies focuses on different phenomena within capacity planning. The departments and patient groups that are included in the studies are almost all unique within the total research of the thesis, except for orthopaedics which occurs in two of the studies. The variety of specialization is a consciously made choice. According to theory, capacity planning a production system depends on the characteristics of the production system that is being managed, the services that are being produces, and the characteristics of the demand that is to be met (Jonsson and Mattsson, 2003; Jacobs et al., 2011). By including a variety of medical specialties, the research has provided an understanding of the differences in characteristics and the services produced by the medical specialties. The understanding of the differences in capacity planning has not been the focus of the studies (except when applying the tactical planning framework in Paper II) but has contributed the understanding of capacity planning of specialized healthcare as a secondary effect. To show the width of studied specialist treatment and the characteristics of the patients, the studies have covered the emergency department (orthopaedic ER), urology, psychiatrics, cardiology, orthopaedics and general surgery. In Chapter 2, a classification of patients, presented by Lillrank et al. (2010), was introduced. In this thesis, six of the patient categories have been subject to research studies (Table 19). One patient category has not been included in the research and this is Prevention.

82
Table 19. Specialties and the patient categories included in the research.
Patient Category*
Emergency Department (Orthopaedics) Urology Psychiatrics Cardiology Orthopaedics
General Surgery
Prevention
Emergency x x x x x x One visit x x x x x x Project
x x x x x
Elective process
x x x x x
Cure process
x x x x x
Care process
x x x x x
* The categories are based on the work of Lillrank et al. (2010) as described in Chapter 2.
83
7ConclusionsandfurtherresearchThis section concludes the thesis, summarises the contribution of the thesis and gives suggestions for further research.
7.1ConclusionsdrawnfromincludedstudiesThe thesis focuses on the ability of healthcare providers to provide care in accordance to the demand of the patients they are serving. The way resources are used in relation to what they are intended to perform is an effective use of resources. From research performed in other national settings, such as by Silvester et al. (2004), an effective use of resources seems to be a problem in other countries as well as in Sweden. To achieve an effective use of resources requires at least a knowledge of what to deliver and how this demand is interpreted into required capacity. Effective use of resources also requires assessment of the available capacity that the resources can deliver. Through the capacity planning processes, the required and available amount of capacity can be balanced through adjustments of either the required capacity or the available capacity. In the introductory chapter of this thesis, the limited availability of the Swedish healthcare system and its low productivity were stated as major problems. According to research, the unavailability is often not a problem due to a lack of resources but is rather a result of ineffective use of resources (Stiernstedt et al., 2016b; Ackerby et al., 2010). Given that the amount of resources is not the problem, this thesis set out to research the area of how to effectively manage healthcare resources with a purpose “to contribute to the knowledge of healthcare capacity planning for effective use of resources”.
The research is based on case studies and performed in five separate studies, all within a specific area of capacity planning. The studies combine a review of previous research, which provides the theoretical base for the research questions and an analysis of empirical material from healthcare practice. The case study approach provides results that combine real-life managerial situations and previously conducted research to contribute further to both theory and practice. Studies where this is done are, for example, the created framework for tactical capacity planning. In Paper II, existing capacity planning theory is consolidated with and applied in a healthcare setting. The empirical testing of rough-cut capacity planning methods (RCCP methods) in healthcare and the comparison between the MPC model and its capacity planning processes in a realistic setting are additional examples of where theory and practice are combined.
The healthcare setting can be described through qualitative data, such as interviews, observations or descriptive historical documents, or by quantitative data stored in the administrative systems. The data collection used in the studies includes both quantitative and qualitative methods to use all relevant and available data. The various sources of data improve the reliability of the interpretation of quantitative data and can confirm subjective information of qualitative data given during interviews and observations in a more objective way.
The conceptual model introduced in the introduction chapter (Figure 1) is the central model of this thesis. The theoretical and practical contributions of this research are
84
made regarding the role capacity planning plays in achieving an effective use of resources. Papers I and II contribute by studying the ‘why’ and ‘how’ of capacity planning. The study of ‘why’ is done by studying the problems achieving goals in production performance when bypassing planning activities in the hierarchical MPC planning system. The ‘how’ is contributed by providing a tactical capacity planning framework to guide in the process of tactically planning capacity. In Papers III and IV a theoretical contribution is made to the field of interpreting required capacity. Earlier proposed methods have been applied in case studies to interpret required capacity. These methods are RCCP methods and the estimation of manual work, concerning in this thesis surgery time. Paper III empirically tests forecasting future demand using RCCP methods. The results in Paper III provide increased understanding of the conditions under which RCCP methods can support the tactical capacity planning process. In the perspective of capacity planning, the use of RCCP methods, derived out of referrals, provides mangers with the ability to allocate capacity prior to the actual admission of patients and thus facilitating long-term capacity planning. The results in Paper III show that the use of incoming referrals can be combined with the RCCP methods given that certain conditions are fulfilled. The results in Paper IV show that a potential exists for improving the accuracy in required capacity when interpreting required capacity into required capacity. The studied improvement was made in the estimation accuracy of surgery time by utilising the knowledge and experience of people working in the system. In the analysis of Paper IV, the results of two estimation systems (manual estimation and calculated average value) were normalised to exclude potential systematic overestimation of surgery time, which would improve the time estimation for long cases. The results showed that the knowledge of the surgeons gave them the ability to identify patients requiring longer than normal surgery time. For long cases, the surgeons were able to estimate with more accuracy than when relying on an estimation system based on an average value.
Paper V makes a theoretical contribution to the assessment of available capacity by applying existing theoretical work methods to practice. The research contribution to assessing production system capacity is made through the study of the team-based work method. Conclusions drawn from the findings in Paper V are that the work method affects not only the production performance but also facilitates the process of balancing required and available capacity by organising resources into teams, without adding more resources.
7.2ConcludingremarksLet us return to the question of the manager in the introductory chapter who asked, "What computer system should be purchased in order to achieve better control of the growing surgery queues?" This question should rather address the planning and control process and activities when managing production. Changing the focus to the planning and control processes enables managers to better control the outcome of the production in a proactive way. A computer system can support the planning process but still requires expert knowledge from people familiar with the production system as well as information that is not visible in the quantitative data and computational algorithms. Planning processes also include making decisions which are not always possible to delegate to a computer system.
Focusing on the historical outcome of the production makes the management reactive when it faces the production as a stated fact. The use of a process where historical data

85
is combined with forecasts and the judgments of the managers provides a possibility to decide and control the production to a desired outcome. The hierarchical structure of planning processes also includes continuous feedback on production performance according to the stated plan which provides managers with the opportunity to adjust and re-plan if necessary. The outcome of the production is a result of how well the planning and control processes were performed and to what degree the assumptions of the planning were valid. As an example, the low availability studied in Paper I was related to the lack of long-term planning and an inability to adjust the production system according to required capacity. In this example, the long-term planning was not used to set the guidelines for what needed to be produced daily and weekly to provide required capacity. Instead the managers were studying the result of the production and had little knowledge of how they could make a long-term plan to achieve goals and how to use the planning process to adjust the use of capacity according to the plan.
To illustrate the need of proper capacity planning, picture a large freighter passing through a busy sea area where several freighters and other ships must coexist. In this situation, the freighter’s route planning and its need for information of changed circumstances becomes intuitive. It is not easy to change the direction of a large ship with heavy cargo or for it to come to a full stop. This type of vessel requires long-term planning if accidents are to be prevented. Navigating the freighter safely can be used as an analogy of managing healthcare organisations prudently. Lacking a structured capacity planning system, with its long-term and short-term planning, is like lacking the ability to increase or decrease speed in time or to make immediate alterations of course to avoid problematic situations. The intention of the knowledge presented in this thesis is to contribute to the ability of healthcare managers to use all planning levels to manage their organisations and to use the available capacity to find a navigable route towards stated goals.
Thus, the research performed with the purpose of contributing to the knowledge of healthcare capacity planning for effective use of resources is made by providing healthcare mangers with an understanding of the negative effects of not using all levels of the planning hierarchy either for capacity planning or for production planning (Paper I), and an outline of the structure and components for the tactical capacity planning process (Paper II). Two areas that can cause problematic situations, if people are misinformed of their properties, are the required capacity of the patients and the available capacity of the production system. These two amounts of capacity are central to the capacity planning processes and this thesis provides knowledge regarding the estimation of required capacity (Papers III and ÍV) and assessment of available capacity (Paper V).
7.3FurtherresearchThe findings of this thesis raise questions for further research which will be discussed in this section. In the Paper I, the linkage between planning processes and production performance was studied. What would have happened with the ability to deliver care according to set production goals for the department in Paper I if the planning processes were changed in the areas of the identified planning discrepancies? Would the proposed linkages be confirmed and show a causal connection or not? These questions and thorough study of the linkage between improved capacity planning and production performance are all potential topics for further research.
86
In this thesis, the focus has revolved a great deal around the tactical planning of healthcare delivery. In a hospital setting, the responsibility of tactical planning is placed on the department managers. Thus, the findings of the research have concerned the production performance of departments. Further research could profitably take a broader perspective of capacity planning, including many departments, or to study capacity planning over the borders of healthcare providers. Through the performed research, the challenges of capacity planning over borders – either of departments or healthcare providers – have been encountered. These challenges are relevant to address since patient pathways are not strictly limited to one department but do cross department borders and even the borders between healthcare providers. Further research could investigate if and how the framework presented in Paper II would be altered with a wider perspective, considering the planning of patient processes over department and provider boundaries.
The findings in Paper III, concerning the use of rough-cut capacity planning methods (RCCP), address the question of how to interpret patient demand in terms of required activities based on incoming referrals. A closely related aspect to forecasting the required activities in RCCP is the timing of the required activities. Knowing the timing would simplify long-term planning by providing the possibility of an adjustment with available capacity by time-shifting the provision of treatment. An area where the time aspects of the RCCP would simplify planning is where activities are coordinated between departments. This could, for example, occur when patients require the expertise of multiple medical specialties which are managed by different departments. Knowing the period and the amount of required capacity that is needed would simplify the long-term planning when coordinating resources from different managerial areas such as the departments. When the matching problems are identified in advance on tactical planning level, it leaves lead time long enough to take proactive action, and not lead to operational problems.
Paper III reports on an empirical test of the applicability of RCCP methods in healthcare, by testing the conditions for the use of these methods in two treatment processes (hip and knee prosthesis). Forecasting the activity requirements based on the patient demand provides managers with the opportunity to balance the supply and demand of resources in the tactical capacity planning process, given that certain conditions are fulfilled. The results provide insights into the ability to forecast required resources for activities downstream in the treatment process after receiving a referral.
A basic requirement for making use of the RCCP methods is that patient groups exhibit homogeneity in the resources used, which was the case for the studied patient groups. Decisions taken concerning treatment must be made in accordance with a standard treatment plan so that the required activities can be calculated from the forecasted number of referrals. If the decisions and the treatment process are not predictable, the effective use of RCCP methods in capacity planning is questionable. Production systems with long lead times makes it is hard to allocate resource requirements to a planning period. Therefore, to decrease lead time length and variability, the lead times between activities must be compressed and lead time control employed.
Paper IV examines the benefit of using the knowledge of the professional staff of the healthcare providers when capacity planning. This subject is most relevant when most healthcare resources consist of the knowledge and skills of staff. This study concerned the subjective knowledge of surgeons. Future research could study other areas where

87
the knowledge of the staff would make a difference in the validity of the capacity plans. Activities concerning dealing with underage youth is one area where the time requirements may differ. Using the knowledge of the staff, such as the nurses, could improve the estimation of the time required by certain activities, including preparation for surgery or radiology.
The team-based working method that was studied in a real setting showed an improvement in production performance while using the same amount of resources (Paper V). This finding adds to other research conducted within the emergency care provision, such as a study by Patel and Vinson (2005). Two questions remain. The first is whether this result may be applied in other situations within the healthcare provision and provide similar benefits. For example, an outpatient clinic could be studied to see what an application of team-based work method would lead to. Similar benefits? Other results? The second question involves the improved production performance that the study revealed. The overall throughput time remained relatively long and requires further investigation into how to improve patient flow even more through the department.

88

89
ReferencesAckerby, S., Johansson, N. & Sedigh, P. 2010. Framtidens utmaningar - välfärdens
långsiktiga finansiering. Stockholm.
Adan, I. & Vissers, J. 2002. Patient mix optimisation in hospital admission planning: a case study. International journal of operations and production management, 22, 445-461.
Almlöf, S., Lindström, E., Nilbert, M., Fernvall, E. & Tengvald, K. 2013. Ur led är tiden. Stockholm.
Apics 2005. APICS dictionary, Athens, GA, APICS The association for operations management.
Beliën, J. & Demeulemeester, E. 2007. Building cyclic master surgery schedules with leveled resulting bed occupancy. European Journal of Operational Research, 176, 1185-1204.
Bhat, S. 2008. A strategy for implementing the idea of cellular manufacturing in small-scale industries. Production planning and control, 19, 547-555.
Blackstone, J. H. 1989. Capacity Management, Cincinnati, Ohio, South-Western Publishing CO.
Blomqvist, P. 2007. Vem styr vården?, Stockholm, Författarna och SNS Förlag.
Bloom, J., Alexander, J. & Nuchols, B. 1997. Nurse staffing patterns and hospital efficiency in the United States. Social science & medicine, 44, 147-155.
Browne, J., Harhen, J. & Shivnan, J. 1996. Production management systems, Essex, England, Pearson Education Limited.
Bryman, A. & Bell, E. 2007. Business research methods, New York, Oxford University Press.
Butler, T., Karwan, K. & Sweigart, J. 1992. Multi-level strategic evaluation of hospital plans and decisions. J Oper Res Soc, 43, 665-675.
Butler, T., Leong, K. & Everett, L. 1996. The operations management role in hospital strategic planning Journal of Operations Management, 14, 137-156.
Cardoen, B., Demeulemeester, E. & Beliën, J. 2010. Operating room planning and scheduling: A literature review. European Journal of Operational Research, 201, 921-932.
Christensen, C., Grossman, J. & Hwang J. 2009. The innovator's prescripton - Disruptive solutionsfor healthcare. New York. McGraw-Hill
Combes, C., Meskens, N., Rivat, C. & Vandamme, J.-P. 2008. Using a KDD process to forecast the duration of surgery. International Journal of Production Economics, 112, 279-293.

90
Combes, S., Chapman, R. & Bushby, A. 2007. Evaluation of fast track. Accident and emergency nursing, 15, 40-47.
De Vries, G., Bertrand, J. & Vissers, J. 1999. Design requirements for healthcare production control systems. Production planning and control, 10, 559-569.
Dexter, F., Macario, A. & Ledolter, J. 2007. Identification of systematic underestimation (bias) of case durations during case scheduling would not markedly reduce overutilized operating room time. Journal of Clinical Anesthesia, 19, 198-203.
Dexter, F., Traub, R. D. & Qian, F. 1998. Comparison of statistical methods to predict the time to complete a series of surgical cases. Journal of Clinical Monitoring and Computing, 15, 45-51.
Doyle Jr, J.J., Ewer, S.M. and Wagner, T.H. (2010), Returns to physician human capital: Evidence from patients randomized to physician teams, Journal of Health Economics, Vol. 29 No. 6, pp. 866-882.
Ellram, L. M. 1996. The use of the case study method in logistics research Journal of Business Logistics, 17.
Etzioni, D., Liu, J., Maggard, M. & Ko, C. 2003. The ageing population and its impact on the surgery workforce. Annals of surgery, 238, 170-177.
Feng, Y., S., D. A. & Beauregard, R. 2008. The value of sales and operations planning in oriented strand board industry with make-to-order manufacturing system: Cross functional integration under deterministic demand and spot market resource. International Journal of Production Economics, 115, 189-209.
Fernandes, C. & Christenson, J. 1995. Use of continuous quality improvement to facilitate patient flow through the triage and fast-track areas of an emergency department. The journal of emergency medicine, 13, 847-855.
Fetter, R. & Freeman, J. 1986. Diagnostic related groups: product line management within hospitals. Academy of management review, 11, 41-54.
Fitzsimmons, J. & Fitzsimmons, A. 2006. Service Management, Boston, McGraw Hill.
Glouberman, S. & Mintzberg, H. 2001a. Manageing the care of health and the cure of disease - Part I: Differentiation. Healthcare management review, 26, 56-69.
Glouberman, S. & Mintzberg, H. 2001b. Manageing the care of health and the cure of disease - Part II: Integration. Healthcare Management Review, 26, 70-84.
Graves, S. C. 1985. A tactical planning model for a job shop. International journal of operations research, 34, 522-533.
Greene, T. J. & Sadowski, R. P. 1984. A review of cellular manufacturing assumptions, advantages and design techniques. Journal of operations management, 4, 85-97.

91
Grimson, A. & Pyke, D. 2007. Sales and operations planning: an exploratory study and framework. International journal of logistics management, 18, 322-346.
Gupta, D., Natarajan, M., Gafni, A., Wang, L., Shilton, D., Holder, D. & Yusuf, S. 2007. Capacity planning for cardiac catheterization: A case study. Health Policy, 82, 1-11.
Halldórsson, Á. & Aastrup, J. 2003. Quality criteria for qualitative inquiries in logistics. European Journal of Operational Research, 144, 321-332.
Hans, E. W., Van Houdenhoven, M. & Hulshof, P. J. H. 2011. A framework for healthcare planning and control. Memorandum 1938.
Hill, T., Nicholson, A. & Westbrook, R. 1999. Closing the gap: a polemic on plant-based research in operations management. International journal of operations and production management, 19, 139-156.
Jack, E. P. & Powers, T. L. 2004. Volume flexible strategies in health services: A research framework. Production and operations management, 13, 230-244.
Jack, E. P. & Powers, T. L. 2009. A review and synthesis of demand management, capacity management and performance in health-care services. International Journal of Management Reviews, 11, 149-174.
Jacobs, R., Whybark, C., Berry, W. & Vollmann, T. 2011. Manufacturing planning and control for supply chain management, McGraw-Hill.
Johnston, R. & Clark, G. 2001. Service operations management, Harlow, England, Prentice Hall.
Jonsson, P. & Mattsson, S.-A. 2003. The implications of fit between planning environment and manufacturing planning and control methods. International journal of operations and production management, 23, 872-900.
Jonsson, P. & Mattsson, S.-A. 2009. Manufacturing Planning and Control, Berkshire, McGraw-Hill Education.
Kristensen, J., 2018, Fit for purpose tactical production planning – A context-based view on sales and operations planning. PhD thesis, Aalborg University, Faculty of Engineering and Science. ISBN (online): 978-87-7210-254-2.
Kristensen, J. and Jonsson, P. (2018),” Context-based sales and operations planning (S&OP) research: A literature review and future agenda”, International Journal of Physical Distribution and Logistics Management, Vol. 48, No. 1, pp. 19-46.
Lapide, L. 2004. Sales and operations planning part I: the process. The journal of business forecasting, 23, 17-19.
Lapide, L. 2005b. Sales and operations planning Part III:a diagnostic model. The journal of business forecasting, 24, 13-16.

92
Lillrank, P., Groop P.J. & Malmström, T.J. 2010. Demand and Supply - based operating modes - a framework for analyzing healthcare service production. The Milbank Quarterly, 88 (4), 595-615.
Mattsson, S.-A. 2004. Logistikens termer och begrepp, Stockholm, PLAN Föreningen för Produktionslogistik.
Ministry-of-Finance. 2010. Budgetpropositionen för 2010. Available: http://www.regeringen.se/rattsdokument/proposition/2009/09/prop.-2009101/ [Accessed 15 May 2014].
O'brien, D., Williams, A., Blondell, K. & Jelinek, G. 2006. Impact of streaming "fast track" emergency department patients. Australian health review, 30, 525-532.
Oecd 2016. Health at a Glance: state of health in the EU cycle. In: LAFORTUNE, G. (ed.) 4th ed. Paris.
Olhager, J., Rudberg, M. & Wikner, J. 2001. Long-term capacity management: Linking the perspectives from manufacturing strategy and sales and operations planning. International Journal of Production Economics, 69, 215-225.
Olhager, J. & Wikner, J. 2000. Production planning and control tools. Production planning and control, 11, 210-222.
Patel, P. & Vinson, D. 2005. Team assignment system: expediting emergency department care. Annals of emergency medicine, 46, 499-506.
Patton, M. Q. 1999. Enhancing the quality and credibility of qualitative analysis. Health Services Research, 34, 1189-1208.
Proud, J. F. 1994. Master Scheduling, US, John Wiley and Sons.
Rae, D. 2005. Getting better value for money from Sweden's healthcare system. OECD Economics Department Working Papers. Paris: OECD Economics Department Working Papers.
Redelmeier, D., Thiruchelvam, D. & Daneman, N. 2008. Introducing a methodology for estimating duration of surgery in health services research. Journal of Clinical Epidemiology, 61, 882-889.
Region Skåne. 2013. Projekt Hälsostaden [Online]. Available: https://vardgivare.skane.se/siteassets/3.-kompetens-och-utveckling/projekt-och-utveckling/halsostaden/project-halsostaden-in-english.pdf [Accessed 2017-04-20 2017].
Region Skåne. 2016. Framtidens sjukvård [Online]. Available: [Accessed 2017]. https://www.skane.se/Halsa-och-vard/framtidens-sjukvard/
Rhyne, D. & Jupp, D. 1988. Healthcare requirements planning: A conceptual framework. Healthcare Management Review, 13, 17-27.

93
Ridge, J., Jones, S., Nielsen, M. & Shahani, A. 1998. Capacity planning for intesive care units. European Journal of Operational Research, 105, 346-355.
Roth, A. & Van Dierdonk, R. 1995. Hospital resource planning concepts, feasibility and framework. Production and operations management, 4, 2-29.
Sarker, B. R. & Xu, Y. 1998. Operation sequences-based cell formation methods: A critical survey. Production planning and control, 9, 771-783.
Sasser, E. W. 1976. Match supply and demand in service industries. Harvard Business Review, November-December, 133-140.
Schneeweiss, C. 1999. Hierarchies in Distributed Decision Making, Berlin Heidelberg New York, Springer-Verlag
Selçuk, B., Adan, I.J.B.F., de Kok, T.G. and Fransoo, J.C. (2009), An explicit analysis of the lead time syndrome: Stability condition and performance evaluation, International Journal of Production Research, Vol. 47 No. 9, pp. 2507-2529.
Shadish, W. R., Cook, T. D. & Campell, D. T. 2002. Experimental and Quasi-Experimental Designs for Generalized Causal Inference, Houghton Mifflin Company.
Shukla, R., Ketcham, J. & Ozcan, Y. 1990. Comparison of subjective versus data base approaches for improving efficiency of operating room scheduling. Health Services Management Research, 3, 74-81.
Silvester, K., Lendon, R., Bevan, H., Steyn, R. & Walley, P. 2004. Reducing waiting times at the NHS: Is lack of capacity the problem? Clinician in Management, 12, 105-111.
Skinner, W. 1974. The focused factory. Harvard Business Review, 52, 113-121.
Slack, N., Chambers, S., Harland, C., Harrison, A. & Johnston, R. 1998. Operations Management, London, Pitman.
Slack, N., Chambers, S. & Johnston, R. 2007. Operations Management, Harlow, England, Prentice Hall.
Smith- Daniels, V., Schweikhart, S. & Smith-Daniels, D. 1988. Capacity managament in healthcare services: Review and future research directions. Decisions Sciences, 19, 889-919.
Smith-Daniels, V., Schweikhart, S. & Smith-Daniels, D. 1988. Capacity management in healthcare services: Review and future research direction. Decisions Sciences, 19, 889-919.
Sokal, S. M., Craft, D. L., Chang, Y., Sandberg, W. S. & Berger, D. L. 2006. Maximizing operating room and recovery room capacity in an era of constrained resources. Arch Surg, 141, 389-93; discussion 393-395.

94
Stiernstedt, G., Ingmanson, A. & Johansson, N. 2016a. Våra förslag för en effektiv sjukvård. Dagens Medicin [Online]. Available: https://www.dagensmedicin.se/artiklar/2016/01/13/vara-forslag-for-en-mer-effektiv-sjukvard/ [Accessed 20160113].
Stiernstedt, G., Zetterberg, D. & Ingmanson, A. 2016b. Effektiv vård. Stockholm.
Strum, D. P., Sampson, A. R., May, J. H. & Vargas, L. G. 2000. Surgeon and type of anesthesia and predict variability in surgical procedure times. Anesthesiology, 92, 1454-1466.
Swedish Association of Local Authorities and Regions, 2017. Överrenskommelser mellan SKL och regeringen inom vård och omsorg [Online]. [Accessed 2017-01-27 2017].
Szelke, E. & Kerr, R. M. 1994. Knowledge-based reactive scheduling. Production planning and control, 5, 124-145.
Tai, G. & Williams, O. Product line management for healthcare system: Theoretic capacity planning over various resources. IEEM International Conference on Industrial Engineering and Engineering Management 8-11 Dec 2008 Singapore. 690-694.
Tavares Thomé, A., Scavarda, L., Fernandez, N. & Scavarda, A. 2012. Sales and operations planning: A research synthesis. International Journal of Production Economics, 138, 1-13.
The National Board of Health and Welfare, 2018a. Vårdgarantin [Online]. Available: https://www.socialstyrelsen.se/effektivitet/vardirimligtid/vardgarantin. [Accessed 2018-10-01]
The National Board of Health and Welfare, 2018b. Standardiserade vårdförlopp i cancervården [Online]. Available: https://www.socialstyrelsen.se/Lists/Artikelkatalog/Attachments/19926/2015-10-5.pdf. [Accessed 2018-10-23]
Towill, D. R. & Christopher, M. 2005. An evolutionary approach to the architecture of effective healthcare delivery systems. Journal of health organization and management, 19, 130-147.
Utley, M. & Worthington, D. 2012. Capacity Planning. In: HALL, R. (ed.) Handbook of healthcare system scheduling Springer.
Van Merode, G., Groothius, S. & Hasman, A. 2004. Enterprise resource planning for hospital. International journal of medical informatics, 73, 493-501.
Vissers, J. & Beech, R. 2008. Health Operations Managment: Patient flow logistics in healthcare, London, Routledge, Taylor and Francis Group.
Vissers, J., Bertrand, J. & De Vries, G. 2001. A framework for production control in healthcare organizations. Production planning and control, 12, 591-604.

95
Vollmann, T., Berry, W., Whybark, C. & Jacobs, R. 2005. Manufacturing planning and controlfor supply chain management, New York, McGraw Hill.
Voss, C., Tsikriktsis, N. & Frohlich, M. 2002. Case research in operation managment. International journal of operations and production management, 22, 195-219.
Walley, P. 2003. Designing the accident and emergency system. lessons from manufacturing. Emergency medicine journal, 20.
Walley, P. 2007. Manageing variation through system redesign. International journal of healthcare technology and management, 8, 589-602.
Wemmerlöv, U. & Hyer, N. 1987. Research issues in cellular manufacturing. International journal of production research, 25, 413-431.
White, D., Froehle, C. & Klassen, K. 2011. The effect of integrated scheduling and capacity policies on clinical efficiency. Production and operations management, 20, 442-455.
Wight, O. 1970. Input/output control - a real handle on lead time. Production & Inventory Management, 3rd quarter.
Wright, I., Kooperberg, C., Bonar, B. & Bashein, G. 1996. Statistical modeling to predict elective surgery. Anesthesiology, 85, 1235-45.
Yin, R. 2009. Case Study Research design and methods, Thousand Oaks, Sage Publications, Inc.
Zhou, J., Dexter, F., Macario, A. & Lubarsky, D. A. 1999. Relying solely on historical surgical times to estimate accurately future surgical times is unlikely to reduce the average length of time cases finish late. Journal of Clinical Anesthesia 11, 601-605.
Öhrming, J. 2008. Hälso- och sjukvårdens fragmentisering, Stockholm, Författaren och SNS Förlag.