cape agulhas municipality
TRANSCRIPT

2
CAPE AGULHAS
MUNICIPALITY
2017/2018
FINANCIAL
MANAGEMENT REPORT
FOR PERIOD ENDING
31 MAY 2018

3
TABLE OF CONTENTS 1. Council Resolution…………………………………………………………………….. 4
2. Introduction…………………………………..……………………………………….… 5
3. Mayor’s Report ………………………………………………………………………… 6
4. Executive Summary………………………………………………………………..……8
5. Financial focus areas …………………………………………………………………..9
6. In-Year Budget Statement Tables………………..……………………………….....11
7. Supporting tables………………………………………………………….……….......22
8. Other information……………………………………………………………………….26
9. Quality certificate……………………………………………………………………….27

4
1. Council Resolution
To The Executive Mayor
In accordance with Section 71(1) of the Municipal Finance Management
Act, I submit the required statement on the state of Cape Agulhas
Municipality’s budget implementation and the financial state of the
municipality’s affairs reflecting the particulars up until the end of April 2017.
Section 54(1) of the MFMA requires the Mayor of a municipality to take
certain actions on the receipt of this report to ensure that the approved
budget is implemented in accordance with the projections contained in the
Service Delivery and Budget Implementation Plan.
Recommendations
The content of the report and supporting documentation for period
ending 31 May 2018 is noted.
It be noted that the directors ensure that the budget is implemented in
accordance with the Service Delivery and Budget Implementation Plan
projections and in accordance with the approved budget;
It be noted that any material variances will receive remedial or corrective
steps.

5
2. INTRODUCTION
2.1 PURPOSE
The purpose of this report is to comply with section 71 of the MFMA and the
requirements as promulgated in Government Gazette No 32141 of 17 April
2009 (Municipal budgeting and reporting requirements).
2.2 STRATEGIC OBJECTIVE
“To comply with MFMA priorities as well as MFMA implementation plan”
2.3 BACKGROUND
Section 71 of the MFMA and Section 28 of Government Notice 32141 dated
17 April 2009, regarding the “Local Government: Municipal Finance
Management Act 2003 Municipal Budget and Reporting Regulations”
necessitate that specific financial particulars be reported on and in the
format prescribed, hence this report to meet legislative compliance.
“Section 52(d) of the MFMA states that, the executive mayor of a
municipality must within 30 days of the end of each quarter submit a report to
the council on the implementation of the budget and the financial state of
affairs of the municipality.
However section 71 of the MFMA states that, the accounting officer of a
municipality must by no later than 10 working days after the end of each
month submit to the mayor of the municipality and the relevant treasury a
statement in the prescribed format on the implementation of the
municipality’s approved budget”.
“Section 28 of the Government Notice 32141, the monthly budget statement
of a municipality must be in the format specified in Schedule C and include
all required tables, charts and explanatory information, taking into account
any guidelines issued by the Minister in terms of section 168(1) of the Act”.
Section 54 of the MFMA requires the Mayor to consider the Section 71 report
and take appropriate action to ensure that the approved budget is
implemented in accordance with the SDBIP.

6
3. MAYOR’S REPORT
The Budget and Reporting regulations become effective during April 2009
and the municipality is obliged to report in the prescribed format to National
& Provincial Treasury, the Executive Mayor and council accordingly.
Although the Cape Agulhas Municipality is fully compliant in respect of the
monthly budget report to council, effective from March 2014, the quality of
the report in terms of its completeness and usefulness for council decision
making still needs improvement which will be addressed as an ongoing
process.
3.1 Budget Process:
Section 53(1)(a)of the MFMA stipulates that the Executive Mayor of the
Municipality must provide general political guidance over the budget
process and the priorities that must guide the preparation of a budget.
The flowchart on the budget process basically reflecting three different
processes in the budget cycle at the same time, namely:
o Reporting on the previous year budget;
o Current year budget implementation; and
o Preparation of the new financial year’s budget (including the budget
estimates for the two outer financial years)
The municipal planning and budget cycle processes consist of the following:

7
Budget planning process 2018/2019
The municipality in the process of compiling the budget process plan for
submission to Council as per the MFMA legislation. Budget timetable follows
the below mentioned timeframes and activities:
The proposed process plan with the compilation of the Final Budget 2018/19 is
as follows:
3.2 Monthly Reporting:
Monthly financial reporting as per DoRA and MFMA requirements to Council,
National & Provincial Departments and other stakeholders have been
adequately adhered to for the month under review.

8
3.3 Financial Statements for the Year-ended 30 June 2017
The auditing of the annual Financial Statements was concluded in November
2017. The municipality received a 4th consecutive “Clean Audit”.
4. Executive Summary
With a month left into the finalization of the financial year the municipal
budget is at the “business end” cycle of completion. Performance for
revenue budget totals R274,499m and expenditures totals R251,715m.
These totals represents 90.1% for revenues and 78.5% for operational
expenditures.
Capital expenditure for the period ending 31 May totals 71.3% of revised
budget amounts. Spending is below projections and a revised report will be
tabled to Council addressing the underperformance.
More details further in the report.

9
5. Council focus areas.
As part of the oversight responsibility of Council the municipal administration is
required to table a report to council with recommendations for managing
the municipal ratios in terms of Circular 71 financial ratios.
The financial ratios cover the following areas:
Financial position:
Asset Management
Debtors management
Liquidity management
Liability management
Sustainability
Financial performance:
Efficiency
Distribution losses
Revenue management
Expenditure management
Grant dependency
Budget implementation:
Council identified the following ratios as main focus areas and these ratios will
be monitored on a monthly basis and action plans developed to ensure the
achievement of council’s sustainability objectives.
Liquidity management:
Financial ratios
National
norm
’30 June
2017
Reporting
month Cash / Cost coverage ratio (Excluding unspent
conditional grants)
1-3 months
1 month
1,4 month
Current Ratio: Current assets / Current liabilities
1.5 – 2.1
1.27
2.06
Quick asset ratio: Monetary assets / Current liabilities 1 – 3 0.92
Cash management / Capital replacement reserve (CRR):
Financial ratios
National
norm
’30 June
2017
Reporting
month
Cash balance in the bank (actual / bank statement)
Positive
balance
R24,345m
R43,5m
Capital replacement reserve (CRR) Funded R20,000m R20,0m
10
More information / Details
The Long-term financial plan is in the process of being implemented and
monitored. Project champion was identified as the Manager Revenue within
the finance department. This was identified to enable the streamlining of
activities and ensuring that the benefits of these activities impact the
financial revenue position and capacity of the municipality.
Liquidity – the ratio deteriorate slightly from the previous month of 2.08 to 2.06
for the reporting month. This is within the requirements of national norms. The
challenge of this ratio is the impact of inventory items on the calculation. The
declining effect recorded should also be of concern to the municipality.
Quick asset ratio calculates the ability of the municipality to cover short-term
obligations only taking into considering the cash position and short-term
investments. For the month of May 2018 the ratio calculates at 0,92. The ratio
deteriorate from the previous month of 1.26. This in effect mean that the
municipality for the reporting month will not be able to cover short-term
liabilities when due. This reflect a serious matter and actions needs to be
implemented to address the ratios.
In order to improve this ratio the municipality will needs to focus on cash flow
management and this should be communicated to all relevant managers.
The debt collection ratio recorded of 94% also means that limited leeway is
available to increases revenues from debt collection. Improvements in cash
can only be an achieved by an increase in revenues or a decrease of
expenditures. This will result in increases in cash available.
Strategies needs to be developed to address the above in a more serious
manner resulting in actual improvements.
Cash management / CRR – The municipal bank balance totals R43,5m for the
month ending 31 May 2018. This is a slight improvement from the previous
month. In order to ensure a funded CRR, administration is continuously
monitoring the cash position of the municipality.
The analysis of major cost items to ensure optimal use of resources needs to
be implemented. The implementation of the revenue enhancement project
also will contribute significantly to the improvement of the liquidity position of
the municipality over the short-term as well as sustainability over the long-
term.

11
6. In year Budget Statement Tables
WC033 Cape Agulhas - Table C1 Monthly Budget Statement Summary - M11 May2016/17
Audited
Outcome
Original
Budget
Adjusted
Budget
Monthly
actual
YearTD
actual
YearTD
budget
YTD
variance
YTD
variance
Full Year
Forecast
R thousands %
Financial Performance
Property rates – 60,143 60,143 2,756 58,116 57,410 706 1% 60,143
Service charges – 152,857 152,857 12,076 142,956 142,121 835 1% 152,857
Investment revenue – 2,060 2,060 474 2,354 1,944 411 21% 2,060
Transfers and subsidies – 55,134 64,365 6,715 53,341 61,931 (8,589) -14% 64,365
Other own revenue – 23,571 25,181 2,053 17,731 20,726 (2,995) -14% 25,181
Total Revenue (excluding capital
transfers and contributions)
– 293,765 304,606 24,073 274,499 284,132 (9,633) -3% 304,606
Employee costs – 117,179 117,028 8,636 101,946 106,718 (4,772) -4% 117,028
Remuneration of Councillors – 5,145 5,145 419 4,945 4,698 247 5% 5,145
Depreciation & asset impairment – 11,440 11,440 – 6,144 9,533 (3,389) -36% 11,440
Finance charges – 8,964 9,007 40 3,593 7,527 (3,934) -52% 9,007
Materials and bulk purchases – 115,928 126,787 18,308 101,034 116,625 (15,591) -13% 126,787
Transfers and subsidies – 2,763 2,763 153 2,021 2,453 (432) -18% 2,763
Other expenditure – 47,503 48,295 2,733 32,032 44,537 (12,505) -28% 48,295
Total Expenditure – 308,922 320,464 30,289 251,715 292,092 (40,377) -14% 320,464
Surplus/(Deficit) – (15,157) (15,859) (6,216) 22,784 (7,960) 30,745 -386% (15,859)
Transfers and subsidies - capital (monetary allocations) (National / Prov incial and District)– 12,969 12,938 1,656 10,811 9,688 1,123 12% 12,938
Contributions & Contributed assets – – – – – – – –
Surplus/(Deficit) after capital
transfers & contributions
– (2,187) (2,921) (4,560) 33,596 1,728 31,868 1844% (2,921)
Share of surplus/ (deficit) of
associate – – – – – – – –
Surplus/ (Deficit) for the year – (2,187) (2,921) (4,560) 33,596 1,728 31,868 1844% (2,921)
Capital expenditure & funds sources
Capital expenditure – 27,665 27,460 1,303 19,582 21,696 (2,113) -10% 27,460
Capital transfers recognised – 12,969 12,938 778 11,790 10,876 914 8% 12,938
Public contributions & donations – – – – – – – –
Borrowing – 5,661 5,473 – 3,927 3,990 (62) -2% 5,473
Internally generated funds – 9,034 9,049 524 3,865 6,829 (2,964) -43% 9,049
Total sources of capital funds – 27,665 27,460 1,303 19,582 21,696 (2,113) -10% 27,460
Financial position
Total current assets 62,317 44,041 48,602 78,131 48,602
Total non current assets 415,891 432,259 431,880 429,359 431,880
Total current liabilities 48,899 37,817 44,194 37,901 44,194
Total non current liabilities 119,252 135,593 129,151 125,992 129,151
Community wealth/Equity 310,058 302,890 307,137 343,597 307,137
Cash flows
Net cash from (used) operating – 13,909 11,790 18,318 37,057 44,423 7,367 17% 11,790
Net cash from (used) investing – (27,137) (25,729) (1,303) (19,580) (22,110) (2,530) 11% (25,729)
Net cash from (used) financing – 3,609 4,096 2 1,429 5,525 4,096 74% 4,096
Cash/cash equivalents at the month/year end – 6,415 14,519 – 43,267 52,200 8,933 17% 14,519
Debtors & creditors analysis0-30
Days
31-60
Days
61-90
Days
91-120
Days
121-150
Dys
151-180
Dys
181 Dys-1
YrOver 1Yr Total
Debtors Age Analysis
Total By Income Source 36,031 – – – – – – – 36,031
Creditors Age Analysis
Total Creditors 9,515 – – – – – – – 9,515
Description
Budget Year 2017/18
12
The table provides a high level summary of council’s financial performance –
operating & capital, financial position, cash flows, debtors and creditors age
analysis which reflecting in more detail as from table C2 onwards.
EXPLANATIONS:
REVENUES
Property rates:
The performance for property rates totals 97% of total budget. This is in line
with projected amounts to date and the municipality should achieved the
projections as per tabled budget.
Service revenues (water / electricity /sanitation /refuse):
Revenues from services totals 94% of budgeted amounts. Although this is on
par with revised budgeted information the performance is screwed and
influenced by over performance of individual items. Finance needs to ensure
that the information is scrutinized individually to ensure targets is achieved as
per planned processes. More details provide below with Table C4.
Transfers and subsidies:
Transfers and subsidies reflect the allocations from National and Provincial
government. The municipality recognized a liability when the conditional
grant is received and the revenue is only recognized as and when
expenditures is incurred. To date all grants as per DORA’s has been received
and none is outstanding.
Performance total 83% of revised budgeted. Projections is that all municipal
grants will be recognized by 30 June.
Other own revenues:
Performance to date reflects at 78% of budgeted amounts. Most of the items
recorded under this category represents income from the resorts, traffic
department as well as town planning and building plan application fees to
name a few. In future reporting periods more detail information in terms of
individual items will be provided for clarification purposes.

13
EXPENDITURES
Employee related costs:
The employee related cost of May 2018 totals R101,946m of revised budget
amounts. Numerous vacancies budgeted at the start of the financial year,
was not filled to date. This will result in a savings on the employee related cost
ending June 2018.
Remuneration of Councilors:
Projections for council remuneration is on par with revised budget. Totals of
R4,945m recorded at the end of May 2018 reported.
Depreciation and asset impairment:
With the implementation of the new asset management system still
outstanding the municipality is experiencing challenges with accounting for
depreciation and asset impairment. Journal entries was processed to ensure
updated information is available, but due to the implementation being in an
advance stage of completion, a decision was taken to withhold the journals
to enable electronic processing of transactions.
This is however impacting the operational expenditures recorded to date of
Council and as soon as implemented should improve the total expenditures.
This will be conclude before the end of the financial year. The positive spin-off
is that these expenditures is not actual cash transactions impacting the
liquidity of the municipality.
Finance charges:
Budgeted allocation recorded against this category consist of the finance
charges in terms of loan repayments, as well as the finance component of
the post-retirement benefits (employees) as well as the landfill site restoration
cost (capital). There are non-cash items of the municipal budgeted
expenditures.
Materials and bulk purchases:
Bulk purchases recorded expenditures totals 78.5% of budget. This is mainly
the purchases of bulk electricity and a limited actual expenditures on water
purchases. There is a direct correlation between the budget for bulk
electricity and sale of electricity revenues. The municipality is projecting
better that budgeted performance for the electricity revenues. This will
correlate with the performance of bulk purchases at the end of the financial
year.

14
Transfers and expenditures:
Transfer expenditures relates to the allocation the municipality make towards
outside organization. The municipal budget for this category of expenditures
totals R2,763m with a spending of R2,021m to date.
Other expenses:
Other operational expenditures records at 60.7% of budgeted amounts.
These category corresponds to the non-prioritized spending of council.
Numerous cost saving measurements are being implemented to ensure that
the municipality can ensure decreasing trends for these cost items and
expenditures.
Debtor’s age analysis
The outstanding debtors for the period ending 31 May 2018 totals R36,031m.
This is a slight improvement of the information reported for April.
The municipality is in the process of implementing the revised Credit control
and debt collection policy. The implementation of the policy will significantly
improve the collection of outstanding debts and also impact on the liquidity
ratios of the municipality.
Current debt collecting levels of 94% reported for the period ending May
2018.
Creditor’s age analysis
The municipality pay creditors within 30 days of received of invoice. Creditors
outstanding reflect work in progress as well as liability not finalized due to
administrative procedures, for example outstanding items on the order or
queries between the municipality and the suppliers.
Totals recorded for the period ending May 2018 totals R9,515m.

15
2016/17 Budget Year 2017/18
Audited
Outcome
Original
Budget
Adjusted
Budget
Monthly
actual
YearTD
actual
YearTD
budget
YTD
variance
YTD
variance
Full Year
Forecast
R thousands 1 %
Revenue - Functional
Governance and administration – 105,419 107,369 12,220 100,191 98,602 1,589 2% 107,369
Executive and council – 25,190 25,190 6,297 25,190 24,466 724 3% 25,190
Finance and administration – 80,229 82,179 5,923 75,001 74,137 864 1% 82,179
Internal audit – – – – – – – –
Community and public safety – 34,571 42,571 581 34,553 40,713 (6,159) -15% 42,571
Community and social services – 7,023 6,023 433 4,951 5,514 (563) -10% 6,023
Sport and recreation – 7,098 7,098 148 7,206 6,560 646 10% 7,098
Public safety – – – – – – – –
Housing – 20,450 29,450 – 22,396 28,638 (6,242) -22% 29,450
Health – – – – – – – –
Economic and environmental services – 12,731 13,140 701 6,765 11,133 (4,368) -39% 13,140
Planning and development – 874 1,283 108 1,534 1,184 350 30% 1,283
Road transport – 11,857 11,857 593 5,232 9,949 (4,718) -47% 11,857
Environmental protection – – – – – – – –
Trading services – 154,014 154,464 12,227 143,801 143,372 429 0% 154,464
Energy sources – 104,438 104,438 8,515 96,829 96,882 (53) 0% 104,438
Water management – 24,344 24,544 1,606 21,438 22,573 (1,135) -5% 24,544
Waste water management – 9,508 9,508 791 9,919 8,989 930 10% 9,508
Waste management – 15,723 15,973 1,316 15,614 14,928 687 5% 15,973
Other 4 – – – – – – – –
Total Revenue - Functional 2 – 306,734 317,544 25,729 285,310 293,820 (8,510) -3% 317,544
Expenditure - Functional
Governance and administration – 89,598 90,842 5,419 69,748 82,629 (12,881) -16% 90,842
Executive and council – 14,383 14,448 843 12,259 13,196 (937) -7% 14,448
Finance and administration – 73,628 74,800 4,491 56,347 67,937 (11,589) -17% 74,800
Internal audit – 1,587 1,594 85 1,142 1,497 (355) -24% 1,594
Community and public safety – 45,318 53,448 12,875 47,216 50,009 (2,793) -6% 53,448
Community and social services – 12,217 11,337 897 8,774 10,245 (1,470) -14% 11,337
Sport and recreation – 10,956 10,958 782 9,823 9,949 (127) -1% 10,958
Public safety – – – – – – – –
Housing – 22,145 31,152 11,196 28,619 29,815 (1,196) -4% 31,152
Health – – – – – – – –
Economic and environmental services – 39,708 40,113 2,472 32,581 36,176 (3,594) -10% 40,113
Planning and development – 8,908 8,944 726 7,408 8,244 (835) -10% 8,944
Road transport – 30,800 31,169 1,746 25,173 27,932 (2,759) -10% 31,169
Environmental protection – – – – – – – –
Trading services – 134,297 136,062 9,523 102,169 123,278 (21,109) -17% 136,062
Energy sources – 88,085 88,063 6,866 67,691 80,646 (12,955) -16% 88,063
Water management – 16,834 18,182 1,343 15,291 16,148 (857) -5% 18,182
Waste water management – 10,311 10,497 595 8,516 9,263 (747) -8% 10,497
Waste management – 19,067 19,319 719 10,671 17,222 (6,551) -38% 19,319
Other – – – – – – – –
Total Expenditure - Functional 3 – 308,922 320,464 30,289 251,715 292,092 (40,377) -14% 320,464
Surplus/ (Deficit) for the year – (2,187) (2,921) (4,560) 33,596 1,728 31,868 1844% (2,921)
WC033 Cape Agulhas - Table C2 Monthly Budget Statement - Financial Performance (functional
classification) - M11 May
Description Ref

16
Explanation for any deviation in excess of 10% will be provided as part of an
ongoing process to ensure that information is relevant and useful for council’s
decision making. (Table SC 1 have reference)
Vote Description 2016/17
Audited
Outcome
Original
Budget
Adjusted
Budget
Monthly
actual
YearTD
actual
YearTD
budget
YTD
variance
YTD
variance
Full Year
Forecast
R thousands %
Revenue by Vote 1
Vote 1 - Executive and Council – 28,496 27,796 7,072 27,733 26,879 853 3.2% 27,796
Vote 2 - Financial Services & ICT – 66,723 68,373 3,656 63,889 63,141 747 1.2% 68,373
Vote 3 - Corporate Services – – – – – – – –
Vote 4 - Management Services – 45,214 54,214 1,166 39,767 50,469 (10,702) -21.2% 54,214
Vote 5 - Engineering Services – 166,301 167,161 13,835 153,923 153,331 592 0.4% 167,161
Total Revenue by Vote 2 – 306,734 317,544 25,729 285,312 293,820 (8,508) -2.9% 317,544
Expenditure by Vote 1
Vote 1 - Executive and Council – 41,823 41,562 3,586 33,956 38,228 (4,272) -11.2% 41,562
Vote 2 - Financial Services & ICT – 47,136 47,669 2,474 35,180 42,898 (7,718) -18.0% 47,669
Vote 3 - Corporate Services – – – (1,086) 345 – 345 #DIV/0! –
Vote 4 - Management Services – 63,866 73,347 14,046 63,984 68,025 (4,042) -5.9% 73,347
Vote 5 - Engineering Services – 156,097 157,886 11,269 118,251 142,940 (24,690) -17.3% 157,886
Total Expenditure by Vote 2 – 308,922 320,464 30,289 251,716 292,092 (40,376) -13.8% 320,464
Surplus/ (Deficit) for the year 2 – (2,187) (2,921) (4,560) 33,596 1,728 31,868 1844.4% (2,921)
WC033 Cape Agulhas - Table C3 Monthly Budget Statement - Financial Performance (revenue and
expenditure by municipal vote) - M11 May
Ref
Budget Year 2017/18
Explanation for any deviation in excess of 10% will be provided as part of an
ongoing process to ensure that information is relevant and useful for council’s
decision making.
Section 71(1)(g) of the MFMA requires that the Accounting Officer must,
when necessary, provide explanation of –
Any material variances from the municipality’s projected revenue by
source, and from the municipality’s expenditure projections per vote;
Any material variances from the service delivery and budget
implementation plan; and
Any remedial or corrective steps taken or to be taken to ensure that
the projected revenue and expenditure remain within the
municipality’s approved budget.

17
2016/17
Audited
Outcome
Original
Budget
Adjusted
Budget
Monthly
actual
YearTD
actual
YearTD
budget
YTD
variance
YTD
variance
Full Year
Forecast
R thousands %
Revenue By Source
Property rates 60,143 60,143 2,756 58,116 57,410 706 1% 60,143
Service charges - electricity revenue 103,306 103,306 8,363 96,005 96,030 (25) 0% 103,306
Service charges - water revenue 24,342 24,342 1,606 21,418 22,400 (982) -4% 24,342
Service charges - sanitation revenue 9,486 9,486 791 9,919 8,972 947 11% 9,486
Service charges - refuse revenue 15,723 15,723 1,316 15,614 14,719 895 6% 15,723
Service charges - other – – – – – – –
Rental of facilities and equipment 2,056 2,056 758 2,216 1,934 282 15% 2,056
Interest earned - external investments 2,060 2,060 474 2,354 1,944 411 21% 2,060
Interest earned - outstanding debtors 1,496 1,496 132 1,108 1,316 (208) -16% 1,496
Dividends received – – – – – – –
Fines, penalties and forfeits 9,271 9,271 169 2,169 7,594 (5,425) -71% 9,271
Licences and permits 61 61 0 54 59 (4) -7% 61
Agency services 2,419 2,419 436 2,836 2,184 653 30% 2,419
T ransfers and subsidies 55,134 64,365 6,715 53,341 61,931 (8,589) -14% 64,365
Other revenue 7,769 8,179 559 9,348 7,640 1,709 22% 8,179
Gains on disposal of PPE 500 1,700 – – – – 1,700
Total Revenue (excluding capital
transfers and contributions)
– 293,765 304,606 24,073 274,499 284,132 (9,633) -3% 304,606
Expenditure By Type
Employee related costs 117,179 117,028 8,636 101,946 106,718 (4,772) -4% 117,028
Remuneration of councillors 5,145 5,145 419 4,945 4,698 247 5% 5,145
Debt impairment 7,833 7,833 – 5,875 6,528 (653) -10% 7,833
Depreciation & asset impairment 11,440 11,440 – 6,144 9,533 (3,389) -36% 11,440
Finance charges 8,964 9,007 40 3,593 7,527 (3,934) -52% 9,007
Bulk purchases 76,678 76,798 6,157 58,811 70,696 (11,884) -17% 76,798
Other materials 39,250 49,989 12,152 42,223 45,930 (3,707) -8% 49,989
Contracted services 18,208 18,483 574 8,237 18,334 (10,097) -55% 18,483
T ransfers and subsidies 2,763 2,763 153 2,021 2,453 (432) -18% 2,763
Other expenditure 21,461 21,979 2,159 17,920 19,675 (1,755) -9% 21,979
Loss on disposal of PPE – – – – – – –
Total Expenditure – 308,922 320,464 30,289 251,715 292,092 (40,377) -14% 320,464
Surplus/(Deficit) – (15,157) (15,859) (6,216) 22,784 (7,960) 30,745 (0) (15,859) Transfers and subsidies - capital (monetary
allocations) (National / Provincial and District) 12,969 12,938 1,656 10,811 9,688 1,123 0 12,938
Transfers and subsidies - capital (in-kind - all) – – – – – – –
Surplus/(Deficit) after capital transfers
& contributions
– (2,187) (2,921) (4,560) 33,596 1,728 (2,921)
Taxation – – – – – – –
Surplus/(Deficit) after taxation – (2,187) (2,921) (4,560) 33,596 1,728 (2,921)
Attributable to minorities – – – – – –
Surplus/(Deficit) attributable to
municipality
– (2,187) (2,921) (4,560) 33,596 1,728 (2,921)
Share of surplus/ (deficit) of associate – – – – – –
Surplus/ (Deficit) for the year – (2,187) (2,921) (4,560) 33,596 1,728 (2,921)
WC033 Cape Agulhas - Table C4 Monthly Budget Statement - Financial Performance (revenue and expenditure) -
M11 May
Description Ref
Budget Year 2017/18
Explanation for any deviation in excess of 10% will be provided as part of an
ongoing process to ensure that information is relevant and useful for council’s
decision making. (Table SC 1 have reference)

18
SERVICE REVENUES:
Service charges: Electricity
Performance for revenue totals R96,005m of a budget of R103,306m. This record a
performance of 93% for period ending May 2018. The municipality is entering the
winter period, where traditionally due to the weather conditions an increase in
electricity usage is expected. These factors will contribute to achievement of the
targets as projected.
Service charges: Water
Water revenue records at 88% for the period ending 31 May 2018. This is also the
poorest performing service for the main service revenue categories. Various factors
contributes towards this, especially the water crises and restrictions. Projections
therefore indicate that the municipality will not achieve the budget at year-end. A
downward review will therefore be done. Service revenue for the period totals
R21,418m.
Service charges: Sanitation
The budget for sanitation reflects an over performance of 104%. This is mainly due to
a more cost reflective tariff for the septic tanks that was introduced in the financial
year. The budget was conservatively estimate and this contributes to the better than
improved performance.
Service charges: Refuse
Refuse year to date totals R15,614m of a budget of R15,723m. The category of
revenue is on par with performance and all indications that budget targets will be
achieved.

19
2016/17 Budget Year 2017/18
Audited
Outcome
Original
Budget
Adjusted
Budget
Monthly
actual
YearTD
actual
YearTD
budget
YTD
variance
YTD
variance
Full Year
Forecast
R thousands 1 %
Multi-Year expenditure appropriation 2
Vote 4 - Management Services – 650 650 16 106 466 (359) -77% 650
Vote 5 - Engineering Services – 650 650 252 482 463 19 4% 650
Total Capital Multi-year expenditure 4,7 – 1,300 1,300 269 589 929 (340) -37% 1,300
Single Year expenditure appropriation 2
Vote 1 - Executive and Council – 855 346 3 193 291 (98) -34% 346
Vote 2 - Financial Services & ICT – 2,505 2,409 – 2,187 1,896 291 15% 2,409
Vote 4 - Management Services – 2,964 2,477 308 1,321 2,005 (684) -34% 2,477
Vote 5 - Engineering Services – 20,042 20,928 723 15,293 16,575 (1,282) -8% 20,928
Total Capital single-year expenditure 4 – 26,365 26,160 1,034 18,994 20,767 (1,773) -9% 26,160
Total Capital Expenditure – 27,665 27,460 1,303 19,582 21,696 (2,113) -10% 27,460
Capital Expenditure - Functional Classification
Governance and administration – 2,962 2,871 5 2,482 2,301 181 8% 2,871
Executive and council 254 254 3 153 223 (69) -31% 254
Finance and administration 2,708 2,616 2 2,329 2,078 251 12% 2,616
Community and public safety – 3,164 2,637 323 1,111 2,040 (929) -46% 2,637
Community and social services 303 390 150 178 280 (102) -36% 390
Sport and recreation 2,861 2,247 172 933 1,759 (826) -47% 2,247
Economic and environmental services – 12,859 13,000 754 10,209 10,751 (541) -5% 13,000
Planning and development 539 27 – 18 19 (1) -5% 27
Road transport 12,320 12,974 754 10,191 10,732 (541) -5% 12,974
Trading services – 8,680 8,952 221 5,780 6,605 (825) -12% 8,952
Energy sources 2,548 2,548 82 1,992 1,948 44 2% 2,548
Water management 3,255 3,255 139 1,086 2,369 (1,284) -54% 3,255
Waste water management 877 877 – 781 703 78 11% 877
Waste management 2,000 2,272 – 1,922 1,585 337 21% 2,272
Total Capital Expenditure - Functional Classification3 – 27,665 27,460 1,303 19,582 21,696 (2,113) -10% 27,460
Funded by:
National Government 12,108 11,990 660 11,413 10,146 1,267 12% 11,990
Provincial Government 862 949 118 377 731 (354) -48% 949
Transfers recognised - capital – 12,969 12,938 778 11,790 10,876 914 8% 12,938
Public contributions & donations 5 – – – – – – –
Borrowing 6 5,661 5,473 – 3,927 3,990 (62) -2% 5,473
Internally generated funds 9,034 9,049 524 3,865 6,829 (2,964) -43% 9,049
Total Capital Funding – 27,665 27,460 1,303 19,582 21,696 (2,113) -10% 27,460
WC033 Cape Agulhas - Table C5 Monthly Budget Statement - Capital Expenditure (municipal vote, functional
classification and funding) - M11 May
Vote Description Ref
Comments:
Performance of capital expenditures is below par and reflects at 71.3% for
budget. The municipality is currently risking an under-performance on the
capital budget spending. Improved planning processes needs to be
implemented to ensure turn-around of the current status quo. The
departments contributing to these under-performance in terms of capital
spending is as follows:
Beaches and resorts (16%), Information systems (53%), Parks and sport facilities
(40%) and Water (33%). Capital commitments outstanding for the period
ending May 2018 totals R2,371m. Included these amounts in the expenditures
will improve performance closer to 80%.

20
2016/17 Budget Year 2017/18
Audited
Outcome
Original
Budget
Adjusted
Budget
YearTD
actual
Full Year
Forecast
R thousands 1
ASSETS
Current assets
Cash 24,361 6,415 14,519 43,267 14,519
Call investment deposits – – – – –
Consumer debtors 22,028 28,019 27,691 36,031 27,691
Other debtors 14,571 8,102 5,034 (2,671) 5,034
Current portion of long-term receivables 31 27 31 – 31
Inventory 1,326 1,478 1,326 1,504 1,326
Total current assets 62,317 44,041 48,602 78,131 48,602
Non current assets
Long-term receivables 196 173 165 225 165
Investments – – – – –
Investment property 40,870 40,232 40,862 40,864 40,862
Investments in Associate – – – – –
Property, plant and equipment 371,253 390,091 386,389 383,178 386,389
Agricultural – – – –
Biological assets – – – –
Intangible assets 3,572 1,763 4,464 5,092 4,464
Other non-current assets – – – –
Total non current assets 415,891 432,259 431,880 429,359 431,880
TOTAL ASSETS 478,209 476,300 480,482 507,489 480,482
LIABILITIES
Current liabilities
Bank overdraft – – – – –
Borrowing 684 2,310 1,659 737 1,659
Consumer deposits 4,291 4,377 4,548 4,486 4,548
Trade and other payables 33,141 15,334 26,557 24,234 26,557
Provisions 10,783 15,796 11,430 8,444 11,430
Total current liabilities 48,899 37,817 44,194 37,901 44,194
Non current liabilities
Borrowing 2,012 6,651 4,876 3,730 4,876
Provisions 117,240 128,942 124,274 122,262 124,274
Total non current liabilities 119,252 135,593 129,151 125,992 129,151
TOTAL LIABILITIES 168,151 173,410 173,345 163,892 173,345
NET ASSETS 2 310,058 302,890 307,137 343,597 307,137
COMMUNITY WEALTH/EQUITY
Accumulated Surplus/(Deficit) 290,058 287,890 287,137 323,597 287,137
Reserves 20,000 15,000 20,000 20,000 20,000
TOTAL COMMUNITY WEALTH/EQUITY 2 310,058 302,890 307,137 343,597 307,137
WC033 Cape Agulhas - Table C6 Monthly Budget Statement - Financial Position -
M11 May
Description Ref
With the implementation of the new financial systems the administration is
experiencing various small challenges related to extracting information from
the system. These challenges will be finalized within the next reporting cycle
and improved information submitted for discussions.

21
2016/17 Budget Year 2017/18
Audited
Outcome
Original
Budget
Adjusted
Budget
Monthly
actual
YearTD
actual
YearTD
budget
YTD
variance
YTD
variance
Full Year
Forecast
R thousands 1 %
CASH FLOW FROM OPERATING ACTIVITIES
Receipts
Property rates 57,979 57,646 3,815 51,795 51,295 499 1% 57,646
Service charges 147,357 146,510 12,536 134,772 131,986 2,786 2% 146,510
Other revenue 15,094 17,617 1,362 15,626 13,890 1,736 12% 17,617
Government - operating 55,134 72,809 – 76,140 69,437 6,704 10% 72,809
Government - capital 12,269 12,238 – 11,990 8,180 3,810 47% 12,238
Interest 3,502 3,494 606 3,462 3,240 222 7% 3,494
Dividends – – – – – – –
Payments
Suppliers and employees (273,935) (294,990) 193 (251,115) (231,099) 20,016 -9% (294,990)
Finance charges (727) (770) (40) (3,593) (130) 3,463 -2660% (770)
T ransfers and Grants (2,763) (2,763) (153) (2,021) (2,375) (354) 15% (2,763)
NET CASH FROM/(USED) OPERATING ACTIVITIES – 13,909 11,790 18,318 37,057 44,423 7,367 17% 11,790
CASH FLOWS FROM INVESTING ACTIVITIES
Receipts
Proceeds on disposal of PPE 500 1,700 – – – – 1,700
Decrease (Increase) in non-current debtors 27 31 – – 13 (13) -100% 31
Decrease (increase) other non-current receivables – – 0 2 – 2 #DIV/0! –
Decrease (increase) in non-current investments – – – – – – –
Payments
Capital assets (27,665) (27,460) (1,303) (19,582) (22,122) (2,540) 11% (27,460)
NET CASH FROM/(USED) INVESTING ACTIVITIES – (27,137) (25,729) (1,303) (19,580) (22,110) (2,530) 11% (25,729)
CASH FLOWS FROM FINANCING ACTIVITIES
Receipts
Short term loans – – – – – – –
Borrowing long term/refinancing 5,661 5,473 – 2,400 5,661 (3,261) -58% 5,473
Increase (decrease) in consumer deposits 188 257 15 194 285 (90) -32% 257
Payments
Repayment of borrowing (2,240) (1,634) (14) (1,165) (420) 745 -177% (1,634)
NET CASH FROM/(USED) FINANCING ACTIVITIES – 3,609 4,096 2 1,429 5,525 4,096 74% 4,096
NET INCREASE/ (DECREASE) IN CASH HELD – (9,619) (9,842) 17,017 18,906 27,839 (9,842)
Cash/cash equivalents at beginning: 16,035 24,361 24,361 24,361 24,361
Cash/cash equivalents at month/year end: – 6,415 14,519 43,267 52,200 14,519
WC033 Cape Agulhas - Table C7 Monthly Budget Statement - Cash Flow - M11 May
Description Ref
The cash position of Council is positive at the end of the reporting period
ending 31 May 2018. The positive position is a result of outstanding cash
balance items needed to be processed. The process of completing bank
reconciliations is still outstanding, and the cash position differs under the
liquidity ratios reported is as a result of processed transactions that still needs
to be done to ensure accurate recordkeeping.

22
7. Supporting Documents
Varian
ceReasons for material deviations Remedial or corrective steps/remarks
R thousands
1 Revenue By Source
Service charges - water revenue Projected under-delivering of Revenue source Review and table revised budget in June 2018
Fines, penalties and forfeits Transaction needs to be finalized at year-end Review and table revised budget in June 2018
Transfers and subsidies Year end recognition of revenue needs to be processed Review and table revised budget in June 2018
2 Expenditure By Type
Employee related costs Vacancies will result in underperformance on budget Review and table revised budget in June 2018
Depreciation & asset impairment Financial system challenges Review and table revised budget in June 2018
Contracted services Review of expenditures to bring in line with budget Review and table revised budget in June 2018
Bulk purchases Needs to be alinged with revenue Review and table revised budget in June 2018
3 Capital Expenditure
Internally generated funds Projects complete needs to be adjusted Review and table revised budget in June 2018
4 Financial Position
5 Cash Flow
6 Measureable performance
7 Municipal Entities
WC033 Cape Agulhas - Supporting Table SC1 Material variance explanations - M11 May
Ref Description
Tale C1 – Monthly Budget Statement Summary have reference.
The finance department will distribute a memorandum during May to address
various issues in terms of the implementation of the budget. This should
improve performance over the last quarter of the financial year.
EXPLANTION:
The finance department will table a report to council with a revised budget
to ensure that all items needed to be addressed as per SC1 material
variances explanations.
23
2016/17 Budget Year 2017/18
Audited
Outcome
Original
Budget
Adjusted
BudgetYearTD actual
Full Year
Forecast
Borrowing Management
Capital Charges to Operating
Expenditure
Interest & principal paid/Operating
Expenditure
0.0% 6.6% 6.4% 1.4% 4.4%
Borrowed funding of 'own' capital
expenditure
Borrowings/Capital expenditure excl.
transfers and grants
0.0% 20.5% 19.9% 20.1% 19.9%
Safety of Capital
Debt to Equity Loans, Accounts Payable, Overdraft
& Tax Provision/ Funds & Reserves
11.6% 8.0% 10.8% 8.4% 10.8%
Gearing Long Term Borrowing/ Funds &
Reserves
10.1% 44.3% 24.4% 18.6% 24.4%
Liquidity
Current Ratio Current assets/current liabilities
1
127.4% 116.5% 110.0% 206.1% 110.0%
Liquidity Ratio Monetary Assets/Current Liabilities 49.8% 17.0% 32.9% 114.2% 32.9%
Revenue Management
Annual Debtors Collection Rate
(Payment Level % )
Last 12 Mths Receipts/ Last 12 Mths
Billing
Outstanding Debtors to Revenue Total Outstanding Debtors to Annual
Revenue
0.0% 12.4% 10.8% 12.2% 10.8%
Longstanding Debtors Recovered Debtors > 12 Mths Recovered/Total
Debtors >
12 Months Old
0.0% 0.0% 0.0% 0.0% 0.0%
Creditors Management
Creditors System Efficiency % of Creditors Paid Within Terms
(within MFMA s 65(e))
Funding of Provisions
Percentage Of Provisions Not Funded Unfunded Provisions/Total Provisions
Other Indicators
Electricity Distribution Losses % Volume (units purchased and
generated less units sold)/units
purchased and generated
2
Water Distribution Losses % Volume (units purchased and own
source less units sold)/Total units
purchased and own source
2
Employee costs Employee costs/Total Revenue -
capital revenue
0.0% 39.9% 38.4% 37.1% 38.4%
Repairs & Maintenance R&M/Total Revenue - capital
revenue
0.0% 0.0% 0.0% 0.0% 0.0%
Interest & Depreciation I&D/Total Revenue - capital revenue 0.0% 6.9% 6.7% 1.3% 4.6%
IDP regulation financial viability indicators
i. Debt coverage (Total Operating Revenue -
Operating Grants)/Debt service
payments due within financial year)
ii. O/S Service Debtors to Revenue Total outstanding service
debtors/annual revenue received for
services
iii. Cost coverage (Available cash +
Investments)/monthly fixed
operational expenditure
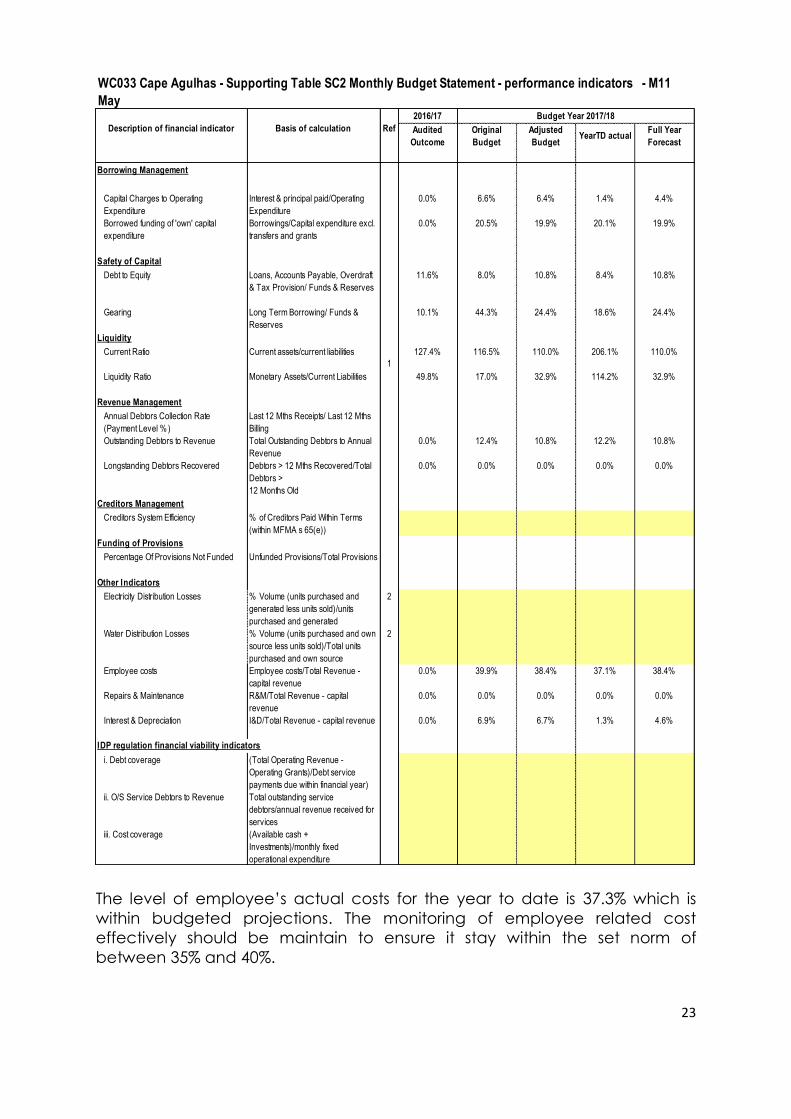
WC033 Cape Agulhas - Supporting Table SC2 Monthly Budget Statement - performance indicators - M11
May
Description of financial indicator Basis of calculation Ref
The level of employee’s actual costs for the year to date is 37.3% which is
within budgeted projections. The monitoring of employee related cost
effectively should be maintain to ensure it stay within the set norm of
between 35% and 40%.

24
Care should be taken as to the parameters used in the calculation of %
employee related cost in this diagram versus Council proposal in terms of the
long term financial plan.
The calculation in the diagram based employee related cost against the
total revenues, whereas the % reported and monitored in terms of the Long-
term financial plan (LTFP) is comparing employee related cost against total
expenditures. This will result in different results and ratios being calculated.
The Capital Replacement Reserve will require minor adjustments at year end
in order to ensure that it is cash backed. The “Cash & Cash Equivalents” are
sufficient to cover outstanding debt with specific reference to any unspent
grant funding.
25
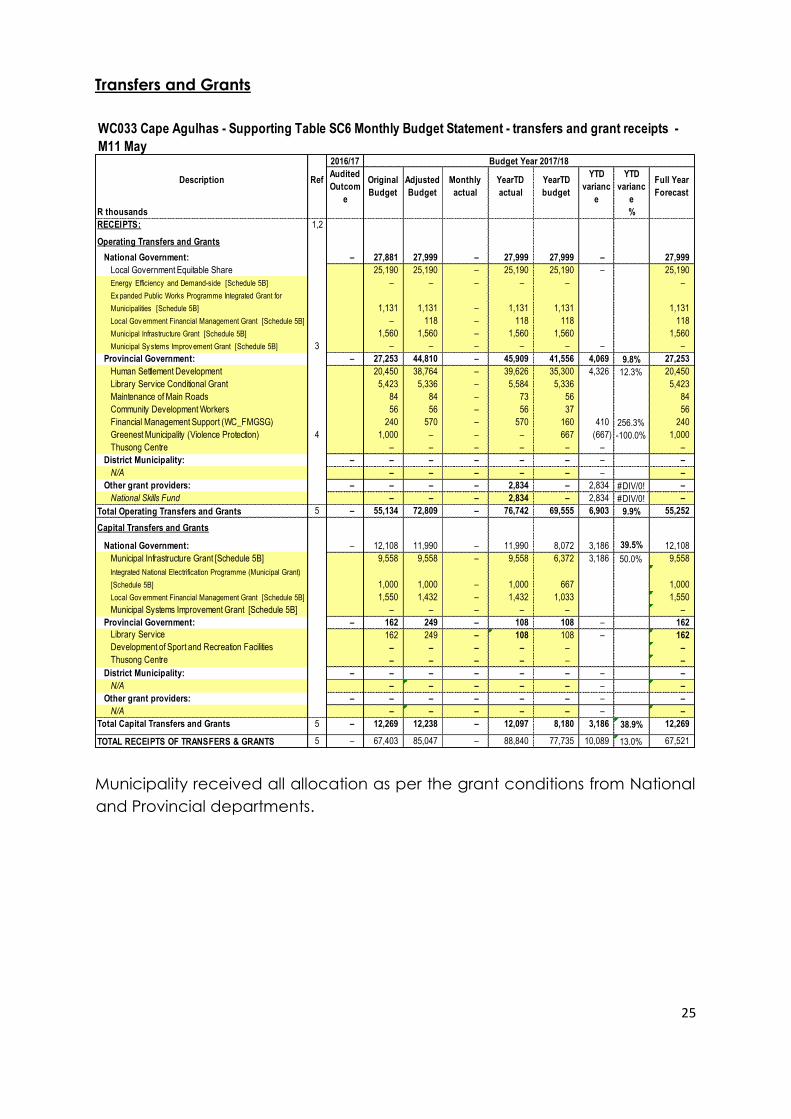
Transfers and Grants
2016/17 Budget Year 2017/18
Audited
Outcom
e
Original
Budget
Adjusted
Budget
Monthly
actual
YearTD
actual
YearTD
budget
YTD
varianc
e
YTD
varianc
e
Full Year
Forecast
R thousands %
RECEIPTS: 1,2
Operating Transfers and Grants
National Government: – 27,881 27,999 – 27,999 27,999 – 27,999
Local Government Equitable Share 25,190 25,190 – 25,190 25,190 – 25,190
Energy Efficiency and Demand-side [Schedule 5B] – – – – – –
Ex panded Public Works Programme Integrated Grant for
Municipalities [Schedule 5B] 1,131 1,131 – 1,131 1,131 1,131
Local Gov ernment Financial Management Grant [Schedule 5B] – 118 – 118 118 118
Municipal Infrastructure Grant [Schedule 5B] 1,560 1,560 – 1,560 1,560 1,560
Municipal Sy stems Improv ement Grant [Schedule 5B] 3 – – – – – – –
Provincial Government: – 27,253 44,810 – 45,909 41,556 4,069 9.8% 27,253
Human Settlement Development 20,450 38,764 – 39,626 35,300 4,326 12.3% 20,450
Library Service Conditional Grant 5,423 5,336 – 5,584 5,336 5,423
Maintenance of Main Roads 84 84 – 73 56 84
Community Development Workers 56 56 – 56 37 56
Financial Management Support (WC_FMGSG) 240 570 – 570 160 410 256.3% 240
Greenest Municipality (Violence Protection) 4 1,000 – – – 667 (667) -100.0% 1,000
Thusong Centre – – – – – – –
District Municipality: – – – – – – – –
N/A – – – – – – –
Other grant providers: – – – – 2,834 – 2,834 #DIV/0! –
National Skills Fund – – – 2,834 – 2,834 #DIV/0! –
Total Operating Transfers and Grants 5 – 55,134 72,809 – 76,742 69,555 6,903 9.9% 55,252
Capital Transfers and Grants
National Government: – 12,108 11,990 – 11,990 8,072 3,186 39.5% 12,108
Municipal Infrastructure Grant [Schedule 5B] 9,558 9,558 – 9,558 6,372 3,186 50.0% 9,558
Integrated National Electrification Programme (Municipal Grant)
[Schedule 5B] 1,000 1,000 – 1,000 667 1,000
Local Gov ernment Financial Management Grant [Schedule 5B] 1,550 1,432 – 1,432 1,033 1,550
Municipal Systems Improvement Grant [Schedule 5B] – – – – – –
Provincial Government: – 162 249 – 108 108 – 162
Library Service 162 249 – 108 108 – 162
Development of Sport and Recreation Facilities – – – – – –
Thusong Centre – – – – – –
District Municipality: – – – – – – – –
N/A – – – – – – –
Other grant providers: – – – – – – – –
N/A – – – – – – –
Total Capital Transfers and Grants 5 – 12,269 12,238 – 12,097 8,180 3,186 38.9% 12,269
TOTAL RECEIPTS OF TRANSFERS & GRANTS 5 – 67,403 85,047 – 88,840 77,735 10,089 13.0% 67,521
WC033 Cape Agulhas - Supporting Table SC6 Monthly Budget Statement - transfers and grant receipts -
M11 May
Description Ref
Municipality received all allocation as per the grant conditions from National
and Provincial departments.

26
Other Information
7.1 SCOA Implementation
The key objectives of the Regulations on a Standard Chart of Accounts
(SCOA) is to enable the alignment of budget information with information
captured in the course of the implementation of the budget; improve data
quality and credibility; achieve a greater level of standardization; improve
transparency, accountability and governance through uniform recording of
transactions at posting account level; enable deeper data analysis and
sector comparisons to improve financial performance and the
standardization of the account classification to facilitate mobility in financial
skills within local government in order to enhance the ability to attract and
retain skilled personnel.
A detailed progress report will be submitted to the Steering committee and
Council reflecting the municipal mSCOA implementation performance.
Challenges currently still being experienced:
Asset module – Demand Management system – implementation in
progress
Reporting module – Caseware reporting – will be implemented in new
financial year.
Salary module – Payday software – salary payment functioning, leave
integration outstanding
Cash module – Bank balance integration
These challenges are being addressed continuously and the municipality is
making adequate progress with ensuring optimal use of full systems and
operations.
7.2 Long-Term Financial Plan
The long-term financial plan was reviewed. An action plan to address the
recommendations and challenges as identified was compiled. The
monitoring of the actions is the responsibility of the manager: Revenue
services.
A detail status quo report will be tabled to ensure council can execute its
oversight responsibilities in terms of the action plan.

27
8. Municipal Quality Certificate