capillary electrophoretic study of small, highly sulfated, non-sugar
TRANSCRIPT
Capillary Electrophoretic Study of Small, Highly Sulfated,
Non-Sugar Molecules Interacting With Antithrombin
Aiye Liang, Arjun Raghuraman, Umesh R. Desai*
Department of Medicinal Chemistry and Institute for Structural Biology and Drug Discovery,
Virginia Commonwealth University, Richmond, Virginia 23219
Correspondence: Dr. Umesh R. Desai, Institute for Structural Biology and Drug Discovery,
Virginia Commonwealth University, 800 E. Leigh Street, Suite 212, Richmond, VA 23219; Ph:
+1-804-828-7328; Fax: +1-804-827-3664; E-mail: [email protected]
2
Abstract
Affinity capillary electrophoresis (ACE) was used to study interactions of small,
highly sulfated, aromatic molecules with antithrombin (AT). The high charge density of the
small molecules induces differential migration of the complex resulting in a versatile method
of assessing binding affinities, nature of interactions and site of binding on the inhibitor.
Scatchard analysis of the interaction of three tetrahydroisoquinoline-based multiply sulfated
molecules with AT results in monophasic profiles with affinities in the range of 40 – 60 μM in
20 mM sodium phosphate buffer, pH 7.4. For a pentasulfated molecule, a biphasic profile with
affinities of 4.7 μM and 30 μM was observed. Measurement of KD as a function of ionic
strength of the medium indicated that ionic and non-ionic forces contribute 2.4 and 1.9
kcal/mol, respectively, at pH 7.4 and 100 mM NaCl. Competitive binding studies show that
the tetrahydroisoquinoline-based molecules do not compete with a high-affinity heparin
pentasaccharide. In contrast, the affinity of these tetrahydroisoquinoline derivatives decreases
dramatically in the presence of an extended-heparin binding site ligand. Overall, ACE analysis
of small, sulfated aromatic molecules interacting with AT is relatively easy and obviates the
need for an external signal, e.g., fluorescence, for monitoring the interaction. In addition to
affording biochemical knowledge, the small sample requirement and fast analysis time of
ACE could be particularly advantageous for high throughput screening of potential
anticoagulants.

3
Abbreviations
ACE, affinity capillary electrophoresis
AT, antithrombin
CE, capillary electrophoresis
EHBS, extended heparin-binding site
HBS, heparin-binding site
PBS, pentasaccharide-binding site
Keywords
affinity capillary electrophoresis
antithrombin
capillary electrophoresis
interaction
synthetic sulfated molecules
4
1 Introduction
Antithrombin (AT) is a plasma glycoprotein and a major inhibitor of thrombin, factor
Xa, and factor IXa, three enzymes that play pivotal roles in the blood clotting. Yet, AT is a
rather poor inhibitor of all the three enzymes under physiologic conditions.1-3 Heparin, a
carbohydrate polymer prepared from animals, especially from pig and bovine, induces AT to
become a potent inhibitor of the three enzymes, which is the reason for heparin’s clinical use
as an anticoagulant. Clinically used heparin, appropriately named unfractionated heparin, is
highly polyanionic preparation consisting millions of polysaccharide chains, each with a
differing composition and structure. This structural heterogeneity is known to be associated
with multiple adverse effects including hemorrhage, thrombocytopenia, osteoporosis and
variable patient response,4 which introduces challenges in their usage, especially in elderly
population. In addition, the animal origin of heparin introduces another set of challenges, as
demonstrated by the recently observed contamination with oversulfated chondroitin sulfate.5,6
Heparin enhances the potency of AT by inducing a major conformational change in the
glycoprotein, which increases the inhibitor’s activity nearly 600-fold.7,8 Despite the massive
structural heterogeneity of unfractionated heparin, only selected sequences, e.g., those
containing 4) β-D-GlcNp6S (1 4) β-D-GlcAp (1 4) β-D-GlcNp2S,3S (1 (Fig. 1A), can
bring about this activation suggesting phenomenonal specificity of action. Polysaccharide
chains containing this sequence bind to an electropositive region in AT called the
heparin-binding site (HBS), which is now understood to consist of a pentasaccharide binding
site (PBS) and an extended heparin binding site (EHBS) (Fig. 1C).9,10 Interaction in the PBS
appears to be critical for the induction of 600-fold activation in AT.

5
To devise an alternative anticoagulation approach based on AT so as to avoid the
problems associated with heparin therapy, we initiated a synthetic medicinal chemistry
program some time ago and designed several small, non-sugar, highly sulfated, aromatic
molecules.9,11-13 These small, synthetic molecules are more accessible than heparins and are
likely to offer special advantages such as greater non-ionic binding energy9 in AT recognition
and/or greater hydrophobicity for possible oral delivery. An interesting feature of the highly
sulfated, aromatic molecules is that they simultaneously possess both hydrophobic and anionic
character. Recently, we synthesized four tetrahydroisoquinoline-based potential AT activators
as mimics of a heparin trisaccharide.14 Of the four, only IAS5 (Fig. 1B) was found to activate
antithrombin nearly 30-fold,15 which was significantly higher than our first generation
designs.9,11-13
IAS5 represents one of the few small, synthetic, non-sugar molecules that bind and
activate AT, and may pave the way to more potent activators for use as anticoagulant drugs.
To understand the nature of interaction of these interesting molecules, we needed a powerful
biophysical technique. It is difficult to measure the AT binding affinities of such small
molecules because the highly sulfated molecules typically do not induce significant
differential change in AT absorption or fluorescence, nor do they significantly alter the
inhibitor’s magnetic resonance properties. Other methods used in the study of heparin –
antithrombin interactions, such as isothermal titration calorimetry,16 affinity
chromatography,17,18 and surface plasmon resonance19,20 are not as useful for detailed small
molecular interaction studies. In contrast, capillary electrophoresis (CE) offers high speed,
excellent resolution, low sample size and good flexibility. Additionally, affinity capillary
6
electrophoresis (ACE) has been used to study AT-polysaccharide interactions, especially with
heparin and fucoidan.21-25 In this paper, we describe the application of ACE to understand the
nature of small highly sulfated molecules binding to AT at a molecular level. Our work
suggests that ACE is highly effective in measuring AT equilibrium dissociation constants
under physiological conditions and is able to decipher the site of binding as well as the
ionic/non-ionic nature of interaction. Additionally, we have discovered an interesting
synergistic mechanism of these small molecules binding to AT in the presence of heparin
pentasaccharide (Fig. 1).
2 Materials and Methods
2.1 Chemicals and Reagents
Human plasma AT (MW 58,000) was purchased from Haematologic Technologies, Inc
(Essex Junction, VT) and used as such. IAS4, IAS5, IES4, IES5 and catechin sulfate ((+)-CS)
(Fig. 1B) were synthesized and characterized in our laboratory.9,14,15 Heparin pentasaccharide
H5 (Fig. 1A) was a gift from Professor Steven Olson (University of Illinois – Chicago). High
purity water (18.2 megohms), purchased from Fisher Scientific (Agawam, MA), was used to
prepare all buffers. 20 mM sodium phosphate buffer, pH 7.4, possessing ionic strength of
0.035 was used as run electrolyte. Buffers with higher ionic strengths (I = 0.045, 0.055 and
0.085) were prepared by adding 10, 20 or 50 mM NaCl to the 20 mM sodium phosphate buffer
and adjusting the pH to 7.4.
2.2 Experimental Procedure
The interaction of AT with sulfated molecules was studied using a P/ACE MDQTM
7
Beckman capillary electrophoresis system (Fullerton, CA). Electrophoresis was performed at
a constant voltage of 8 or 10 kV using an uncoated fused silica capillary (I.D. 50 or 75 μm) of
31.2 or 40.2 cm total length with a 5 mm detection window at 21.0 or 30.0 cm length,
respectively from the injection point. During electrophoresis, the capillary was held at a
constant temperature of 25 °C. A sequential wash of 1 M HCl for 10 min, high purity water for
3 min, 1 M NaOH for 10 min, and high purity water for 3 min at 20 psi was used to activate a
capillary. Before individual electrophoretic runs, the capillary was rinsed with the run buffer
for 3 min at 20 psi.
A 43 μM AT stock solution was prepared in 20 mM sodium phosphate buffer, pH 7.4,
containing 100 mM NaCl, 0.1 mM EDTA, and 0.1% PEG 8000. Stock solutions of ≥11 mM
IAS4, IAS5, IES4 and IES5 (Fig. 1B) were prepared in high purity water. Run electrolytes
containing these molecules at desired concentrations were made through a ≥10-fold dilution
with 20 mM sodium phosphate buffer, pH 7.4. Naphthol was used as neutral marker. Samples
containing 0.86 μM AT and naphthol (300-fold diluted from its stock in water) were injected at
the anodic end using 0.5 psi pressure for 4 s and detected at the cathodic end at a wavelength
of 214 nm.
2.3 Quantitative model of the ACE method
The basic principle and analysis of ACE has been elegantly described by Whitesides
and co-workers.26 Briefly, if ep0μ and ep
tμ are the AT’s electrophoretic mobility in a reference
buffer and in a buffer containing our ligand, respectively, then the expression
epepept 0μμμ −=Δ represents the change in the mobility of AT due to the presence of the
ligand. Under rapid equilibration condition, equation 1 can be derived as the electrophoretic

8
version of the traditional Scatchard equation.27
epA
epA
epKK
L max][μμμ
Δ+Δ−=Δ (1)
In this equation AK is apparent equilibrium association constant, epmaxμΔ is the
maximal change in mobility of AT when saturated with ligand L ([L] >> [AT]). Thus, a plot of
]/[LepμΔ versus epμΔ will provide a value of AK from its slope. The electrophoretic
mobility of AT was calculated from equation 2.26 In this equation, eL is the effective
separation length of the capillary, tL is the total length of the capillary, ATt is the migration
time of AT, nmt is the migration time of the neutral marker, and V is the applied voltage
during the separation process.
t
nm
e
AT
e
ep
LV
tL
tL
)( −=μ (2)
3 Results
3.1 AT Interaction Study Using ACE
To test whether ACE can be used to study the small molecule - AT interaction, IAS5
was chosen. IAS5 was the only small aromatic molecule in the tetrahydroisoquinoline series
(Fig. 1B) that induced a 30-fold increase in antithrombin inhibition of factor Xa.15 It also
contained the most number of negatively charged groups, thereby potentially inducing a
significant change in electrophoretic mobility of AT upon binding. Following a series of
experiments to assess the concentration of AT necessary for optimal level signal to noise ratio
and peak sharpness, 0.86 μM injection was chosen. A single AT peak was consistently
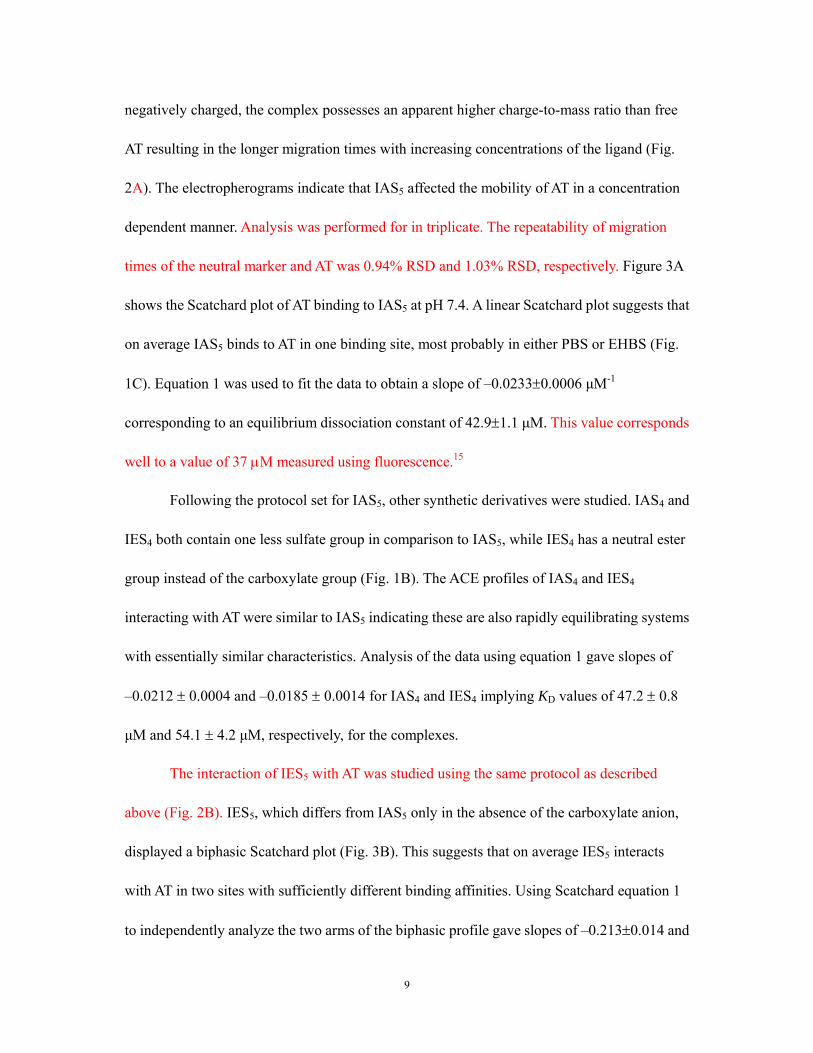
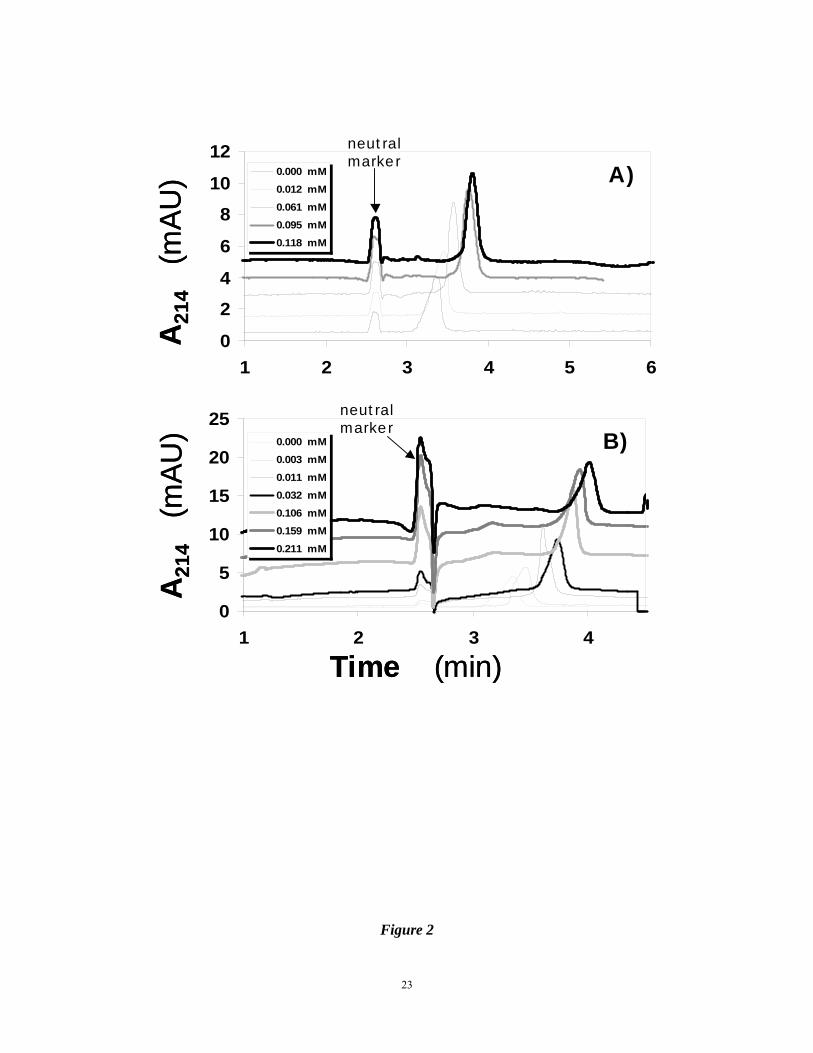
observed suggesting rapid equilibrium between free and bound AT forms. Because IAS5 is
9
negatively charged, the complex possesses an apparent higher charge-to-mass ratio than free
AT resulting in the longer migration times with increasing concentrations of the ligand (Fig.
2A). The electropherograms indicate that IAS5 affected the mobility of AT in a concentration
dependent manner. Analysis was performed for in triplicate. The repeatability of migration
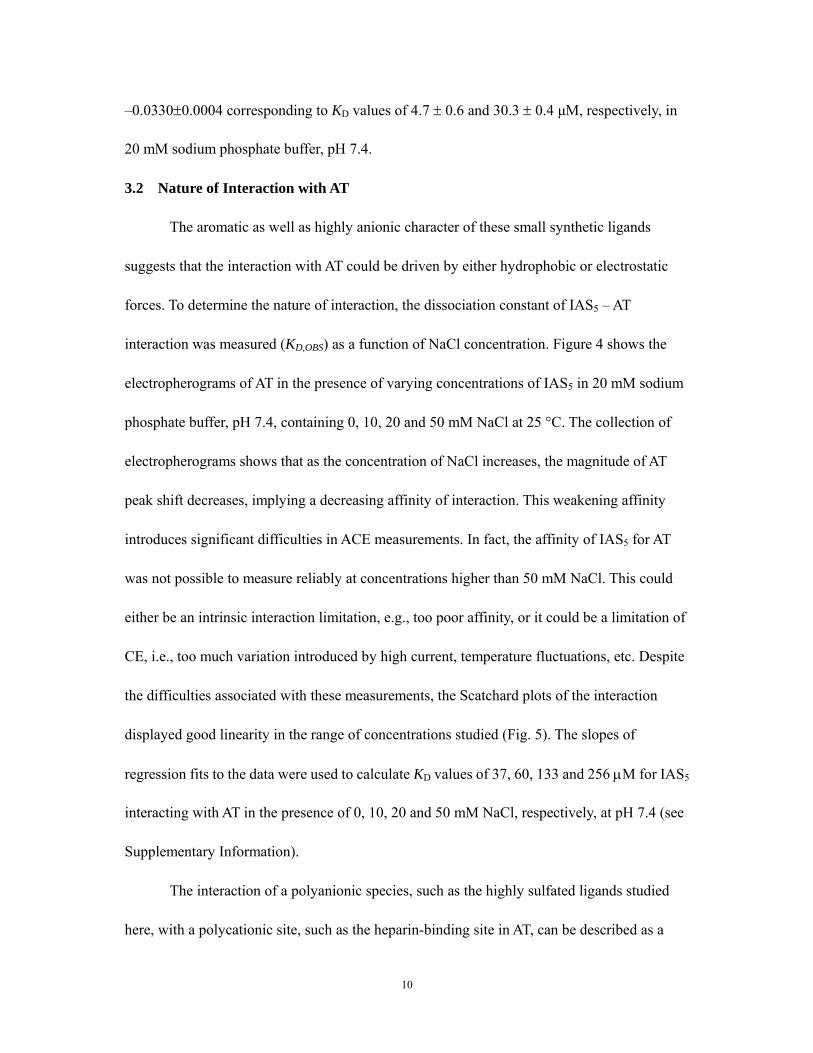
times of the neutral marker and AT was 0.94% RSD and 1.03% RSD, respectively. Figure 3A
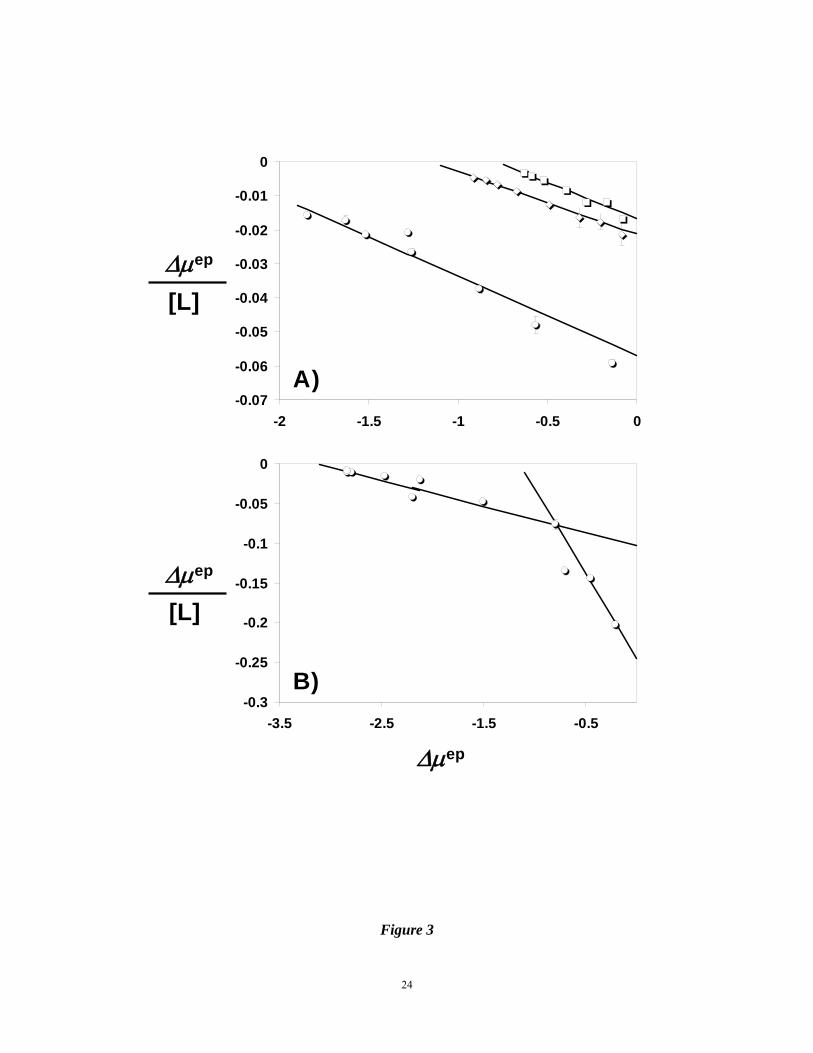
shows the Scatchard plot of AT binding to IAS5 at pH 7.4. A linear Scatchard plot suggests that
on average IAS5 binds to AT in one binding site, most probably in either PBS or EHBS (Fig.
1C). Equation 1 was used to fit the data to obtain a slope of –0.0233±0.0006 μM-1
corresponding to an equilibrium dissociation constant of 42.9±1.1 μM. This value corresponds
well to a value of 37 μM measured using fluorescence.15
Following the protocol set for IAS5, other synthetic derivatives were studied. IAS4 and
IES4 both contain one less sulfate group in comparison to IAS5, while IES4 has a neutral ester
group instead of the carboxylate group (Fig. 1B). The ACE profiles of IAS4 and IES4
interacting with AT were similar to IAS5 indicating these are also rapidly equilibrating systems
with essentially similar characteristics. Analysis of the data using equation 1 gave slopes of
–0.0212 ± 0.0004 and –0.0185 ± 0.0014 for IAS4 and IES4 implying KD values of 47.2 ± 0.8
μM and 54.1 ± 4.2 μM, respectively, for the complexes.
The interaction of IES5 with AT was studied using the same protocol as described
above (Fig. 2B). IES5, which differs from IAS5 only in the absence of the carboxylate anion,
displayed a biphasic Scatchard plot (Fig. 3B). This suggests that on average IES5 interacts
with AT in two sites with sufficiently different binding affinities. Using Scatchard equation 1
to independently analyze the two arms of the biphasic profile gave slopes of –0.213±0.014 and
10
–0.0330±0.0004 corresponding to KD values of 4.7 ± 0.6 and 30.3 ± 0.4 μM, respectively, in
20 mM sodium phosphate buffer, pH 7.4.
3.2 Nature of Interaction with AT
The aromatic as well as highly anionic character of these small synthetic ligands
suggests that the interaction with AT could be driven by either hydrophobic or electrostatic
forces. To determine the nature of interaction, the dissociation constant of IAS5 – AT
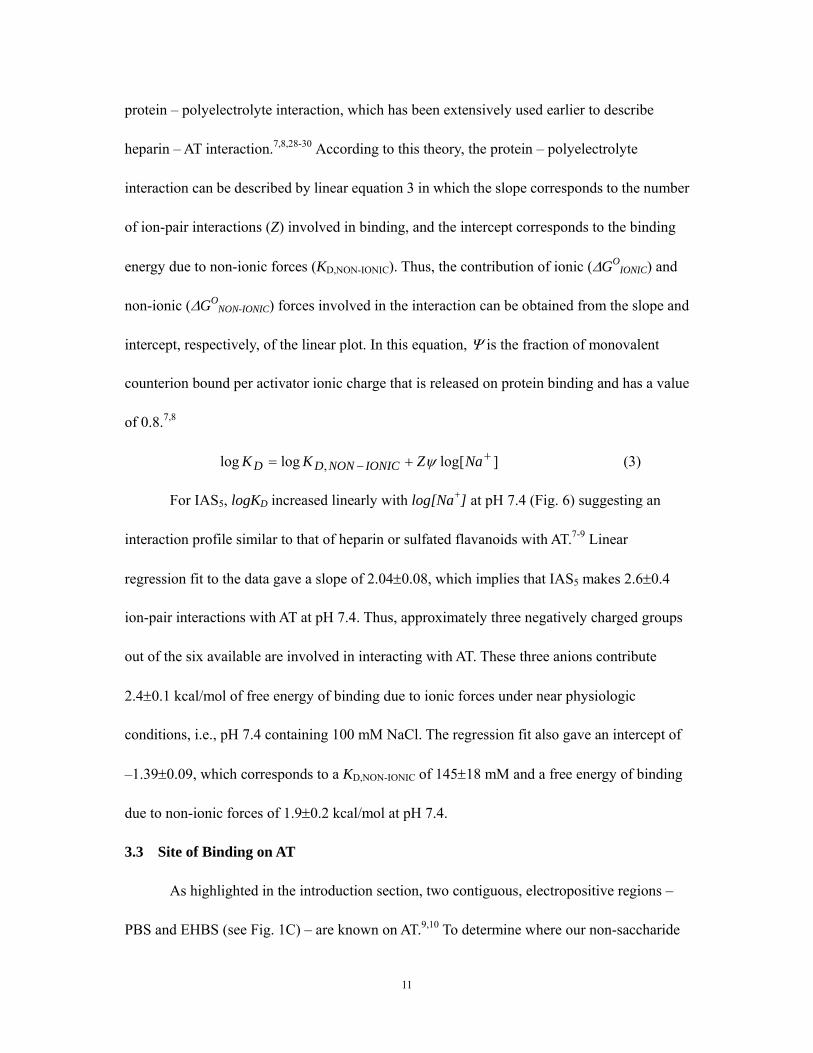
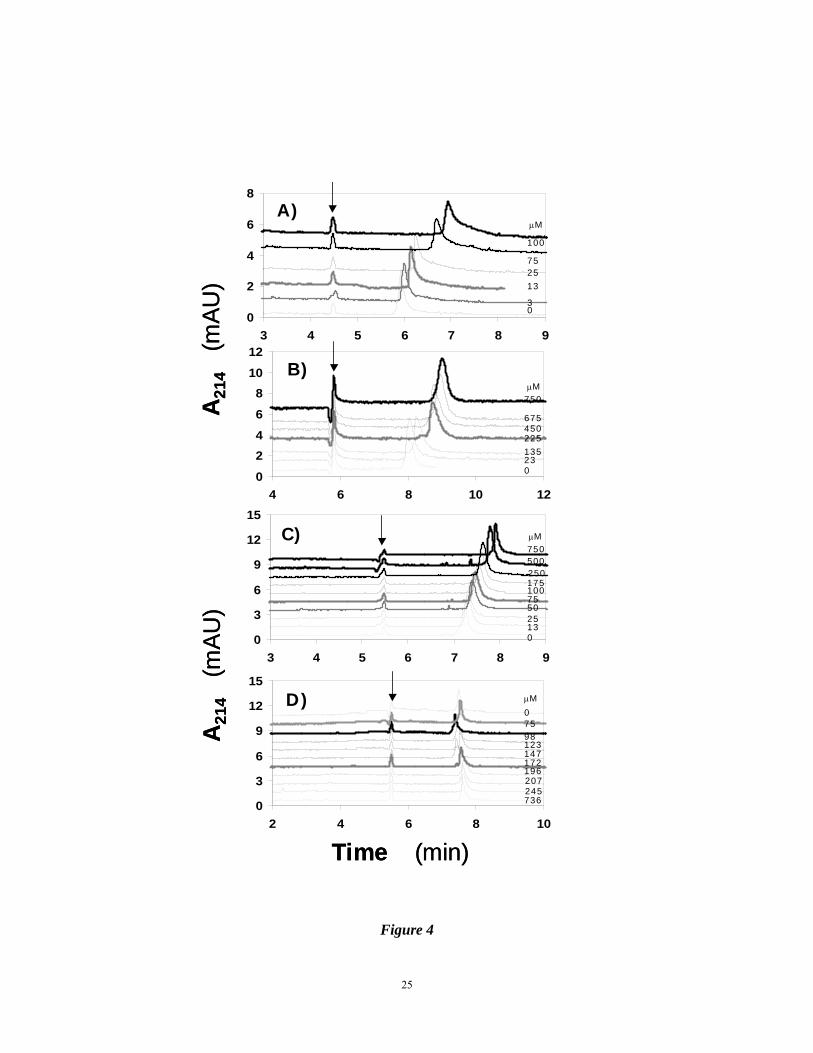
interaction was measured (KD,OBS) as a function of NaCl concentration. Figure 4 shows the
electropherograms of AT in the presence of varying concentrations of IAS5 in 20 mM sodium
phosphate buffer, pH 7.4, containing 0, 10, 20 and 50 mM NaCl at 25 °C. The collection of
electropherograms shows that as the concentration of NaCl increases, the magnitude of AT
peak shift decreases, implying a decreasing affinity of interaction. This weakening affinity
introduces significant difficulties in ACE measurements. In fact, the affinity of IAS5 for AT
was not possible to measure reliably at concentrations higher than 50 mM NaCl. This could
either be an intrinsic interaction limitation, e.g., too poor affinity, or it could be a limitation of
CE, i.e., too much variation introduced by high current, temperature fluctuations, etc. Despite
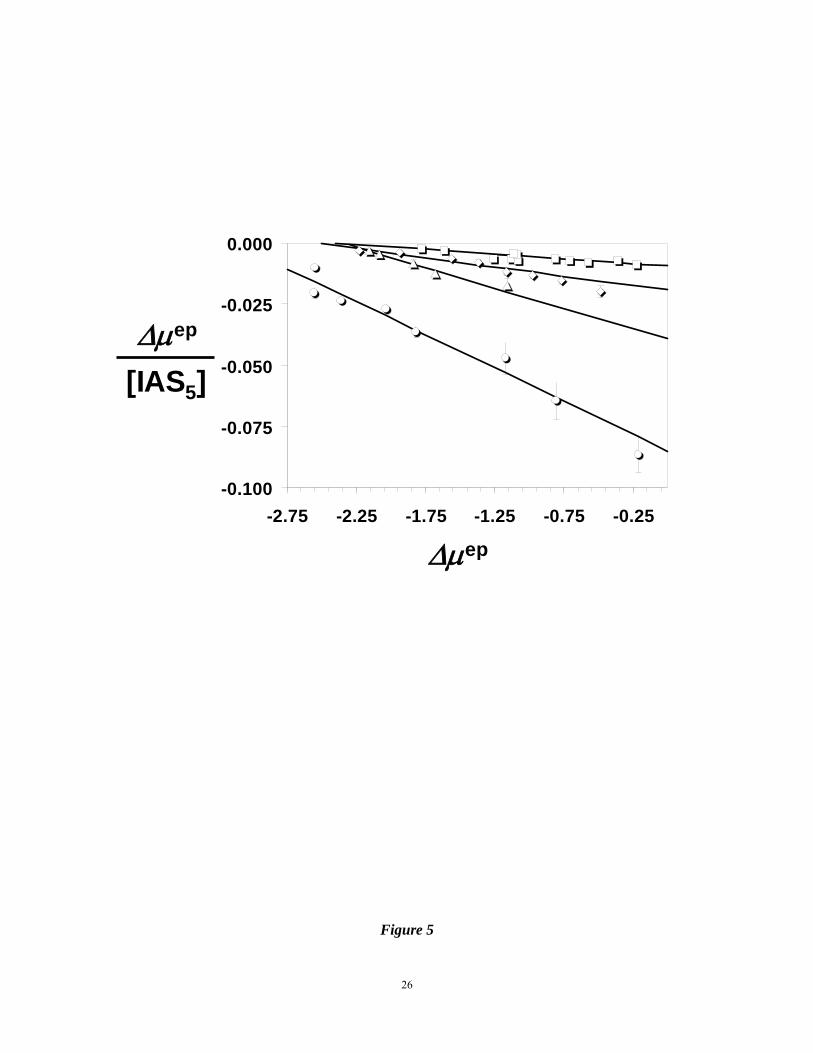
the difficulties associated with these measurements, the Scatchard plots of the interaction
displayed good linearity in the range of concentrations studied (Fig. 5). The slopes of
regression fits to the data were used to calculate KD values of 37, 60, 133 and 256 μM for IAS5
interacting with AT in the presence of 0, 10, 20 and 50 mM NaCl, respectively, at pH 7.4 (see
Supplementary Information).
The interaction of a polyanionic species, such as the highly sulfated ligands studied
here, with a polycationic site, such as the heparin-binding site in AT, can be described as a
11
protein – polyelectrolyte interaction, which has been extensively used earlier to describe
heparin – AT interaction.7,8,28-30 According to this theory, the protein – polyelectrolyte
interaction can be described by linear equation 3 in which the slope corresponds to the number
of ion-pair interactions (Z) involved in binding, and the intercept corresponds to the binding
energy due to non-ionic forces (KD,NON-IONIC). Thus, the contribution of ionic (ΔGOIONIC) and
non-ionic (ΔGONON-IONIC) forces involved in the interaction can be obtained from the slope and
intercept, respectively, of the linear plot. In this equation, Ψ is the fraction of monovalent
counterion bound per activator ionic charge that is released on protein binding and has a value
of 0.8.7,8
]log[loglog ,+
− += NaZKK IONICNONDD ψ (3)
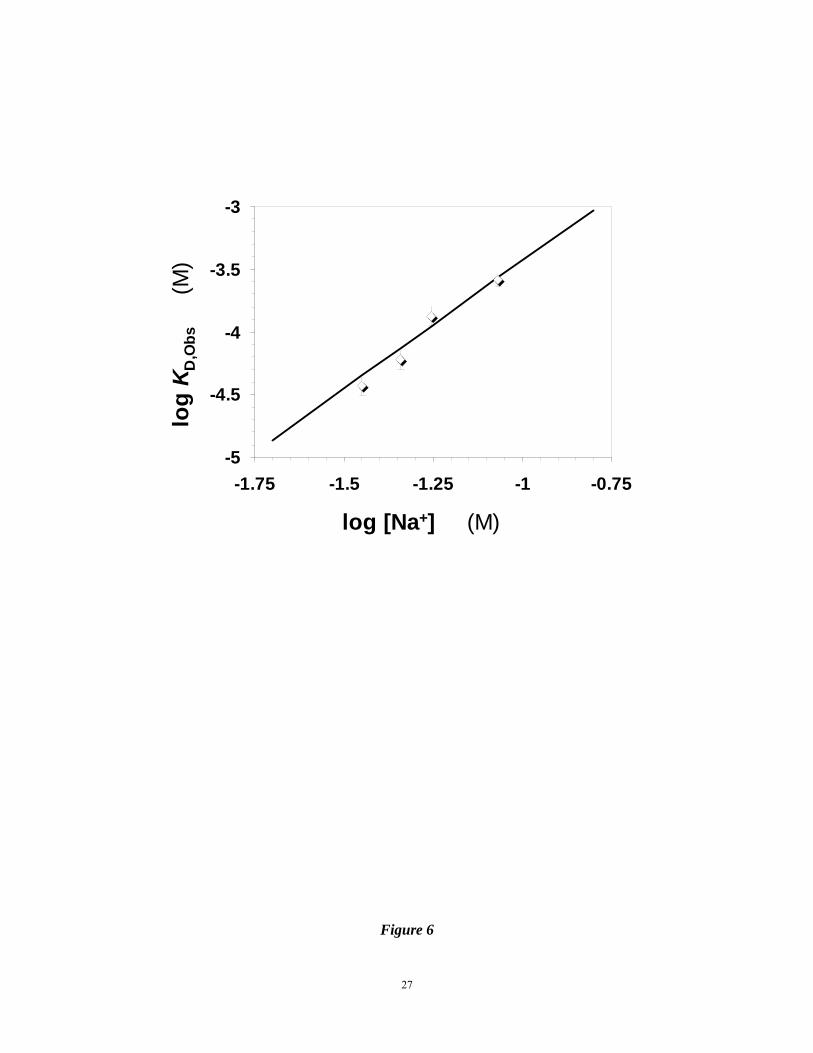
For IAS5, logKD increased linearly with log[Na+] at pH 7.4 (Fig. 6) suggesting an
interaction profile similar to that of heparin or sulfated flavanoids with AT.7-9 Linear
regression fit to the data gave a slope of 2.04±0.08, which implies that IAS5 makes 2.6±0.4
ion-pair interactions with AT at pH 7.4. Thus, approximately three negatively charged groups
out of the six available are involved in interacting with AT. These three anions contribute
2.4±0.1 kcal/mol of free energy of binding due to ionic forces under near physiologic
conditions, i.e., pH 7.4 containing 100 mM NaCl. The regression fit also gave an intercept of
–1.39±0.09, which corresponds to a KD,NON-IONIC of 145±18 mM and a free energy of binding
due to non-ionic forces of 1.9±0.2 kcal/mol at pH 7.4.
3.3 Site of Binding on AT
As highlighted in the introduction section, two contiguous, electropositive regions –
PBS and EHBS (see Fig. 1C) – are known on AT.9,10 To determine where our non-saccharide
12
activators bind AT, we studied the binding of IAS5 in the presence of two competitors.
Pentasaccharide H5 (see Fig. 1A) was used for studying PBS competition, while CS, a
rationally designed, sulfated flavanoid studied earlier (see Fig. 1B),9 was used for EHBS
competition. H5 and CS have been shown to bind AT at pH 7.4 with 10 nM and 30 μM
affinities, respectively.8,9 Thus, if IAS5 binds in PBS, the presence of H5 can be expected to
decrease its affinity. Similarly, the presence of CS can be expected to weaken IAS5 affinity, if
both sulfated ligands compete for the EHBS.
Competitive binding studies were performed in 20 mM sodium phosphate buffer, pH
7.4, containing 1, 5 and 10 nM H5 at 25 °C. The fixed concentrations of H5 induced a basal
shift in the mobility of AT, which underwent further movement as a function of the increasing
concentration of IAS5 (not shown). The highest H5 concentration possible to evaluate in this
manner was 10 nM primarily because tight binding induced significant reduction in AT signal.
Scatchard plots of the interaction at the three concentrations are shown in Figure 7. At all three
H5 concentrations studied, IAS5 – AT interaction displays a biphasic profile. In contrast, the
Scatchard plot of IAS5 alone was monophasic (see Figs. 3A and 5). Analysis of the biphasic
data gave binding affinities of 2.5 and 48 μM at 1 nM H5, 5.4 and 99 μM at 5 nM H5, and 3.8
and 49 μM at 10 nM H5. In comparison, the AT affinity of IAS5 alone was measured to be ~40
μM under similar conditions.
EHBS competitive studies were performed in the presence of 1 and 10 μM CS. In a
manner similar to PBS competitive studies, the presence of CS induced a basal shift in the
mobility of AT, which increased with IAS5. ACE profiles of AT – IAS5 interaction in the
presence of higher concentrations of CS, e.g., 30 μM, led to considerable scatter. Figure 8
13
shows the Scatchard plots of the interaction at 1 and 10 μM CS. The Scatchard plot was found
to be monophasic in the presence of 1 μM CS, while that in the presence of 10 μM CS was
biphasic. Analysis of the data gave IAS5 binding affinities of 200±29 μM and 154±23 μM in
the presence of 1 and 10 μM CS, respectively. The second binding affinity corresponding to
the biphasic profile at 10 μM CS was measured to be 2.9±0.2 μM.
4 Discussion
Capillary electrophoresis has been previously used to assess the affinity of polyanionic
polysaccharides for antithrombin. These polyanionic polysaccharides, e.g., heparins, readily
alter the electrophoretic mobility of the glycoprotein due to the large number of negatively
charged groups on the polymeric chain. Whether sulfated, small molecules would sufficiently
modify the electrophoretic properties was an open question. We have found that ACE can be
used to study AT – small molecule interaction if the binding affinity is in the range of
nanomolar to ~200 μM. Thus, ACE is likely to be particularly suited for high-throughput
screening of such small molecules because it is fast (< 10 minutes) and requires small amount
of sample. Also, this protocol will be useful for small molecules that do not induce a
significant change in spectroscopic properties, e.g., absorbance or fluorescence, of AT.
The study also uncovered interesting mechanistic aspects of small molecule – AT
interaction. Despite the similarity in the structures of the tetrahydroisoquinoline-based
molecules, it appears that their mode of interaction varies significantly. For example, whereas
IAS5, IAS4 and IES4 exhibit a monophasic Scatchard plot with affinity in the range of 40 – 60
μM, IES5 exhibits a biphasic profile with ~5 and 30 μM affinities. The biphasic profile
14
suggests the presence of an additional equilibrium for IES5 corresponding to a 5 μM affinity.
The biphasic profile could arise from binding in both PBS and EHBS of AT. Alternatively, it
could arise from an interaction with the same site – either PBS or EHBS – present in different
forms of the inhibitor, i.e., the native form (AT) or the activated form (AT*), which exists in
equilibrium (Fig. 9).8 We propose that the four small sulfated activators interact with EHBS
present in the native form of AT with 30 – 60 μM affinity, while IES5 also interacts with
EHBS present in the activated form of AT (AT*) with an affinity of 5 μM. This hypothesis is
supported through competitive binding studies with pentasaccharide H5.
The AT – H5 interaction is extremely well characterized in terms of both structure and
biochemistry.7,8,28-34 It is well-established that H5 selectively engages the inhibitor in the PBS.
Thus, competitive binding studies with H5 were performed to test whether IAS5 binds in the
PBS. Interestingly, instead of an expected monophasic profile, the Scatchard plot for IAS5 –
AT interaction in the presence of H5 was biphasic. This indicated the operation of two
equilibria with sufficiently distinct binding constants. Further, the two KD values remained
essentially invariant as the concentration of H5 increased from 1 to 10 nM. Of these, the
weaker interaction (~50 – 100 μM) was similar in magnitude to that measured in the absence
of H5 (40 μM). Thus, the presence of H5 introduces a new, stronger IAS5 – AT interaction
with 2 – 5 μM affinity. Previous biochemical studies have shown that interaction of H5 in the
PBS of AT activates the inhibitor to the activated form (AT*).7,8 This activation induces
conformational changes in the binding site including the formation of helix P and ordering of
residues in the EHBS.31-34 Thus, our observations suggest that engagement of the PBS by H5
15
induces better recognition of the EHBS by IAS5 (see Fig. 9B), which is reflected in the
biphasic Scatchard plot.
To confirm that IAS5 preferentially recognizes EHBS, competitive binding studies
were performed in the presence of CS, a small, aromatic flavanoid known to bind in the
EHBS.9 Presence of 1 μM CS induced a weakening in AT of IAS5 affinity from 37 μM to 200
μM, which resembles competitive binding. Yet, the magnitude of the affinity change (~5-fold)
is more than that predicted on the basis of Dixon-Webb relationship (KD,APP = KD{1+[I]/KI}),
which describes an ideal competitive inhibition behavior.8,9 Another evidence for movement
away from strictly competitive inhibition is described by 10 μM CS, which introduces a
biphasic profile with 154 and 2.9 μM KD values. One reason for this biphasic profile could be
simultaneous occupation of PBS and EHBS by the two activators. Thus, the presence of CS
does introduce competition for binding in EHBS, however, it appears that the multiple anionic
groups present in these molecules may seek out the PBS under forcing condition, e.g., high
concentration.
A final question related to understanding the forces involved in the recognition of these
highly sulfated molecules, which is extremely important for advancing the rational design.
Ionic strength dependence of binding affinity indicated that IAS5 formed 2.6 ion-pair
interactions with AT. This implies that nearly 3 negative charges out of the 6 available in IAS5
are involved in binding. Our previous studies with CS indicated the formation of 2 ion-pair
interactions in EHBS,9 while full-length heparin is known to form one interaction in the
EHBS.7,8 In terms of energy, these interactions correspond to an ionic binding energy of 2.4
kcal/mol under physiological conditions. In contrast, the non-ionic contribution was found to
16
be 1.9 kcal/mol. Thus, nearly 44% of binding energy arises from non-ionic forces, which is
similar to that observed in the case of H5 and CS interacting with AT.7-9 We speculate that this
non-ionic binding energy arises from hydrogen bond-type interactions involved in sulfate and
carboxylate groups recognizing electropositive residues in the EHBS, as noted for H5 – AT.
Overall, our work exploits the power of ACE in understanding antithrombin
interactions with small highly charged molecules at a molecular level. Mechanistically, our
small molecules primarily engage the EHBS, which explains their weak potency in activating
the inhibitor. ACE was found to be particularly suited for this work. More importantly, it is
expected to be very useful for high-throughput screening of small molecules toward the
discovery of new anticoagulants.
Acknowledgements
The authors thank Professor Steven Olson of University of Illinois – Chicago for the
generous gift of heparin pentasaccharide. This work was supported in part by the National
Heart, Lung and Blood Institute (RO1 HL069975), the American Heart Association National
Center (EIA 0640053N), the Mizutani Foundation for Glycoscience, and the A. D. Williams
Foundation (6-48708 and 6-46604).
5 References
1. Bjork, I., Olson, S. T., Adv. Exp. Med. Biol. 1997, 425, 17-33.
2. Olson, S. T., Swanson, R., Raub-Segall, E., Bedsted, T., Sadri, M., Petitou, M., Herault,
J.P., Herbert, J. M., Bjork, I., Thromb. Haemost. 2004, 92, 929-939.
3. Desai, U. R., Med. Res. Rev. 2004, 24, 151-158.
17
4. Hirsh, J., Anand, S. S., Halperin, J. L., Fuster, V., Circulation 2001, 103, 2994-3018.
5. Guerrini, M., Beccati, D., Shriver, Z., Naggi, A., Viswanathan, K., Bisio, A., Capila, I.,
Lansing, J. C., Guglieri, S., Fraser, S., Al-Hakim, A., Gunay, N. S., Zhang, Z.,
Robinson, L., Buhse, L., Nasr, M., Woodcock, J., Langer, R., Venkataraman, G.,
Linhardt, R. J., Casu, B., Torri, G., Sasisekharan, S., Nat. Biotech. 2008, 26, 669-675.
6. Kishimoto, T. K., Viswanathan, K., Ganguly, T., Elankumaran, S., Smith, S., Pelzer, K.,
Lansing, J. C., Sriranganathan, N., Zhao, G., Galcheva-Gargova, Z., Al-Hakim, A.,
Bailey, G. S., Fraser, B., Roy, R., Rogers-Cotrone, T., Buhse, L., Whary, M., Fox, J.,
Nasr, M., Dal Pan, G. J., Shriver, Z., Langer, R. S., Venkataraman, G., Austen, K. F.,
Woodcock, J., Sasisekharan, R., N. Engl. J. Med. 2008, 358, 2457-2467.
7. Olson, S. T., Björk, I., Sheffer, R., Craig, P. A., Shore, J. D., Choay, J., J. Biol. Chem.
1992, 267, 12528-12538.
8. Desai, U. R., Petitou, M., Björk, I., Olson, S. T., J. Biol. Chem. 1998, 273, 7478-7487.
9. Gunnarsson, G. T., Desai, U. R., J. Med. Chem. 2002, 45, 4460-4470.
10. Arocas, V., Turk, B., Bock, S. C., Olson, S. T., Björk, I., Biochemistry 2000, 39,
8512-8518.
11. Gunnarsson, G. T., Desai, U. R. J. Med. Chem. 2002, 45, 1233-1243.
12. Gunnarsson, G. T., Riaz, M., Adams, J., Desai, U. R., Bioorg. Med. Chem. 2005, 13,
1783-1789.
13. Gunnarsson, G. T., Desai, U. R., Bioorg. Med. Chem. Lett. 2003, 13, 579-583.
14. Raghuraman, A., Riaz, M., Hindle, M., Desai, U. R., Tetrahedron Lett. 2007, 48,
6754-6758.

18
15. Raghuraman, A., Liang, A., Krishnasamy, C., Lauck, T., Gunnarsson, G. T., Desai, U.
R., Eur. J. Med. Chem. 2008, (in press) doi:10.1016/j.ejmech.2008.09.042
16. Tyler Cross, R., Sobel, M., Marques, D., Harris, R. B., Prot. Sci. 1994, 3, 620–627.
17. Lindahl, U., Thunberg, L., Backstrom, G., Riesenfeld, J., Nordling, K., Bjork, I., J. Biol.
Chem. 1984, 259, 12368–12376.
18. Pijler, G., Backstrom, G., Lindahl, U., J. Biol. Chem. 1987, 262, 5036–5043.
19. Osmond, Ronald I. W., Kett, Warren C., Skett, Spencer E., Coombe, Deirdre R., Anal.
Biochem. 2002, 310, 199-207.
20. Mille, S., Watton, J., Barrowcliffe, T. W., Mani, J. C., Lane, D. A., J. Biol. Chem. 1994,
269, 29435-29443.
21. Gunnarsson, K., Valtcheva, L., Hjerten, S., Glycoconj. J. 1997, 14, 859-862.
22. Le Saux, T., Varenne, A., Perreau, F., Siret, L., Duteil, S., Duhau, L., Gareil, P., J.
Chromatogr. A 2006, 1132, 289-296.
23. Seyrek, E., Dubin, P. L., Henriksen, J., Biopolymers 2007, 86, 249-259.
24. Varenne, A., Gareil, P., Colliec-Jouault, S., Daniel, R., Anal. Biochem. 2003, 315,
152-159.
25. Wu, X. J., Linhardt, R. J., Electrophoresis 1998, 19, 2650-2653.
26. Colton, I. J., Carbeck, J. D., Rao, J., Whitesides, G. M. Electrophoresis 1998, 19,
367-382.
27. Scatchard, G., Ann. N. Y. Acad. Sci. 1949, 51, 660-672.
28. Desai, U. R., Petitou, M., Björk, I., Olson, S. T. Biochemistry 1998, 37, 13033-13041.
29. Olson, S. T., Halvorson, H. R., Björk, I. J. Biol. Chem. 1991, 260, 6342-6352.

19
30. Olson, S. T., Björk, I. J. Biol. Chem. 1991, 260, 6353-6364.
31. Jin, L., Abrahams, J. P., Skinner, R., Petitou, M., Pike, R. N., Carrell, R. W., Proc. Natl.
Acad. Sci. 1997, 94, 14683-14688.
32. Johnson, D. J., Huntington, J. A., Biochemistry 2003, 42, 8712-8719.
33. Li, W., Johnson, D. J., Esmon, C. T., Huntington, J. A., Nat. Struct. Mol. Biol. 2004, 11,
857-862.
34. Dementiev, A., Petitou, M., Herbert, J. M., Gettins, P. G., Nat. Struct. Mol. Biol. 2004,
11, 863-867.
Figure Legends
Figure 1. A) Structure. of heparin pentasaccharide H5; B) Structure of non-saccharide
activators of antithrombin, IAS5, IES5, IES4, and IAS4 and (+)-CS. C) Model of
heparin binding site in antithrombin. Numbers in H5 structure refer to positions of
carbon atoms, whereas X and Y can be either –COCH3 or –SO3¯ groups. The
heparin-binding site in C) can be thought of as a combination of the
pentasaccharide-binding site (PBS) and extended heparin-binding site (EHBS).
The PBS is formed by Arg47, Lys114, Lys125 and Arg129 residues of helices D, A
and P, while the EHBS is formed by Arg129, Lys132, Arg133 and Lys136 residues
of helix D. See text for details.
Figure 2. Electropherograms of 0.86 μM AT in 20 mM sodium phosphate buffer, pH 7.4,
containing different concentrations of synthetic sulfated molecules IAS5 (A) and
IES5 (B). Naphthol was used as a neutral marker. Experimental conditions:
20
Capillary: 31.2 cm total; 21 cm effective length; 75 μm I.D.; Applied voltage: 8 kV.
Other conditions are described in ‘Materials and Methods’.
Figure 3. Scatchard plots of the AT interaction with IAS5 (ο), IES4 ( ), or IAS4 ( ) (shown
in Panel A) and with IES5 (ο) (shown in Panel B). Electrophoretic mobilities (Δμep)
in the presence of ligands (L) were measured as described in Materials and
Methods. Solid line refers to the linear regressional fit to the data to give the
binding affinity from the slope (= -1/KD). For IES5 (Panel B), appropriate data
points were used to obtain two KD values. See text for a discussion on analysis.
Figure 4. Electropherograms of 3.4 μM AT in 20 mM sodium phosphate buffer, pH 7.4,
containing 0 (Panel A), 10 (Panel B), 20 (Panel C) or 50 mM (Panel D) NaCl in the
presence of varying concentrations of IAS5, which are displayed on the right hand
side. Naphthol (arrow) was used as a neutral marker. Experimental conditions:
Capillary: 40.2 cm total; 30 cm effective length; 50 μm I.D.; Applied voltage: 10
kV. Other conditions are described in ‘Materials and Methods’.
Figure 5. Scatchard plots of the AT interaction with IAS5 in 20 mM phosphate buffer, pH 7.4,
containing 0 ( ), 10 ( ), 20 ( ) and 50 mM NaCl ( ) at 25 OC. Solid line
represents linear fit to the data according to equation 1. See text for details.
Figure 6. Dependence of AT – IAS5 interaction affinity on the ionic strength of the medium
at pH 7.4 and 25 °C. The binding affinities at various NaCl concentrations were
measured as described in ‘Materials and Methods’ and shown in Figure 5. Solid
line represents a linear regressional fit to the data using equation 3 to obtain the
number of ionic interactions (Ζ) from the slope and the affinity due to non-ionic

21
forces (KD,Non-ionic) from the intercept.
Figure 7. Competitive binding studies showing Scatchard plots of the IAS5 interacting with
AT in the presence of 1 ( ), 5 ( ), and 10 nM ( ) H5. Solid lines represent linear
fit to the data using equation 1. See text for details.
Figure 8. Scatchard plots of the AT interaction with IAS5 in the presence of 1 ( ) and 10
μM ( ) CS. Solid lines represent linear fit to the data using equation 1. See text for
details.
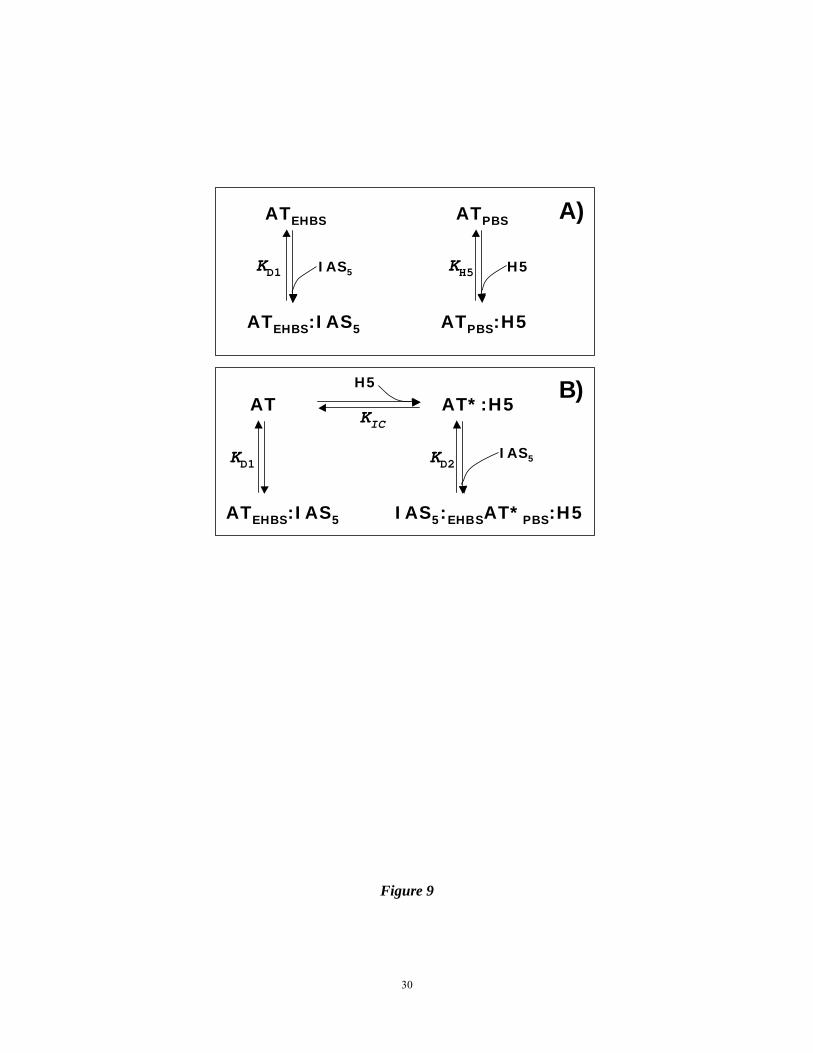
Figure 9. Biochemical models of non-saccharide activator IAS5 binding to AT under various
conditions. Panel A: Two sites – EHBS and PBS – are available in native AT (AT)
for interaction with ligands, such as H5 and IAS5. H5 preferentially interacts with
PBS with binding affinity KH5, while IAS5 prefers EHBS and binds with affinity
KD1, which is ~40 μM. Panel B: The presence of H5 induces activation of native
antithrombin (AT) to its activated state (AT*) generating an additional equilibrium
involving AT*:H5 species. Thus, in the presence of H5, which binds in the PBS,
IAS5 can bind in the EHBS of either native (AT) or activated antithrombin (AT*)
resulting in the formation of ATEHBS:IAS5 or IAS5:EHBSAT*PBS:H5 complexes,
respectively. The affinity of ATEHBS:IAS5 remains unaltered (~40 μM), while the
affinity of IAS5:EHBSAT* was measured to be 2 – 5 μM in 20 mM sodium
phosphate buffer, pH 7.4 at 25 OC. See Discussion section for details.

22
Figure 1
X Y
IAS5 COO¯ OSO3¯
IES5 COOEt OSO3¯
IES4 COOEt H
IAS4 COO¯ H
N
O3SO
O3SO
X
O
YOSO3
O3SO
_
_
__
A)
B)
C)
Heparin Pentasaccharide (H5)
_ _
O
O
CH2OY
NHSO3
OSO3
O
OH
OH
O
COO
O
O
CH2OY
NHSO3
OH
O
OSO3
OH
O
COOO
O
CH2OSO3
NHX
OH
_
_ _
_ _
GlcNp6S GlcAp GlcNp2S,3S IdoAp2S GlcNp2S
1 4 1 4 1 4 1 44 1
EHBS PBS
Lys136Arg133
Lys132
Arg129
Lys125
Lys114
Arg47
Helix D
Helix PHelix A
OO3SO
OSO3
OSO3
OSO3
OSO3
_
__
_
_
CS
X Y
IAS5 COO¯ OSO3¯
IES5 COOEt OSO3¯
IES4 COOEt H
IAS4 COO¯ H
N
O3SO
O3SO
X
O
YOSO3
O3SO
_
_
__
X Y
IAS5 COO¯ OSO3¯
IES5 COOEt OSO3¯
IES4 COOEt H
IAS4 COO¯ H
N
O3SO
O3SO
X
O
YOSO3
O3SO
_
_
__
N
O3SO
O3SO
X
O
YOSO3
O3SO
_
_
__
A)
B)
C)
Heparin Pentasaccharide (H5)
_ _
O
O
CH2OY
NHSO3
OSO3
O
OH
OH
O
COO
O
O
CH2OY
NHSO3
OH
O
OSO3
OH
O
COOO
O
CH2OSO3
NHX
OH
_
_ _
_ _
GlcNp6S GlcAp GlcNp2S,3S IdoAp2S GlcNp2S
1 4 1 4 1 4 1 44 1
Heparin Pentasaccharide (H5)
_ _
O
O
CH2OY
NHSO3
OSO3
O
OH
OH
O
COO
O
O
CH2OY
NHSO3
OH
O
OSO3
OH
O
COOO
O
CH2OSO3
NHX
OH
_
_ _
_ _
GlcNp6S GlcAp GlcNp2S,3S IdoAp2S GlcNp2S
1 4 1 4 1 4 1 44 1
EHBS PBS
Lys136Arg133
Lys132
Arg129
Lys125
Lys114
Arg47
Helix D
Helix PHelix A
OO3SO
OSO3
OSO3
OSO3
OSO3
_
__
_
_OO3SO
OSO3
OSO3
OSO3
OSO3
_
__
_
_
CS
23
Figure 2
0
2
4
6
8
10
12
1 2 3 4 5 6
0.000 mM0.012 mM0.061 mM0.095 mM0.118 mM
0
5
10
15
20
25
1 2 3 4
0.000 mM0.003 mM0.011 mM0.032 mM0.106 mM0.159 mM0.211 mM
A21
4(m
AU) A)
A21
4(m
AU) B)
Time (min)
neutralmarker
neutralmarker
0
2
4
6
8
10
12
1 2 3 4 5 6
0.000 mM0.012 mM0.061 mM0.095 mM0.118 mM
0
5
10
15
20
25
1 2 3 4
0.000 mM0.003 mM0.011 mM0.032 mM0.106 mM0.159 mM0.211 mM
A21
4(m
AU) A)
A21
4(m
AU) B)
Time (min)
neutralmarker
neutralmarker
24
Figure 3
-0.3
-0.25
-0.2
-0.15
-0.1
-0.05
0
-3.5 -2.5 -1.5 -0.5
-0.07
-0.06
-0.05
-0.04
-0.03
-0.02
-0.01
0
-2 -1.5 -1 -0.5 0
Δμep
[L]
Δμep
A)
Δμep
[L]
B)
25
Figure 4
A21
4(m
AU)
Time (min)
0
3
6
9
12
15
2 4 6 8 10
0
3
6
9
12
15
3 4 5 6 7 8 9
0
24
6
810
12
4 6 8 10 12
0
2
4
6
8
3 4 5 6 7 8 9
A)A
214
(mAU
)
B)
C)
D)
0
132575
100
3
0
135225450675
23
750
0
255075
175
13
250
100
750500
736
98
196172
123
75
207
147
0
245
μM
μM
μM
μMA
214
(mAU
)
Time (min)
0
3
6
9
12
15
2 4 6 8 10
0
3
6
9
12
15
3 4 5 6 7 8 9
0
24
6
810
12
4 6 8 10 12
0
2
4
6
8
3 4 5 6 7 8 9
A)A
214
(mAU
)
B)
C)
D)
0
132575
100
3
0
135225450675
23
750
0
255075
175
13
250
100
750500
736
98
196172
123
75
207
147
0
245
μM
μM
μM
μM
26
Figure 5
Δμep
[IAS5]
Δμep
-0.100
-0.075
-0.050
-0.025
0.000
-2.75 -2.25 -1.75 -1.25 -0.75 -0.25
27
Figure 6
log
K D,O
bs(M
)
log [Na+] (M)
-5
-4.5
-4
-3.5
-3
-1.75 -1.5 -1.25 -1 -0.75

28
Figure 7
Δμep
[IAS5]
Δμep
-0.1
-0.08
-0.06
-0.04
-0.02
0
-1.2 -1 -0.8 -0.6 -0.4 -0.2 0

29
Figure 8
Δμep
Δμep
[IAS5]
-0.06
-0.05
-0.04
-0.03
-0.02
-0.01
0.00
-1.2 -1 -0.8 -0.6 -0.4 -0.2 0
30
Figure 9
AT AT*:H5
ATEHBS:IAS5 IAS5:EHBSAT*PBS:H5
KD2KD1
ATEHBS ATPBS
ATEHBS:IAS5 ATPBS:H5
KH5KD1
A)
KIC
IAS5 H5
H5
IAS5
B)