capital and risk management (pillar 3) nordea bank finland group 2009
TRANSCRIPT

Capital and risk management (pillar 3)
Nordea Bank Finland Group 2009

Nordea Bank Finland Group 2009
risk manage Table of Contents
1. INTRODUCTION 4 1.1 Pillar 3 4
2. HIGHLIGHTS OF 2009 5
3. RISK AND CAPITAL MANAGEMENT 6 3.1 Nordea in the capital adequacy context 6 3.2 Risk, liquidity and capital management 6
4. CREDIT RISK 11 4.1 Credit process 11 4.2 Exposures versus lending 15 4.3 Development of exposure 16 4.4 Calculation of RWA 19 4.5 Information about impaired loans and loan losses 27
5. MARKET RISK 31 5.1 Reporting and control process 31 5.2 Measurement methods 32 5.3 Consolidated market risk 33 5.4 Regulatory capital for market risk in the Trading Book 34 5.5 Interest rate risk in the Banking Book 36 5.6 Determination of fair value of financial instruments 36
6. OPERATIONAL RISK 38 6.1 Overall description and definition of operational risk 38 6.2 Operational Risk Management and the operating model 38 6.3 Key processes 39 6.4 Key reports 40 6.5 Capital 40
7. DERIVATIVES AND SECURITISATION 41 7.1 Risk in derivatives 41 7.2 Special Purpose Entities and securitisations 44
8. LIQUIDITY RISK AND STRUCTURAL INCOME INTEREST RISK 46 8.1 Liquidity management 46 8.2 Structural Interest Income Risk (SIIR) 47
9. ICAAP 49 9.1 The process 49 9.2 Components of ICAAP 50 9.3 Conclusion of ICAAP and SREP 54
10. CAPITAL BASE COMPONENTS 55 10.1 Tier 1 capital 56 10.2 Tier 2 capital 58
11. CAPITAL ADEQUACY CONCLUSIONS 60 11.1 Capital policy 60 11.2 Regulatory capital requirement 60 11.3 Capital ratios 61
12. APPENDIX 62 12.1 General description of pillar 1, 2 and 3 62 12.2 Financial stability plan in Finland 64 12.3 Exposure classes for Credit risk 64

Nordea Bank Finland Group 2009
12.4 Difference between EC and regulatory capital requirement 66
LIST OF ABBREVIATIONS 68

Nordea Bank Finland Group 2009
4
1. Introduction
This is Nordea Bank Finland Group’s report on capital and risk management in accor-dance with the legal disclosure requirements in EU’s Capital Requirements Directive (CRD). The CRD is based on the Basel II framework issued by the Basel Committee on Banking Supervision. A general description of the three pillars in the Basel II framework is available in the appendix, section 12.1. This report presents the capital position and how the size and composition of the capital base is related to the risks as measured in risk-weighted amounts (RWA). 1.1 Pillar 3 Pillar 3 sets the rules for the disclosure of capital and risk management. The Nordea Bank Finland Group follows the Finnish Act on credit institutions and the Finnish financial supervisory authority’s standards 4.5 Supervisory disclosure of capital adequacy informa-tion and 4.1 Establishment and maintenance of internal control and risk management, which are based on the CRD. Furthermore, the disclosures are made in accordance with Nordea’s internal policy and instructions for disclosing information on capital adequacy in the Nordea Group. In this report, Nordea discloses a description of the different risk types in its balance sheet as well as off balance sheet risk and the management of the risk and capital in accordance with the pillar 3 rules. The presentation follows the structure below:
• Highlights of 2009 • Risk and capital management • Credit risk • Market risk • Operational risk • Derivatives and securitisation • Liquidity risk and Structural Interest Income Risk (SIIR) • Internal Capital Adequacy Assessment Process (ICAAP) • Capital base components • Capital adequacy conclusions
Further disclosure of risk, liquidity and capital management is presented in the annual report in accordance with the international financial reporting standards, IFRS. The pillar 3 disclosure is made for the Nordea Group and for the subgroups Nordea Bank Danmark Group, Nordea Bank Finland Group and Nordea Bank Norge Group as well as Nordea Bank Polska S.A. This report for the Nordea Bank Finland Group is presented on www.nordea.com and the key data on capital adequacy is presented in the annual report of the entity. The full pillar 3 disclosure is made annually and the periodic information is published semi annually, included in the semi annual report for the entity. The format, frequency and content of the disclosures follow, to as large extent as possible with regards to the local legislation, a common setup in Nordea Group. Group Corporate Centre has stated the common principles in a policy and instructions for disclosing information on capital adequacy in the Nordea Group. The Board of Directors in Nordea Bank Finland has also approved a policy regarding pillar 3 disclosure. In this report, Nordea Bank Finland Group is defined as Nordea.

Nordea Bank Finland Group 2009
5
2. Highlights of 2009
2009 has been another challenging and extreme year in the global financial market. The financial crisis continued from the year before and was during the first half of year deep-ened by the macroeconomic downturn, globally and in the Nordic countries. Uncertainty and risks have been significant both in the financial markets and about the macroeco-nomic development. Nordea (Nordea Bank Finland) is part of the Nordea Group, which has presented a strong result in 2009 despite the financial crisis. The Nordea Group is confident and well prepared for the future due to strong profitability, high quality in the credit portfolio, strong capital base and a diversified funding base. Strong risk management and stable risk development Credit risk management has remained in focus and the development of the credit portfo-lio, the impairment and net loan losses have continued to stabilise. Credit risk is the larg-est risk comprising approximately 90% of the total RWA. The credit quality development and loan losses is in line with the expectations of the slowdown in the financial markets and Nordea works actively to monitor the develop-ment of the portfolio giving special attention to weak performing customers. Capital management well established - strengthened core capital In order to remain among the strongest banks in the European peer group, the Nordea Group strengthened its core capital in a rights issue and with a reduced dividend payout in the beginning of 2009. Nordea (i.e. Nordea Bank Finland) has basically a strong capital position, based on predominant form of tier 1 capital and only a limited part of additional tier 2 capital in form of undated, subordinate loans.The financial turmoil has increased the focus on banks’ internal capital evaluation processes and their capability to asses the sol-vency need to cover losses and other cyclicality effects that arise in an economic down-turn. Finanssivalvonta agreed that Nordea Bank Finland and its legal entities were ade-quately capitalised given its risk profile and portfolio, in accordance with the 2009 ICAAP and Supervisory Review and Evaluation Process (SREP). New regulations for capital and liquidity risk Following the financial crisis, the revision and extension of the regulatory frameworks is characterising the banking industry. It is a strong focus on risk and capital management within the organisation and to meet new regulatory demands. The Nordea Group is well prepared for new capital and liquidity regulations.

Nordea Bank Finland Group 2009
6
3. Risk and capital management
In this chapter, the consolidation principles for the capital base within Nordea are de-scribed as well as the principles for management and control of risk and capital.
3.1 Nordea in the capital adequacy context The financial statements are published semi annually and the consolidated financial statements include the accounts of the parent company Nordea Bank Finland Plc, with corporate registration number 1680235-8, including subsidiaries according to IAS 27. According to the requirements in the CRD, insurance companies and associated undertak-ings with financial operations are deducted from the capital base in the capital adequacy reporting. Table 1 includes information of what undertakings that have been consolidated and deducted from the capital base. Table 1Specification over group undertakings consolidated/deducted from the Nordea Finland, 31 December 2009
Number of sharesBook value EURm
Voting power of holding % Domicile
Consolidation method
Group undertakings included in the Nordea Bank Finland GroupNordea Finance Finland Ltd 1,000,000 306 100.0 Espoo purchase methodSIA promano Lat 10 100.0 Riga purchase methodOü Promano Est 10 100.0 Tallinn purchase methodUAB Promano Lit 10 100.0 Vilnius purchase methodOther companies 2 purchase methodTotal included in Nordea Bank Finland Group 338
Over 10 % investments in credit institutions deducted from the capital base Luottokunta 42 24 HelsinkiNF Fleet 1 20 EspooOther 1Total investments in credit institutions deducted from the capital base 44
3.2 Risk, liquidity and capital management Risk, liquidity and capital management are key success factors in the financial services industry. Exposure to risk is inherent in providing financial services, and Nordea assumes a variety of risks in its ordinary business activities, the most significant being credit risk related to loans. Maintaining risk awareness in the organisation is a key component of Nordea’s business strategies. Nordea has clearly defined risk, liquidity and capital management frameworks, including policies and instructions for different risk types and for the capital structure. 3.2.1 Management principles and control
Board of Directors The Board of Directors of Nordea Group has ultimate responsibility for limiting and monitoring the Group’s risk exposure. The Board of Directors also has ultimate responsibility for setting the targets for the capi-tal ratios. Risk in Nordea is measured and reported according to common principles and policies approved by the Board of Directors. The Board of Directors decides on policies for credit, market, liquidity, operational risk management and the internal capital ade-quacy assessment process. All policies are reviewed at least annually.

Nordea Bank Finland Group 2009
7
In the credit instructions, the Board of Directors decides on powers-to-act for credit committees at different levels within the customer areas in Nordea. Authorisations may also vary depending on the internal rating of customers. The Board of Directors also decides on the limits for market and liquidity risk in the Group. Board Credit Committee The Board Credit Committee monitors the development of the credit portfolio on the whole as well as with respect to industry and major customer exposures. The Board Credit Committee confirms industry policies approved by the Executive Credit Commit-tee (ECC). CEO and GEM The Chief Executive Officer (CEO) has overall responsibility for developing and main-taining effective principles for risk, liquidity and capital management as well as internal principles and control in Nordea. The Group CEO in Group Executive Management (GEM) decides on the targets for the Group’s risk management regarding Structural Interest Income Risk (SIIR) and, in accor-dance with the scope of resolutions adopted by the Board of Directors. The setting of limits is guided by Nordea's business strategies, which are reviewed at least annually. The heads of the units allocate the respective limits within the unit and may introduce more detailed limits and other risk mitigating techniques such as stop loss rules. The CEO and GEM regularly review reports on risk exposures and have established the following committees for risk, liquidity and capital management: • The Asset and Liability Committee (ALCO), chaired by the Chief Financial Officer (CFO), prepares issues of major importance concerning the Group’s financial operations, financial risks and capital management for decision by the CEO in GEM. • Capital Planning Forum, chaired by the CFO, monitors the development of internal and regulatory capital requirements, the capital base, and decides also upon capital planning activities within the Group. • The Risk Committee, chaired by the Chief Risk Officer (CRO), monitors developments of risks on an aggregated level. • The Executive Credit Committee (ECC) and Group Credit Committee (GCC), chaired by the CRO, decide on major credit risk limits and industry policies for the Group. Credit risk limits are granted as individual limits for customers or consolidated customer groups and as industry limits for certain defined industries. The CRO has the authority, where deemed necessary, to issue supplementary guidelines and limits. CRO and CFO Within the Group, two units, Group Credit and Risk Control and Group Corporate Centre, are responsible for risk, capital, liquidity and balance sheet management. Group Credit and Risk Control is responsible for the risk management framework, con-sisting of policies, instructions and guidelines for the whole Group. Group Corporate Centre is responsible for the capital management framework including required capital as

Nordea Bank Finland Group 2009
8
well as the capital base. Group Treasury, within Group Corporate Centre, is responsible for SIIR and liquidity risk. The CRO is head of Group Credit and Risk Control and the CFO is head of Group Corpo-rate Centre. The CRO is responsible for the Group’s credit, market and operational risk. This includes the development, validation and monitoring of the rating and scoring systems, as well as credit policy and strategy, credit instructions, guidelines to the credit instructions as well as the credit decision process and the credit control process. The CFO is responsible for the capital planning process, which includes capital adequacy reporting, economic capital and parameter estimation used for the calculation of RWA and for liquidity and balance sheet management. Each customer area and product area is primarily responsible for managing the risks aris-ing from its operations. This responsibility entails identification, control and reporting, while Group Credit and Risk Control consolidates and monitors the risks on Group level and relevant sub levels.
3.2.2 Different risk types
There are different risk types which are described more in detail below in accordance with how they are structured within CRD. Risk in pillar 1 In pillar 1, which forms the base for the capital requirement, there are three risk types: credit, market and operational risk.
• Credit risk is the risk of loss if counterparts of Nordea fail to fulfil their agreed obligations and that the pledged collateral does not cover Nordea’s claims. The credit risk in Nordea arises mainly from various forms of lending but also from guarantees and documentary credits, such as letters of credit. Furthermore, credit risk includes counterparty risk which is the risk that Nordea’s counterpart in a foreign exchange, interest rate, commodity, equity or credit derivative contract defaults prior to maturity of the contract and Nordea at that time has a claim on the counterpart. The measurement of credit risk is based on the parameters; PD, Loss Given Default (LGD) and Credit Conversion Factor (CCF).
• Market risk is the risk of loss in the market value of portfolios and financial in-
struments, also known as market price risk, as a result of movements in financial market variables. The market price risk exposure in Nordea relates primarily to interest rates and equity prices and to a lesser degree to foreign exchange rates and commodity prices. For all other activities, the basic principle is that market risk is eliminated by matching assets, liabilities and off balance sheet items.
• Operational risk is defined as the risk of direct or indirect loss, or damaged repu-
tation resulting from inadequate or failed internal processes, from people and sys-tems, or from external events. Legal and compliance risk as well as crime risk, project risk and process risk, including IT risk, constitute the main sub categories to operational risk.

Nordea Bank Finland Group 2009
9
Risk in pillar 2 In pillar 2 other risk types are measured and assessed. These are managed and measured although they are not included in the calculation of the minimum capital requirements. In the calculation of EC most of the pillar 2 risk is included. Examples of pillar 2 risk types are liquidity risk, business risk, interest rate risk in the non-trading book and concentra-tion risk:
• Liquidity risk is the risk of being able to meet liquidity commitments only at increased cost or, ultimately, being unable to meet obligations as they fall due. The liquidity risk management focuses on both short-term liquidity risk and long-term structural liquidity risk. The liquidity risk management includes a business continuity plan and stress testing for liquidity management. In order to measure the exposure, a number of liquidity risk measures have been developed.
• Business risk represents the earnings volatility inherent in all business due to the
uncertainty of revenues and costs due to changes in the economic and competi-tive environment. Business risk in the EC framework is calculated based on the observed volatility in historical profit and loss that is attributed to business risk.
• Interest rate risk in the non-trading book consists of exposures deriving from the
balance sheet (mainly lending to public and deposits from public) and from hedg-ing the equity capital of the Group. The interest rate risk inherent in the non-trading book is measured in several ways on a daily basis and in accordance with the financial supervisory authorities’ requirements. The market risk in invest-ment portfolios includes equity, interest rate, private equity, hedge fund and FX risk and is included as market risk in the EC framework.
• Pension risk is included in market risk EC and includes equity, interest rate and
FX risk in Nordea sponsored defined pension plans.
• Real estate risk consists of exposure to owned and leased properties and is in-cluded in the market risk EC.
• Concentration risk is the credit risk related to the degree of diversification in the
credit portfolio, i.e. the risk inherent in doing business with large customers or not being equally exposed across industries and regions. The concentration risk is measured by comparing the output from a credit risk portfolio model with the risk weight functions used in calculating RWA. The concentration risk is included in the EC framework.
3.2.3 Monitoring and reporting
The control environment in Nordea is based on the principles of separation of duties and strict independence of organisational units. Monitoring and reporting of risk is conducted on a daily basis for market and liquidity risk, on a monthly and quarterly basis for credit risk and on a quarterly basis for operational risk. Risk reporting is regularly made to Group Executive Management and to the Board of Directors. The Board of Directors in each legal entity reviews internal risk reporting cov-ering market, credit and liquidity risk per legal entity. Within the credit risk reporting, different portfolio analyses such as credit migration, current probability of default and stress testing are included.

Nordea Bank Finland Group 2009
10
The internal capital reporting includes all types of risks and is reported regularly to the Risk Committee, ALCO, Capital Planning Forum, Group Executive Management and Board of Directors. Group Internal Audit makes an independent evaluation of the processes regarding risk and capital management in accordance with the annual audit plan.

Nordea Bank Finland Group 2009
11
4. Credit risk
Credit risk is the largest risk comprising 90% of the total RWA. The information in this chapter is disclosed in several dimensions aiming to give an in depth view of the distribu-tion of the credit portfolio in different exposure classes, geography, industries, risk weights etc. In appendix 12.3 the definition of exposure classes and calculation principles of credit risk RWA in pillar 1 can be found.
4.1 Credit process 4.1.1 Roles and responsibilities in credit risk management
Group Credit and Risk Control is responsible for the credit risk management framework, consisting of policies, instructions and guidelines for the Nordea Group. Each customer area and product area is primarily responsible for managing the credit risks in its operations, while Group Credit and Risk Control consolidates and monitors the credit risks on both Group and sub levels. Within the powers-to-act granted by the Board of Directors, credit risk limits are ap-proved by decision-making authorities on different levels in the organisation (see figure 1). The responsibility for a credit exposure lies with a customer responsible unit. Customers are assigned a rating or score in accordance with the Nordea framework for quantification of credit risk. Figure 1: Credit decision-making structure
Nordea - Board of Directors/Board Credit CommitteePolicy matters/Instructions/Monitoring
Nordea Bank DenmarkBoard of Directors
Nordea Bank FinlandBoard of Directors
Reporting
Nordea Bank NorwayBoard of Directors
Reporting
Executive Credit Committee
Nordic Banking Country Credit
Committee
RegionDecision-making
Authority
BranchDecision-making
Authority
Trade and Project Finance
Credit Committee
Financial Institutions
Credit Committee
Shipping, Oil Services
&International
Credit Committee
New European Markets
Credit Committee
Group Credit Committee
4.1.2 Credit risk identification
Credit risk is defined as the risk of loss if counterparts of Nordea fail to fulfil their agreed obligations and that the pledged collateral does not cover Nordea’s claims. The credit

Nordea Bank Finland Group 2009
12
risks in Nordea stem mainly from various forms of lending to the public (corporates and household customers), but also from guarantees and documentary credits, such as letters of credit. The credit risk from guarantees and documentary credits arises from the poten-tial claims on customers, for which Nordea has issued guarantees or documentary credits. Credit risk may also include counterparty risk, transfer risk and settlement risk. Counter-party risk is the risk that Nordea’s counterpart in an FX, interest rate, commodity, equity or credit derivatives contract defaults prior to maturity of the contract and that Nordea at that time has a claim on the counterpart. Settlement risk is the risk of losing the principal on a financial contract, due to a counter-part's default during the settlement process. Transfer risk is a credit risk attributable to the transfer of money from another country where a borrower is domiciled, and is affected by changes in the economic and political situation of the countries concerned. Concentration risk in specific industries is followed by industry monitoring groups and managed through specific industry credit policies which are established for industries where at least two of the following criteria are fulfilled:
• Significant weight in the Nordea portfolio • High cyclicality and/or volatility of the industry • Special skills and knowledge required
There is usually a cap set for the Group’s total exposure in such an industry. All industry credit policies are approved by the Executive Credit Committees and confirmed annually by the Board Credit Committee. Corporate customers’ environmental risks are also taken into account in the overall risk assessment through the so-called Environmental Risk Assessment Tool. This tool is cur-rently being extended to also include assessment of social and political risk. For larger project finance transactions, Nordea has adopted the Equator Principles, which is a financial industry benchmark for determining, assessing and managing social and environmental risk in project financing. The Equator Principles are based on the policies and guidelines of the World Bank and International Finance Corporation (IFC). 4.1.3 Decisions and monitoring of credit risk
Decisions regarding credit risk limits for customers and customer groups are made by the relevant credit decision authorities on different levels within the Group. The responsibil-ity for credit risk lies with the customer responsible unit, which on an ongoing basis as-sesses customers’ ability to fulfil their obligations and identifies deviations from agreed conditions and weaknesses in the customers’ performance. In addition to building strong customer relationships and understanding each customer's financial position, monitoring of credit risk is based on all available information about the customer and macroeconomic circumstances. Information such as late payments data, behavioural scoring and rating migration are important parameters in the internal monitoring process. If new information indicates the need, the customer responsible unit must reassess the rating and assess whether the customer’s repayment ability is threatened. If it is considered unlikely that the customer will be able to repay its debt obligations, for example the principal, interest, or fees, and the situation cannot be satisfactorily remedied, the customer must be tested for impairment.
In case credit weakness is identified in relation to a customer exposure, such exposure is assigned special attention in terms of review of the risk. In addition to continuous moni-toring, an action plan is established outlining how to minimise a potential credit loss. If necessary, a special team is set up to support the customer responsible unit. Nordea has a

Nordea Bank Finland Group 2009
13
project organisation for handling work-out corporate customers. Individual deal-teams including relevant specialists are established for larger work-out cases. The credit organi-sation and other specialist units support customer responsible units in handling smaller work out customers. The follow-up of individual work-out cases is part of the quarterly risk review process. In this process the impairment of individual customers and customer groups is assessed and the actions related to handling of work-out customers are reviewed and followed up. 4.1.3.1 Collateral policy and documentation Local instructions emphasise that national practice and routines are timely and prudent in order to ensure that collateral items are controlled by the bank and that the loan and pledge agreement as well as the collateral is legally enforceable. Thus the bank holds the right to liquidate collateral in event of the obligor’s financial distress and the bank can claim and control cash proceeds from a liquidation process. To a large extent national standard loan and pledge agreements are used, ensuring legal enforceability. 4.1.3.2 Types of collateral commonly accepted The following collateral types are most common in Nordea:
• Residential real estate, commercial real estate and land which are situated in Nor-dea’s core markets.
• Other physical assets such as machinery, equipment, vehicles, vessels, aircrafts and trains
• Inventory, receivables (trade debtors) and assets pledged under floating charge • Financial collateral such as listed shares, listed bonds and other specific securities • Deposits • Guarantees and letters of support • Insurance policies (capital assurance with surrender value)
For each type, more specific instructions are added to the general valuation principle. A specific maximum collateral ratio is set for each type. Restrictions for acceptance refer in general to assessment of the collateral value rather than the use of the collateral for credit risk mitigation as such. In the RWA calculations, the collaterals must fulfil certain eligi-ble criteria. In addition to that haircuts, volatility and maturity adjustments are applied depending on type of credit risk mitigant. Covenants in credit agreements do not substitute collaterals but may be of great help as a complement to both secured and unsecured exposure. All exposure of substantial size and complexity includes appropriate covenants. Financial covenants are designed to react on early warning signs and are followed up carefully. 4.1.3.3 The credit decision process and handling of collateral Credit risk measures are part of the approval in the credit decision process. Each corpo-rate and institution customer is reviewed at least annually in the annual review process. Each credit exposure is reviewed at least annually in the annual review of the customer. Furthermore, for some customers who have been assessed to have a high risk of default, an even more detailed review takes place in order to ensure an actual valuation and legal enforceability of collateral. Business and credit strategies towards the customer or cus-tomer group are also reviewed in detail.

Nordea Bank Finland Group 2009
14
4.1.4 Credit risk appetite
Nordea has defined its credit risk appetite as an expected loan loss level of 25 basis points over the cycle. Net loan losses over the past years show an average not exceeding this level. 4.1.5 Rating and scoring
The common denominator of the rating and scoring is the ability to predict defaults and rank customers according to their default risk. They are used as integrated parts of the credit risk management and decision-making process, including:
• The credit approval process • Calculation of Risk Weighted Assets (RWA) • Calculation of EC and Expected Loss (EL) • Monitoring and reporting of credit risk • Performance measurement using the Economic Profit (EP) framework • Collective impairment assessment
While rating is used for corporate and institution exposure, scoring is used for retail expo-sure. A rating is an estimate that exclusively reflects the quantification of the repayment capac-ity of the customer, i.e. the risk of customer default. The rating scale in Nordea consists of 18 grades from 6+ to 1- for non-defaulted customers and 3 grades from 0+ to 0- for defaulted customers. The repayment capacity of each rating grade is quantified by a one year PD. Rating grades 4– and better are comparable to investment grade as defined by external rating agencies such as Moody’s and Standard & Poor (S&P). Rating grades 2+ and lower are considered as weak or critical, and require special attention. The risk grade master scale used for scored customers in the Retail portfolio consists of 18 grades, named A+ to F-. In table 2, the mapping from the internal rating scale to the S&P’s rating scale, using condensed scales, is shown. Table 2
InternalStandard &
Poor’s 6+, 6, 6- AAA to AA5+, 5, 5- A4+, 4, 4- BBB3+, 3, 3- BB2+, 2, 2- B1+, 1, 1- CCC to C0+, 0, 0- D
Rating
Indicative mapping between internal rating and Standard & Poor’s
The mapping of the internal ratings to the S&P’s rating scale is based on a predefined set of criteria, such as comparison of default and risk definitions. The mapping does not in-tend to indicate a fixed relationship between Nordea’s internal rating grades and S&P’s rating grades since the rating approaches differ. On a customer level the mapping does not always hold and, moreover, the mapping may change over time.
Nordea Bank Finland Group 2009
15
Ratings are assigned in conjunction with credit proposals and the annual review of the customers, and approved by the credit committees. However, a customer is downgraded as soon as new information indicates a need for it. The consistency and transparency of the ratings are ensured by the use of rating models. A rating model is a set of specified and distinct rating criteria which, given a set of customer characteristics, produces a rat-ing. It is based on the fact that it is possible to predict the future performance of custom-ers on the basis of their characteristics. Nordea has decided upon a differentiation of rating models in order to better reflect the risk involved for customers with different characteristics. Hence, rating models have been developed for a number of general as well as specific segments, e.g. real estate manage-ment and shipping. Different methods ranging from purely statistical, using internal data to expert-based methods, depending of the segment in question, have been used when developing the rating models. The models are in general based on an overall framework, in which financial and quantitative factors are combined with qualitative factors. Scoring models are pure statistical methods to predict the probability of customer default. The models are used in the household segment as well as for small corporate customers. Bespoke behavioural scoring models, developed on internal data, are used to support both the credit approval process, e.g. automatic approvals or decision support, and the risk management process, e.g. ”early warning” for high risk customers and monitoring of portfolio risk levels. As a supplement to the behavioural scoring models also bureau in-formation is used in the credit process. The internal behaviour scoring models are used to identify the PDs, in order to calculate the EC and RWA for customers. During 2009, the scorecards have been adjusted in order to improve the risk differentiation. Nordea has established an internal validation process in accordance with the CRD re-quirements with the purpose of ensuring and improving the performance of the models, procedures and systems and to ensure the accuracy of the PD estimates. The rating and scoring models are validated annually and the validation includes both a quantitative and a qualitative validation. The quantitative validation includes e.g. statisti-cal tests of the models’ discriminatory power, i.e. the ability to distinguish default risk on a relative basis, and cardinal accuracy, i.e. the ability to predict the level of defaults.
4.2 Exposures versus lending The credit process is essential in verifying that lending is given to solid counterparts. In IFRS the term lending is used, whereas exposures are used in the CRD. For several rea-sons the principles for how these terms are used differs. In both disclosures the items booked in the balance sheet on and off balance are included but presented in different ways. The main differences will be outlined in this section clarifying and highlighting the bridge between the information presented in the balance sheet in the Annual report and this report. A detailed definition of exposure classes used in the capital adequacy calcula-tions can be found in appendix 12.3. Tables containing exposure are presented as Exposure At Default (EAD) for IRB expo-sures and Exposure value for Standardised exposures if nothing else is stated. It is based on the exposure amount that the RWA is calculated. This amount differ from the original exposure that is exposure before taking into account substitution effects stemming from credit risk mitigation and credit conversion factors for off balance exposures.

Nordea Bank Finland Group 2009
16
4.2.1 Differences as regards to classification of exposure
The main differences and the effect on comparisons between the exposures are presented below.
• The exposure distributions by industry and by geography are in this report pre-sented for the entire credit portfolio, whereas in the financial reporting, these dis-tributions are presented for loans, being the main part of the on balance sheet ex-posure.
• Treasury bills and interest-bearing securities are in this report partly included in the capital requirements for market risk, whereas in the financial reporting, these are included in the credit risk exposure.
• Reversed repurchase agreements are in this report included as a separate exposure type, whereas in the financial reporting, these are included in the on balance sheet item loans to the public and credit institutions or as off balance.
• In the financial reporting corporate loans consist of the on balance sheet exposure in the Corporate exposure class as well as smaller part of the Retail exposure class (non-rated SMEs).
• Equity holdings related to insurance operations are included in the annual report, but excluded in this report since the insurance operations are deducted from the capital base based on the fact that insurance companies are subject to specific solvency regulations.
• Intangible assets and deferred taxes are deducted from the capital base and are therefore not included in the RWA calculations. In the financial reporting these items are included in the balance sheet.
The credit risk exposure in this report is presented distributed by exposure class, where each exposure class is distributed into the following different exposure types:
• On balance sheet items • Off balance sheet items (e.g. guarantees and unutilised amounts of credit facili-
ties) • Securities financing (e.g. reversed repurchase agreements) • Derivatives
In the annual report, the credit risk exposure includes:
• On balance sheet items: loans to credit institutions and loans to the public, includ-ing reversed repurchase agreements
• Off balance sheet items (e.g. guarantees and unutilised amounts of credit facili-ties)
• Derivatives (positive fair value) • Treasury bills and interest-bearing securities
4.3 Development of exposure Throughout this chapter, the credit risk exposure is presented based on definitions and approaches used in the calculation of capital requirement. In June 2007, Nordea received approval by the financial supervisory authorities to use FIRB approach for corporate and institution exposure classes in Finland. In December 2008, Nordea was approved of using the IRB approach for the main part of Retail exposure class in Finland (with the exception for the Finance company that was not applied for). Exposures from foreign branches and small subsidiaries apply the Standardised approach.

Nordea Bank Finland Group 2009
17
Nordea Group aims to continue the roll-out of the IRB approaches. The main focus is the development of advanced IRB for corporate customers in the Nordic area, including in-ternal estimates of LGD and CCF. The standardised approach will continue to be used for smaller portfolios and new portfo-lios for which approved internal models are not yet in place. An overview of the roll-out plan is displayed below in figure 2. Figure 2: General roll out plan
4.3.1 Exposure type by exposure class
In table 3, the exposures as of 31 December 2009 are split by exposure classes and expo-sure types. The table is split between exposure classes subject to the IRB approach and exposure classes subject to the standardised approach. Table 3Exposure classes split by exposure type, 31 December 2009EURm On balance sheet items Off balance sheet items Securities financing Derivatives TotalIRB exposure classesInstitutions 4,109 1,179 0 19,283 24,571Corporates 17,734 11,317 1 6,440 35,492Retail 26,950 2,709 43 29,702 - of which mortgage 22,055 63 22,118 - of which other retail 4,195 2,454 21 6,670 - of which SME 700 192 22 914Other non-credit obligation assets 263 12 2 277Total IRB approach 49,056 15,217 1 25,767 90,042
Standardised exposure classesCentral governments and central banks 13,372 319 930 14,621Regional governments and local authorities 1,472 111 532 2,115Institutions 59,325 278 24 1,182 60,809Corporates 9,976 2,366 12,342Retail 5,675 102 0 5,777Exposures secured by real estate 410 0 410Other1 1,597 16 30 1,643Total standardised approach 91,828 3,192 24 2,674 97,717
Total exposure 140,884 18,409 25 28,441 187,759
1Administrative bodies and non-commercial undertakings, multilateral developments banks, past due items, short-term claims, covered bonds and other items.
Standardised StandardisedOperational Risk
Foundation IRB
Foundation IRB
IRB
Advanced IRB
Foundation IRB
IRB
Credit Risk
Institution
Corporate
Retail
2009/2010 2011/2012
VaR / Standardised VaR / StandardisedMarket Risk
Standarised StandarisedSovereign
Standarised StandarisedEquity

Nordea Bank Finland Group 2009
18
In table 4, the average exposure during 2009 is presented. Table 4Exposure classes split by exposure type, Average exposure during 2009Average exposureEURm On balance sheet items Off balance sheet items Securities financing Derivatives TotalIRB exposure classesInstitutions 3,270 1,105 16 18,358 22,749Corporates 19,392 11,253 1 7,560 38,205Retail 26,206 2,664 65 28,936 - of which mortgage 21,345 60 21,405 - of which other retail 4,128 2,404 43 6,574 - of which SME 734 200 23 957Other non-credit obligation assets 208 7 0 216Total IRB approach 49,076 15,030 17 25,983 90,106
Standardised exposure classesCentral governments and central banks 8,898 233 753 9,885Regional governments and local authorities 1,462 104 532 2,098Institutions 50,549 558 27 1,301 52,435Corporates 10,947 2,520 0 13,467Retail 5,581 175 0 5,756Exposures secured by real estate 402 13 416Other1 824 8 20 853Total standardised approach 78,663 3,613 27 2,606 84,909
Total exposure 127,739 18,642 44 28,590 175,0151Administrative bodies and non-commercial undertakings, multilateral developments banks, past due items, short-term claims, covered bonds and other items. 4.3.2 Exposure by geography
In table 5, exposures as of end December 2009 are split by main geographical areas, based on where the credit risk is booked. Table 5Exposure split by geography and exposure classes, 31 December 2009
EURm Institutions CorporatesRetail
mortgage Other retail
Central governments and
central banks
Regional governments and local authorities Institutions Corporates Retail
Exposures secured by real estate Other1
Nordic countries 24,571 35,492 22,624 7,078 13,049 2,017 56,975 85 3,051 410 1,412of which Denmarkof which Finland 24,571 35,492 22,624 7,078 13,049 2,017 56,975 85 3,051 410 1,412of which Norwayof which Sweden
Baltic countries 968 97 403 4,746 2,621 282Poland 0 57 0RussiaOther 604 3,431 7,453 106 226Total exposure 24,571 35,492 22,624 7,078 14,621 2,115 60,809 12,342 5,777 410 1,920
Internal Rating Based approach Standardised approach
1 Administrative bodies and non-commercial undertakings, multilateral developments banks, past due items, short term claims, covered bonds and other items. From F IRB other non-credit obligation assets.
Nordea Bank Finland Group 2009
19
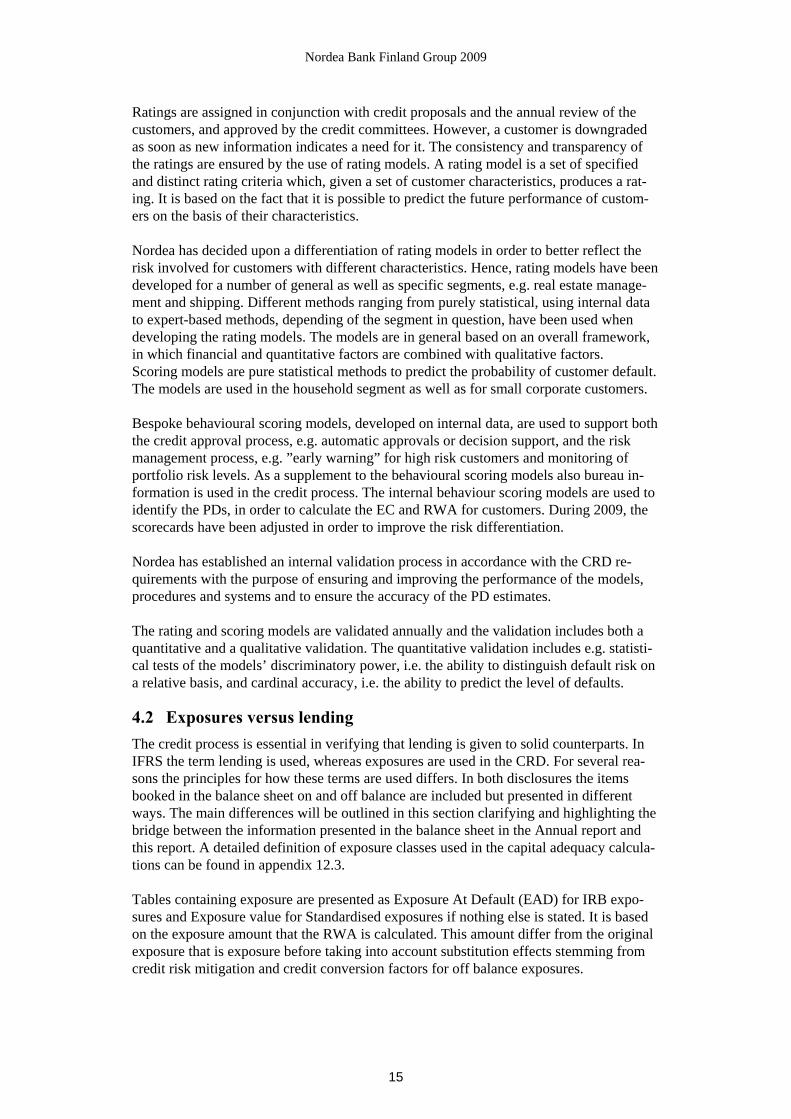
4.3.3 Exposure by industry
In table 6, the exposure as of 31 December 2009 is split by important industries and by the main exposure classes. Table 6Exposure split by industry group, 31 December 2009
EURm Institutions Corporates Retail Other
Central governments and
central banks
Regional governments
and local authorities Other1
Retail mortgage 22,118 410Other retail 6,670 5,777Central and local governments 6,058 2,115 0Banks 16,701 8,563 60,388Construction and engineering 1,435 112 353Consumer durables (cars, appliances etc) 1,054 20 398Consumer staples (food, agriculture etc) 1,980 39 703Energy (oil, gas etc) 667 1 198Health care and pharmaceuticals 399 34 133Industrial capital goods 2,406 11 108Industrial commercial services 2,715 118 250IT software, hardware and services 525 16 275Media and leisure 646 89 141Metals and mining materials 435 3 67Paper and forest materials 1,536 9 69Real estate management and investment 6,430 110 1,241Retail trade 2,749 196 561Shipping and offshore 1,362 3 2,671Telecommunication equipment 362 1 2Telecommunication operators 816 1 104Transportation 850 61 432Utilities (distribution and production) 2,768 5 519Other financial companies 7,870 2,621 16 1,306Other materials (chemical, building materials etc) 2,782 43 394Other 954 25 277 4,481Total exposure 24,571 35,492 29,702 277 14,621 2,115 80,982
Internal rating based approach Standardised approach
1 Administrative bodies and non-commercial undertakings, multilateral developments banks, standardised institution, standardised corporate, standardised retail, standardised exposures secured by real estates, past due items, short term claims, covered bonds and other items. 4.3.4 Equity holdings
In the exposure class “Other items”, Nordea’s equity holdings outside the trading book are included. Investments in companies where Nordea holds over 10% of the capital are deducted from the capital base (see table 1) and hence not included in the “other items”. In table 7, Nordea’s equity holdings outside the trading book are grouped based on the intention of the holding. In the investment portfolio, holdings in private equity funds are included with EUR 7m. All equities in the table are booked at fair value. The evidence of published price quotations in an active market is the best evidence of fair value and when they exist they are used to measure the value of financial assets and financial liabilities. For equities with no published price quotations, internal valuation techniques are used to establish fair value. The table below shows to what extent published price quotations are used. Table 7 Equity holding outside trading book, 31 December 2009
Unrealised Realised Capital EURm Book value Fair value gains/losses gains/losses requirementInvestment portfolio 1) 10 10 -5 0 1Other 2) 13 13 3 0 1Total 23 23 -2 0 2
1) Of which listed equity holdings 02) Of which listed equity holdings 3
4.4 Calculation of RWA The risk weight and exposure calculations in Nordea differ between approaches but also depending on the exposure classes within IRB approach. In table 8, the original exposure, exposure, average risk weight expressed as percentages, RWA and capital requirement,

Nordea Bank Finland Group 2009
20
are distributed by exposure class, which serves as the basis for the reporting of capital requirements to the authorities. In this report the IRB exposure classes that Nordea has been approved for are presented. For the remaining portfolios the standardised approach exposure classes are used. Some exposure classes have been merged in the table, due to low exposures in these exposure classes. Table 8Capital requirement for credit risk, 31 December 2009EURm Original
exposure ExposureAverage risk
weight RWACapital
requirementIRB exposure classesInstitutions 27,115 24,571 26% 6,460 517Corporates 70,729 35,492 60% 21,338 1,707Retail 31,515 29,702 14% 4,301 344 - of which mortgage 22,420 22,118 9% 1,931 154 - of which other retail 7,976 6,670 28% 1,846 148 - of which SME 1,119 914 57% 524 42Other non-credit obligation assets 311 277 100% 277 22Total IRB approach 129,669 90,042 36% 32,375 2,590
Standardised exposure classesCentral government and central banks 12,390 14,621 3% 481 39Regional governments and local authorities 3,453 2,115 2% 34 3Institutions 62,120 60,809 23% 13,894 1,112Corporates 15,815 12,342 100% 12,342 987Retail 9,971 5,777 75% 4,333 347Exposures secured by real estate 448 410 35% 144 11Other1 1,849 1,643 57% 937 75Total standardised approach 106,045 97,717 33% 32,165 2,573
Total 235,714 187,759 34% 64,540 5,1631 Administrative bodies and non-commercial undertakings, multilateral developments banks, past due items, short term claims, covered bonds and other items. The following sections describe the principles for calculating RWA with the IRB and the standardised approach respectively. 4.4.1 Calculation of RWA with the IRB approach
The FIRB approach is used for calculating the minimum capital requirements for expo-sures to institutions and corporate customers. Credit risk is measured using sophisticated formulas for calculating RWA. Input parameters are Nordea’s internal estimate of PDs and inputs fixed by the financial authorities supervisory for LGD, exposure and maturity. Internal estimates of PD, LGD and exposure are used for the IRB approach for retail ex-posures, which in turn are based on internal historical loss data. 4.4.1.1 PD PD means the likelihood of default of a counterpart. The PD represents the long-term average of yearly default rates. The internal rating is an estimation of the repayment ca-pacity of a counterpart. The internal risk classification models (rating models for corpo-rate customers and institutions and scoring models for retail customers) provide an esti-mation of the repayment capacity of a counterpart. The internal risk classification scale consists of 18 grades for non-defaulted customers and 3 grades for defaulted customers. All customers with the same rating are expected to have the same repayment capacity; independent of the customers’ industry, size, etc.

Nordea Bank Finland Group 2009
21
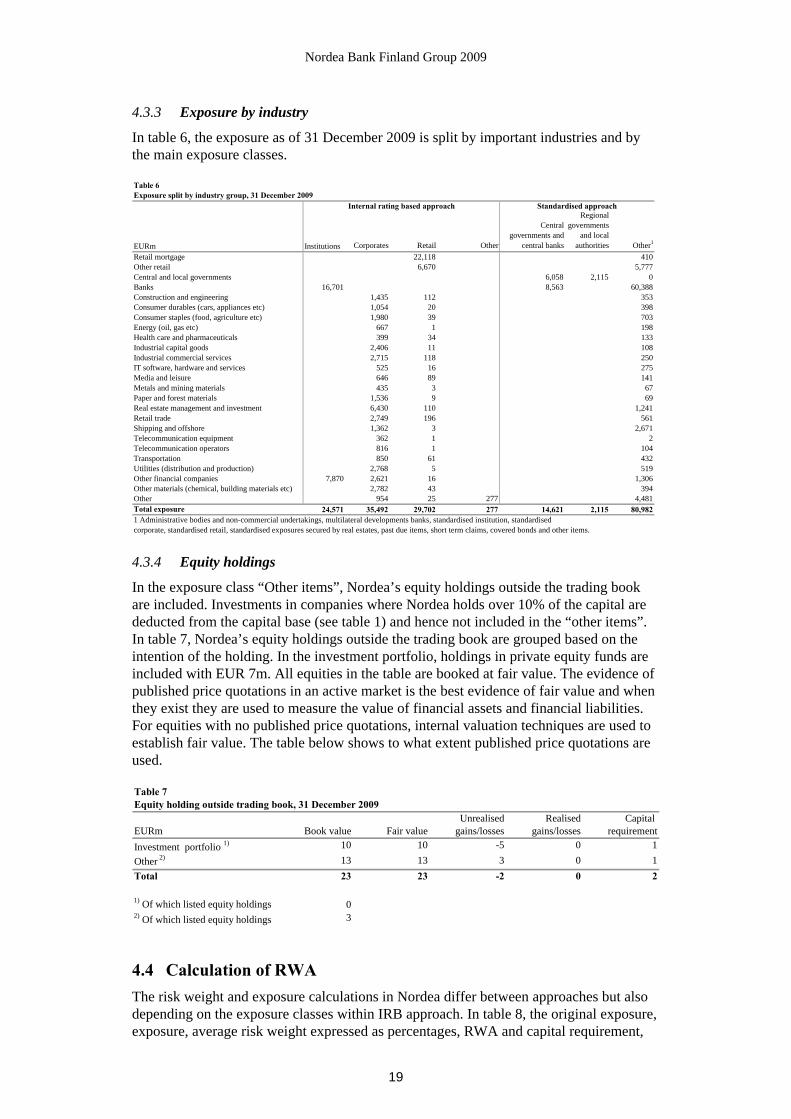
Rating distribution In figures 3 to 5, the exposure is distributed over the internal risk classification scale for the exposures in the IRB exposure classes. Figure 3: Rating distributions, IRB Institutions
Institutions
0%
5%
10%
15%
20%
25%
30%
6+ 6 6- 5+ 5 5- 4+ 4 4- 3+ 3 3- 2+ 2 2- 1+ 1 1-Rating grade
%
2009 Figure 4: Rating distribution, IRB Corporate
Corporate
0%
5%
10%
15%
20%
6+ 6 6- 5+ 5 5- 4+ 4 4- 3+ 3 3- 2+ 2 2- 1+ 1 1-Rating grade
%
2009
Nordea Bank Finland Group 2009
22
Figure 5: Rating distribution, IRB Retail
Retail
0%5%
10%15%20%25%30%
A+ A A- B+ B B- C+ C C- D+ D D- E+ E E- F+ F F-
Risk grade
%
2009
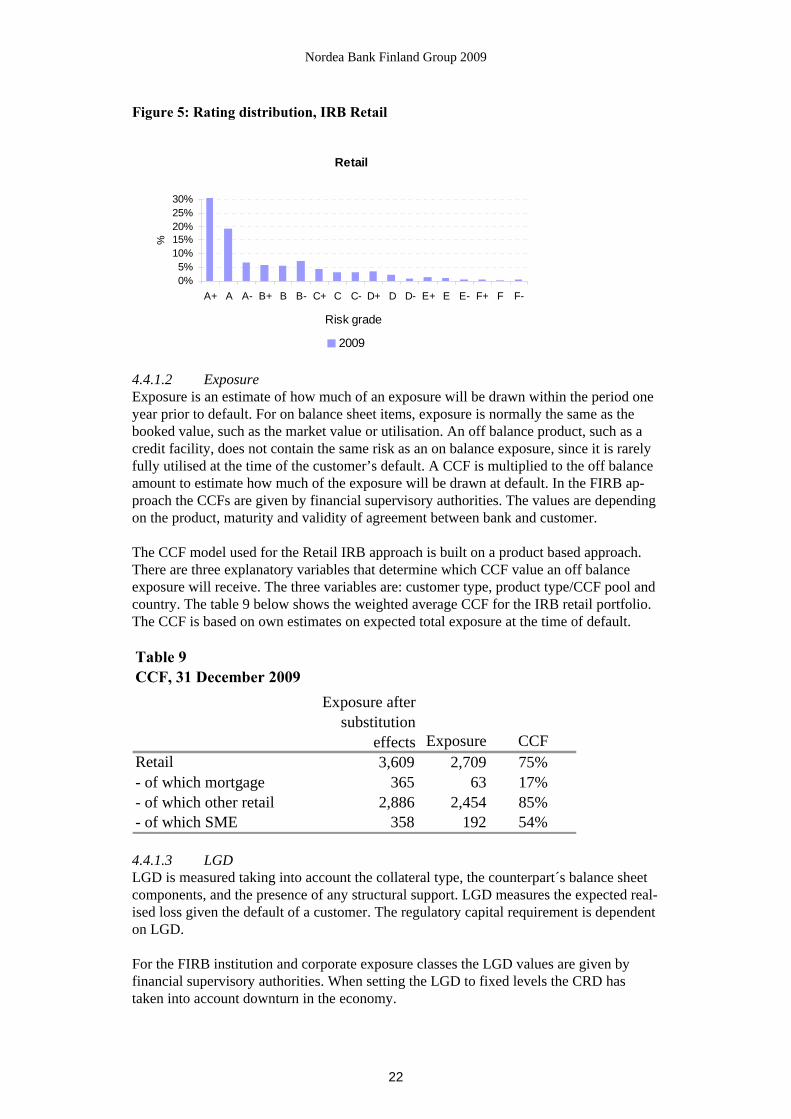
4.4.1.2 Exposure Exposure is an estimate of how much of an exposure will be drawn within the period one year prior to default. For on balance sheet items, exposure is normally the same as the booked value, such as the market value or utilisation. An off balance product, such as a credit facility, does not contain the same risk as an on balance exposure, since it is rarely fully utilised at the time of the customer’s default. A CCF is multiplied to the off balance amount to estimate how much of the exposure will be drawn at default. In the FIRB ap-proach the CCFs are given by financial supervisory authorities. The values are depending on the product, maturity and validity of agreement between bank and customer. The CCF model used for the Retail IRB approach is built on a product based approach. There are three explanatory variables that determine which CCF value an off balance exposure will receive. The three variables are: customer type, product type/CCF pool and country. The table 9 below shows the weighted average CCF for the IRB retail portfolio. The CCF is based on own estimates on expected total exposure at the time of default. Table 9CCF, 31 December 2009
Exposure CCFRetail 3,609 2,709 75%- of which mortgage 365 63 17%- of which other retail 2,886 2,454 85%- of which SME 358 192 54%
Exposure after substitution
effects
4.4.1.3 LGD LGD is measured taking into account the collateral type, the counterpart´s balance sheet components, and the presence of any structural support. LGD measures the expected real-ised loss given the default of a customer. The regulatory capital requirement is dependent on LGD. For the FIRB institution and corporate exposure classes the LGD values are given by financial supervisory authorities. When setting the LGD to fixed levels the CRD has taken into account downturn in the economy.

Nordea Bank Finland Group 2009
23
The LGD value in the retail IRB approach is based on internal estimates. LGD estimates are based on the experience and practices in Nordea as well as the external environment in which the bank operates. Nordea uses LGD estimates that are appropriate for an eco-nomic downturn if those are more conservative than the long-run average. The LGD pools are based on collateral types. These codes are mapped to LGD pools depending on country and customer type (household or SME).
Credit risk mitigation RWA, EL and exposures are reduced by the recognition of credit risk mitigation tech-niques. Only certain types of collateral and some issuers of guarantees are eligible to re-duce the capital requirement purposes. Furthermore the collateral management process and the terms in the collateral agreements have to fulfil the minimum requirements (such as procedures for monitoring of market values, insurance and legal certainty) in the capi-tal adequacy regulations. Collateral items and guarantees which can reduce the capital requirement are called eligible collateral. The eligibility requirements are explicitly men-tioned in the CRD for physical exposures in FIRB, which are currently used for corporate and institution exposures. Financial supervisory authorities may permit the use of other physical collaterals only if two specific requirements are met in addition to the general minimum requirements listed further down in the document. The first requirement is that there is a liquid market and the second that there are established market prices. The reduction of the capital requirements is calculated in four ways, depending of the type of credit risk mitigation technique:
1. Adjusted exposure amount The comprehensive method for financial collateral such as cash, bonds and stocks. The exposure amount is adjusted with regards to the financial collateral. The size of the adjustment depends on the volatility of the collateral and the type of exposure. Nordea uses volatility adjustments specified by the financial supervisory authorities (supervisory haircuts). 2. Adjusted PD (substitution of PD) The substitution method is used for guarantees, which implies that the PD for the cus-tomer is substituted. This means that the credit risk in respect of the customer is sub-stituted by the credit risk of the guarantor and the risk thereby reduced. Hence, an ex-posure fully guaranteed will be assigned the same capital requirement as if the loan was initially granted to the guarantor rather than the customer. The PD value of expo-sures is adjusted if the capital requirement for both the customer and the guarantor is calculated according to the IRB approach. 3. Adjusted LGD The LGD value is reduced if the exposures in the IRB approach (i.e. to large corpo-rate and institutions) is fully collateralised with real estates (commercial and residen-tial), other physical collateral or receivables. The size of the LGD adjustment is stipu-lated by the CRD in the FIRB approach. The LGD value in the retail IRB approach is based on internal estimates. 4. Adjusted risk weight Netting agreements are mainly used for transactions in derivatives in the trading book. The exposure value is adjusted so that the capital requirements for credit risk reflect only the net position of derivative contracts with positive and negative values under the netting agreement. Netting across product categories is not used.

Nordea Bank Finland Group 2009
24
Nordea uses a wide variety of risk mitigation techniques in several different markets which contribute to risk diversification and credit protection. The different credit risk mitigation techniques such as collateral, guarantees, netting agreements and covenants are used to reduce the credit risk. All credit mitigation activities are not recognised for capital adequacy purposes since they are not defined as eligible, i.e. covenants. Loan documenta-tions and similar agreements can include covenants such as financial ratios that the debtor has to comply with. Covenants are not taken into account in the calculations of regulatory capital. Another example is receivables. Receivables with an original maturity of more than one year are not eligible for capital adequacy purposes. A third example is assets that could not be sold in a liquid market. Such assets could be pledged but are not assigned any value in the credit process, nor in the regulatory capital calculations. In table 10 below, the exposure per exposure class secured by eligible collateral, guaran-tees and credit derivatives are available. The table present a split between exposure classes subject to the IRB approach and exposure classes subject to the standardised ap-proach. Table 10Exposure secured by collaterals, guarantees and credit derivatives, 31 December 2009
EURmOriginal
exposure Exposure
of which secured by guarantees and credit
derivativesof which secured by
collateralsIRB exposure classesInstitutions 27,115 24,571 705 2,015Corporates 70,729 35,492 2,271 9,267Retail 31,515 29,702 2,392 23,145 - of which mortgage 22,420 22,118 21,947 - of which other retail 7,976 6,670 2,210 193 - of which SME 1,119 914 182 1,005Other non-credit obligation assets 311 277 0Total IRB approach 129,669 90,042 5,368 34,427
Standardised exposure classesCentral government and central banks 12,390 14,621 28Regional governments and local authorities 3,453 2,115Institutions 62,120 60,809Corporates 15,815 12,342 0Retail 9,971 5,777 1Exposures secured by real estate 448 410 448Other1 1,849 1,643 2Total standardised approach 106,045 97,717 32 4481Administrative bodies and non-commercial undertakings, multilateral developments banks, past due items, short term claims, covered bonds and other items Guarantees and credit derivatives The guarantees used as credit risk mitigation are largely issued by central and regional governments in the Nordic countries. Banks and insurance companies are also important guarantors of credit risk. Only eligible providers of guarantees and credit derivatives can be recognised in the stan-dardised and FIRB approach for credit risk. All central governments, regional govern-ments and institutions are eligible. Some multinational development banks and interna-tional organisations are also eligible. Guarantees issued by corporate entities can only be taken into account if their rating corresponds to A- (S&P’s rating scale) or better. Out of the guarantors, central governments and municipalities within the Nordic countries com-prise approximately 87%. The exposures that are guaranteed by these guarantors receive a
Nordea Bank Finland Group 2009
25
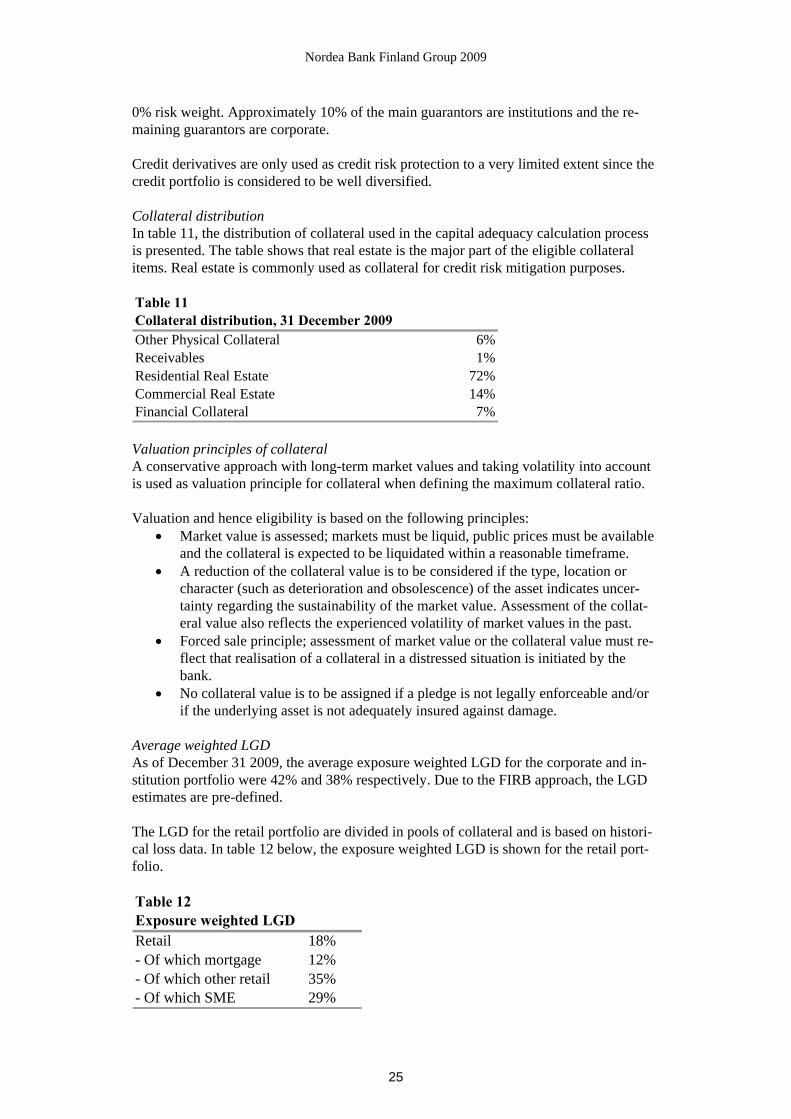
0% risk weight. Approximately 10% of the main guarantors are institutions and the re-maining guarantors are corporate. Credit derivatives are only used as credit risk protection to a very limited extent since the credit portfolio is considered to be well diversified. Collateral distribution In table 11, the distribution of collateral used in the capital adequacy calculation process is presented. The table shows that real estate is the major part of the eligible collateral items. Real estate is commonly used as collateral for credit risk mitigation purposes. Table 11Collateral distribution, 31 December 2009Other Physical Collateral 6%Receivables 1%Residential Real Estate 72%Commercial Real Estate 14%Financial Collateral 7% Valuation principles of collateral A conservative approach with long-term market values and taking volatility into account is used as valuation principle for collateral when defining the maximum collateral ratio. Valuation and hence eligibility is based on the following principles:
• Market value is assessed; markets must be liquid, public prices must be available and the collateral is expected to be liquidated within a reasonable timeframe.
• A reduction of the collateral value is to be considered if the type, location or character (such as deterioration and obsolescence) of the asset indicates uncer-tainty regarding the sustainability of the market value. Assessment of the collat-eral value also reflects the experienced volatility of market values in the past.
• Forced sale principle; assessment of market value or the collateral value must re-flect that realisation of a collateral in a distressed situation is initiated by the bank.
• No collateral value is to be assigned if a pledge is not legally enforceable and/or if the underlying asset is not adequately insured against damage.
Average weighted LGD As of December 31 2009, the average exposure weighted LGD for the corporate and in-stitution portfolio were 42% and 38% respectively. Due to the FIRB approach, the LGD estimates are pre-defined. The LGD for the retail portfolio are divided in pools of collateral and is based on histori-cal loss data. In table 12 below, the exposure weighted LGD is shown for the retail port-folio. Table 12Exposure weighted LGDRetail 18%- Of which mortgage 12%- Of which other retail 35%- Of which SME 29%

Nordea Bank Finland Group 2009
26
4.4.1.4 Maturity For exposures calculated with the FIRB approach, the maturity is set to standard values in the RWA calculation formula based on the estimates set by the financial supervisory au-thorities. The maturity parameter used is set to 2.5 years for the exposure types on bal-ance, off balance and derivatives. For securities financing the maturity parameter is 0.5 years. 4.4.1.5 Estimation and validation of parameters Nordea has established an internal process in accordance with the legal requirements with the purpose of ensuring and improving the performance of models, procedures and sys-tems and to ensure the accuracy of the parameters. The PDs are validated semi annually, while the LGD and CCF parameters are validated at least annually. The validation includes both a quantitative and a qualitative validation. The quantitative validation includes statistical tests to ensure that the estimates are still valid when new data is added. The estimation process is linked to the validation since the estimates used for the PD scale are based on Nordea’s Actual Default Frequencies (ADF). Any suggested changes to the PD scale is processed through appropriate channels such as the Risk Committee and subsequently decided by GEM. The PD estimation, and hence the validation, takes into account that the rating models used for corporate and institution customers has a higher degree of TTC than the scoring models used for retail customers. The PD estimates are based on the long-term default experience and adjusted by adding a Margin of Conservatism between the average PD and the average ADF. This add-on consists of two parts, one that compensates for statisti-cal uncertainty whereas the other constitutes a business cycle adjustment of the rating and scoring models. In table 13 below the EL is compared to the actual gross and net losses. EL has been cal-culated using the definition from the economic capital framework, in which defaulted exposure receive 0% EL and where Nordea has internal LGD and CCF estimates for cor-porate and institution exposure. Figures represent the full year outcome. For 2009, the EL ratio used for calculating risk-adjusted profit was on average 25 basis points, excluding the sovereign and institution exposure classes. EL vs Gross loss and net loss
EURm2009 Mortgage Other
EL -15 -46 -140 -5 -1 -207Gross loss -84 -42 -358 -10 0 -494Net loss -77 -26 -296 18 0 -381
2008 2)
EL -15 -43 -124 -9 -1 -192Gross loss -12 -27 -125 -32 0 -196Net loss -11 -15 -76 -31 0 -133
2007 2)
EL -14 -48 -103 0 0 -165Gross loss -1 -19 -106 -2 0 -128Net loss 0 3 7 9 0 191) SME Retail is included in the corporate segment
2) Figures are restated due to changes in economic cpital framework as of 1st of January 2009
Institution Government TotalHousehold1)Retail
Corporate1)

Nordea Bank Finland Group 2009
27
Note that the EL will vary over time due to changes in the rating and the collateral cover-age distributions, but it is expected that the average long term net loss will be in line with average EL disregarding the fact that EL includes extra margins for statistical uncertainty and, in the case of LGD, a downturn add-on. 4.4.2 Calculation of RWA with the standardised approach
The standardised measures credit risk pursuant to fixed risk weight and is the least so-phisticated capital calculation. The application of risk weight in standardised is given by financial supervisory authorities and is based on the exposure class to which the exposure is assigned. Some exposure classes are derived from the type of counterparty while others are based on the asset type, product type, collateral type or exposure size. The exposure of an on balance sheet exposure in the standardised approach is measured net of value adjustments such as provisions. Off balance sheet exposures are converted into exposure using CCF set by the financial supervisory authorities. Derivative contracts and securities financing has an exposure that is the same as the original exposure. In calculating RWA with the standardised approach, external rating may be used as an alternative to use the fixed risk weight. The external ratings must come from eligible ex-ternal credit assessment institutions. More information regarding the risk weight of the exposures under the standardised approach can be found in appendix 12.3. Exposure against central government and central banks Nordea uses S&P’s as eligible rating agency. The external rating is converted to the credit quality step (the mapping is defined by the financial supervisory authorities), which cor-responds to a fixed risk weight. In table 14, the central government and central banks exposures distributed by the credit quality steps is available. The exposure in the table is after credit risk mitigation, but the effect of credit risk mitigation is minor Table 14
EURm 31 December 2009Standard & Poor's rating Credit quality step Risk weight ExposureAAA to AA- 1 0% 13,642A+ to A- 2 20% 449BBB+ to BBB- 3 50% 277BB+ and below, or without rating 4 to 6 or blank 100-150% 253Total 14,621
Exposures to central governments and central banks, 31 December 2009
4.5 Information about impaired loans and loan losses 4.5.1 Information about definition and methods of impaired loans
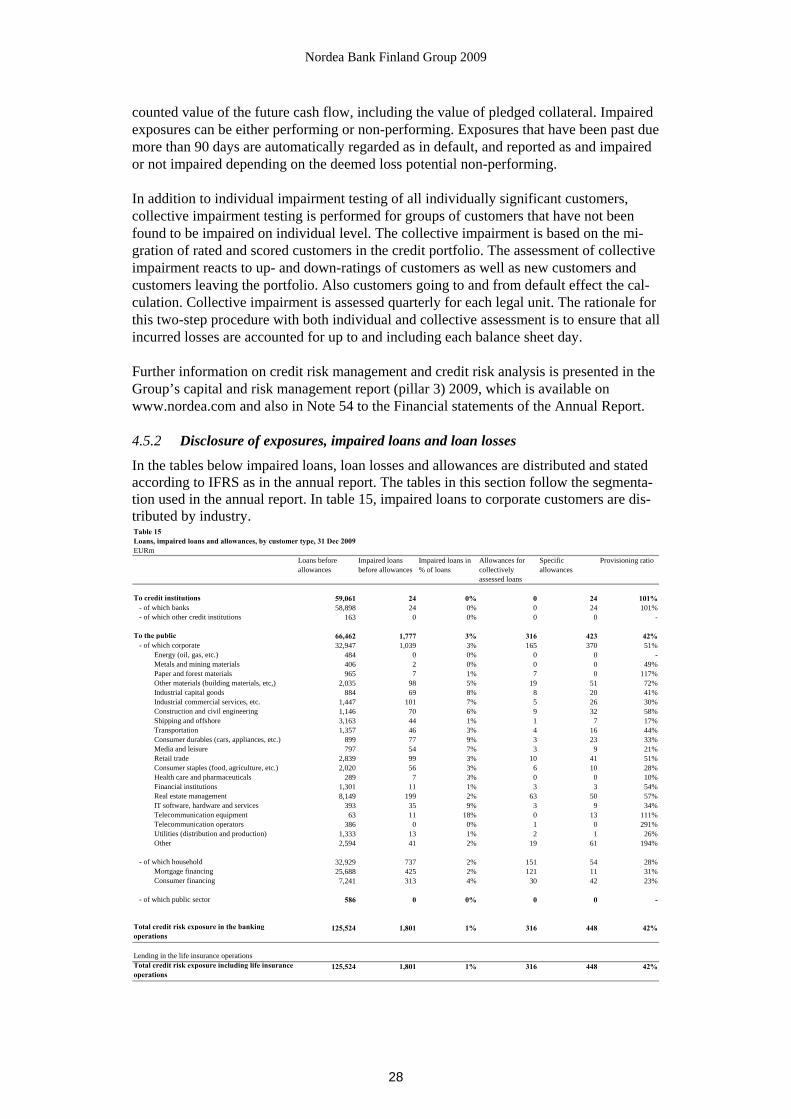
Throughout the process of identifying and mitigating credit impairments, Nordea works continuously to review the quality of the credit exposures. Weak and impaired exposures are closely and continuously monitored and reviewed at least on a quarterly basis in terms of current performance, business outlook, future debt service capacity and the possible need for provisions. An exposure is impaired, and a provision is recognised, if there is objective evidence based on loss events or observable data that the customer’s future cash flow is impacted to the extent that full repayment is unlikely, collateral included. The size of the provision is equal to the estimated loss being the difference between the book value and the dis-
Nordea Bank Finland Group 2009
28
counted value of the future cash flow, including the value of pledged collateral. Impaired exposures can be either performing or non-performing. Exposures that have been past due more than 90 days are automatically regarded as in default, and reported as and impaired or not impaired depending on the deemed loss potential non-performing. In addition to individual impairment testing of all individually significant customers, collective impairment testing is performed for groups of customers that have not been found to be impaired on individual level. The collective impairment is based on the mi-gration of rated and scored customers in the credit portfolio. The assessment of collective impairment reacts to up- and down-ratings of customers as well as new customers and customers leaving the portfolio. Also customers going to and from default effect the cal-culation. Collective impairment is assessed quarterly for each legal unit. The rationale for this two-step procedure with both individual and collective assessment is to ensure that all incurred losses are accounted for up to and including each balance sheet day. Further information on credit risk management and credit risk analysis is presented in the Group’s capital and risk management report (pillar 3) 2009, which is available on www.nordea.com and also in Note 54 to the Financial statements of the Annual Report. 4.5.2 Disclosure of exposures, impaired loans and loan losses
In the tables below impaired loans, loan losses and allowances are distributed and stated according to IFRS as in the annual report. The tables in this section follow the segmenta-tion used in the annual report. In table 15, impaired loans to corporate customers are dis-tributed by industry. Table 15Loans, impaired loans and allowances, by customer type, 31 Dec 2009EURm
Loans before allowances
Impaired loans before allowances
Impaired loans in % of loans
Allowances for collectively assessed loans
Specific allowances
Provisioning ratio
To credit institutions 59,061 24 0% 0 24 101%- of which banks 58,898 24 0% 0 24 101%- of which other credit institutions 163 0 0% 0 0 -
To the public 66,462 1,777 3% 316 423 42%- of which corporate 32,947 1,039 3% 165 370 51%
Energy (oil, gas, etc.) 484 0 0% 0 0 - Metals and mining materials 406 2 0% 0 0 49% Paper and forest materials 965 7 1% 7 0 117% Other materials (building materials, etc,) 2,035 98 5% 19 51 72% Industrial capital goods 884 69 8% 8 20 41% Industrial commercial services, etc. 1,447 101 7% 5 26 30% Construction and civil engineering 1,146 70 6% 9 32 58% Shipping and offshore 3,163 44 1% 1 7 17% Transportation 1,357 46 3% 4 16 44% Consumer durables (cars, appliances, etc.) 899 77 9% 3 23 33% Media and leisure 797 54 7% 3 9 21% Retail trade 2,839 99 3% 10 41 51% Consumer staples (food, agriculture, etc.) 2,020 56 3% 6 10 28% Health care and pharmaceuticals 289 7 3% 0 0 10% Financial institutions 1,301 11 1% 3 3 54% Real estate management 8,149 199 2% 63 50 57% IT software, hardware and services 393 35 9% 3 9 34% Telecommunication equipment 63 11 18% 0 13 111% Telecommunication operators 386 0 0% 1 0 291% Utilities (distribution and production) 1,333 13 1% 2 1 26% Other 2,594 41 2% 19 61 194%
- of which household 32,929 737 2% 151 54 28% Mortgage financing 25,688 425 2% 121 11 31% Consumer financing 7,241 313 4% 30 42 23%
- of which public sector 586 0 0% 0 0 -
Total credit risk exposure in the banking operations
125,524 1,801 1% 316 448 42%
Lending in the life insurance operationsTotal credit risk exposure including life insurance operations
125,524 1,801 1% 316 448 42%

Nordea Bank Finland Group 2009
29
In table 16, impaired loans are distributed by geography. Table 16Loans to the public, impaired loans and allowances, by geography, 31 December 2009EURm
Loans before allowances
Impaired loans before allowances
Impaired loans in % of loans
Allowances for collectively assessed loans
Specific allowances
Provisioning ratio
Nordic countries 51,528 1,175 2% 128 279 35% of which Denmark 302 0 0% 0 0 - of which Finland 50,589 1,175 2% 128 279 35% of which Norway 190 0 0% 0 0 - of which Sweden 448 0 0% 0 0 -Estonia 2,700 97 4% 48 16 66%Latvia 3,111 303 10% 94 58 50%Lithuania 2,217 135 6% 46 57 76%Poland 66 2 4% 0 2 100%Russia 104 0 0% 0 0 -EU countries other 2,964 25 1% 0 4 18%USA 1,260 0 0% 0 0 4%Asia 1,546 39 3% 0 7 17%Latin America 207 0 0% 0 0 -OECD other 390 0 0% 0 0 -Non-OECD other 370 0 0% 0 0 -Total 66,462 1,777 3% 316 423 42%1 On-balance sheet items, excluding credit institutions Table 17 shows the specification of the loan losses according to the income statement in the annual report, as well the changes in the allowance accounts in the balance sheet. Table 17Loan losses divided by class net, 31 December 2009 EURmLoans to credit institutions -9- of which write-offs and provisions -10- of which reversals and recoveries 1Loans to the public -400- of which write-offs and provisions -482- of which reversals and recoveries 83Off-balance sheet items 27- of which write-offs and provisions -1- of which reversals and recoveries 28Total -381
Specification of loan lossesChanges of allowance accounts in the balance sheet -347- of which Loans -375- of which Off-balance sheet items 27Changes directly recognised in the income statement -34- of which realised loan losses -65- of which realised recoveries 31Total -381

Nordea Bank Finland Group 2009
30
Table 18 shows the changes in the allowance accounts in the balance sheet. Table 18
Loans EURmIndividually
assessedCollectively
assessed TotalOpening balance at 1 Jan 2009 -258 -174 -432Provisions -257 -171 -428Reversals 24 28 53Changes through the income statement -232 -142 -375Allowances used to cover write-offs 39 0 39Currency translation differences and reclassifications 4 0 5Closing balance at 31 Dec 2009 -448 -316 -764
Opening balance at 1 Jan 2008 -186 -140 -326Provisions -138 -34 -172Reversals 44 7 51Changes through the income statement -94 -27 -121Allowances used to cover write-offs 20 0 20Currency translation differences 2 -7 -5Closing balance at 31 Dec 2008 -258 -174 -432
Reconciliation of allowance accounts for impaired loans

Nordea Bank Finland Group 2009
31
5. Market risk
In this chapter, the management of market risk is described. Market risk is the risk of a loss in the market value of portfolios and financial instruments as a result of movements in financial market variables. The customer-driven trading activity of Nordea Markets and the investment and liquidity portfolios of Group Treasury are the key contributors to market risk in Nordea. For all other banking activities, the basic principle is that market risks are eliminated by match-ing assets, liabilities and off balance sheet items. This is achieved by transactions in Group Treasury. In addition to the immediate change in the market value of Nordea’s assets and liabilities from a change in financial market variables, a change in interest rates could also affect the net interest income of Nordea over time. In Nordea this is seen as structural interest income risk (SIIR) and is dealt with in Chapter 8.
5.1 Reporting and control process A Nordea Group wide framework establishes common management principles and stan-dards for the market risk management. This implies that the same reporting and control processes are applied for the market risk exposures in Markets (the Trading Book) and Group Treasury. Moreover the same Value-at-Risk model (VaR model) is used to meas-ure and manage the consolidated risk and the risk divided into Trading Book and Banking Book risk. However, certain risk exposures have special characteristics and are monitored and lim-ited separately. For example, this is the case for commodity risk, structured equity op-tions and fund linked derivatives in Markets and private equity funds and investments in hedge funds in Group Treasury, which are measured using scenario simulation. The sce-narios are based on the sensitivity to changes in the underlying prices and, where rele-vant, their volatility. These risk figures are limited and monitored in the daily reporting and control process, but not included in the VaR numbers. CDOs and CDSs are included in the VaR figures through their sensitivities to changes in credit spreads, in analogy with corporate bonds. In addition, jump-to-default exposures and correlation risk are limited and monitored in the daily control process. See section 7.1 for more specific information about CDOs and CDSs. Transparency in all elements of the risk management process is central to maintaining risk awareness and a sound risk culture throughout the organisation. In Nordea this trans-parency is achieved by
• senior management taking an active role in the process. The CRO receives report-ing on the Group’s consolidated market risk every day; GEM receives reports on a monthly basis, and the Board of Directors on a quarterly basis
• defining clear risk mandates (at departmental, desk and individual levels), in terms of limits and restrictions on which instruments may be traded. Adherence to limits is crucial, and should a limit be breached, the decision-making body would be in-formed immediately
• having a comprehensive policy framework, in which responsibilities and objec-tives are explicitly outlined. Policies are decided by the Board of Directors, and are complemented by instructions issued by the CRO

Nordea Bank Finland Group 2009
32
• having detailed business procedures that clearly state how policies and guidelines are implemented
• having proactive information sharing between trading and risk control
• having risk models that make risk figures easily decomposable
• having a framework for approval of traded financial instruments and methods for the valuation of these that requires an elaborate analysis and documentation of the instruments’ features and risk factors
• having a “business intelligence” type risk IT system that allows all traders and controllers to easily monitor and analyse their risk figures
• having tools that allow the calculation of VaR figures on the positions that a trader, desk or department has during the day
5.2 Measurement methods As there is no single risk measure that captures all aspects of market risk, Nordea on a daily basis uses several risk measures including VaR models, stress testing, Jump-to-Default exposure, scenario simulation and other non-statistical risk measures such as basis point values, net open positions and option key figures. 5.2.1 Value-at-Risk
Nordea’s universal VaR model is a 10-day, 99% confidence model, which uses the ex-pected shortfall approach (sometimes referred to as tVaR, for tail-VaR) and is based on historical simulation on up to two years’ historical changes in market prices and rates. This implies that Nordea’s historical simulation VaR model uses the average of a number of the most adverse simulation results as an estimate of VaR. The sample of historical market changes in the model is updated daily. The “square root of ten” rule is applied to scale 1-day VaR figures to 10-day figures. The model is used to limit and measure market risk at all levels both for the Trading Book and in Group Treasury. VaR is used by Nordea to measure interest rate, foreign exchange, equity and credit spread risks. A VaR measure across these risk categories, allowing for diversification among them, is also used. The VaR figures include both linear positions and options. With the chosen characteristics of Nordea’s VaR model, the VaR-figures can be inter-preted as the loss that will only be exceeded in one of hundred 10-day trading periods. However, it is important to note that, while every effort is made to make the VaR-model as realistic as possible; all VaR-models are based on assumptions and approximations that have significant effect on the risk figures produced. Also, it should be noted that the his-torical observations of the market variables that are used as input, may not give an ade-quate description of their behaviour in the future.

Nordea Bank Finland Group 2009
33
5.2.2 Stress testing
Stress tests are used to estimate the possible losses that may occur under extreme market conditions. Stress tests are conducted daily for the consolidated risk of Nordea Bank Finland. The main types of stress tests include:
1. Historical stress tests, which include selected historical episodes, and are calcu-lated by exposing the current portfolio to the most unfavorable developments in financial markets since 1993. (The calculations for historical episode scenarios use simplifying assumptions.)
2. Subjective stress tests, where the portfolios are exposed to scenarios for financial developments that are deemed particularly relevant at a particular time. The sce-narios are inspired by the financial, the macroeconomic or geopolitical situation, or the current composition of the portfolio.
3. Sensitivity tests are conducted on interest rates, and include tests where rates, spreads and/or volatilities are shifted markedly. The sensitivities are measured both gross and net; the gross figures shedding light on exposure to situations where normal relationships between financial variables fail to hold. Another sen-sitivity measure used is the potential loss stemming from a sudden default of an issuer of a bond or the underlying in a credit default swap.
While these stress tests measure the risk over a shorter time horizon, market risk is also a part of Nordea’s comprehensive ICAAP stress testing, which measures the risk over a three year horizon.
5.3 Consolidated market risk The total VaR was EUR 25m (EUR 38m) at the end of 2009 demonstrating a consider-able diversification effect between interest rate, equity, credit spread and foreign ex-change risk, as the total VaR was lower than the sum of the risk in the four categories. The total interest rate VaR ended 2009 at EUR 15m (EUR 26m). The total gross sensitiv-ity to a 1 percentage point parallel shift, which measures the development in the market value of NBF’s interest rate sensitive positions if all interest rates were to move adversely for Nordea, was EUR 83m at the end of 2009 (EUR 157m). The largest part of NBF’s interest rate sensitivity stemmed from interest rate positions in Swedish Kronor, Danish Kroner, US Dollars and Euro. At the end of 2009, NBF’s equity VaR stood at EUR 2m (EUR 1m), and structured equity option risk was EUR 28m (EUR 16m). Credit spread VaR ended 2009 at EUR 12m (EUR 13m). Credit spread risk was concen-trated on financials. NBF’s foreign exchange VaR was EUR 14m (EUR 15m) at year-end. By far the largest foreign exchange exposure was to Danish kroner. Nordea’s exposure to commodity risk, primarily pulp and paper, is solely related to cus-tomer-driven activities. The risk was EUR 9m at the end of 2009 (EUR 4m). The fair value of investments in private equity funds was EUR 7m (EUR 6m).
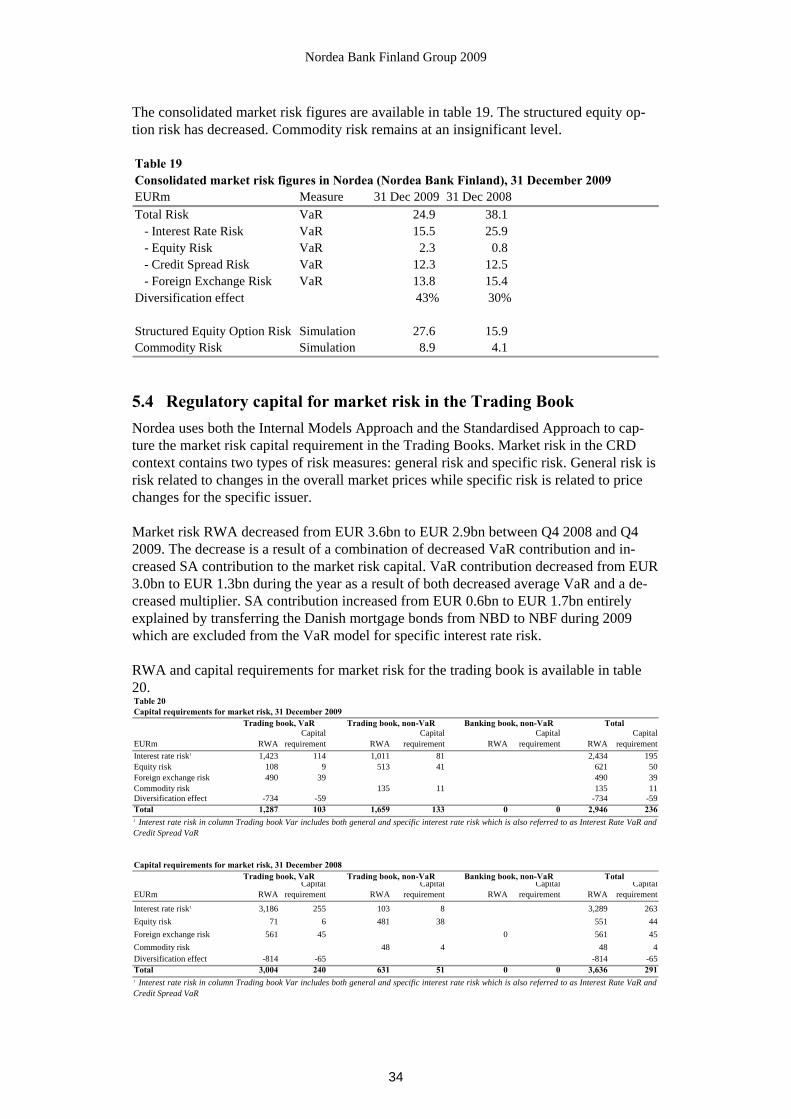
Nordea Bank Finland Group 2009
34
The consolidated market risk figures are available in table 19. The structured equity op-tion risk has decreased. Commodity risk remains at an insignificant level. Table 19Consolidated market risk figures in Nordea (Nordea Bank Finland), 31 December 2009EURm Measure 31 Dec 2009 31 Dec 2008Total Risk VaR 24.9 38.1 - Interest Rate Risk VaR 15.5 25.9 - Equity Risk VaR 2.3 0.8 - Credit Spread Risk VaR 12.3 12.5 - Foreign Exchange Risk VaR 13.8 15.4 Diversification effect 43% 30%
Structured Equity Option Risk Simulation 27.6 15.9 Commodity Risk Simulation 8.9 4.1
5.4 Regulatory capital for market risk in the Trading Book Nordea uses both the Internal Models Approach and the Standardised Approach to cap-ture the market risk capital requirement in the Trading Books. Market risk in the CRD context contains two types of risk measures: general risk and specific risk. General risk is risk related to changes in the overall market prices while specific risk is related to price changes for the specific issuer. Market risk RWA decreased from EUR 3.6bn to EUR 2.9bn between Q4 2008 and Q4 2009. The decrease is a result of a combination of decreased VaR contribution and in-creased SA contribution to the market risk capital. VaR contribution decreased from EUR 3.0bn to EUR 1.3bn during the year as a result of both decreased average VaR and a de-creased multiplier. SA contribution increased from EUR 0.6bn to EUR 1.7bn entirely explained by transferring the Danish mortgage bonds from NBD to NBF during 2009 which are excluded from the VaR model for specific interest rate risk. RWA and capital requirements for market risk for the trading book is available in table 20. Table 20Capital requirements for market risk, 31 December 2009
EURm RWACapital
requirement RWACapital
requirement RWACapital
requirement RWACapital
requirementInterest rate risk1 1,423 114 1,011 81 2,434 195Equity risk 108 9 513 41 621 50Foreign exchange risk 490 39 490 39Commodity risk 135 11 135 11Diversification effect -734 -59 -734 -59Total 1,287 103 1,659 133 0 0 2,946 236
Capital requirements for market risk, 31 December 2008
EURm RWACapital
requirement RWACapital
requirement RWACapital
requirement RWACapital
requirement
Interest rate risk1 3,186 255 103 8 3,289 263Equity risk 71 6 481 38 551 44Foreign exchange risk 561 45 0 561 45Commodity risk 48 4 48 4Diversification effect -814 -65 -814 -65Total 3,004 240 631 51 0 0 3,636 291
Banking book, non-VaR Total
1 Interest rate risk in column Trading book Var includes both general and specific interest rate risk which is also referred to as Interest Rate VaR andCredit Spread VaR
1 Interest rate risk in column Trading book Var includes both general and specific interest rate risk which is also referred to as Interest Rate VaR andCredit Spread VaR
Trading book, VaR Trading book, non-VaR Banking book, non-VaR Total
Trading book, VaR Trading book, non-VaR

Nordea Bank Finland Group 2009
35
5.4.1 Internal model (VaR)
Nordea uses the VaR model to calculate capital requirements for the predominant part of the Trading Book. Table 21Methods for calculating capital requirements for market risk in the trading book
FX riskGeneral Specific General Specific General
Nordea Bank Finland IM IM IM IM IM
IM:internal model approach, Standard: Standardised approach
Interest rate risk Equity risk
General interest risk is measured by the Interest Rate VaR, while specific interest rate risk is measured through Credit Spread VaR. 5.4.2 Backtesting of the VaR-model
Back testing is conducted daily in accordance with the guidelines laid out by the Basel Committee on Banking Supervision. The Basel multiplier deciding backtest for NBF’s consolidated trading book is holding the 1-day VaR figures against hypothetical profit/loss. 5.4.3 VaR in the Trading Book
Table 22 shows VaR in the trading book. Table 22Market risk figures in Trading book, 31 December 2009EURm Measure 31 Dec 2009 31 Dec 2008Total Risk VaR 27.2 36.6 - Interest Rate Risk VaR 16.7 26.2 - Equity Risk VaR 2.3 0.7 - Credit Spread Risk VaR 11.4 11.3 - Foreign Exchange Risk VaR 13.7 15.4Diversification effect 39% 32%
Structured Equity Option Risk Simulation 27.6 15.9Commodity Risk Simulation 8.9 4.1 5.4.4 Standardised Approach
As described above, not all positions are covered by the approved VaR model; instead these have to be calculated following the standardised approach. Capital requirement for these positions is calculated according to the CRD. The current approved equity risk VaR model does not capture the risk on structured eq-uity options, for which instead the standardised approach is used. In the standardised ap-proach equity positions receives a capital charge factor depending on the position’s qual-ity and liquidity. Commodity risk in the Trading Book and FX risk outside the Trading Book is not cov-ered by the VaR model and is also calculated through the standardised approach.

Nordea Bank Finland Group 2009
36
5.5 Interest rate risk in the Banking Book Monitoring of the interest rate risk in the Banking Book is done daily by controlling in-terest rate sensitivities which measure the immediate effects of interest rate changes on the fair values of assets, liabilities and off balance sheet items. Table 23 shows the net effect on fair value of a 200 basis points parallel shift increase in rates, by currency, with positions as of 31 December 2009. Furthermore Nordea regularly measures the SIIR (the amount Nordea’s accumulated net interest income would change during the next 12 months if all interest rates change by one percentage point). See chapter 8 for further details. Table 23
EURm +200 bp +100 bp +50 bp -50 bp -100 bp -200 bpDKK -13.9 -7.0 -3.5 3.5 7.0 13.9EUR -72.8 -36.4 -18.2 18.2 36.4 72.8USD -19.2 -9.6 -4.8 4.8 9.6 19.2
Total -109.9 -55.0 -27.5 27.5 55.0 109.9
The totals are netted and include currencies not specified
Interest rate sensitivities for non-trading book 31 December 2009, instantaneous interest rate movements
5.6 Determination of fair value of financial instruments Financial assets and liabilities classified as financial assets/liabilities at fair value through profit or loss and derivative instruments are recorded at fair value on the balance sheet with changes in fair value recognised in the income statement in the item "Net gains/losses on items at fair value". Fair value is defined by IAS 32 and IAS 39 as the amount for which an asset could be exchanged, or a liability settled, between knowledgeable, willing parties in an arm's length transaction. The existence of published price quotations in an active market is the best evidence of fair value and when they exist they are used to measure financial assets and financial liabili-ties. Nordea is predominantly using published price quotations to establish fair value for items disclosed under the following balance sheet items:
• Treasury bills. • Interest-bearing securities. • Shares. • Derivatives (listed derivatives). • Debt securities in issue (issued mortgage bonds in Nordea Kredit Realkreditaktie-
selskab). If quoted prices for a financial instrument fail to represent actual and regularly occurring market transactions or if quoted prices are not available, fair value is established by using an appropriate valuation technique. Valuation techniques can range from simple dis-counted cash flow analysis to complex option pricing models. Valuation models are designed to apply observable market prices and rates as input whenever possible, but can also make use of unobservable model parameters. Nordea is predominantly using valuation techniques to establish fair value for items disclosed under the following balance sheet items:

Nordea Bank Finland Group 2009
37
• Treasury bills (when quoted prices in an active market are not available). • Loans and receivables to the public (mortgage loans in the Danish subsidiary
Nordea Kredit Realkreditaktieselskab). • Interest-bearing securities (when quoted prices in an active market are not avail-
able). • Shares (when quoted prices in an active market are not available). • Derivatives (OTC-derivatives).
Fair value is calculated as the theoretical net present value of the individual contracts, based on independently sourced market parameters and assuming no risks and uncertain-ties. This calculation is supplemented by a portfolio adjustment. The portfolio adjustment covers uncertainties associated with the valuation techniques, model assumptions and unobservable parameters as well as the portfolio's counter party credit risk and liquidity risk. The portfolio adjustment for model risk comprises two components:
• Benchmarking of the model output (market values) against market information or against results from alternative models, where available.
• Sensitivity calculations where unobservable parameters are varied to take other reasonable values.
For financial instruments, where fair value is estimated by a valuation technique, it is investigated whether the variables used in the valuation model are fully based on data from observable markets. By data from observable markets, Nordea considers data that can be collected from generally available external sources and where this data is judged to represent realistic market prices. If non-observable data is used, the instrument cannot be recognised initially at the fair value estimated by the valuation technique and any up-front gains are thereby deferred and amortised through the income statement over the contractual life of the contract. The valuation models applied by Nordea are consistent with accepted economic method-ologies for pricing financial instruments, and incorporate the factors that market partici-pants consider when setting a price. New valuation models are subject to approval by Group Credit and Risk Control and all models are reviewed on a regular basis. 5.6.1 Compliance with requirements applicable to exposures in the Trading Book
Annex VII, Part B of the European Parliament and Council Directive 2006/49/EG of 14 June 2006 on the capital requirements for investment firms and credit institutions outlines the requirements for systems and controls to provide prudent and reliable valuation esti-mates. Nordea complies in all material aspects with these requirements. Overall valuation principles are governed by policies and instructions applicable for the Nordea Group and independent Group staffs are responsible for the overall valuation process. The local risk control organisations in the individual business units are responsible for performing valuation controls in accordance to the policies and instructions applicable for the Nordea Group. The quality control framework is assessed by relevant Group functions as well as by Group Internal Audit on an ongoing basis. The set-up for valuation adjustments in Nordea is designed to be compliant with the re-quirements in IAS39. Requirements in the annex not supported by IAS 39 are therefore not implemented. Nordea incorporates counterparty risk in OTC derivatives, bid/ask spreads and where judged relevant, also model risk.

Nordea Bank Finland Group 2009
38
6. Operational risk
Operational risk is inherent in all activities performed by Nordea. Risk management is proportional to the risks in question, and risk mitigation is designed based on the Group’s risk appetite. During 2009 a redesigned risk management framework has been implemented in the Group, with enhanced focus on key risks as well as simplified report-ing and structured follow-up procedures. This is expected to lead to better management information and added business value.
6.1 Overall description and definition of operational risk The "Policy for Internal Control and Risk Management in the Nordea Group" states that the management of risks includes all activities aiming at identifying, measuring, assess-ing, monitoring and controlling risks as well as measures to limit and mitigate conse-quences of the risks. Management of risks is proactive, emphasising training and risk awareness. The Nordea Group maintains a high standard of risk management by means of applying available techniques and methodology to its own needs in a cost-efficient way. Operational risk is the risk of direct or indirect loss, or damaged reputation resulting from inadequate or failed internal processes, from people and systems or from external events. Operational Risk includes compliance risk which means the risk of business not being conducted according to legal and regulatory requirements, market standards and business ethics, thereby jeopardising customers’ best interest, other stakeholders trust and increas-ing the risk of regulatory sanctions, financial loss or damage to the reputation and confi-dence in the Group. Operational risk also includes legal risk, which is the risk that the Group suffers damage due to a deficient or incorrect legal assessment. Operational risk is inherent in all activities within the organisation, in outsourced activities and in all interac-tions with external parties.
6.2 Operational Risk Management and the operating model Group Operational Risk Management is responsible for developing and maintaining the framework for managing operational and compliance risks, and for supporting the busi-ness organisation in their implementation of the framework. Information security, physical security, crime prevention and educational and training activities are important components when managing operational risks. To cover this broad scope, the Group security and the Group compliance functions are included in Group Credit and Risk Control, and close cooperation is maintained with Group IT and Group Legal, in order to raise the risk awareness throughout the organisation. Managing operational risk is part of the management’s responsibilities. In order to man-age these risks a common set of standards and a sound risk management culture is aimed for with the objective to follow best practice regarding market conduct and ethical stan-dards in all business activities. The Group’s network of risk and compliance officers ensures that operational and com-pliance risk within the Group is managed effectively in the business organisation, which represents the first line of defense. In order to manage these risks Group Operational Risk Management, representing the second line of defense, has defined a common set of stan-dards (Group Directives, processes and reporting) and a sound risk management culture is aimed for with the objective to follow best practice regarding market conduct and ethical standards in all business activities. Group Internal Audit, representing the third line of

Nordea Bank Finland Group 2009
39
defense, provides assurance to the Board of Directors on the risk management, control and governance processes.
6.3 Key processes
6.3.1 Risk self assessment The risk self assessment process puts focus on the key risks, which are identified both through top-down division management involvement and bottom-up reuse of existing information from processes such as quality and risk analyses, product approvals etc. The risks are then quantified, assessed and documented in a structured way, and subsequently presented in a risk map for prioritisation of them for mitigating activities. The key risks are prioritised and their mitigating activities are tracked together with the detailed infor-mation of the risk.
The divisions’ key risks are also presented in a Group risk map. The timing of this proc-ess in synchronised with the annual planning process to be able to ensure adequate input to the Group’s overall prioritisations.
6.3.2 Internal control The internal control process aims at ensuring fulfillment of requirements specified in Group directives, reflecting both external and internal requirements on the business. The focus areas are addressed by the business organisation over an extended period of time, and the division result (score) will be commented on and signed off by the division man-ager, to be subsequently reported to Group Operational Risk Management. The extended time period for answering aims at providing time for actions to be taken by the business to correct substandard matters, thereby making the process an active tool for improve-ment rather than merely a status report. The results are subsequently aggregated in differ-ent dimensions and used as input to the CEO’s annual report on internal control.
6.3.3 Other processes Nordea has developed more task specific risk management processes in three key areas; product approvals, Business continuity and ad-hoc changes.
The purpose of the product approval process is to ensure common requirements and documentation in respect of new products as well as material changes to existing prod-ucts. Approved products are reported on a regular basis.
The business continuity management covers a broad scope ranging from procedures for handling incidents via escalation procedures, to crisis management on Group level. The most important factors governing the business continuity preparedness are the recovery requirements and prioritisations of products and services. As most of the value chains rely on IT applications, disaster recovery plans for technical infrastructure represent a key part of the business continuity planning.
The Quality and Risk Analysis (QRA) is used to analyse risk and quality aspects related to changes on case by case basis, for example new programs or projects, or significant changes to organisation, processes, systems and procedures. In principle, the product approval process described above constitutes a QRA.

Nordea Bank Finland Group 2009
40
6.4 Key reports
6.4.1 Annual report on internal control The result and comments from the Internal Control process represent the main input. The reporting is provided once per year.
Group Operational Risk Management collects the signed off input from the Divisions, aggregates them to business area level, and forwards them to the business area heads for comments. The comments from the business areas are then compiled and, together with comments from a Group perspective, forwarded to the CEO.
The CEO subsequently submits the annual report on internal control to the Group Board.
6.4.2 Semi annual report on operational risks The semi annual report is the independent report from the risk organisation, and is based on input from risk and compliance officers in the business. The report also closely relates to the risk self assessment process as it requires the risk and compliance officers to com-ment on the key risks and their mitigating actions as identified in the risk self assessment process.
The report features standard, recurring subjects relating to operational risk and compli-ance for the risk and compliance officers to comment on, but may also contain specific, ad hoc themes focusing on currently relevant areas. Group Operational Risk Management adds own observations to the final Group report which is submitted to the Risk Commit-tee, GEM, and the Board of Directors.
6.4.3 Incident reporting The incident reporting reflects Basel II standards and ensures compliance with ORX (an international database for incidents) requirements.
The process of reporting incidents is divided into a two-tiered process, with one business specific part where business have the flexibility to adjust it to its specific needs, and one Group related part where the incidents are reported from the business to Group Opera-tional Risk Management. Key aspects of the process include major and minor incidents being reported in the same way (albeit with different level of detail required), and both the identifier of the incident and the risk and compliance officer reporting different parts of the incident information to ensure consistent quality.
Aggregated incident reports are submitted to the every Risk Committee meeting, and key observations are included in the semi annual report on operational risk.
6.5 Capital The capital requirement for operational risk is calculated according to the standardised approach, in which all of the institution’s activities are divided into eight standardised business lines and a defined beta coefficient is multiplied by the average of the gross in-come for each business line. The capital requirement (end 2009) for operational risk amounts to EUR 368m (EUR 318m). The capital requirement for operational risk is up-dated on a yearly basis.
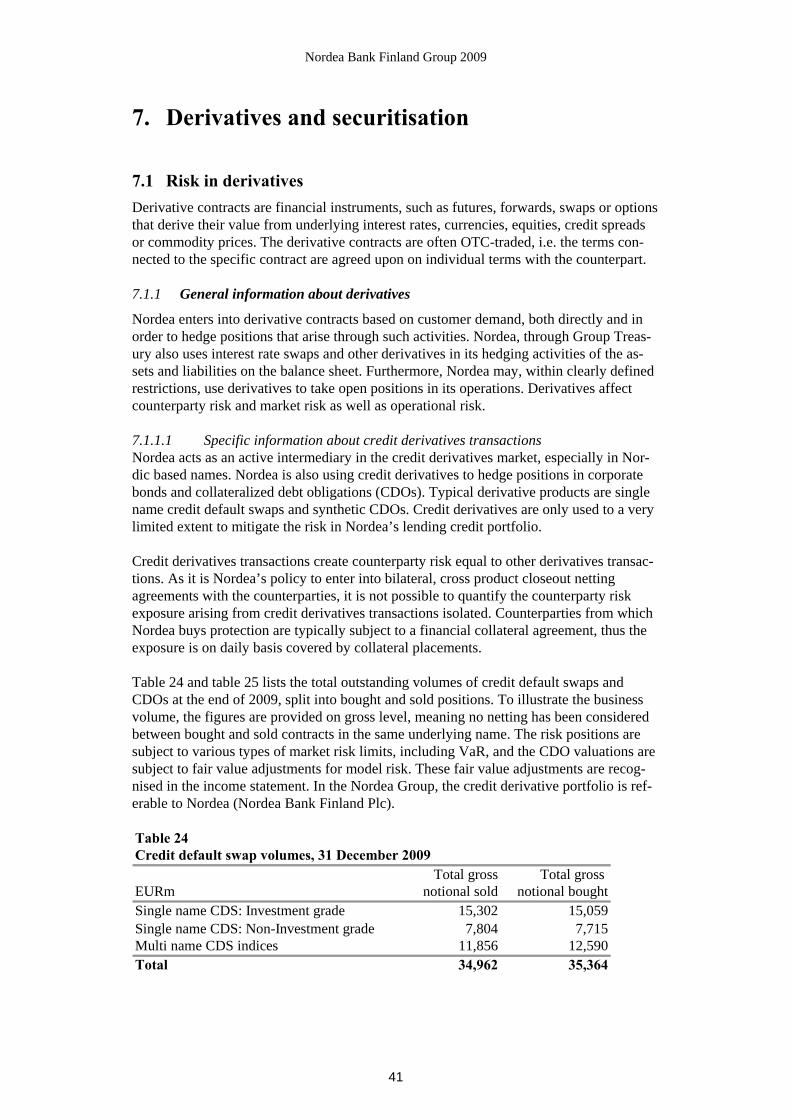
Nordea Bank Finland Group 2009
41
7. Derivatives and securitisation
7.1 Risk in derivatives Derivative contracts are financial instruments, such as futures, forwards, swaps or options that derive their value from underlying interest rates, currencies, equities, credit spreads or commodity prices. The derivative contracts are often OTC-traded, i.e. the terms con-nected to the specific contract are agreed upon on individual terms with the counterpart. 7.1.1 General information about derivatives
Nordea enters into derivative contracts based on customer demand, both directly and in order to hedge positions that arise through such activities. Nordea, through Group Treas-ury also uses interest rate swaps and other derivatives in its hedging activities of the as-sets and liabilities on the balance sheet. Furthermore, Nordea may, within clearly defined restrictions, use derivatives to take open positions in its operations. Derivatives affect counterparty risk and market risk as well as operational risk.
7.1.1.1 Specific information about credit derivatives transactions Nordea acts as an active intermediary in the credit derivatives market, especially in Nor-dic based names. Nordea is also using credit derivatives to hedge positions in corporate bonds and collateralized debt obligations (CDOs). Typical derivative products are single name credit default swaps and synthetic CDOs. Credit derivatives are only used to a very limited extent to mitigate the risk in Nordea’s lending credit portfolio. Credit derivatives transactions create counterparty risk equal to other derivatives transac-tions. As it is Nordea’s policy to enter into bilateral, cross product closeout netting agreements with the counterparties, it is not possible to quantify the counterparty risk exposure arising from credit derivatives transactions isolated. Counterparties from which Nordea buys protection are typically subject to a financial collateral agreement, thus the exposure is on daily basis covered by collateral placements. Table 24 and table 25 lists the total outstanding volumes of credit default swaps and CDOs at the end of 2009, split into bought and sold positions. To illustrate the business volume, the figures are provided on gross level, meaning no netting has been considered between bought and sold contracts in the same underlying name. The risk positions are subject to various types of market risk limits, including VaR, and the CDO valuations are subject to fair value adjustments for model risk. These fair value adjustments are recog-nised in the income statement. In the Nordea Group, the credit derivative portfolio is ref-erable to Nordea (Nordea Bank Finland Plc). Table 24Credit default swap volumes, 31 December 2009
Total gross Total gross EURm notional sold notional boughtSingle name CDS: Investment grade 15,302 15,059Single name CDS: Non-Investment grade 7,804 7,715Multi name CDS indices 11,856 12,590Total 34,962 35,364

Nordea Bank Finland Group 2009
42
Table 25
Notionals EURm Bought Soldprotection protection
CDOs, gross 4 308 3,574Hedged exposures 2 928 2,928CDOs, net2 1,3803 6464
Of which: - Equity 259 285- Mezzanine 237 204- Senior 884 157
Collateralised Debt Obligations (CDO) - Exposure1
2 Net exposure disregards exposure where bought and sold tranches are completely identical in terms of reference pool attachment, detachment, maturity and currency.3 Of which investment grade EUR 1,380m and sub investment grade EUR 0m.4 Of which investment grade EUR 1,068m, subinvestment grade EUR 19m and not rated EUR 105m
1 First-To-Default (FTD) swaps are not classified as CDOs and are therefore not included in the table. Net bought protection amounts to EUR 116m and net sold protection to EUR 105m. Both bought and sold protection are, to the predominant part, investment grade.
7.1.2 Counterparty risk
Counterparty risk is the risk that Nordea’s counterpart in a FX, interest rate, commodity, equity or credit derivative contract defaults prior to maturity of the contract and that Nor-dea at that time has a claim on the counterpart. Counterparty risk in Nordea is subject to credit limits like other credit exposures and is treated accordingly. Counterparty risk arises mainly in the trading book, but also in the banking book due to hedging of external funding. 7.1.2.1 Pillar 1 method for counterparty risk Nordea uses the mark-to-market method to calculate the exposure for counterparty risk in accordance with the credit risk framework in CRD, i.e. the sum of current exposure (re-placement cost) and potential future exposure. The potential future exposure is an esti-mate, which reflects possible changes in the market value of the individual contract dur-ing the remaining lifetime, and is measured as the notional principal amount multiplied by a risk weight. The size of the risk weight depends on the contract’s remaining lifetime and the underlying asset. Netting of potential future exposures on contracts within the same legally enforceable netting agreement is done as a function of the gross potential future exposure of all the contracts and the quotient between the net current exposure and the gross current exposure. In table 26, the exposure as well as the RWA and capital requirement split on the expo-sure classes are available. Table 26
EURm Exposure RWACapital
requirementCentral government and central banks 930 14 1Institutions 19,283 5,145 412Corporates 6,440 3,851 308Other 1,789 413 33Total 28,441 9,424 7541 Exposure after closeout netting and collateral agreements
Counterparty risk exposures1, 31 December 2009
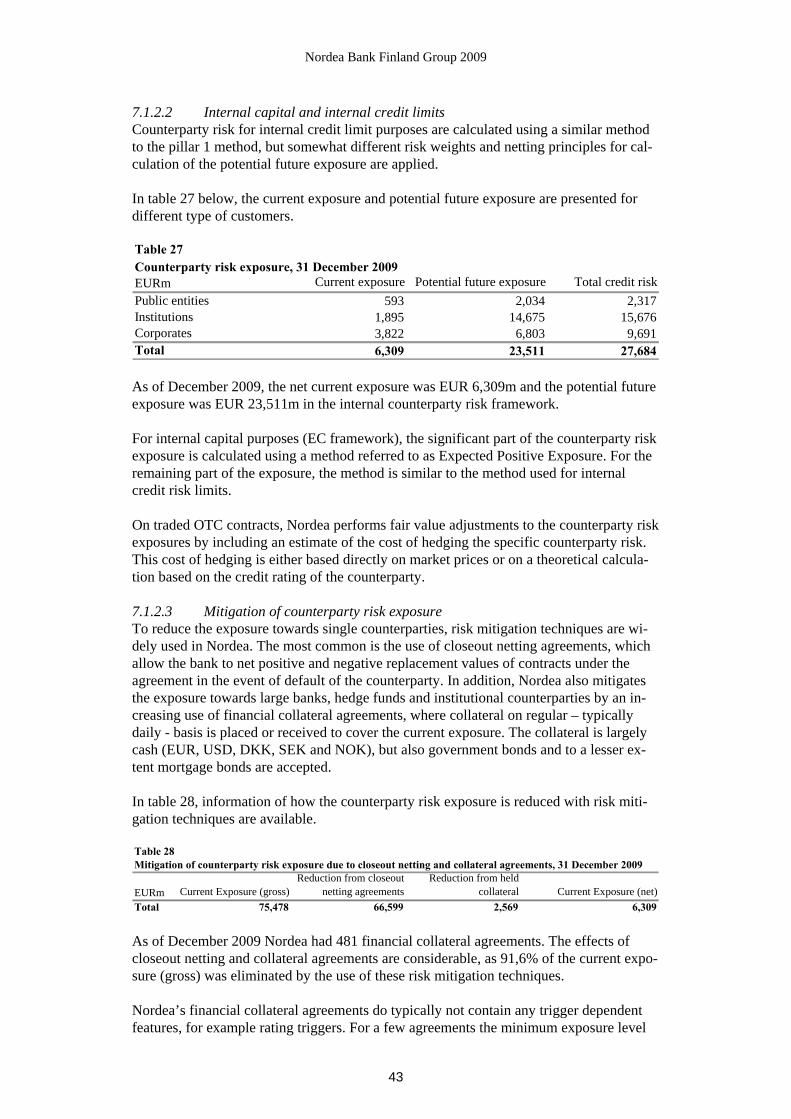
Nordea Bank Finland Group 2009
43
7.1.2.2 Internal capital and internal credit limits Counterparty risk for internal credit limit purposes are calculated using a similar method to the pillar 1 method, but somewhat different risk weights and netting principles for cal-culation of the potential future exposure are applied. In table 27 below, the current exposure and potential future exposure are presented for different type of customers. Table 27Counterparty risk exposure, 31 December 2009EURm Current exposure Potential future exposure Total credit riskPublic entities 593 2,034 2,317Institutions 1,895 14,675 15,676Corporates 3,822 6,803 9,691Total 6,309 23,511 27,684
As of December 2009, the net current exposure was EUR 6,309m and the potential future exposure was EUR 23,511m in the internal counterparty risk framework. For internal capital purposes (EC framework), the significant part of the counterparty risk exposure is calculated using a method referred to as Expected Positive Exposure. For the remaining part of the exposure, the method is similar to the method used for internal credit risk limits. On traded OTC contracts, Nordea performs fair value adjustments to the counterparty risk exposures by including an estimate of the cost of hedging the specific counterparty risk. This cost of hedging is either based directly on market prices or on a theoretical calcula-tion based on the credit rating of the counterparty. 7.1.2.3 Mitigation of counterparty risk exposure To reduce the exposure towards single counterparties, risk mitigation techniques are wi-dely used in Nordea. The most common is the use of closeout netting agreements, which allow the bank to net positive and negative replacement values of contracts under the agreement in the event of default of the counterparty. In addition, Nordea also mitigates the exposure towards large banks, hedge funds and institutional counterparties by an in-creasing use of financial collateral agreements, where collateral on regular – typically daily - basis is placed or received to cover the current exposure. The collateral is largely cash (EUR, USD, DKK, SEK and NOK), but also government bonds and to a lesser ex-tent mortgage bonds are accepted. In table 28, information of how the counterparty risk exposure is reduced with risk miti-gation techniques are available. Table 28
EURm Current Exposure (gross)Reduction from closeout
netting agreementsReduction from held
collateral Current Exposure (net)Total 75,478 66,599 2,569 6,309
Mitigation of counterparty risk exposure due to closeout netting and collateral agreements, 31 December 2009
As of December 2009 Nordea had 481 financial collateral agreements. The effects of closeout netting and collateral agreements are considerable, as 91,6% of the current expo-sure (gross) was eliminated by the use of these risk mitigation techniques. Nordea’s financial collateral agreements do typically not contain any trigger dependent features, for example rating triggers. For a few agreements the minimum exposure level

Nordea Bank Finland Group 2009
44
for further posting of collateral will be lowered in case of a downgrading. Separate credit guidelines are in place for handling of the financial collateral agreements. Finally, Nordea also uses a risk mitigation technique based upon a condition in some of the long-term derivative contracts, which gives Nordea the option to terminate a contract at a specific time or upon the occurrence of specified credit related events. The 10 largest counterparties measured on current exposure (net) account for around 18% (2008: 20%) of Nordea’s total current exposure, and consists of a mix of financial institu-tions, public and corporate counterparties. 7.1.3 Settlement risk
Settlement risk is a type of credit risk arising during the process of settling a contract or execution of a payment. The risk amount is the principal of the transaction, and a loss could occur if a counterpart were to default after Nordea has given irrevocable instructions for a transfer of a principal amount or security, but before receipt of the corresponding payment or security has been finally confirmed. The settlement risk on individual counterparts is restricted by settlement risk limits. Each counterpart is assessed in the credit process and clearing agents, correspondent banks and custodians are selected with a view of minimising settlement risk. Nordea participates in the global FX clearing system CLS (Continuous Linked Settle-ment), which eliminates the settlement risk of FX trades in those currencies and with those counterparts that are eligible for CLS-clearing. 7.1.4 Market risk
For all categories of derivatives, it applies that the market risk stemming from the deriva-tive contracts is an integral part of Nordea’s general setup for managing market risk. A prime purpose of derivatives is to hedge market risk from on balance sheet items. There-fore, when measuring Nordea’s market risk, no distinction is made between risk from on balance sheet items and derivatives. The RWA for market risk therefore contains risk stemming from derivatives, including credit derivatives. See chapter 5 for further descrip-tion of Nordea market risk models and capital requirement for market risk in Nordea.
7.2 Special Purpose Entities and securitisations Nordea has no exposures where capital requirement is calculated according to the secu-ritisation framework. In this section, Nordea’s securitisation activities and related SPEs are described. These are included in the credit or market risk calculations. Banks might have positions that normally are defined as securitisation positions. A secu-ritisation position occurs whenever Nordea is exposed to transactions where payments depend on the performance of an underlying pool of exposures and where a subordination structure ("tranche structure") exists for determination of losses from the same pool. In a traditional securitisation, assets are transferred to a Special Purpose Entity (SPE), which in turn issues securities backed by these assets. In synthetic securitisation, assets are not physically transferred but by using credit derivatives it is possible to synthetically create a situation similar to a physical transfer.

Nordea Bank Finland Group 2009
45
7.2.1 Traditional securitisations
Traditional securitisations where Nordea transfers assets to a SPE are consolidated in the Group accounts and are treated as any other subsidiary for capital adequacy purposes. The assets in the SPEs are included in the banking book and the capital requirement is calculated in accordance with the IRB approach described in chapter 4. In addition to SPEs to which Nordea has transferred assets, Nordea has set up a limited number of SPEs where Nordea acts as sponsor for the SPE. These SPEs have either been set up for enabling investments in structured credit products or for acquiring assets from customers. In accordance with IFRS Nordea does not consolidate SPEs’ assets and liabilities beyond its control. In order to determine whether Nordea controls a SPE or not, Nordea has to make judgements about risks and rewards and assesses the ability to make operational decisions for the SPE in question. Factors included in the assessment are whether the activities of the SPE are being in substance conducted on Nordea’s behalf or if Nordea has in substance the decision making powers, the rights to obtain the majority of the benefits or the majority of the residual- and ownership risks. Nordea consolidates all SPEs where Nordea has retained the majority of the risks and rewards. For the SPEs that are not consolidated the rationale is that Nordea does not have any significant risks or rewards on these assets and liabilities. The SPEs are not consolidated for capital adequacy purposes. Instead, loans and loan commitments to the SPEs are included in the banking book and capital requirement is calculated in accordance with the rules described in section 4 “Credit risk”, as these claims are not subordinated or part of the tranche structure of the SPE. Bonds and notes issued by the SPE and held by Nordea are reported in the trading book and capital re-quirement is calculated in accordance with the rules described in chapter 5 “Market risk”. These bonds and notes are tranched but the capital requirement is calculated as for any other bonds and notes in the trading book in accordance with the current CRD rules. De-rivatives with the SPEs are also included in the trading book, with the counterparty risk calculated in accordance with the rules in section 7.1. As the capital requirement for mar-ket risk is based on the total risk position of Nordea it is not meaningful to calculate sepa-rate RWAs for individual positions in the trading book. More information on the different SPEs can be found in the capital and risk management report for the Nordea Group, section 8. Viking ABCP conduit is related to Nordea Bank Finland as Nordea Bank Finland partly funds the SPE with loans and loan commitments. Mermaid Repackaging Plc was related to Nordea Bank Finland, but Nordea Bank Finland has not outstanding claims on Mermaid as of 2009-12-31 and consequently no RWA.
Nordea Bank Finland Group 2009
46
8. Liquidity risk and Structural Income Interest Risk
8.1 Liquidity management 8.1.1 Management principles and control
The Board of Directors of Nordea Group has the ultimate responsibility for Asset and Liability Management of the Group i.e. limiting and monitoring the Group’s structural risk exposures. Risks in Nordea are measured and reported according to common princi-ples and policies approved by the Board. The Board of Directors also decides on policies for liquidity risk management. These policies are reviewed at least annually. The CEO in GEM decides on the targets for the Group’s risk management regarding SIIR, as well as, within the scope of resolutions adopted by the Board of Directors, the allocation of the liquidity risk limits. The Asset and Liability Committee (ALCO), chaired by the CFO, prepares issues of major importance concerning the Group’s financial operations and financial risks for decision by CEO in GEM. Group Treasury operationalises the targets and limits and develops the liquidity risk and SIIR management frameworks, which con-sists of policies, instructions and guidelines for the whole Group. 8.1.2 Liquidity risk management
Liquidity risk is the risk of being able to meet liquidity commitments only at increased cost or, ultimately, being unable to meet obligations as they fall due. Nordea Group’s liquidity management is based on policy statements resulting in different liquidity risk measures, limits and organisational procedures. Policy statements stipulate that Nordea’s liquidity management reflects a conservative attitude towards liquidity risk. Nordea strives to diversify the Group’s sources of funding and seeks to establish and maintain relationships with investors in order to manage the market access. Broad and diversified funding structure is reflected by the strong presence in Nordea Group’s four domestic markets in the form of a strong and stable retail customer base and the variety of funding programmes. Special focus is given for the composition of the investor base in the terms of geographical range and rating sensitivity. Nordea publishes adequate information on the liquidity situation of Nordea Group to remain trustworthy at all times. Nordea’s li-quidity risk management includes stress testing and a business continuity plan for liquid-ity management. Stress testing is defined as the evaluation of potential effects on a bank’s liquidity situa-tion under a set of exceptional but plausible events. The stress test should identify events or influences that could affect the funding need or the funding price and seek to quantify the potential effects. The purpose of stress tests is to supplement the normal liquidity risk measurement and confirm that the business continuity plan is adequate in stressful events, and that the business continuity plan properly describes procedures to handle a liquidity crisis with minimal damage to Nordea. Nordea stress scenarios are based on assessment of the particular events for which Nordea is presumed to be most vulnerable to taking into account the current business structure and environment. Stress tests focus on the other hand on increased funding need and on the other hand on increased funding price. Group Treasury is responsible for managing the liquidity in Nordea and for compliance with the group wide limits from the Boards of Directors, CEO in GEM and ALCO.

Nordea Bank Finland Group 2009
47
8.1.3 Liquidity risk measurement methods
The liquidity risk management focuses on both short-term liquidity risk and long-term structural liquidity risk. In order to measure the exposure on both horizons, a number of liquidity risk measures have been developed covering all material sources of liquidity risk. In order to avoid short-term funding pressures, Nordea measures the funding gap risk, which expresses the expected maximum accumulated need for raising liquidity in the course of the next 14 days. Cash flows from both on balance sheet and off balance sheet items are included. Funding gap risk is measured and limited for each currency and as a total figure for all currencies combined. The total figure for all currencies com-bined is limited by the Board of Directors. To ensure funding in situations where Nordea is in urgent need of cash and the normal funding sources do not suffice, Nordea holds a liquidity buffer. Limit is set by the Board of Directors for the minimum size of the liquid-ity buffer. The liquidity buffer is set to ensure a total positive cash flow defined by the funding risk measurement and consists of high-grade liquid securities that can be sold or used as collateral in funding operations. The structural liquidity risk of Nordea is meas-ured and limited by the Board of Directors through the net balance of stable funding, which is defined as the difference between stable liabilities and stable assets. These li-abilities primarily comprise retail deposits, bank deposits and bonds with a remaining term to maturity longer than 6 months, and shareholders’ equity, while stable assets pri-marily comprise retail loans, other loans with a remaining term to maturity longer than 6 months and committed facilities. ALCO has set as a target that the net balance of stable funding should be positive, which means that stable assets must be funded by stable li-abilities. 8.1.4 Liquidity risk analysis
The short-term liquidity risk has been held at moderate levels throughout 2009. The aver-age funding gap risk, i.e. the average expected need for raising liquidity in the course of the next 14 days, has been EUR 3.9bn (EUR 3.7bn). Nordea’s liquidity buffer has been in the range EUR 10.2 – 14.4bn (EUR 3.6–13.1bn) throughout 2009 with an average of EUR 11.3bn (EUR 6.0bn). Nordea considers this a high level and it reflects the Group’s conservative attitude towards liquidity risk in general and towards unexpected liquidity events in particular. The yearly average for the net balance of stable funding was EUR -5.8bn (EUR -4.0bn). 8.2 Structural Interest Income Risk (SIIR) SIIR is the amount Nordea’s accumulated net interest income would change during the next 12 months if all interest rates change by one percentage point. SIIR reflects the mis-match in the balance sheet items and the off balance- sheet items when the interest rate re-pricing periods, volumes or reference rates of assets, liabilities and derivatives do not correspond exactly. Nordea Group’s SIIR management is based on policy statements resulting in different SIIR measures, targets and organisational procedures. Policy state-ments focus on optimising financial structure, balanced risk taking and reliable earnings growth, identification of all significant sources of SIIR, measurement under stressful market conditions and adequate public information. Group Treasury has the responsibility for the operational management of SIIR and for complying with Group wide targets. 8.2.1 SIIR measurement methods
The basic measures for SIIR are the two re-pricing gaps measuring the effect on Nordea’s net interest income for a 12 months period of a one percentage point increase; respec-tively decrease, in all interest rates. The re-pricing gaps are calculated under the assump-tion that no new market transactions are made during the period. Main elements of the

Nordea Bank Finland Group 2009
48
customer behaviour and Nordea’s decision-making process concerning Nordea’s own rates are, however, taken into account. For example in a low interest rate environment, when rates are decreasing further, the total decrease of rates cannot be applied to non-maturity deposits since rates cannot be negative. Similarly in an increasing rate environ-ment Nordea may choose not to increase interest rates on all customer deposits corre-spondingly. 8.2.2 SIIR analysis
At the end of the year, the SIIR for decreasing market rates was EUR -88m (EUR -171m) and the SIIR for increasing rates was EUR 117m (EUR 81m). These figures imply that net interest income would decrease if interest rates fall and increase if interest rates rise. Table 29Re-pricing gap analysis, 31 December 2009Interest Rate Fixing Period Group bsWithin 3 months 3-6 month 6-12 month 1-2 year 2-5 year >5 year Non Repricing Total
AssetsInterest bearing assets 141,670 114,076 11,570 7,396 4,285 2,079 988 1,277 141,670Non interest bearing assets 79,494 0 0 0 0 0 0 79,494 79,494Total assets 221,165 114,076 11,570 7,396 4,285 2,079 988 80,771 221,165
LiabilitiesInterest bearing liabilities 128,314 110,540 6,196 4,251 4,076 2,785 466 0 128,314Non interest bearing liabilities 92,851 0 0 0 0 0 0 92,851 92,851Total liabilities 221,165 110,540 6,196 4,251 4,076 2,785 466 92,851 221,165Off-balance sheet items NET 5,732 -2,143 -2,842 -684 -29 -34 0Exposure 9,268 3,231 303 -475 -735 488 -12,080Cumulative exposure 12,499 12,802 12,327 11,591 12,080 0

Nordea Bank Finland Group 2009
49
9. ICAAP
The financial turmoil has increased the focus on banks’ internal capital evaluation proc-esses and their capability to asses the solvency need to cover losses and other cyclicality effects that arise in an economic downturn. Finanssivalvonta agreed that Nordea Bank Finland and its legal entities were adequately capitalised given its risk profile and portfolio, in accordance with the 2009 ICAAP and SREP process. In this chapter the Internal Capital Adequacy Assessment Process (ICAAP) is described, including components such as governance of the process, assessment of internal capital requirements and stress testing.
9.1 The process The ICAAP is a continuous process within Nordea which contributes to increased aware-ness of Nordea’s capital requirements and exposure to material risks throughout the or-ganisation, ensuring that there is sufficient capital of adequate quality available to support the underlying risk profile. The process includes a consistent dialogue with Finanssival-vonta with respect to capital management, measurement and mitigation techniques used within Nordea Bank Finland. The capital ratios and capital forecasts for the Nordea Bank Finland and its legal entities are followed up quarterly by Group Risk Modelling within Group Corporate Centre and are reported to the Capital Planning Forum and the Board of Directors. On an annual basis the ICAAP is thoroughly reviewed and documented and ultimately decided on by the Board of Directors.
9.1.1 Capital planning and capital policy The capital planning process includes a forecast of the development of the capital re-quirement, e.g. the pillar 1 capital requirement, and the available capital, e.g. measured as capital base, Tier 1 or core Tier 1 capital. The capital planning is based on key compo-nents of Nordea’s Rolling Financial Forecast (RFF), such as lending volume growth by customer segment and country and forecasts of net profit including assumptions of future loan losses. The capital planning process also considers forecasts of the state of the econ-omy, to reflect the future impact of credit risk migration on the capital situation of Nordea Bank Finland and its legal entities. An active capital planning process ensures that Nor-dea Bank Finland is prepared to make necessary capital arrangements regardless of the state of the economy. The capital policy constitutes a major component of the ICAAP and as such has a key role in capital planning. The capital policy is designed with consideration given to the internal capital requirements, defined using a “Pillar 1 plus Pillar 2” approach. This methodology uses the pillar 1 capital requirements for credit risk, market risk and opera-tional risk as outlined in the CRD as the starting point for its risk assessment. In the next step pillar 2 risks, risks not included in the CRD, are considered using internal capital models to define the capital requirement. The capital policy for the Nordea Group states target capital ratios over a business cycle.
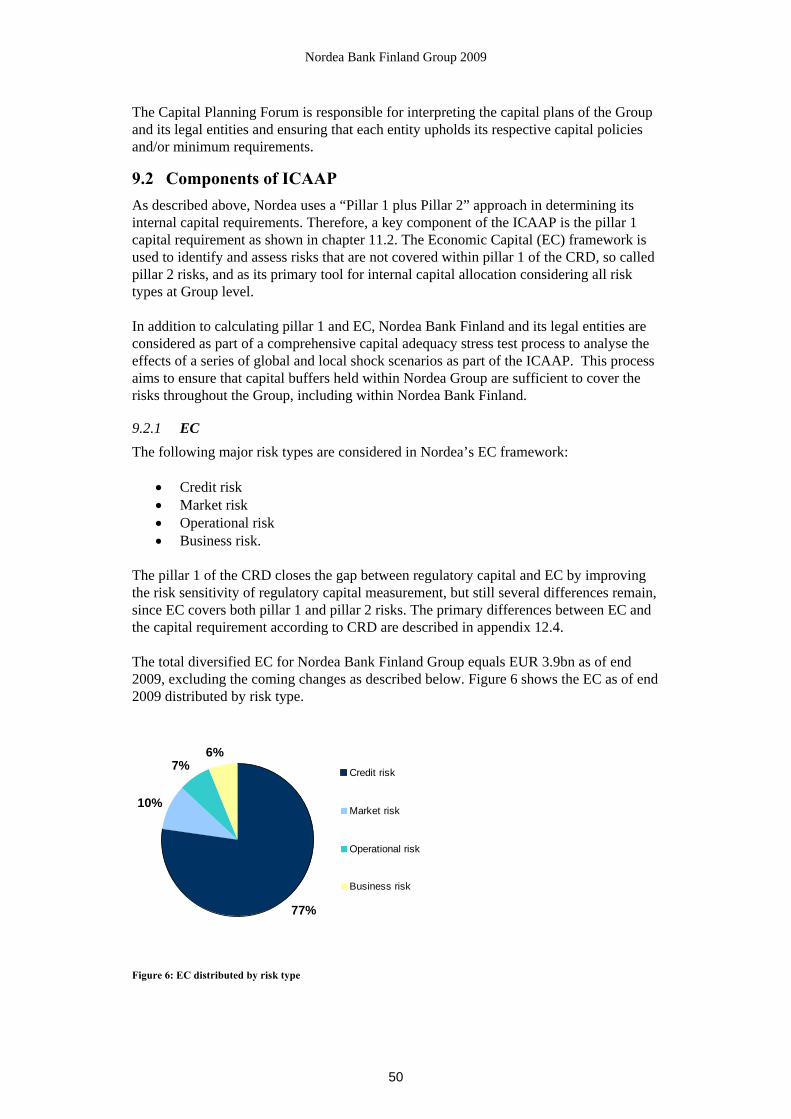
Nordea Bank Finland Group 2009
50
The Capital Planning Forum is responsible for interpreting the capital plans of the Group and its legal entities and ensuring that each entity upholds its respective capital policies and/or minimum requirements.
9.2 Components of ICAAP As described above, Nordea uses a “Pillar 1 plus Pillar 2” approach in determining its internal capital requirements. Therefore, a key component of the ICAAP is the pillar 1 capital requirement as shown in chapter 11.2. The Economic Capital (EC) framework is used to identify and assess risks that are not covered within pillar 1 of the CRD, so called pillar 2 risks, and as its primary tool for internal capital allocation considering all risk types at Group level. In addition to calculating pillar 1 and EC, Nordea Bank Finland and its legal entities are considered as part of a comprehensive capital adequacy stress test process to analyse the effects of a series of global and local shock scenarios as part of the ICAAP. This process aims to ensure that capital buffers held within Nordea Group are sufficient to cover the risks throughout the Group, including within Nordea Bank Finland.
9.2.1 EC The following major risk types are considered in Nordea’s EC framework:
• Credit risk • Market risk • Operational risk • Business risk.
The pillar 1 of the CRD closes the gap between regulatory capital and EC by improving the risk sensitivity of regulatory capital measurement, but still several differences remain, since EC covers both pillar 1 and pillar 2 risks. The primary differences between EC and the capital requirement according to CRD are described in appendix 12.4. The total diversified EC for Nordea Bank Finland Group equals EUR 3.9bn as of end 2009, excluding the coming changes as described below. Figure 6 shows the EC as of end 2009 distributed by risk type. Figure 6: EC distributed by risk type
77%
10%
7%6%
Credit risk
Market risk
Operational risk
Business risk

Nordea Bank Finland Group 2009
51
Changes to the Economic Capital Framework As a consequence of the financial turmoil, the focus has shifted towards basing capital adequacy analysis on regulatory capital requirements rather than the result of internal capital models (EC). Due to the shift in focus and to ensure that each customer unit within Nordea is correctly charged for the actual capital consumption, Nordea has decided to further align the EC framework to the regulatory capital framework, with effect in the beginning of 2010. This alignment provides a framework that links capital allocation to Nordea Bank Finland’s internal capital requirement and supports capital efficiency. The alignment implies the following material changes to the EC framework for 2010:
• Credit risk - Credit risk calculations in EC will in general be aligned to regulatory capital. This implies that the significant part of the corporate and institution expo-sures will be calculated according to the Foundation IRB approach, i.e. the inter-nal estimates of LGD and CCF will be replaced by the regulatory estimates. However, in order to keep a risk differentiated measure within the EC frame-work, those corporate and institution portfolios not yet approved for Foundation IRB will be calculated as if they were approved. Moreover, an improved model for sector concentration risk will be used in the EC framework for 2010.
• Market risk - Market risk EC will be based on the same VaR model and assump-
tions as used in the calculation for market risk in regulatory capital. The change results in a more conservative approach in the Expected Tails Loss technique.
• Operational risk - Operational risk EC will be calculated as the regulatory opera-
tional risk capital. As a result of the alignment to regulatory capital the opera-tional risk capital will be calculated on a yearly basis instead of a quarterly basis and calculated based on a three years average.
9.2.2 Stress tests The financial turmoil has increased the focus on stress tests and banks ability to manage a severe economic downturn, facing high levels of losses and other cyclicality effects. During 2009 Nordea has performed several internal stress tests in order to evaluate gen-eral effects of an economic downturn as well as effects for specifically identified high risk areas. In addition to the internal stress tests, Nordea Group has been part of external stress tests performed by financial supervisors, central banks and equity analysts. The results clearly show that the Nordea Group is well capitalised and will manage periods of economic stress. This demonstrates the strength of Nordea´s capital planning and its abil-ity to asses a sufficient need of capital. As a part of the ICAAP and the capital planning process, internal firm wide stress tests are used as an important risk management tool in order to determine how severe unex-pected changes in business and macro environment will effect the capital need. The stress test reveals how the capital need varies during a stress scenario, where impact on finan-cial statements, regulatory capital requirements, EC and capital ratios occur. Nordea conducts a comprehensive stress test annually, while ad-hoc stress tests, reverse stress tests and parameter sensitivity analyses for various risk parameters are performed on a need by need basis. The stress test process is divided into the following three steps:
Nordea Bank Finland Group 2009
52
• Scenario development and translation • Calculation • Analysis and reporting
In addition to the firm wide stress tests which covers all risks defined in the EC frame-work, Nordea is performing several stand alone stress tests for each risk type such as market risk and liquidity risk.
9.2.2.1 Scenario development and translation
The annual stress test is based on three-year economic scenarios for each Nordic country and the scenarios are designed to replicate shocks that are particularly relevant for the existing portfolio. The design of the stressed scenarios is performed by experts within Nordea Economic Research division in each Nordic country. In addition to the stress scenarios Nordea uses the RFF as a base case and the difference between the stressed and the base case scenario will set the ground for the stress effect and the additional capital need. While the annual stress test is based on a complex macro economic scenario which in-volves estimates of several macroeconomic factors, the ad-hoc stress tests are based on direct estimates of risk parameter changes or based on a few macro variables. This en-ables senior management to easily define scenarios and evaluate the effect of them in capital planning. After a scenario is developed, the effects are translated and the risk and financial parame-ters are simulated. Advanced models in combination with expert judgment from business areas are used in order to determine the effect of the scenario. As an example, in the annual stress test, the scenario is translated to impact the parame-ters listed in table 30. Table 30Parameters in the annual stress test
Parameter ImpactVolumes Volumes from deposits and lending are adjusted according to each scenario by
isolating the specific impact of each parameterMargins The margins are adjusted according to the development of the credit spread and the
maturity of the portfolioNet interest income Net interest income figures are adjusted according to the change in volume and
margins in deposits and lendingNet fee and commission income Net fee and commission income is adjusted for changes in fees and commissions
from activities in Asset ManagementFunding cost Changes in funding costs deriving from liquidity risk is incorporated and increases
the cost of long-term and short-term funding and reduces the net interest incomeLoan losses Loan losses are calculated using an expected loss/provisions-recoveries model or
stated in the scenario as bps of lending for each segment and countryExposures Exposures are adjusted with the volume and growth expectations as well as the
loan lossesRating migration Each year a new rating distribution is created for each portfolio. This includes
stress testing of the financial statements for the majority of corporate customers which results in a new rating according to the rating model
Probability of default The PD values are stressed in order to reflect increases in defaults, simulating the existing process for defining probability of default.
Collateral values The collateral coverage is stressed by moving parts of the exposure from secured to unsecured , resulting in an increase in average weighted LGD

Nordea Bank Finland Group 2009
53
9.2.2.2 Calculation
The stressed figures and parameters from the scenario are used to calculate the effect on the regulatory capital requirements, EC and the financial statements. The regulatory capi-tal is calculated for the credit risk, market risk and operational risk according to the CRD with regards to the IRB approaches used. The calculations for each risk type are aggre-gated into total capital requirement figures.
EC with the stressed parameters is calculated for credit risk, market risk, operational risk and business risk according to the EC framework. The calculation for each risk type is aggregated into total EC figures, including diversification effects.
Stressed figures for loan losses, net profit and dividend from the financial statements are used to calculate the effect on the capital base components. The capital base is set in rela-tion to the regulatory capital or EC in order to calculate the effect on capital ratios during a stress scenario.
GDP
Unemployment
Inflation
Stock prices
Property prices
Interest rates
Credit Risk
Market Risk
Other Risks
Income
Loan losses
Expenses
Capital Requirements
Capital Base
Capital
Ratios
Macro Scenario Effect on risks and P/L figures
Changes in Capital requirements and
Capital Base
Stressed Capital Ratios
Figure 7: Calculation process
9.2.2.3 Analysis and reporting
The first level of reporting in Nordea is the Capital Planning Forum, which reviews the details of the stress testing and implications on future capital need. The finalised results showing the implications of the stress tests on the adequacy of existing capital are distrib-uted to the Board of Directors as part of internal risk reporting and the ICAAP documen-tation. The results of the stress testing should support senior management’s understanding of the implications of the current capital strategy given potential market shocks. Based on this information senior management is able to ensure that enough capital is held against the risk of stressed or similar events occurring. During 2009 the turbulence in the financial markets has continued. In order to evaluate the effect of continued turbulence, Nordea actively works with stress tests as a part of the capital planning process. The stress tests generally take a firm-wide perspective, but spe-cial focus areas are addressed on an ad-hoc basis. The outcome of the stress tests demonstrates how Nordea’s loan loss and capital ratios will change during a stress scenario. The outcome is then analyzed in order to decide the capital need during a downturn period and ensure that Nordea is well capitalised.

Nordea Bank Finland Group 2009
54
9.3 Conclusion of ICAAP and SREP Nordea Bank Finland and its legal entities’ capital levels have been and continue to be adequate to support its risks from an internal perspective as well as from the perspective of regulators. Heading into 2010, Nordea will review the capital situation closely and maintain its open dialogue with Finanssivalvonta. The 2010 ICAAP and SREP dialogue occurs throughout the year is expected to occur following the spring submission of the Nordea Bank Finland documentation.

Nordea Bank Finland Group 2009
55
10. Capital base components
During the last year, the quality of banks capital has been very much in focus. Nordea Bank Finland has basically a strong capital position, based on predominant form of tier 1 capital and only a limited part of additional tier 2 capital in form of undated, subordi-nate loans. This chapter describes the conditions and major components of the capital base. This chapter describes the conditions and major components of the capital base. The cal-culation of capital base is done in accordance with the CRD and the Finnish legislation. The outcome must as a minimum correspond to the sum of the capital requirement for credit risks, market risks, operational risks and capital requirement related to transition rules. In the capital base for the financial group only capital contributed by subsidiaries or firms that are covered by the consolidated accounts are to be included. Items included in the capital base should without restrictions or time constrains be avail-able for the institution to cover risk and absorb potential losses. All amounts are included net of any tax charge. Generally, Nordea Group has the ability to transfer capital within its legal entities without material restrictions. International transfers of capital between legal entities are normally possible after approval by of the local regulator and are of importance when governing the capital position within the Group.

Nordea Bank Finland Group 2009
56
A summary of items included in the capital base is available in table 31. Table 31Summary of items included in capital base
31 December 31 December 2009 2008
2,319 2,319599 599
Eligible capital 2,918 2,917Reserves 7,047 7,019Minority interests 6 7
1,001 1,331Eligible reserves 8,054 8,357Tier 1 capital (before hybrid capital and deductions) 10,972 11,274Hybrid capital loans subject to limits 0 0Proposed/actual dividend -600 -1,300Deferred tax assets -17 -15Intangible assets -69 -59Deductions for investments in credtit institutions -22 -21IRB provisions shortfall (-) -72 -73
-93Deductions from original own funds -873 -1,469
Tier 1 capital (net after deduction) 10,099 9,807- of which hybrid capital 0 0
Additional own fundsSecurities of indeterminate dur. and other instr. 543 547Subordinate loan capital 0 600Other additional own funds 0 0Tier 2 capital (before deductions) 543 1,147Deductions for investments in credtit institutions -22 -21IRB provisions shortfall (-) -72 -73Deductions from original additional own funds -94 -94Tier 2 capital ( net after deductions) 449 1,054
Total own funds for solvency purposes 10,548 10,860
Other items, net
Original own fundsPaid up capitalShare premium
Income (positive/negative) from current year
EURmCalculation of total capital base
The capital base (referred to as own funds in the CRD) is the sum of tier 1 capital and tier 2 capital after deductions and less capital related to insurance companies. The two main components in the capital base are core equity in the balance sheet and subordinated debt. Below is a detailed description of the items included in the capital base. The capital ratio is calculated by dividing the capital base with RWA assets while the quotient is calculated from the capital base in relation to the capital requirement.
10.1 Tier 1 capital Tier 1 capital is defined as capital of the same or close to the character of eligible capital, eligible reserves and can also include also a limited part instrument hybrid capital loans (perpetual loans). Core tier 1 capital is defined as original own funds including deductions following local regulations and also excluding potential hybrid capital.

Nordea Bank Finland Group 2009
57
10.1.1 Eligible capital
Paid up capital is equal to the share capital contributed by shareholders, with potential deduction of repurchased own shares or own shares temporary included in trading portfo-lios are deducted from eligible reserves. Eligible capital also includes share premium capital. 10.1.2 Eligible reserves
Eligible reserves consist primarily of retained earnings, other reserves, minority interest and income from current year. Retained earning are earnings from previous years re-ported via the income statement. Other reserves are related to the capital part of untaxed reserves, revaluation and translation reserves referred to acquisitions and associated com-panies under the equity method. The equity interests of minority shareholdings in compa-nies that are fully consolidated in the financial companies group are also included. Posi-tive income from current year is included as eligible capital after verification by the ex-ternal auditors. However, negative income must always be included as a deduction. Repurchased own shares or own shares temporary included in trading portfolios are de-ducted from eligible reserves. 10.1.3 Hybrid capital loans subject to limits
The requirements for including undated loans in tier 1 capital is restricted and repurchase can normally not take place until five years after the loan originally is issued. Hybrid capital loans, undated subordinated loans, may be repaid only by decision from Board of Directors in Nordea and with the permission of the Finnish Financial Supervisory Author-ity. Further, there are restrictions related to step up conditions, order of priority, interest payments under constraint conditions and the level of amount that can be part of the tier 1 capital. Previous years the limit for including hybrid capital in the tier 1 capital has been restricted to 15% of total tier 1 capital but after decision by the Finnish FSA and valid from January 2009, the limit is changed to be at a maximum 50% of the tier 1 capital after relevant deductions. The new regulation includes different limitations depending on the terms in the hybrid capital loan issue. For hybrid capital loans including step up condi-tions or other conditions that could give incentive to repurchase, the limit of 15% still apply. If there are any surplus after applying the legal limit, exceeding amount can be transferred to tier 2 capital. The upper limit of 50 % referrers to loans with convertible condition. For hybrid capital loans with non step up conditions, a limit of 35 % applies. The new rules are in accordance with adopted change in the CRD. Currently there are no hybrid capital loans issued by Nordea Bank Finland or included in the capital base of Nordea Bank Finland.
10.1.4 Deductions from Tier 1 capital
10.1.4.1 Proposed/actual dividend In relation to income for the period, corresponding dividend should be deducted. The amount is deducted from the tier 1 capital and amounts to proposed distribution to share-holders by decision of the annual general meeting of shareholders. 10.1.4.2 Deferred tax assets In accordance with local legal requirements deferred tax assets has been deducted from the tier 1 capital. Deducted amount is based on accounting standards relevant for the groups of institutions which constitute the capital base.

Nordea Bank Finland Group 2009
58
10.1.4.3 Intangible assets Intangible assets should be deducted from tier 1 capital. The significant part of deducted intangible assets contains of goodwill. Other intangible assets relates to IT software and development. The increase during year 2009 refers to IT software. 10.1.4.4 Deductions for investments in credit institutions The capital base should be deducted for equity holdings and some other certain types of contributions to institutions that are not part of the financial companies group (in Nordea foremost associated companies). 50 percent should be deducted from tier 1 capital and 50 percent should be deducted from tier 2 capital. 10.1.4.5 IRB provisions shortfall The calculation of the capital base is in accordance with the CRD and the Swedish legis-lation. The differences between EL and actual provision made for the related exposures are adjusted for in the capital base. The negative difference (when the EL amount is lar-ger than the provision amount) is included in the capital base as shortfall. According to the rules in the CRD, the shortfall amount shall be deducted from the capital base and be divided equally into both tier 1 capital and tier 2 capital. For the purpose of the CRD tran-sitional rules calculations of the shortfall is under Finnish regulation deducted from the RWA to be neutralised in a Basel I perspective. A positive difference (provisions exceed EL) can be included in tier 2 capital with certain limitations (maximum 0,6 percentage of IRB RWA). 10.1.4.6 Other deduction Other deductions contains of pension assets in excess of related liabilities. Surplus net value of pension plans for employees should under certain circumstances be deducted from the tier 1 capital. Other deductions 2009 includes pension surplus values of EUR 93m.
10.2 Tier 2 capital The tier 2 capital is mainly related to subordinated debt with some specific deductions. Tier 2 capital includes two different types of subordinated loan capital; perpetual loans and dated loans. The total tier 2 amount may not exceed tier 1 and dated tier 2 loans may not exceed half the amount of tier 1. The limits are set after deductions. The basic principle for subordinated debt in the capital base is the order of priority in a default or bankruptcy situation. Under such conditions, the holder of the subordinated loan would be repaid after other creditors, but before shareholders. The subordinated debt will to some extent prevent the institution to go into liquidation. The amount possible to include in the tier 2 capital related to dated loans is reduced if the remaining maturity is less then five years. Outstanding amount in the specific issue is deducted by 20 % for each year beyond five years. As of end year 2009, Nordea Bank Finland holds EUR 543m in undated subordinated debenture loans. The amount of EUR 600m in undated subordinated debenture loans in-cluded in the tier 2 year 2008 has been bought back during 2009. 10.2.1 Other additional funds
Other additional funds contains of adjustment to valuation differences in available for sale equities transferred to core additional own funds. Unrealised gains from equity hold-ings classified as available for sale securities can according to regulation only be included

Nordea Bank Finland Group 2009
59
in tier 2 capital. Nordea Bank Finland has currently no such holdings affecting the capital base. 10.2.2 Deductions from Tier 2 capital
10.2.2.1 Deductions for investments in credit institutions The capital base should be deducted for equity holdings and some other certain types of contributions to institutions that are not part of the financial companies group (in Nordea foremost associated companies). 50 percent should be deducted from tier 1 capital and 50 percent should be deducted from tier 2 capital. 10.2.2.2 IRB provisions shortfall The differences between EL and provision made for the related exposures are adjusted for in the tier 2 capital, see section 10.1.4.5 for further explanation.
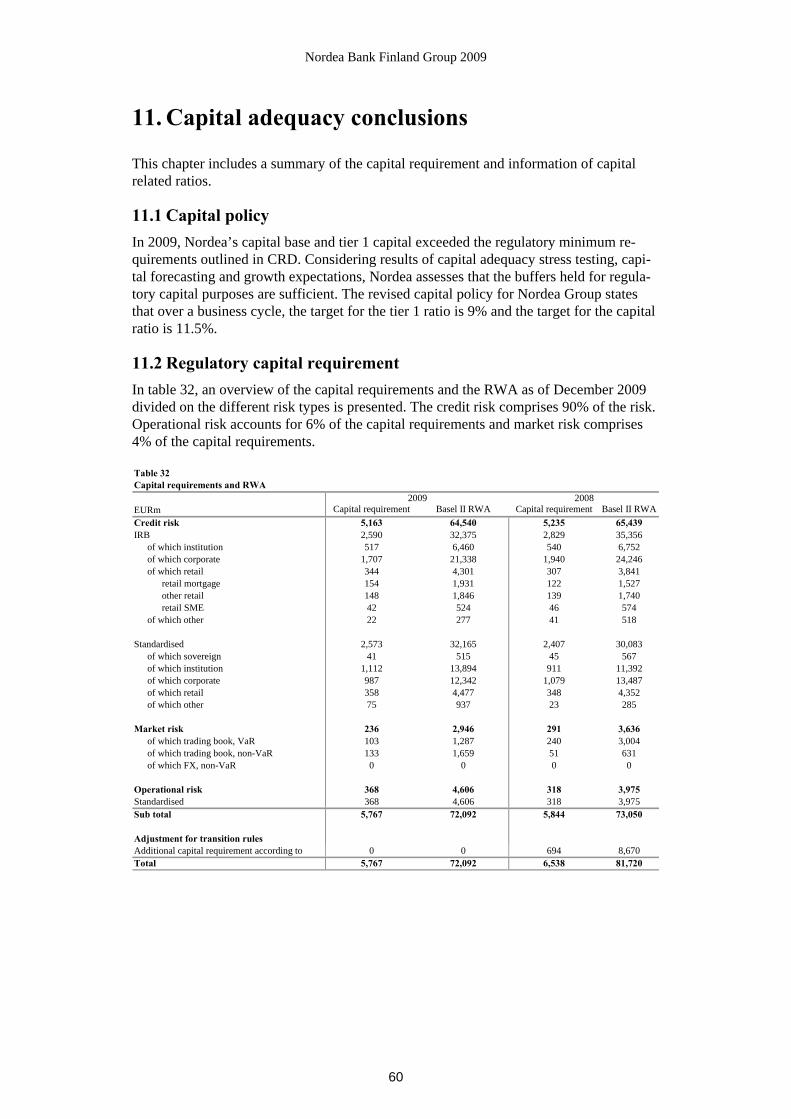
Nordea Bank Finland Group 2009
60
11. Capital adequacy conclusions
This chapter includes a summary of the capital requirement and information of capital related ratios.
11.1 Capital policy In 2009, Nordea’s capital base and tier 1 capital exceeded the regulatory minimum re-quirements outlined in CRD. Considering results of capital adequacy stress testing, capi-tal forecasting and growth expectations, Nordea assesses that the buffers held for regula-tory capital purposes are sufficient. The revised capital policy for Nordea Group states that over a business cycle, the target for the tier 1 ratio is 9% and the target for the capital ratio is 11.5%.
11.2 Regulatory capital requirement In table 32, an overview of the capital requirements and the RWA as of December 2009 divided on the different risk types is presented. The credit risk comprises 90% of the risk. Operational risk accounts for 6% of the capital requirements and market risk comprises 4% of the capital requirements. Table 32Capital requirements and RWA
EURm Capital requirement Basel II RWA Capital requirement Basel II RWACredit risk 5,163 64,540 5,235 65,439IRB 2,590 32,375 2,829 35,356
of which institution 517 6,460 540 6,752of which corporate 1,707 21,338 1,940 24,246of which retail 344 4,301 307 3,841
retail mortgage 154 1,931 122 1,527other retail 148 1,846 139 1,740retail SME 42 524 46 574
of which other 22 277 41 518
Standardised 2,573 32,165 2,407 30,083of which sovereign 41 515 45 567of which institution 1,112 13,894 911 11,392of which corporate 987 12,342 1,079 13,487of which retail 358 4,477 348 4,352of which other 75 937 23 285
Market risk 236 2,946 291 3,636of which trading book, VaR 103 1,287 240 3,004of which trading book, non-VaR 133 1,659 51 631of which FX, non-VaR 0 0 0 0
Operational risk 368 4,606 318 3,975Standardised 368 4,606 318 3,975Sub total 5,767 72,092 5,844 73,050
Adjustment for transition rules0 0 694 8,670
Total 5,767 72,092 6,538 81,720
2009 2008
Additional capital requirement according to

Nordea Bank Finland Group 2009
61
11.3 Capital ratios The transition phase of Basel II creates a need to manage the bank using a variety of capi-tal measurements and capital ratios. Table 33 shows that the regulatory transition rules comprise a floor on Nordea´s capital requirement when compared to Basel II minimum requirements. Table 33Capital adequacy ratios
EURbn 31 December 2009 31 December 2008RWA incl transition rules 72.1 81.7RWA Basel II (pillar 1) excl transition rules 72.1 73.0Regulatory Capital requirement incl transition rules 5.8 6.5Economic Capital 3.9 3.5Capital base 10.5 10.9Tier 1 capital 10.1 9.8
Tier 1 ratio including transition rules (%) 14.0% 12.0%Tier 1 ratio excluding transition rules (%) 14.0% 13.4%Core capital ratio including transition rules (%) 14.0% 12.0%Core capital ratio excluding transition rules (%) 14.0% 13.4%Capital ratio including transition rules (%) 14.6% 13.3%Capital ratio excluding transition rules (%) 14.6% 14.9%Capital adequacy quotient (Capital base / Regulatory Capital requirement incl transition rules 1.8 1.7

Nordea Bank Finland Group 2009
62
12. Appendix
12.1 General description of pillar 1, 2 and 3 The Basel II framework was an international initiative with the purpose to implement a more risk sensitive framework for the assessment of risk for the calculation of regulatory capital, i.e. the minimum capital that the institution must hold. The intention was also to align the actual assessment of risk within the institutions with the assessment of the regu-latory capital by allowing use of internal models also for credit risk.
From the beginning of 2007, the new CRD came into effect as the common framework for implementing the Basel II framework in EU. The CRD is built on three pillars: • Pillar 1 – requirements for the calculation of the RWAs and capital requirement • Pillar 2 – rules for the Supervisory Review Process (SRP), including the ICAAP • Pillar 3 – rules for the disclosure of risk and capital management, including capital ade-quacy The CRD contains a detailed set of minimum requirements to assure the conceptual soundness and integrity of the internal assessment. In order to prevent large short-term effects on capital requirements, the regulators have introduced transitions rule (also known as capital floor) for all institutions implementing the new capital adequacy report-ing. The transition rules, in force 2007-2009, with prolongation at least to the end of 2011, mark the lowest eligible capital base and relate directly to the capital requirements calculated under Basel I regulations. During 2007 the capital requirements were no less than 95% of the capital requirements calculated under Basel I regulations. For 2008 and 2009, the amounts of capital requirements were allowed to be 90% respectively 80% of the capital requirements calculated under Basel I regulations. The transition rules have been prolonged, at least for 2010 and 2011, and the capital requirement is not allowed to be below 80% of the capital requirement calculated under Basel I regulations. 12.1.1 Pillar 1
The new CRD is not changing the minimum required capital ratio of 8% compared to the previous regulation (Basel I). The changes are related to the definition and calculations of the RWA, which is the method used to measure the risk exposure of the reporting institu-tion. The regulatory capital requirements are calculated using the following formula:
Minimum capital requirements = Capital base / RWAwhere,Minimum capital requirements ≥ 8%
The RWAs are calculated by using more sophisticated and risk sensitive methods than previously. Credit risk and market risk are two essential risk types like in Basel I, while operational risk is introduced as a new risk type in the CRD. The table below identifies the approaches available for calculating RWA in each risk type in accordance with the CRD:

Nordea Bank Finland Group 2009
63
Primary approaches in the CRD Approaches for reporting capital requirements
Credit Risk Market Risk Operational Risk (1) Standardised Approach (1) Standardised Approach (1) Basic Indicator Ap-
proach (2) Foundation Internal Rat-ing Based Approach (FIRB)
(2) Internal Models Ap-proach
(2) Standardised Approach
(3) Advanced Internal Rating Based Approach (AIRB)
(3) Advanced Measurement Approach
The standardised approach for calculating credit risk is close to the previous Basel I regu-lation, except an additional possibility to use external rating for the counterparties and wider use of financial collateral. The RWA is set by multiplying the exposure with a risk weight factor dependent on the external rating and exposure class. Credit risk according to FIRB is based on the internal rating and PD for each counterpart and fixed estimates for LGD and CCF, while Advanced IRB is based on internal esti-mates for PD, LGD and CCF
Below is an overview of the key parameters used in calculation of RWA in Pillar I. 12.1.2 Pillar 2
Pillar 2, or the SRP, comprises two processes: • the ICAAP and • the SREP
The SRP is designed to ensure that institutions identify their material risk and allocate adequate capital, and employ sufficient management processes, to support such risk. The SRP also encourages institutions to develop and use better risk management techniques in monitoring and measuring risk in addition to the credit, market and operational risk in the CRD. The ICAAP allows banks to review their risk management policies and capital
PD (%) Probability of default =
What is the likelihood that a customer will default?
LGD (%) =
Loss Given Default
How much of the exposure should Nordea expect to lose?
Exposure at Default
EAD(€) =
If the customer defaults, what will Nordea’s exposure be?
RWA input
Maturity M (t) =
Figure 8: Key parameters in the RWA calculation
How long is the remaining expected maturity?

Nordea Bank Finland Group 2009
64
positions relative to the risk they undertake. In ICAAP, the institution ensures that it has sufficient available capital to meet regulatory and internal capital requirements, even during periods of economic or financial stress. The ICAAP includes all components of risk management, from daily risk management of material risk to the more strategic capi-tal management of the entire Group and its legal entities. The SREP is the supervisor’s review of the institution’s capital management and an assessment of the institutes internal controls and governance. Other risk types, which are not covered by the minimum capital requirements according to pillar 1, are typically liquidity risk, business risk, interest rate risk in the non-trading book and concentration risk. These are covered either by capital or risk management and mitigation processes under pillar 2. 12.1.3 Pillar 3
In the CRD it is also stipulated how and when institutions should disclose capital and risk management. The disclosure should follow the requirements according to the pillar 3. The main requirements are:
• Description of the Group structure and overall risk and capital management • Regulatory capital requirements and the capital base • Credit risk, including RWA calculations and loan losses • Market risk • Operational risk
12.2 Financial stability plan in Finland The Nordic governments have established a number of measures in response to the global financial crisis. The measures were presented during the autumn 2008 and the beginning of 2009. Similar to many stability packages within EU, the measures include the follow-ing elements: implementation of a general framework for giving state support to ailing credit institutions, the creation of a stabilisation fund, a temporary guarantee program and a recapitalisation scheme. Nordea welcomes the actions taken by the Nordic governments to stabilise the markets. Nordea has to date not participated in the Finnish scheme.
12.3 Exposure classes for Credit risk A diversified credit portfolio can be divided into the exposure classes defined by the CRD. The basis for calculation of the exposure in the RWA formula is the division of exposure classes. Nordea is approved to use the FIRB approach for the exposure classes: institution, corporate and other non-credit obligation assets. For the exposure class retail the IRB approach is approved to be used. For the remaining exposure classes Nordea uses the Standardised Approach. Following is a description of what exposures are included in the different exposure classes. 12.3.1 IRB exposure classes
Institution exposures Exposures to credit institutions and investment firms are classified as exposures to institu-tions. In addition, exposures to regional governments, local authorities and multilateral development banks are classified as exposures to institutions if they are not treated as exposures to sovereigns2 according to regulations issued by the authorities.
2 Sovereigns include central governments, central banks, regional governments, local authorities and other public sector entities.

Nordea Bank Finland Group 2009
65
Corporate exposures Exposures that are not assigned to any of the other exposure classes are classified as cor-porate exposures. The corporate exposure class contains exposures that are rated in ac-cordance to Nordea’s internal guidelines. Retail exposures Exposures to small and medium sized entities (with an exposure of less than EUR 250t) and to private individuals are included in the retail exposure class and defined in accor-dance to Nordea’s internal guidelines for scoring. Other non- credit obligation assets Assets that do not require any performance from any counterparty are classified as non credit-obligation assets. 12.3.2 Standardised exposure classes
Central governments and central banks Exposures to central governments and central banks are, subject to national discretion, treated with low risk if the counterparty is within European Economic Area (EEA) mem-ber states. Subject to national discretion, the risk weight of 0% is, for the majority of these exposures, applied in Nordea. Regional governments and local authorities Exposures to regional governments and local authorities are included in this exposure class. Exposures to regional governments and local authorities are treated as exposures to the central government in whose jurisdiction they are established, with the exception of Norway, where a risk weight of 20% is applied. Institution exposures Exposures to institutions are assigned a risk weight depending on the external rating, by an eligible rating agency, of the central government in the jurisdiction of the institution. In Poland, the risk weight of the exposure is determined according to the external rating of the institution. Specific rules also determine how to treat an exposure where no rating by an eligible rating agency exists. Therefore, the risk weights can differ from 0% to 150% for these exposures. Corporate exposures Exposures to corporate rated by eligible rating agency are assigned a risk weight from 20% to 150%. Exposures without external rating are assigned a risk weight of 100%. Retail exposures Retail exposures are assigned a risk weight of 75%. Exposures secured by real estate Exposures that are secured by mortgages on residential or commercial real estate are in-cluded in this exposure class. Exposures secured by mortgages on residential real estate are assigned a risk weight of 35%. The risk weight is only reduced for the part of the ex-posure that is fully secured. Exposures that are secured by commercial real estate are subject to national discretions and the regulations differ between the Nordic countries.

Nordea Bank Finland Group 2009
66
Other • Exposures to administrative bodies and non-commercial undertakings (such as
public sector entities) are, subject to decision by the local authority, assigned a risk weight of 0% to 100%.
• Exposures to named multilateral development banks are assigned a risk weight of 0%. Other multilateral development banks are assigned a risk weight according to the methods used for exposures to institutions.
• Exposures to named international organisations are assigned a risk weight of 0%. Other international organisations are assigned a risk weight of 100%.
• Past due items (items that are past due for more than 90 days). The unsecured part of any past due item are assigned a risk weight of 150% if value adjustments (allowances) are less than 20% and 100% if value adjustments (allowances) are no less than 20% of the unsecured part. The part of the past due items that are se-cured by residential real estate property are assigned a risk weight of 100% or 50% depending on the size of the value adjustment (above or below 20%) and na-tional regulations.
• Short-term claims. Exposures reported as short-term claims receive a risk weight based on the short term external rating of the institution. Short-term exposures to institutions and corporate for which a short-term credit assessment by a nomi-nated rating agency is available, are assigned a risk weight in accordance with a six step mapping scale made by the financial supervisory authorities. However, this exposure class is not used for exposures to institutions treated according to the central government risk weighted method.
• Other items 1. Tangible assets, prepayments and accrued income where no counterpart
can be determined, holdings of equity etc are assigned a risk weight of 100%.
2. Cash are assigned a 0% risk weight.
12.4 Difference between EC and regulatory capital requirement The differences between EC and the capital requirement according to CRD during 2009 are shown below, note that there will be changes in the EC framework for 2010 as de-scribed in chapter 9.
• Confidence level: o The confidence level for all risk types is 99.97% in the EC framework,
versus 99.9% in pillar 1 of CRD. • Credit risk:
o EC for credit risk includes maturity adjustments o Exposures calculated using the Standardised Approach in pillar 1 accord-
ing to CRD are calculated on the basis of internal models in the EC framework, though the models have not yet been approved by the finan-cial supervisory authorities for use in the regulatory calculations.
o Credit risk EC for corporate and institutions exposures is calculated using the internal estimates of LGD and EAD (i.e. using the Advanced IRB), rather than the regulatory values in the FIRB approach within pillar 1 of CRD.
o Concentration risk is captured via the use of an internal credit risk portfo-lio model, which is not specifically accounted for in pillar 1 in CRD but accounted for in the EC framework. Credit concentration risk is the credit risk stemming from not having a perfectly diversified credit portfolio, i.e. the risk inherent in doing business with large customers or being overex-posed in particular industries or regions. Through the use of a credit risk

Nordea Bank Finland Group 2009
67
portfolio model which considers exposures by industry and geography, the concentration risk can be identified. Credit risk measures are based on the results of the portfolio model although the industry or region con-centration impact is allocated pro rata over the entire portfolio. Addition-ally, the credit risk measures consider exposure to large customers by ap-plying a single-name concentration add-on in the EC framework.
• Market risk: o EC for market risk is calculated for the trading book, but also for market
risk in the investment and funding portfolio, risk in sponsored defined benefit pension plans as well as real estate risk. The market risk associ-ated with Nordea’s long-term leases of its own office buildings is meas-ured using a framework based on the book value of the underlying assets. In pillar 1 of the CRD, only the trading book and FX risk outside the trading book are included in the capital calculations for market risk.
• Business risk: o Business risk is not included in pillar 1 of CRD. The EC framework in-
cludes business risk to account for the residual volatility in historical profit and loss after adjustments for market, operational and credit risk. Business risk represents the earnings volatility inherent in all businesses due to the uncertainty of revenues and costs as a consequence of changes in the economic and competitive environment. The main risk drivers of business risk are size of the fixed cost base, business margin volatility, volatility in business volumes and cost volatility. In this context, indirect effects such as the net interest income (NII) effect (a consequence of the SIIR, strategic risk and liquidity risk are considered). The business risk measurement is based on historical volatility in profit and loss stemming from business risk, i.e. a “cleaned operating profit” where the contribu-tions from other risk types are neglected (e.g. trading income, credit losses, effect of operational risk events).
• Operational risk: o Differences in operational risk are due to differences in the historical col-
lection of gross income data, which is the most recent rolling four quar-ters in EC capital while operational risk in pillar 1 is based on calendar years.
• Diversification effects: o Unlike pillar 1 in CRD, the EC framework accounts for group level di-
versification benefits in Nordea's varied operations.

Nordea Bank Finland Group 2009
68
List of abbreviations
ADF Actual Default Frequencies ALCO Asset and Liability Committee CCF Credit Conversion Factor CDO Collateralised debt obligations CDS Credit Default Swaps CEO Chief Executive Officer CFO Chief Financial Officer CRD EU’s Capital Requirements Directive CRO Chief Risk Officer EAD Exposure at Default EC Economic Capital ECC Executive Credit Committee EL Expected Loss EP Economic Profit EU European Union FIRB Foundation Internal Rating Based approach FX Foreign Exchange GCC Group Credit Committee GEM Group Executive Management IAS International Accounting Standard ICAAP Internal Capital Adequacy Assessment Process IFC International Finance Corporation IFRS International Financial Reporting Standard IRB Internal Rating Based approach LGD Loss Given Default NII Net Interest Income OTC Over The Counter (derivatives) PD Probability of Default QRA Quality Risk Analysis RFF Rolling Financial Forecast RWA Risk Weighted Amount S&P Standard & Poor’s SA Standardised approach SRP Supervisory Review Process SREP Supervisory Review and Evaluation Process SIIR Structural Interest Income Risk SME Small and Medium-sized Enterprises SPE Special Purpose Entity VaR Value at Risk