capital efficiency & portfolio management - nestlé global · capital efficiency &...
TRANSCRIPT

François-Xavier Roger
Chief Financial Officer
Sandford Bernstein
Strategic Decisions Conference
30th September 2015
Capital Efficiency &
Portfolio Management
Nestlé
30th September 2015 Sandford Bernstein Strategic Decisions Conference, London
This presentation contains forward looking statements
which reflect Management’s current views and estimates.
The forward looking statements involve certain risks and
uncertainties that could cause actual results to differ
materially from those contained in the forward looking
statements. Potential risks and uncertainties include such
factors as general economic conditions, foreign exchange
fluctuations, competitive product and pricing pressures and
regulatory developments.
Disclaimer
1

30th September 2015 Sandford Bernstein Strategic Decisions Conference, London
A reference for financial performance
• 5% to 6% OG
• Margin and EPS growth*
• Improved Capital Efficiency
2
The
Nestlé
Model
* improvements in margins and underlying earnings per share in constant currencies

30th September 2015 Sandford Bernstein Strategic Decisions Conference, London
Nestlé: delivery consistent with our commitment
10Y Average
Organic
Growth
+6.1%
Market
Capitalization
Multiplied by
1.5
10Y Average
Dividend
Increase
10Y Average
Trading Operating
Profit Margin
Improvement
+30bps
+10%
5%
6%
Organic Growth
Trading Operating Profit Margin
3
Over 10 years

Sandford Bernstein Strategic Decisions Conference, London 30th September 2015
The and Company
Delivery of Top Line and Bottom Line
Growth in Emerging and Developed Markets
Improved Operational and Capital Efficiency
Making Choices to Divest, Fix and Accelerate
Delivering in Short Term and Investing in Long Term
4
Sandford Bernstein Strategic Decisions Conference, London 30th September 2015
Capital efficiency was identified in 2012 as an area of
opportunity with 3 main levers
• CAPEX
• Working Capital
• ROIC
5
Sandford Bernstein Strategic Decisions Conference, London 30th September 2015
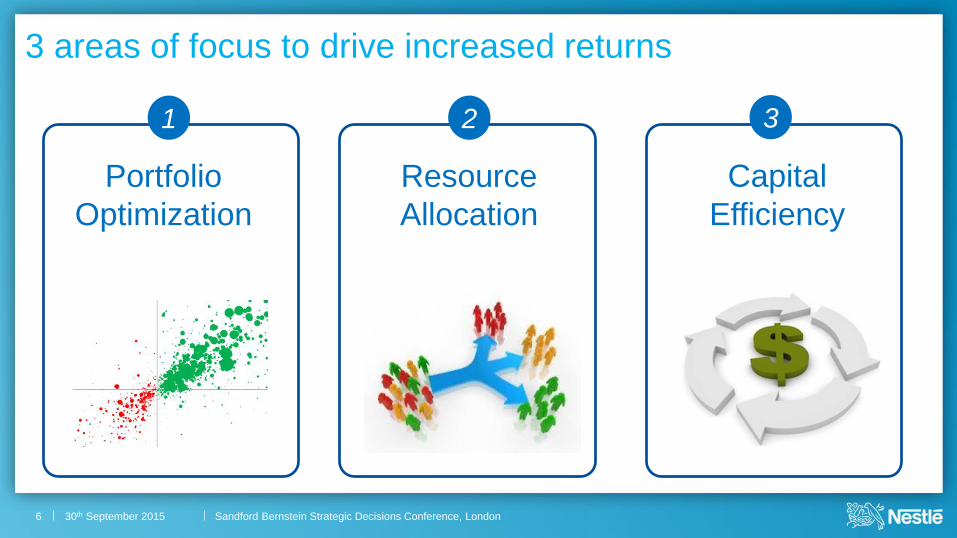
1 2 3
Portfolio
Optimization
Resource
Allocation
Capital
Efficiency
6
3 areas of focus to drive increased returns

Sandford Bernstein Strategic Decisions Conference, London 30th September 2015
1 2 3
Portfolio
Optimization
Resource
Allocation
Capital
Efficiency
7
Sandford Bernstein Strategic Decisions Conference, London 30th September 2015
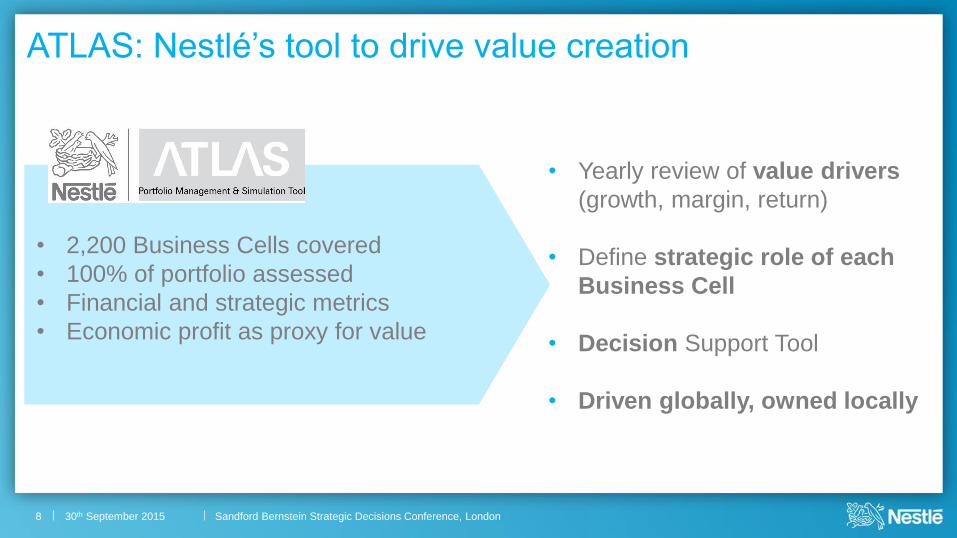
ATLAS: Nestlé’s tool to drive value creation
• 2,200 Business Cells covered
• 100% of portfolio assessed
• Financial and strategic metrics
• Economic profit as proxy for value
• Yearly review of value drivers
(growth, margin, return)
• Define strategic role of each
Business Cell
• Decision Support Tool
• Driven globally, owned locally
8

Sandford Bernstein Strategic Decisions Conference, London 30th September 2015
An holistic framework to assess performance
Key Metrics
9
Growth
Margin
Capital
Efficiency
Value
Creation
• Market Growth
• Nestlé’s Share Trend
• Organic Growth
• Gross Margin
• Operating Profit
• Working Capital
• Asset Turnover
• CAPEX
• Brand Investment
• Structural Cost
• ROIC
• Economic Profit

Sandford Bernstein Strategic Decisions Conference, London 30th September 2015
ATLAS enables value creation visibility at granular level
Value Creation
Value Consumption
Value Creation
Understanding the sources of
future Economic Profit for
management focus and
resources prioritization
Value Consumption
Seed businesses in need of
investment for critical mass or
activities with structural
challenges that need to be tackled
10

Sandford Bernstein Strategic Decisions Conference, London 30th September 2015
Making choices and acting consistently with them
Accelerate
Protect
Fix
All Business Cells are clustered
for one of 3 strategic actions:
11
Sandford Bernstein Strategic Decisions Conference, London 30th September 2015
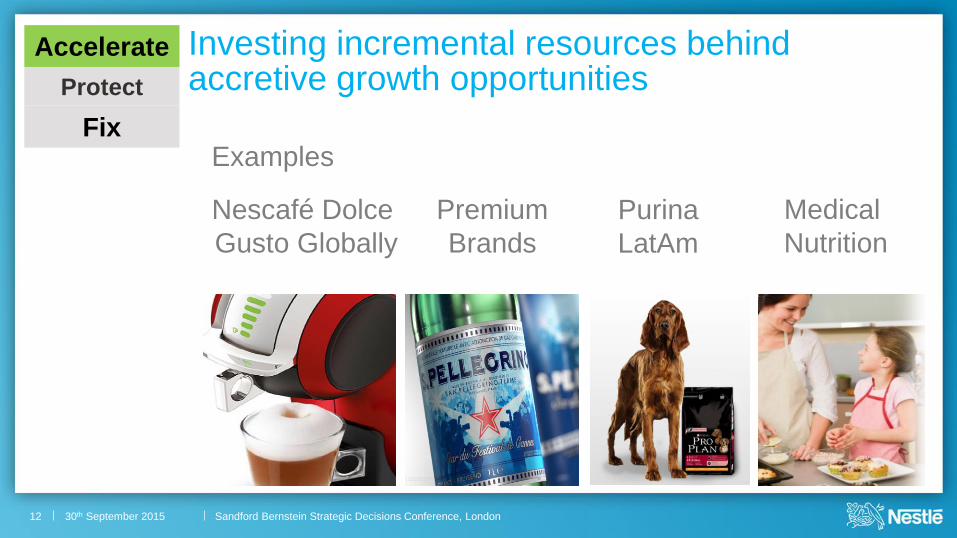
Accelerate
Fix
Investing incremental resources behind accretive growth opportunities Protect
Examples
Nescafé Dolce
Gusto Globally
Premium
Brands
Purina
LatAm
12
Medical
Nutrition
Sandford Bernstein Strategic Decisions Conference, London 30th September 2015
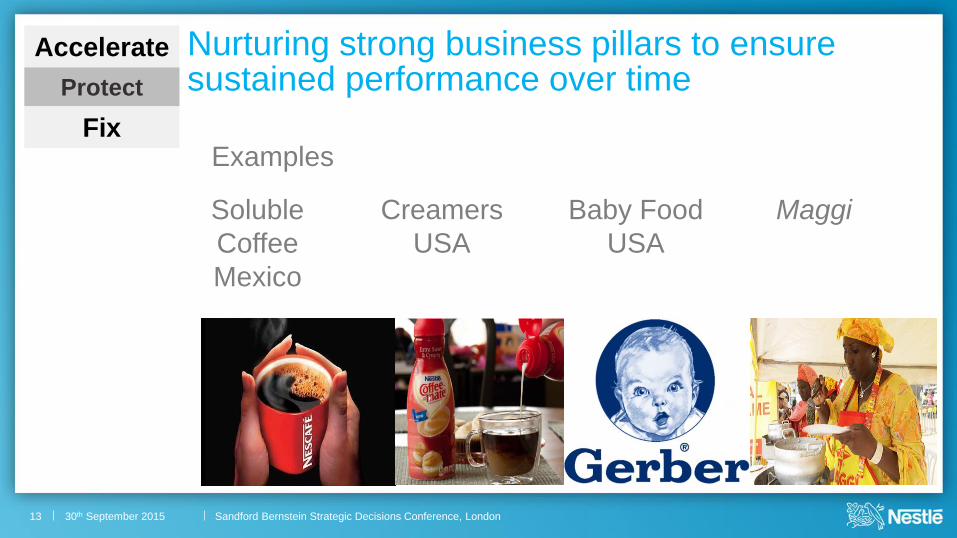
Nurturing strong business pillars to ensure sustained performance over time
Accelerate
Fix
Protect
Examples
Soluble
Coffee
Mexico
Creamers
USA
Baby Food
USA
Maggi
13

Sandford Bernstein Strategic Decisions Conference, London 30th September 2015
Fix through reinvestment to revitalize the business
Frozen Food US:
Accelerate
Fix
Protect
• New products
• New formulations
• Repositioning
• Communication
Encouraging signals
• Volume momentum
• Share trend
14
https://www.youtube.com/watch?v=0RZkfZLJegk

Sandford Bernstein Strategic Decisions Conference, London 30th September 2015
Fix through premiumization and strong focus on capital allocation
Nestlé Waters: a successful turnaround
Accelerate
Fix
Protect
Before 2012
• Negative EP
• Low ROIC
• Volatile performance
• Positive and growing EP
• ROIC near group AVG
• Accretive growth
15
Since 2012 - Discontinue non profitable
business lines
- Invest in international
premium brands
- Manage our cost base
- Contain and focus capex
15

Sandford Bernstein Strategic Decisions Conference, London 30th September 2015
Fix through partnership enabling scale and competitive advantage
Chilled Dairy Europe: alliance with Lactalis
Accelerate
Fix
Protect
16
Before 2006
• Under-scale
• Loss making
• Marginal Market Share
• Competitive scale
• Positive contribution
• A relevant player in Europe
After 2006

Sandford Bernstein Strategic Decisions Conference, London 30th September 2015
2012 2013 2014 2015
Annualised
Sales CHF 200mio CHF 800mio CHF 700mio CHF 750mio
Key
Divestments
• Peter’s Ice Cream • Jenny Craig
• Mexico Chilled Dairy
• US Pet Insurance
• Germany Chilled
Culinary
• US Joseph’s Pasta
• France Homecare
• Denmark Ice Cream
• Germany Infant Meals
& Drinks
• Korea JV
• US Juicy Juice
• Europe HOD Waters
• Turkey Balaban
• Power Bar
• Mexico Ice Cream
• Davigel*
Fix through disposal Accelerate
Fix
Protect
*Pending deal completion
CHF 2.5 bn sales
17

Sandford Bernstein Strategic Decisions Conference, London 30th September 2015
1 2 3
Portfolio
Optimization Resource
Allocation
Capital
Efficiency
18

Sandford Bernstein Strategic Decisions Conference, London 30th September 2015
Resource allocation covers many areas
• CAPEX
• Brand investments
• R&D priorities
• People & Talent
19
Sandford Bernstein Strategic Decisions Conference, London 30th September 2015
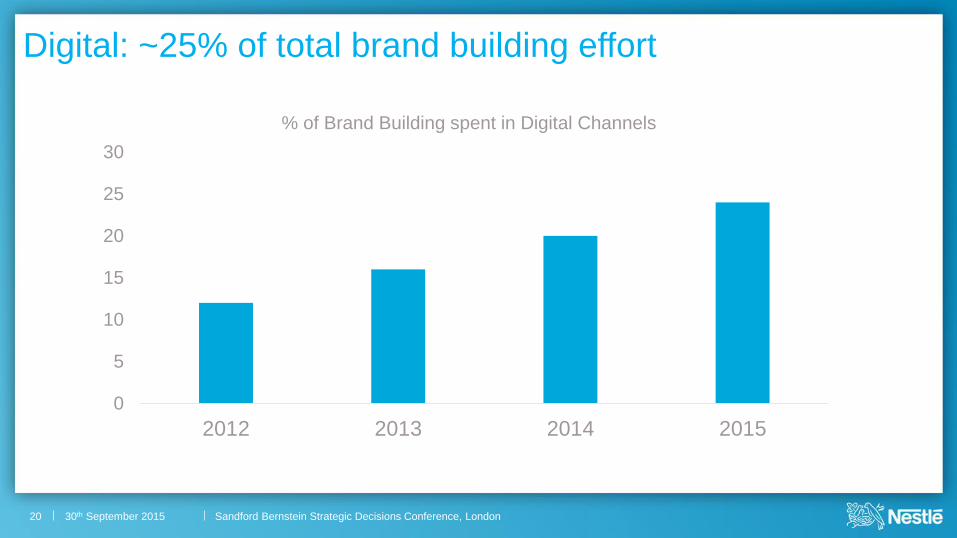
Digital: ~25% of total brand building effort
20
0
5
10
15
20
25
30
2012 2013 2014 2015
% of Brand Building spent in Digital Channels

Sandford Bernstein Strategic Decisions Conference, London 30th September 2015
1 2 3
Portfolio
Optimization
Resource
Allocation
Capital
Efficiency
21

Sandford Bernstein Strategic Decisions Conference, London 30th September 2015
ROIC is a Priority
Alcon
Divestment
impact
Capital Efficiency
(CAPEX and WC)
enabling progress in
ROIC before GW
Wyeth, Galderma
adding material GW
amounts since 2012,
plus DSD impairment
impact in 2014
22

30th September 2015 Sandford Bernstein Strategic Decisions Conference, London
CAPEX: bending the curve
3.50%
4.00%
4.50%
5.00%
5.50%
6.00%
06 07 08 09 10 11 12 13 14 15 16 17 18 19 20 21 22 23 24 25
Going forward
4% to 5% of Sales
• Prioritization based on
growth and return (ATLAS)
• Post Project Evaluation
systematically performed
23

30th September 2015 Sandford Bernstein Strategic Decisions Conference, London
Sustained progress in Working Capital
• Sustainable progress
since 2011
• Holistic action across
all WC levers
• Further opportunities
for upside
Average Working Capital as % of Sales
24
FY 11 FY 12 FY 13 FY 14
- 80 bps
- 200 bps
- 120 bps

30th September 2015 Sandford Bernstein Strategic Decisions Conference, London
Consistent acceleration in Cash Conversion
Operational Cash Flow as a % of Operating Profit (source: Thomson Reuters)
25

Sandford Bernstein Strategic Decisions Conference, London 30th September 2015
Conclusion
We act on all levers to drive growth, value and returns, actively
managing
• our P&L through superior growth and constant margin
improvements
• our balance sheet through asset / CAPEX productivity
• our cash flow through working capital management and
• our portfolio by making choices
26