capital expenditure - australian energy regulator | - final decision... · web viewthis reduction...
TRANSCRIPT

FINAL DECISIONAusgrid distribution
determination 2015−16 to 2018−19
Attachment 6 – Capital expenditure
April 2015
0 Attachment 6 – Capital expenditure | Ausgrid Final decision 2015–19

© Commonwealth of Australia 2015
This work is copyright. In addition to any use permitted under the Copyright Act 1968, all material contained within this work is provided under a Creative Commons Attributions 3.0 Australia licence, with the exception of:
the Commonwealth Coat of Arms
the ACCC and AER logos
any illustration, diagram, photograph or graphic over which the Australian Competition and Consumer Commission does not hold copyright, but which may be part of or contained within this publication. The details of the relevant licence conditions are available on the Creative Commons website, as is the full legal code for the CC BY 3.0 AU licence.
Requests and inquiries concerning reproduction and rights should be addressed to the:
Director, Corporate CommunicationsAustralian Competition and Consumer Commission GPO Box 4141, Canberra ACT 2601
Inquiries about this publication should be addressed to:
Australian Energy RegulatorGPO Box 520Melbourne Vic 3001
Tel: (03) 9290 1444Fax: (03) 9290 1457
Email: [email protected]
AER reference: 52294
1 Attachment 6 – Capital expenditure | Ausgrid Final decision 2015–19

Note
This attachment forms part of the AER's final decision on Ausgrid’s revenue proposal 2015–19. It should be read with other parts of the final decision.
The final decision includes the following documents:
Overview
Attachment 1 - Annual revenue requirement
Attachment 2 - Regulatory asset base
Attachment 3 - Rate of return
Attachment 4 - Value of imputation credits
Attachment 5 - Regulatory depreciation
Attachment 6 - Capital expenditure
Attachment 7 - Operating expenditure
Attachment 8 - Corporate income tax
Attachment 9 - Efficiency benefit sharing scheme
Attachment 10 - Capital expenditure sharing scheme
Attachment 11 - Service target performance incentive scheme
Attachment 12 - Demand management incentive scheme
Attachment 13 - Classification of services
Attachment 14 - Control mechanism
Attachment 15 - Pass through events
Attachment 16 - Alternative control services
Attachment 17 - Negotiated services framework and criteria
Attachment 18 - Connection methodology
Attachment 19 - Pricing methodology
Attachment 20 - Analysis of financial viability
2 Attachment 6 – Capital expenditure | Ausgrid Final decision 2015–19

Contents
Note...............................................................................................................6-2
Contents........................................................................................................6-3
Shortened forms..........................................................................................6-6
6 Capital expenditure................................................................................6-8
6.1 Final decision..................................................................................6-8
6.2 Ausgrid’s revised proposal..........................................................6-11
6.3 AER’s assessment approach.......................................................6-12
Expenditure Assessment Guidelines..........................................................6-15
6.3.1 Building an alternative estimate of total forecast capex..............6-16
6.3.2 Comparing the service provider's proposal with our alternative estimate 6-18
6.4 Reasons for final decision...........................................................6-20
6.4.1 Key assumptions.........................................................................6-21
6.4.2 Forecasting methodology............................................................6-21
6.4.3 Interaction with the STPIS...........................................................6-25
6.4.4 Ausgrid capex performance........................................................6-26
6.4.5 Ausgrid historic trend and licence conditions..............................6-30
6.4.6 Interrelationships.........................................................................6-33
6.4.7 Consideration of the capex factors..............................................6-34
6.5 Clarification of numerical differences.........................................6-36
A Assessment Techniques.....................................................................6-38
A.1 Economic benchmarking.............................................................6-38
A.2 Trend analysis...............................................................................6-39
A.3 Category analysis.........................................................................6-40
A.4 Predictive modelling.....................................................................6-40
3 Attachment 6 – Capital expenditure | Ausgrid Final decision 2015–19

A.5 Engineering review.......................................................................6-41
B Assessment of capex drivers.............................................................6-44
B.1 Alternative estimate......................................................................6-44
B.2 AER findings and estimates for augmentation expenditure.....6-45
B.2.1 Revised proposal.........................................................................6-45
B.2.2 AER approach.............................................................................6-47
B.2.3 AER augex findings.....................................................................6-49
B.3 AER findings and estimates for connections.............................6-51
B.3.1 AER findings and estimates for connections and contributions. .6-51
Connections policy framework...................................................................6-52
B.4 AER findings and estimates for replacement expenditure.......6-52
B.4.1 Position........................................................................................6-53
B.4.2 Revised proposal.........................................................................6-53
B.4.3 Explanation of AER approach.....................................................6-54
Trend analysis............................................................................................6-54
Predictive modelling...................................................................................6-55
Technical review.........................................................................................6-56
Asset health indicators and comparative performance metrics..................6-56
B.4.4 AER repex findings......................................................................6-56
Trends analysis..........................................................................................6-57
Predictive modelling...................................................................................6-60
Technical review.........................................................................................6-70
Un-modelled repex.....................................................................................6-72
Network health indicators...........................................................................6-75
B.5 AER findings and estimates for reliability improvement capex6-80
B.5.1 Position........................................................................................6-80
B.6 AER findings and estimates for capitalised overheads............6-82
B.6.1 Position........................................................................................6-82
4 Attachment 6 – Capital expenditure | Ausgrid Final decision 2015–19

B.6.2 Revised proposal.........................................................................6-82
B.6.3 AER approach.............................................................................6-82
B.7 AER findings and estimates for non-network capex.................6-84
B.7.1 Position........................................................................................6-84
B.7.2 Revised proposal.........................................................................6-84
B.7.3 Buildings and property capex......................................................6-85
B.7.4 Non-network SCADA and network control..................................6-87
B.7.5 Asset disposals...........................................................................6-89
B.8 Demand management...................................................................6-89
B.8.1 Position........................................................................................6-90
B.8.2 Revised proposal on demand management................................6-90
B.8.3 Draft decision position.................................................................6-91
B.8.4 Reasons for final decision...........................................................6-92
C Demand.................................................................................................6-93
C.1 AER position..................................................................................6-93
C.2 AER approach...............................................................................6-93
C.3 Ausgrid's revised proposal..........................................................6-94
C.3.1 AEMO forecasts..........................................................................6-96
D Real material cost escalation..............................................................6-97
D.1 Position..........................................................................................6-97
D.2 Ausgrid's revised proposal..........................................................6-97
D.3 Reasons.........................................................................................6-98
5 Attachment 6 – Capital expenditure | Ausgrid Final decision 2015–19

Shortened formsShortened form Extended form
AEMC Australian Energy Market Commission
AEMO Australian Energy Market Operator
AER Australian Energy Regulator
augex augmentation expenditure
capex capital expenditure
CCP Consumer Challenge Panel
CESS capital expenditure sharing scheme
CPI consumer price index
DRP debt risk premium
DMIA demand management innovation allowance
DMIS demand management incentive scheme
distributor distribution network service provider
DUoS distribution use of system
EBSS efficiency benefit sharing scheme
ERP equity risk premium
Expenditure Assessment Guidelineexpenditure forecast assessment Guideline for
electricity distribution
F&A framework and approach
MRP market risk premium
NEL national electricity law
NEM national electricity market
NEO national electricity objective
NER national electricity rules
NSP network service provider
opex operating expenditure
PPI partial performance indicators
PTRM post-tax revenue model
RAB regulatory asset base
RBA Reserve Bank of Australia
repex replacement expenditure
RFM roll forward model
6 Attachment 6 – Capital expenditure | Ausgrid Final decision 2015–19

Shortened form Extended form
RIN regulatory information notice
RPP revenue and pricing principles
SAIDI system average interruption duration index
SAIFI system average interruption frequency index
SLCAPM Sharpe-Lintner capital asset pricing model
STPIS service target performance incentive scheme
WACC weighted average cost of capital
7 Attachment 6 – Capital expenditure | Ausgrid Final decision 2015–19

6 Capital expenditureCapital expenditure (capex) refers to the capital expenses incurred in the provision
of standard control services.1 The return on and of forecast capex are two of the building blocks that form part of Ausgrid's total revenue requirement.2
This Attachment sets out our final decision on Ausgrid's total forecast capex proposal as set out in its revised regulatory proposal. Further detailed analysis is in the following appendices:
Appendix A - Assessment Techniques
Appendix B - Assessment of capex drivers
Appendix C - Demand
Appendix D - Real material cost escalation
6.1 Final decisionWe are not satisfied that Ausgrid's revised total forecast capex of $3,755.6 million
($2013–14) for the 2014–2019 period reasonably reflects the capex criteria. We have substituted our estimate of Ausgrid's total forecast capex for the 2014–2019 period. We are satisfied that our substitute estimate of $3,201.2 million ($2013–14) reasonably reflects the capex criteria. Table 6-1 outlines our final decision.
Table 6-1 Our final decision on Ausgrid's total forecast capex (million $2013–14)
2014–15 2015–16 2016–17 2017–18 2018–19 Total
Ausgrid's revised proposal
766.2 864.3 819.0 699.9 606.1 3755.6
AER final decision 664.1 709.0 682.3 601.8 544.0 3201.2
Difference -102.1 -155.3 -136.7 -98.1 -62.1 -554.3
Percentage difference (%)
-13% -18% -17% -14% -10% -15%
Source: Ausgrid response to AER Information Request AER Ausgrid 061; AER analysis.
Note: Numbers may not total due to rounding.
A summary of our reasons and findings that we present in this Attachment are set out in Table 6-2.
1 These capital expenses include expenditure for standard control services provided by a distributor by means of, or in connection with, its dual function assets. A dual function asset is any part of a network that is owned, operated or controlled by a distributor which operates between 66kV and 220 kV and which operates in parallel and provides support to a transmission network: see NER, cl. 6.24.
2 NER, cl. 6.4.3(a).
8 Attachment 6 – Capital expenditure | Ausgrid Final decision 2015–19

These reasons include our responses to stakeholders' submissions on Ausgrid's revised regulatory proposal. In the table we present our reasons largely by ‘capex driver’, such as augex and repex. This reflects the way in which we tested Ausgrid's proposed total forecast capex. Our testing used techniques tailored to the different capex drivers taking into account the best available evidence. The outcomes of some of our techniques revealed that some aspects of Ausgrid’s proposal such as augex and customer connections, were consistent with the NER requirements in that they reasonably reflect the efficient costs of a prudent operator as well as a realistic expectation of the demand forecasts and cost inputs required to achieve the capex objectives. We found that other aspects of Ausgrid’s proposal associated with some capex drivers, in particular replacement expenditure and non-network expenditure, revealed inefficiency inconsistent with the NER. Consequently, our findings on repex largely explain why we are not satisfied with Ausgrid's proposed total forecast capex.
Our findings on the capex associated with specific capex drivers are part of our broader analysis and are not intended to be considered in isolation. Our final decision concerns Ausgrid’s total forecast capex for the 2014-19 period. We do not approve an amount of forecast expenditure for each capex driver. However, we do use our findings on the different capex drivers to arrive at a substitute estimate for total capex because as a total, this amount has been tested against the NER requirements. We are satisfied that our estimate represents total forecast capex that as a whole reasonably reflects all aspects of the capex criteria.
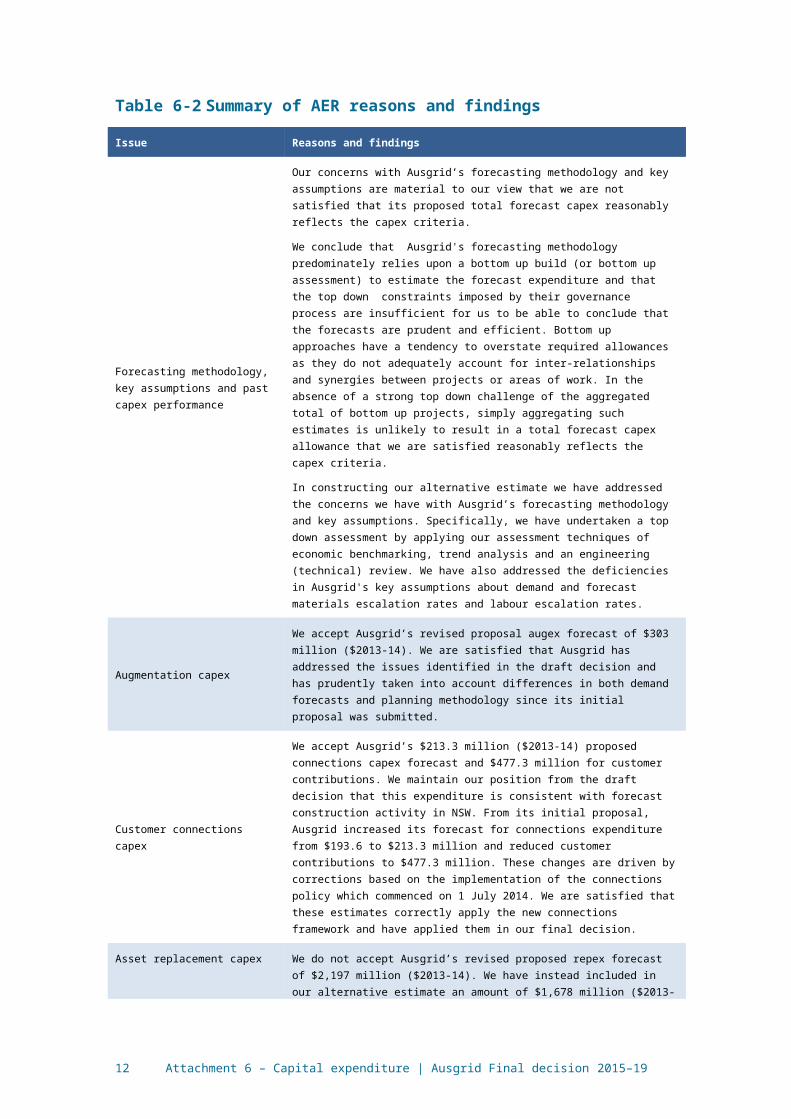
Table 6-2 Summary of AER reasons and findings
Issue Reasons and findings
Forecasting methodology, key assumptions and past capex performance
Our concerns with Ausgrid’s forecasting methodology and key assumptions are material to our view that we are not satisfied that its proposed total forecast capex reasonably reflects the capex criteria.
We conclude that Ausgrid's forecasting methodology predominately relies upon a bottom up build (or bottom up assessment) to estimate the forecast expenditure and that the top down constraints imposed by their governance process are insufficient for us to be able to conclude that the forecasts are prudent and efficient. Bottom up approaches have a tendency to overstate required allowances as they do not adequately account for inter-relationships and synergies between projects or areas of work. In the absence of a strong top down challenge of the aggregated total of bottom up projects, simply aggregating such estimates is unlikely to result in a total forecast capex allowance that we are satisfied reasonably reflects the capex criteria.
In constructing our alternative estimate we have addressed the concerns we have with Ausgrid’s forecasting methodology and key assumptions. Specifically, we have undertaken a top down assessment by applying our assessment techniques of economic benchmarking, trend analysis and an engineering (technical) review. We have also addressed the deficiencies in Ausgrid's key assumptions about demand and forecast materials escalation rates and labour escalation rates.
Augmentation capex
We accept Ausgrid’s revised proposal augex forecast of $303 million ($2013-14). We are satisfied that Ausgrid has addressed the issues identified in the draft decision and has prudently taken into account differences in both demand forecasts and planning methodology since its initial proposal was submitted.
Customer connections capex We accept Ausgrid’s $213.3 million ($2013-14) proposed connections capex forecast and $477.3 million for customer contributions. We maintain our position from the draft decision that this expenditure is consistent with forecast construction activity in NSW. From its initial proposal, Ausgrid increased its
9 Attachment 6 – Capital expenditure | Ausgrid Final decision 2015–19

Issue Reasons and findings
forecast for connections expenditure from $193.6 to $213.3 million and reduced customer contributions to $477.3 million. These changes are driven by corrections based on the implementation of the connections policy which commenced on 1 July 2014. We are satisfied that these estimates correctly apply the new connections framework and have applied them in our final decision.
Asset replacement capex
We do not accept Ausgrid’s revised proposed repex forecast of $2,197 million ($2013-14). We have instead included in our alternative estimate an amount of $1,678 million ($2013-14). Our estimate is 24 per cent lower than Ausgrid’s revised proposal. This reduction reflects the outcomes of our predictive modelling and evidence that Ausgrid has an overly conservative risk management approach and a bias towards overestimation in its repex forecast. Ausgrid has also not provided evidence to support some of its proposed expenditure such as for its subtransmission switchgear replacement program.
We are satisfied our alternative estimate reasonably reflects the capex criteria. It includes:
1. $1,378 million of expenditure for six modelled asset categories (including land and support costs) based on Ausgrid’s own 'business as usual' asset management practices, its current tolerance for risk and its proposed forecast unit costs;
2. forecast repex of $138 million for supervisory control and data acquisition consistent with Ausgrid’s actual expenditure on this asset category in the 2009-14 regulatory control period; and
3. Ausgrid’s proposed forecast repex for pole top structures ($31 million) and repex covering other subcategories ($132 million).
Reliability improvement capex
We consider an amount of $19.5 million ($2013–14) reasonably reflects the capex criteria. This is $6 million higher than Ausgrid’s proposal. Ausgrid supplied additional information and we are satisfied that this expenditure is not already covered by our repex assessment or funded through the STPIS.
We do not consider it appropriate to accept Ausgrid’s proposed STPIS offset, because it would require us to approve an allowance less than required to reasonably meet the capex criteria.
Non-network capex
We do not accept Ausgrid's proposed forecast capex of $384.2 million ($2013–14) for non-network capex. We have instead included forecast non-network capex of $351.3 million ($2013-14) in our estimate of total capex. This reflects that we have maintained our draft decision to reduce Ausgrid's proposed buildings and property capex program by 20 per cent. In our view, this reduction accounts for the identified delay in the schedule of major projects and the likelihood of future deferrals and refinements in project scope and cost for the building and property program. We are satisfied that this amount reasonably reflects the capex criteria.
Capitalised overheads
We accept Ausgrid’s proposed capitalised overheads of $645.0 million on the basis of information that it provided that its total overheads are relatively fixed.
Logically, we consider that reductions in Ausgrid’s total forecast expenditure should see some reduction in the size of overheads. However, without sufficiently robust evidence of this, we have accepted Ausgrid's revised forecast.
Real cost escalation We are not satisfied that Ausgrid's revised proposed real material cost escalators (leading to cost increases above CPI) which form part of its total forecast capex reasonably reflect a realistic expectation of the cost inputs required to achieve the capex objectives over the 2014–19 period. We maintain our view, as set out in our draft decision that zero per cent real cost escalation is reasonably likely to reflect the capex criteria including that it is likely to reasonably reflect a realistic expectation of the cost inputs required to achieve the capex objectives over the 2014–19 period.
10 Attachment 6 – Capital expenditure | Ausgrid Final decision 2015–19

Issue Reasons and findings
Consistent with our position in the draft decision, our approach to real materials cost escalation does not affect the proposed application of labour and construction cost escalators which apply to Ausgrid's forecast capex for standard control services.
Ausgrid accepted our approach to labour cost escalation (leading to cost increases above CPI) set out in our draft decision. We have applied our approach outlined in our draft decision (refer to Attachment 7).
Source: AER analysis.
We consider that our overall capex forecast addresses the revenue and pricing principles. In particular, we consider that Ausgrid has been provided a reasonable opportunity to recover at least the efficient costs it incurs in:3
Providing direct control network services; and
Complying with its regulatory obligations and requirements.
As set out in appendix B we are satisfied that our overall capex forecast is consistent with the NEO in that our decision promotes efficient investment in, and efficient operation and use of, electricity services for the long term interests of consumers of electricity. Further, in making our final decision, we have specifically considered the impact our decision will have on the safety and reliability of Ausgrid's network. We consider this capex forecast is sufficient for a prudent and efficient service provider in Ausgrid's circumstances to be able to maintain the safety, service quality, security and reliability of its network consistent with its current obligations.
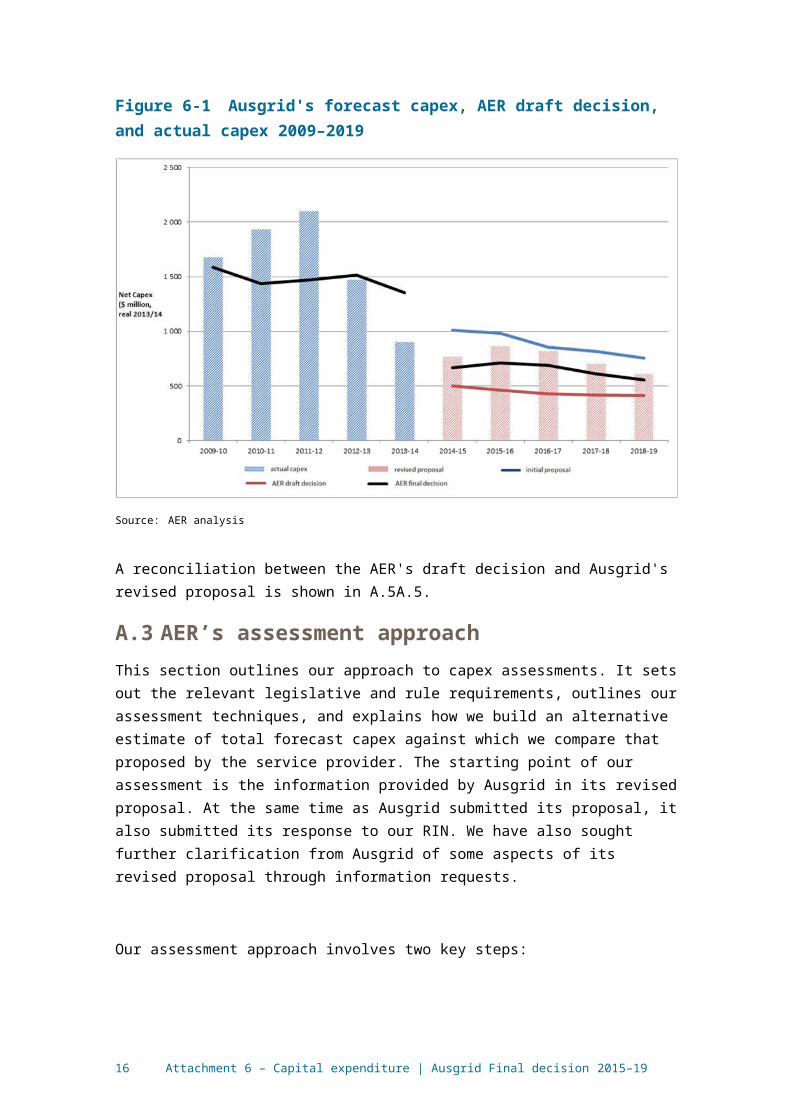
6.2 Ausgrid’s revised proposalAusgrid's revised regulatory proposal includes a total forecast capex of $3,755 million ($2013–14) for the 2014–2019 period. This is 29 per cent higher than our draft decision, and 26 per cent lower than Ausgrid's initial regulatory proposal.
Figure 6-1 shows the difference between Ausgrid's initial proposal, its revised proposal and our draft decision for the 2014–2019 period, as well as the actual capex that Ausgrid spent during the 2009–2014 regulatory control period. Ausgrid submits the reasons for the reduction between its initial and revised proposals are due to:4
Lower augmentation expenditure in response to lower forecast demand, and improvements in our high voltage distribution expenditure forecasting models;
Lower replacement expenditure arising from application of cost benefit analysis techniques to major cable and switchgear renewal projects;
Lower replacement expenditure arising mainly from improved segmentation within replacement and duty of care program categories and improved understanding of consequences arising from further development of our risk cost assessment approach;
3 NEL, section 7A.4 Ausgrid, Revised Regulatory Proposal, p.75.
11 Attachment 6 – Capital expenditure | Ausgrid Final decision 2015–19
Top down allocation of efficiency improvements arising from project scope efficiencies for major projects currently in the planning phase and medium term unit cost improvements from current efficiency programs; and
Recognition of offsets to our reliability compliance program from forecast marginal STPIS revenues.
Figure 6-1 Ausgrid's forecast capex, AER draft decision, and actual capex 2009–2019
Source: AER analysis
A reconciliation between the AER's draft decision and Ausgrid's revised proposal is shown in 6.56.5.
6.3 AER’s assessment approachThis section outlines our approach to capex assessments. It sets out the relevant
legislative and rule requirements, outlines our assessment techniques, and explains how we build an alternative estimate of total forecast capex against which we compare that proposed by the service provider. The starting point of our assessment is the information provided by Ausgrid in its revised proposal. At the same time as Ausgrid submitted its proposal, it also submitted its response to our RIN. We have also sought further clarification from Ausgrid of some aspects of its revised proposal through information requests.
Our assessment approach involves two key steps:
12 Attachment 6 – Capital expenditure | Ausgrid Final decision 2015–19

First, our starting point for building an alternative estimate is Ausgrid's revised proposal.5 We apply our various assessment techniques, both qualitative and quantitative, to assess the different elements of Ausgrid's proposal at the total level and at the capex driver level such as its proposed augmentation expenditure and replacement expenditure. This analysis not only informs our view on whether Ausgrid's proposal reasonably reflects the capex criteria set out in the NER6 but it also provides us with an alternative forecast that does meet the criteria. In arriving at our alternative estimate, we have had to weight the various techniques used in our assessment.
Second, having established our alternative estimate of the total forecast capex, we can test the service provider's proposed total forecast capex. This includes comparing our alternative estimate total with the service provider's proposal total. If there is a difference between the two, we may need to exercise our judgement as to what is a reasonable margin of difference.
If we are satisfied that the service provider's proposal reasonably reflects the capex criteria, we accept it. If we are not satisfied, the rules require us to put in place a substitute estimate which we are satisfied reasonably reflects the capex criteria. Where we have done this, our substitute estimate is based on our alternative estimate.
The capex criteria are:
the efficient costs of achieving the capital expenditure objectives
the costs that a prudent operator would require to achieve the capital expenditure objectives
a realistic expectation of the demand forecast and cost inputs required to achieve the capital expenditure objectives.
The AEMC noted that '[t]hese criteria broadly reflect the NEO [National Electricity Objective]'.7 The capital expenditure objectives (capex objectives) referred to in the capex criteria, are to:8
meet or manage the expected demand for standard control services over the period
comply with all regulatory obligations or requirements associated with the provision of standard control services
to the extent that there are no such obligations or requirements, maintain service quality, reliability and security of supply of standard control services and maintain the reliability and security of the distribution system
maintain the safety of the distribution system through the supply of standard control services.
5 AER, Expenditure Forecast Electricity Distribution Guideline, November 2013, p. 9; see also AEMC, Economic Regulation Final Rule Determination, pp. 111 and 112.
6 NER, cl. 6.5.7(c).7 AEMC Final Rule Determination: National Electricity Amendment (Economic Regulation of Network Service
Providers) Rule 2012, 29 November 2012, p. 113 (AEMC Economic Regulation Final Rule Determination).8 NER, cl. 6.5.7(a).
13 Attachment 6 – Capital expenditure | Ausgrid Final decision 2015–19

Importantly, our assessment is about the total forecast capex and not about particular categories or projects in the capex forecast. The AEMC has described our role in these terms:9
It should be noted here that what the AER approves in this context is expenditure allowances, not projects.
In deciding whether we are satisfied that Ausgrid's proposed total forecast capex reasonably reflects the capex criteria, we have regard to the capex factors. The capex factors are:10
the AER's most recent annual benchmarking report and benchmark capex that would be incurred by an efficient distributor over the relevant regulatory control period
the actual and expected capex of the distributor during the preceding regulatory control periods
the extent to which the capex forecast includes expenditure to address the concerns of electricity consumers as identified by the distributor in the course of its engagement with electricity consumers
the relative prices of operating and capital inputs
the substitution possibilities between operating and capital expenditure
whether the capex forecast is consistent with any incentive scheme or schemes that apply to the distributor
the extent to which the capex forecast is referable to arrangements with a person other than the distributor that, in the opinion of the AER, do not reflect arm's length terms
whether the capex forecast includes an amount relating to a project that should more appropriately be included as a contingent project
the extent to which the distributor has considered, and made provision for, efficient and prudent non-network alternatives.
In addition, the AER may notify the distributor in writing, prior to the submission of its revised regulatory proposal, of any other factor it considers relevant.11 We have not had regard to any additional factors in this final decision for Ausgrid.
In taking these factors into account, the AEMC has noted that:12
…this does not mean that every factor will be relevant to every aspect of every regulatory determination the AER makes. The AER may decide that certain factors are not relevant in certain cases once it has considered them.
9 AEMC, Economic Regulation Final Rule Determination, p. vii.10 NER, cl. 6.5.7(e).11 NER, cl. 6.5.7(e)(12).12 AEMC, Economic Regulation Final Rule Determination, p. 115.
14 Attachment 6 – Capital expenditure | Ausgrid Final decision 2015–19

For transparency and ease of reference, we have included a summary of how we have had regard to each of the capex factors in our assessment at the end of this attachment.
More broadly, we also note that in exercising our discretion, we take into account the revenue and pricing principles which are set out in the NEL.13
Expenditure Assessment Guidelines
The rule changes the AEMC made in November 2012 require us to make and publish an Expenditure Forecast Assessment Guideline for Electricity Distribution, released in November 2013 (Expenditure Guideline).14 The Expenditure Guideline sets out the AER's proposed general approach to assessing capex (and opex) forecasts. The rule changes also require us to set out our approach to assessing capex in the relevant framework and approach paper. For Ausgrid, our framework and approach paper (published in January 2014) stated that we would apply the Expenditure Guideline, including the assessment techniques outlined in it.15 We may depart from our Expenditure Guideline approach and if we do so, we need to explain why. In this determination we have not departed from the approach set out in our Expenditure Guideline.
We note that in response to our draft decision, Ausgrid submitted that we failed to engage adequately or appropriately with the substance of their capital expenditure proposal.16 We have in this final decision more clearly set out our engagement with the information Ausgrid has included in its revised proposal including the reports submitted from its consultants. Ausgrid further submitted that we and our consultants relied almost exclusively on the data supplied in response to the regulatory information notice (RIN) in formulating the draft decision.17 Ausgrid also provided an audit report by PWC indicating that care needs to be taken in using RIN data.18 We note that the RIN data forms part of a distributor's regulatory proposal.19 In our Expenditure Guideline we set out that we would "require all the data that facilitate the application of our assessment approach and assessment techniques" and the RIN we issued in advance of a service provider lodging its regulatory proposal would specify the exact information required.20 Accordingly, we consider that our intention to materially rely upon the RIN data was made clear as part of the Expenditure Guideline. However, we do acknowledge that the differences between Ausgrid's initial proposal and the RIN created differences of understanding between us and Ausgrid on the figures underlying the overall capex total. We have reconciled these numerical differences in section 6.5 of this Attachment and consider our final decision is made on an appropriate basis.
13 NEL, ss. 7A and 16(2).14 AEMC, Economic Regulation Final Rule Determination, p. 114 and AER Expenditure Forecast Electricity
Distribution Guideline.15 AER, Framework and approach paper, p.36.16 Ausgrid, Revised Regulatory Proposal, p.77.17 Ausgrid, Revised Regulatory Proposal, p.74.18 Ausgrid - 1.10 - PWC - Independent expert advice on appropriateness of RIN data for benchmarking comparison,
Jan 2015. 19 NER, clause 6.8.2(c2) and (d).20 AER, Expenditure Forecast Electricity Distribution Guideline, p. 25.
15 Attachment 6 – Capital expenditure | Ausgrid Final decision 2015–19
6.3.1 Building an alternative estimate of total forecast capex
Our starting point for building an alternative estimate is Ausgrid's revised proposal.21 We then considered its performance in the previous regulatory control period to inform our alternative estimate. We also reviewed the proposed forecast methodology and the service provider's reliance on key assumptions that underlie its forecast. Ausgrid has submitted further information on its forecast methodology in its revised proposal and we have addressed this below.22
We have maintained in our final decision the use of the specific techniques that we used in our draft decision. Many of our techniques encompass the capex factors that we are required to take into account. Further details on each of these techniques is included in Appendix A and Appendix B.
Some of these techniques focus on total capex; others focus on high level, standardised sub-categories of capex. Importantly, the techniques that focus on sub-categories are not conducted for the purpose of determining at a detailed level what projects or programs of work the service provider should or should not undertake. They are but one means of assessing the overall total forecast capex required by the service provider. This is consistent with the regulatory framework and the AEMC's statement that the AER does not approve specific projects but rather an overall revenue requirement that includes total capex forecast.23 Once we approve total revenue, which will be determined by reference to our analysis of the proposed capex, the service provider is then free to prioritise its capex program given the prevailing circumstances at the time (such as demand and economic conditions that impact during the regulatory period). Some projects or programs of work that were not anticipated may be required. Equally likely, some of the projects or programs of work that the service provider has proposed for the regulatory control period may not ultimately be required in the regulatory control period. We consider that a prudent and efficient service provider would consider the changing environment throughout the regulatory control period and make sound decisions taking into account their individual circumstances.
As explained in our Guidelines:
Our assessment techniques may complement each other in terms of the information they provide. This holistic approach gives us the ability to use all of these techniques, and refine them over time. The extent to which we use each technique will vary depending on the expenditure proposal we are assessing, but we intend to consider the inter-connections between our assessment techniques when determining total capex … forecasts. We typically would not infer the findings of an assessment technique in isolation from other techniques.24
21 AER Expenditure Forecast Electricity Distribution Guideline, p. 9; see also AEMC Economic Regulation Final Rule Determination, pp. 111 and 112.
22 Ausgrid, Attachment 1.16 - Jacobs - System Capex and Maintenance Prudency Assessment.23 AEMC, Final Rule Determination: National Electricity Amendment (Economic Regulation of Network Service
Providers) Rule 2012, 29 November 2012, p. vii.24 AER Expenditure Forecast Electricity Distribution Guideline, p. 12.
16 Attachment 6 – Capital expenditure | Ausgrid Final decision 2015–19

In arriving at our estimate, we have had to weight the various techniques used in our assessment. How we weight these techniques will be determined on a case by case basis using our judgement as to which techniques are more robust, in the particular circumstances of each assessment. By relying on a number of techniques and weighting as relevant, we ensure we can take into consideration a wide variety of information and can take a holistic approach to assessing the proposed capex forecast. We have clarified to what extent we rely on each technique when assessing expenditure under the different capex drivers in response to Ausgrid's submissions that in our draft decision we had given inappropriate weighting to certain techniques.25
Where our techniques involve the use of a consultant, to the extent that we accept our consultants' findings, we have set this out clearly in this final decision and they form part of our reasons for arriving at our final decision on overall capex. In all cases where we have relied on the findings of our consultants, we have done so only after carefully reviewing their analysis and conclusions, and evaluating these in the light of the outcomes from our other techniques and our examination of Ausgrid's proposal.
We also need to take into account the various interrelationships between the total forecast capex and other components of a service provider's distribution determination. The other components that directly affect the total forecast capex are forecast opex, forecast demand, the service target performance incentive scheme, the capital expenditure sharing scheme, real cost escalation and contingent projects. We discuss how these components impact the total forecast capex in Table 6-4.
25 Ausgrid, Revised Regulatory Proposal, p. 101.
17 Attachment 6 – Capital expenditure | Ausgrid Final decision 2015–19

Underlying our approach are two general assumptions:
The capex criteria relating to a prudent operator and efficient costs are complementary such that prudent and efficient expenditure reflects the lowest long-term cost to consumers for the most appropriate investment or activity required to achieve the expenditure objectives26
Past expenditure was sufficient for Ausgrid to manage and operate its network in that previous period, in a manner that achieved the capex objectives.27
After applying the above approach, we arrive at our alternative estimate of the total capex forecast.
6.3.2 Comparing the service provider's proposal with our alternative estimate
Having established our estimate of the total forecast capex, we can test the service provider's proposed total forecast capex. This includes comparing our alternative estimate of forecast total capex with the service provider's proposal. The service provider's forecast methodology and its key assumptions may explain any differences between our alternative estimate and its proposal.
As the AEMC foreshadowed, we may need to exercise our judgement in determining whether any 'margin of difference' is reasonable:28
The AER could be expected to approach the assessment of a NSP's expenditure (capex or opex) forecast by determining its own forecast of expenditure based on the material before it. Presumably this will never match exactly the amount proposed by the NSP. However there will be a certain margin of difference between the AER's forecast and that of the NSP within which the AER could say that the NSP's forecast is reasonable. What the margin is in a particular case, and therefore what the AER will accept as reasonable, is a matter for the AER exercising its regulatory judgment.
We have not relied solely on any one technique to assist us in forming a view as to whether we are satisfied that a service provider's proposed forecast capex reasonably reflects the capex criteria. We have drawn on a range of techniques as well as our assessment of other elements that impact upon capex such as demand and real cost escalators.
Our decision concerns Ausgrid’s total forecast capex and we are not approving specific projects. It is important to recognise that the service provider is not precluded from
26 AER Expenditure Forecast Electricity Distribution Guideline, pp. 8 and 9. AER Expenditure Forecast Electricity Distribution Guideline, pp. 8 and 9. The Tribunal has previously endorsed this approach: see : Application by Ergon Energy Corporation Limited (Non-system property capital expenditure) (No 4) [2010] ACompT 12; Application by EnergyAustralia and Others [2009] ACompT 8; Application by Ergon Energy Corporation Limited (Labour Cost Escalators) (No 3) [2010] ACompT 11; Application by DBNGP (WA) Transmission Pty Ltd (No 3) [2012] ACompT 14; Application by United Energy Distribution Pty Limited [2012] ACompT 1; Re: Application by ElectraNet Pty Limited (No 3) [2008] ACompT 3 ; Application by DBNGP (WA).
27 AER Expenditure Forecast Electricity Distribution Guideline, p. 9.28 AEMC, Economic Regulation Final Rule Determination, p. 112.
18 Attachment 6 – Capital expenditure | Ausgrid Final decision 2015–19

undertaking unexpected capex works, if the need arises, and despite the fact that such works did not form part our assessment in this determination. We consider that a prudent and efficient service provider would consider the changing environment throughout the regulatory period and make sound decisions taking into account their individual circumstances to address any unanticipated issues. Our provision of a total capex forecast does not constrain a service provider’s actual spending – either as a cap or as a requirement that the forecast be spent on specific projects or activities. It is conceivable that a service provider might wish to expend particular capital expenditure differently or in excess of the total capex forecast set out in our this decision. Our decision does not constrain it from doing so.
The regulatory framework has a number of mechanisms to deal with unanticipated expenditure needs. Importantly, where unexpected events leads to an overspend of the approved capex forecast, a service provider does not bear the full cost, but rather bears 30 per cent of this cost, if the expenditure is found to be prudent and efficient. Further, for significant unexpected capex, the pass-through provisions provide a means for a service provider to pass on such expenses to customers where appropriate.
This does not mean that we have set our alternative estimate below the level where Ausgrid has a reasonable chance to recover its efficient costs. Rather, we note that Ausgrid is able to respond to any unanticipated issues that arise during the 2014–19 period and in the event that the approved total revenue underestimates the total capex required, Ausgrid has significant flexibility to allow it to meet its safety and reliability obligations.
Conversely, if we overestimate the amount of capex required, the stronger incentives put in place by the AEMC in 2012 should lead to a distributor spending only what is efficient, with the benefits of the underspend being shared between the distributor and consumers.
Further to the 2012 rule change, the AEMC in a 2013 rule change, amended the expenditure objectives. This addressed the problem that the previous expenditure objectives relating to reliability, security and quality of supply:29
…could be interpreted so that the expenditure an NSP includes in its regulatory proposal is to be based on maintaining the NSP's existing levels of reliability, security or quality, even where an NSP is performing above the required standards for these measures, or where required standards for those measures are lowered.
Consequently, where standards have been lowered for reliability, security or quality, the expenditure objectives now clarify that the relevant standards are those standards in place at the time of our determination and not any previous standards. We consider the implementation of the STPIS in a practical sense requires us to fund Ausgrid to maintain its average level of reliability commensurate with the STPIS targets. We note
29 AEMC, Final Rule Determination, National Electricity Amendment (Network Service Provider Expenditure Objectives) Rule 2013 No. 5, p. ii.
19 Attachment 6 – Capital expenditure | Ausgrid Final decision 2015–19

that this level of performance is higher than the minimum standards Ausgrid is required to achieve under its licence obligations.
6.4 Reasons for final decision We applied the assessment approach set out in section 6.3 to Ausgrid. We are not
satisfied that Ausgrid's total forecast capex reasonably reflects the capex criteria. We compared Ausgrid's capex forecast to a capex forecast we constructed using the approach and techniques outlined in section 6.3 and appendix B. Ausgrid's proposal is materially higher than ours. We are satisfied that our alternative estimate reasonably reflects the capex criteria.
Table 6-3 sets out the capex amounts by capex driver that we have included in our alternative estimate of Ausgrid's total forecast capex for the 2014–2019 period.
Table 6-3 Our assessment of required capex by capex driver ($ million 2013–14)
Category 2014-15 2015-16 2016-17 2017-18 2018-19 Total
Augmentation 99.3 59.3 52.9 44.4 47.1 303.0
Connections 60.9 36.2 36.6 40.7 38.8 213.3
Replacement 308.9 397.4 383.0 317.8 271.4 1678.4
Reliability expenditure 3.1 5.8 5.2 3.1 2.3 19.5
Non-Network 68.5 71.8 68.1 72.1 70.9 351.3
Capitalised overheads 123.8 138.9 138.4 127.0 116.9 645.0
Materials escalation adjustment
-0.4 -0.4 -1.9 -3.3 -3.3 -9.3
NET CAPEX (excludes capcons) 664.1 709.0 682.3 601.8 544.0 3201.2
capcons 76.6 95.6 93.9 116.4 94.9 477.3
TOTAL GROSS CAPEX (includes capcons)
740.6 804.6 776.2 718.2 638.9 3678.5
Source: AER analysis.
Our assessment of Ausgrid's forecasting methodology, key assumptions and past capex performance are discussed in the section below.
In relation to past performance, we specifically consider the impact on expenditure of past licence conditions for reliability and network design and planning standards, and the removal of those conditions as of 1 July 2014. Our detailed assessment of capex drivers is in Appendix B. This sets out the application of our assessment techniques to the capex drivers, and the weighting we gave to particular techniques. We used our reasoning in the appendices to form our alternative estimate.
20 Attachment 6 – Capital expenditure | Ausgrid Final decision 2015–19

6.4.1 Key assumptions
The NER require Ausgrid to include in its regulatory proposal the key assumptions that underlie its proposed forecast capex and a certification by its directors that those key assumptions are reasonable.30 Ausgrid's key assumptions are set out in its regulatory proposal.31
We have assessed Ausgrid's key assumptions in the appendices to this capex attachment. In addition, we have some specific concerns about Ausgrid's key assumption about its legal and organisational structure and the pending expiry of its transitional services arrangement with EnergyAustralia. Ausgrid submitted that its “current ownership and legal structure [does] not incorporate any impacts associated with a potential change of ownership … [and] this is a reasonable assumption given that there has been no formal announcement by the current owner that a sale of the company will proceed in the 2014–2019 period”.32 This appears to imply that a change in ownership, if it were to occur, would affect the amount of forecast capex that would be required to achieve the capex objectives. In our view, this is not the case and there is no logical basis for this assumption.
6.4.2 Forecasting methodology
Ausgrid is required to inform us about the methodology it proposes to use to prepare its forecast capex allowance before it submits its regulatory proposal.33 It is also required to include this information in its regulatory proposal.34 The main points of Ausgrid's forecasting methodology are set out in its regulatory proposal.35
In its revised proposal Ausgrid noted that it considers its forecasting process involves both top down and bottom up methods.36 It submitted additional information in relation to its forecasting approach and pointed to top down approaches. It submitted:37
it applies several levels of top down assessment in various parts of its investment planning process, but the most visible and formal is through the board level gate 1 investment portfolio approval process.
its investment planning is undertaken concurrently with the development and risk assessment of the overall portfolio. Planners were required to undertake risk assessments for each program using the CASH methodology, and to include alternative program timing scenarios (effectively alternate programs) as part of finalising the proposed program. It submits that its expenditure forecast was constructed and progressively refined over a period of time.
30 NER, cll. S6.1.1(2), (4) and (5).31 Ausgrid, Regulatory Proposal, p. 41, Attachments 5.13 and 5.14. 32 Ausgrid, Regulatory Proposal, Attachment 5.13, p 3.33 NER, cll. 6.8.1A and 11.56.4(o); Ausgrid, Expenditure Forecasting Methods, November 2013.34 NER, cl. S6.1.1(2); Ausgrid, Regulatory Proposal, pp. 39–41.35 Ausgrid, Expenditure Forecasting Methods, November 2013, pp. 8–11; Ausgrid, Regulatory Proposal, pp. 39–
41.36 Ausgrid, Revised Regulatory Proposal, p.78.37 Ausgrid, Revised Regulatory Proposal, p.78.
21 Attachment 6 – Capital expenditure | Ausgrid Final decision 2015–19

In our draft decision, we identified three aspects of Ausgrid's forecasting methodology which indicated that its methodology is not a sufficient basis on which to conclude that its proposed total forecast capex reasonably reflects the capex criteria. These were:
Ausgrid's forecasting methodology applies a bottom up build (or bottom up assessment) to estimate the forecast expenditure for all its capex categories (except for information and communications technology).38
Ausgrid's cost-benefit evaluation of each of its capital projects or programs reveals that its underlying risk assessment is excessively conservative.39
Ausgrid's forecast methodology lacks a clear delivery strategy or plan.40
Ausgrid disagreed with our position in the draft decision and stated that it considers its formal top down review process exhibits the key characteristics of an effective assessment and decision process.41 Ausgrid provided a report by Jacobs which stated that the NSW distributors had applied a top down assessment of their capex forecasts.42 Ausgrid also pointed to a number of improvements suggested by its adviser, Advisian, of which Ausgrid considers it has implemented the majority.43
We re-examined Ausgrid's forecasting approach and acknowledge that elements of a top down assessment were applied in the formulation of its regulatory proposal and enhanced in its revised regulatory proposal. We also note the view of our consultant EMCa that:44
Ausgrid’s RRP substantively confirms the systemic issues identified in our October 2014 report, as evidenced by the 19% reduction in the proposed repex forecast in its RRP and which has resulted from Ausgrid reconsidering its proposal in light of the issues that we identified. Despite this reduction, we consider that Ausgrid has retained a residual bias towards conservative risk assessment and cost over-estimation.
We note that EMCa considers that Ausgrid has implemented a more effective top down challenge that incorporates enhanced qualitative risk assessment.45 Importantly, however, EMCa concludes that:
We consider that there is scope for further expenditure reductions by Ausgrid to achieve a prudent and efficient level of expenditure. Specifically, we consider that the following issues have contributed to a residual over-estimation bias:
there is evidence of a conservative risk bias in Ausgrid’s sub-transmission cable replacement and LV switchgear programs; and
Ausgrid has not adequately justified the activity forecast and cost of its pole program.
38 AER, Draft Decision Ausgrid distribution determination 2015-2019, Attachment 6, pp. 30-32. 39 AER, Draft Decision Ausgrid distribution determination 2015-2019, Attachment 6, p. 32.40 AER, Draft Decision Ausgrid distribution determination 2015-2019, Attachment 6, pp. 32-33.41 Ausgrid, Revised Regulatory Proposal, p.80.42 Ausgrid, Attachment 1.16 - Jacobs - System Capex and Maintenance Prudency Assessment, p. 26-27.43 Ausgrid, Revised Regulatory Proposal, p.79.44 EMCa, Review of Proposed Replacement Capital Expenditure in Ausgrid’s Revised Regulatory Proposal, p. i.45 EMCa, Review of Proposed Replacement Capital Expenditure in Ausgrid’s Revised Regulatory Proposal, p. ii.
22 Attachment 6 – Capital expenditure | Ausgrid Final decision 2015–19

While we note the improvements in Ausgrid's forecasting approaches we remain concerned that a top down assessment does not appear to have been integral to the forecasting process. Accordingly, we remain of the view that Ausgrid's forecasting approach is not a sufficient basis on which to conclude that its proposed total forecast capex reasonably reflects the capex criteria.
EMCa previously noted that while Ausgrid’s objective of containing network tariff increases to CPI could be construed as a cost forecasting discipline, this objective is not within the remit of the NER which, more appropriately, supports the determination of tariffs based on prudent and efficient expenditure allowances.46 We agree with EMCa's view that the CPI price constraint applied by NNSW does not actually reflect the efficient operation of the network, rather, it appears to be a strategy predicated on an assumption that prices need to continuously increase regardless of the actual need for network expenditure. We also note that Ausgrid's consultant Advisian appears to agree with this assessment. Advisian stated in its review of the NNSW methodology that:47
In endorsing the improvements made in accordance with our recommendations, Advisian must point out that CASH is not yet a project prioritisation process. It is a risk scoring model. Project evaluation, including cost benefit analysis, is to be completed using “business as usual” evaluation processes outside of CASH. It does not automatically follow that a project with a high risk score in CASH is a high priority project – it may not be economic to significantly reduce the level of risk on a cost / benefit basis.
Advisian also stated that:48
The model therefore flags projects / programs that should proceed to the next stage of capital evaluation to determining if enterprise investment criteria are met. It does not do this in its own right. This analysis is performed externally to CASH using “business as usual” investment guidelines. Some information, such as project identifiers and projects costs are linked back to CASH. However, portfolio optimisation, sizing of work programs and the like is performed outside of CASH.
We conclude, despite the presence of enhanced top down assessment techniques, that Ausgrid's forecasting methodology still predominately relies upon a bottom up build (or bottom up assessment) to estimate the forecast expenditure for all its capex categories (except for information and communications technology). Bottom up approaches have a tendency to overstate required allowances as they do not adequately account for inter-relationships and synergies between projects or areas of work. Simply aggregating such estimates is unlikely to result in a total forecast capex allowance that we are satisfied reasonably reflects the capex criteria. Our review reflects the submission made by the National Generators Forum:49
46 EMCa, Review of Proposed Replacement Capex in Ausgrid's Regulatory Proposal 2014 - 2019, p. 11.47 Ausgrid, Advisian - Networks NSW independent review of the risk based prioritisation process for Networks NSW -
post implementation review, p. 2.48 Ausgrid, Advisian - Networks NSW independent review of the risk based prioritisation process for Networks NSW -
post implementation review, p. 7.
23 Attachment 6 – Capital expenditure | Ausgrid Final decision 2015–19

Historically, regulatory assessments of capital expenditure programs have predominantly incorporated bottom up assessments of a sample of projects and / or programs, with minimal top down assessment of the overall level of capex, underlying drivers and impacts on network prices. Given the substantial information asymmetry between distributors and regulators, past approaches have had limited success in determining an efficient overall level of capex for NSW distributors. It is far more difficult for a regulator to reject capital expenditure proposals on an individual project-by-project basis compared to setting a top down overall efficient level of capex within which distributors can prioritise individual projects.
Ausgrid has improved its approach to cost-benefit evaluation and this appears to address some of the concerns we expressed in our draft decision.50 We note that this enhanced risk assessment approach has been applied to a subset of Ausgrid's programs. We agree with the assessment of EMCa that:51
The enhanced risk assessment methodology applied by Ausgrid to repex projects and programs in its RRP is a positive development and reflects a substantive improvement over the subjective risk assessments used in Ausgrid’s RP.
However, they also found justification for a greater level of expenditure reduction in both the cable and switchgear asset categories.52
We note that Ausgrid has now has provided a Strategic Delivery and Workforce Plan for 2015-19.53 This addresses many of the concerns we had in our draft decision about the deliverability of Ausgrid's work plan.
Finally, we note that in its revised proposal, Ausgrid submitted that we failed to engage adequately or appropriately with the substance of its capital expenditure proposal.54 On the contrary, we engaged with Ausgrid's proposals, both initial and revised, in order to understand whether in the context of its overall capex proposal, its expenditure reasonably reflected the capex criteria. We accept that a particular project or program of capex may appear to be justified. However, our application of certain techniques reveals that when such programs are considered in the context of the entire portfolio of projects, it may not be prudent or efficient to undertake that overall level of expenditure. For this reason, top down techniques are well suited to assessing the efficient and prudent level of total capex.
6.4.3 Interaction with the STPIS
We consider that our approved capital expenditure forecast is consistent with the setting of targets under the STPIS. Particularly, we consider that the capex allowance
49 National Generators Forum, Submission to the Revenue Determinations (2014–2019) of the NSW Distribution Network Service Providers, p. 9.
50 Ausgrid - 5.11 - Quantitative Risk Evaluation of Selected Replacement Projects - January 2015. 51 EMCa, Review of Proposed Replacement Capital Expenditure in Ausgrid’s Revised Regulatory Proposal, p. 12.52 EMCa, Review of Proposed Replacement Capital Expenditure in Ausgrid’s Revised Regulatory Proposal, p. 15.53 Ausgrid - 5.05 - Strategic delivery and workforce plans for 2015-19_PUBLIC - January 2015. 54 Ausgrid, Revised Regulatory Proposal, p.77.
24 Attachment 6 – Capital expenditure | Ausgrid Final decision 2015–19

should not be set such that there is an expectation that it will lead to Ausgrid systematically under or over performing against its STPIS targets. We consider our estimate of total forecast capex is sufficient to allow a prudent and efficient service provider in Ausgrid's circumstances to maintain performance at the targets set under the STPIS. As such, it is appropriate to apply the STPIS as set out in attachment 11.
In making our final decision, we have specifically considered the impact our decision will have on the safety and reliability of Ausgrid's network. We consider our substitute estimate is sufficient for Ausgrid to maintain the safety, service quality and reliability of its network consistent with its obligations. In any event, our provision of a total capex forecast does not constrain a service provider’s actual spending – either as a cap or as a requirement that the forecast be spent on specific projects or activities. It is conceivable that a service provider might wish to expend particular capital expenditure differently or in excess of the total capex forecast set out in our decision. Our decision does not constrain it from doing so. Under our analysis of specific capex drivers, we have explained how our analysis and certain assessment techniques factor in safety and reliability requirements.
Ausgrid submitted that in relying on our benchmarking and high level analysis we have not understood the implications of its decision on safety and reliability outcomes and its ability to efficiently meet its obligations as a distributor.55 It provided reports from R2A Due Diligence and Jacobs in support of its position.56 These contend that our capex forecast would negatively impact safety and reliability. We note the starting position of both consultant reports appears to be that any reduced capex forecast will result in the deferment of necessary reliability activities and that this necessarily has a negative impact on reliability.
We do not accept the underlying premise of these reports - that our approved capex results in the deferral of projects required to maintain reliability. As set out in Section 6.4.2 we consider that inappropriately low risk tolerances and lack of rigour in the forecasting approach has led Ausgrid to over forecast the work required in the forthcoming regulatory period. Accordingly, with proper prioritisation of its capital program Ausgrid will be able manage the safety and reliability of its network. This is evidenced in our augex and repex analysis as set out in appendix B. Because we do not accept the starting premise that our approved capex forecast will result in Ausgrid deferring necessary maintenance tasks, we do not accept that the conclusions about safety and reliability found in the Jacobs and R2A report are correct. We note that Ausgrid is required to continue to maintain its network in accordance with its existing regulatory obligations. Whilst we consider our alternative capex estimate reasonably reflects the capex criteria, we also note that the framework provides some mitigation strategies should unforeseen circumstances lead to an overspend of the capex amount approved in this determination as part of total revenue
6.4.4 Ausgrid capex performance
55 Ausgrid, Revised Regulatory Proposal, p 109.56 Ausgrid, Attachment 1.01 - Jacobs - Reliability Impact Assessment and Ausgrid, Attachment 1.13 - R2A asset
system failure safety risk assessment.
25 Attachment 6 – Capital expenditure | Ausgrid Final decision 2015–19
We looked at a number of historical metrics of Ausgrid's capex performance against that of other distributors in the NEM. These metrics are largely based on outputs of the annual benchmarking report and other analysis undertaken using data provided by the distributors for the annual benchmarking report. This includes Ausgrid's relative partial and multilateral total factor productivity (MTFP) performance, capex and RAB per customer and maximum demand, and Ausgrid's historic capex trend.
We note that the NER sets out that we must have regard to our annual benchmarking report.57 This section shows how we have taken it into account. We consider this high level benchmarking at the overall capex level is suitable to gain an overall understanding of Ausgrid's proposal in a broader context. However, in our capex assessment we have not relied on our high level benchmarking metrics set out below other than to note that these metrics generally support the outcomes of our other techniques - which demonstrate that Ausgrid has room to find some efficiencies in its capex program. We have not used this analysis in a deterministic manner in our capex assessment.
Partial factor productivity of capital and multilateral total factor productivity
Figure 6-2 shows a measure of partial factor productivity of capital taken from our benchmarking report. This measure incorporated the productivity of transformers, overhead lines and underground cables. Ausgrid had the fifth lowest level of partial factor productivity of capital of the distributors in the NEM, and substantially lower than a number of the Victorian and South Australian distributors.
Figure 6-2 Partial factor productivity of capital (transformers, overhead and underground lines)
57 NER, cl. 6.5.7(e)(4).
26 Attachment 6 – Capital expenditure | Ausgrid Final decision 2015–19

2006 2007 2008 2009 2010 2011 2012 20130.600
0.800
1.000
1.200
1.400
1.600
1.800
2.000
03CIT13UED08JEN10SAP05ENX04END11AND06ERG02AGD09PCR01ACT07ESS12TND
Source: AER annual benchmarking report.
Figure 6-3 shows that Ausgrid also recorded the fourth lowest level of MTFP in the NEM across the distributors. MTFP measures how efficient a business is in terms of its inputs (costs) and outputs (energy delivered, customer numbers, ratcheted maximum demand, reliability and circuit line length). Across all of these measures, the Victorian and South Australian distributors significantly outperformed Ausgrid.
Figure 6-3 Multilateral total factor productivity
27 Attachment 6 – Capital expenditure | Ausgrid Final decision 2015–19

2006 2007 2008 2009 2010 2011 2012 20130.600
0.800
1.000
1.200
1.400
1.600
1.800
2.000
CITSAPUEDJENPCRENXENDANDESSAGDERGACTTND
Source: AER annual benchmarking report.
Relative capex efficiency metrics
Figure 6-4 and Figure 6-5 shows capex per customer and per maximum demand, against customer density. Capex is taken as a five year average for the years 2008–12. For the NSW distributors and ActewAGL, we have also included the businesses' revised capex forecasts for the 2014–2019 period. We have considered capex per customer as it reflects the amount consumers are charged for additional capital investments.
Figure 6-4 shows that Ausgrid had one of the highest levels of capex per customer in the NEM for the 2008-2012 period. Ausgrid's capex per customer would reduce for the 2014–2019 period based on its revised forecast capex. However, Ausgrid's capex per customer is still high when compared with the Victorian and South Australian distributors. Ausgrid's proposed forecast capex for the 2014–2019 period would have to reduce by approximately 39 per cent in order for its capex per customer to be comparable to that the average $3,300 per customer achieved by the Victorian and South Australian distributors in 2008–2012.
Figure 6-4 Capex per customer (000s, $2013-14), against customer density
28 Attachment 6 – Capital expenditure | Ausgrid Final decision 2015–19

Source: AER analysis.
Figure 6-5 shows that Ausgrid had the second highest level of capex per maximum demand for the 2008–2012 period. Capex per maximum demand is forecast to reduce for Ausgrid in the next period but is still among the highest levels in the NEM. Ausgrid's proposed forecast capex for the 2014–2019 period would have to reduce by approximately 34 per cent in order for its capex per maximum demand to be comparable to the average of $99,500 per maximum demand achieved by the Victorian and South Australian distributors in 2008–2012.
Figure 6-5 Capex per maximum demand (000s, $2013–14), against customer density
29 Attachment 6 – Capital expenditure | Ausgrid Final decision 2015–19

Source: AER analysis.
Ausgrid raised a number of concerns with the benchmarks presented above and concluded that the approach to benchmarking is unsuited to providing any meaningful input to the assessment of the prudency and efficiency of the capex forecast as required under the capex criteria.
We have considered the submissions raised by all parties in response to our benchmarking approach. We consider that our benchmarking approaches and specifications are appropriate and that the underlying data is sufficiently robust. A full consideration of these submissions is set out in Attachment 7. We do accept that due to the lumpy nature of capex, capex is less suited to benchmarking than opex. This was reflected in our draft decision in that we did not rely upon in this high level benchmarking in a deterministic manner for capex. To the degree that we have relied upon benchmarks at the category level, this is set out in the relevant appendix.
6.4.5 Ausgrid historic trend and licence conditions
We have compared Ausgrid's capex proposal for the 2014–2019 period against the long term historical trend in capex levels. We have specifically considered how Ausgrid's capex forecast should change to reflect current trends in demand and changes in licence conditions.
Networks NSW has commented that at the time of submitting their regulatory proposals for the previous determination, the distributors needed to address the legacy of previous under-investment in their networks. While it is arguable that earlier periods may reflect unsustainable expenditure, for the reasons outlined below, we consider the 2009–2014 regulatory period is likely to overstate capex levels.
30 Attachment 6 – Capital expenditure | Ausgrid Final decision 2015–19

We note that in response to our draft decision Ausgrid raised some issues with the data underlying our trend analysis. Ausgrid stated:58
The values in the chart do not agree with the information provided in our submission and in the RIN requested by the AER. The draft decision quotes a series of historical sources for the data, but it appears that there has been no checking to ensure that the data was compiled on a comparable basis. The data we provided was prepared using the same assumptions and definitions.
We have revised our analysis on the basis of the information that Ausgrid has provided, though we note that as outlined in appendix B, Ausgrid appears to have restated its capex between its initial and revised proposals.
Figure 6-6 shows actual historic capex and proposed capex between 2001-12 and 2018-19. This shows a greater reduction from the 2009-14 period to the 2014-19 period than shown in our draft decision. However, it still shows that the 2014-19 period is above the period prior to 2009.
Figure 6-6 Ausgrid total capex (including overheads)—historical and forecast for 2014–2019 period
Source: Various.59
58 Ausgrid, Revised Regulatory Proposal, p.82.59 Ausgrid considered we mischaracterised the profile of its historic trend in total forecast capex in our draft decision.
Ausgrid's revised proposal includes a chart superimposing what it considers is the correct trend over that included in our draft decision (Ausgrid's Revised Regulatory Proposal and Preliminary Submission p.84). We note the corrected trend in Ausgrid's revised proposal plots Ausgrid's initial total forecast capex on a basis which was not available to us at the time of the draft decision. We note Ausgrid's corrected trend applies a uniform historical CPI deflator of 2.50 per cent per annum whereas our deflators are derived from actual CPI figures published by the ABS (Series Cat no 6401.0).
31 Attachment 6 – Capital expenditure | Ausgrid Final decision 2015–19

In our draft decision we stated that a key driver of capex from 2005 was the NSW licence conditions around design standards and that these were removed in July 2014.60 As outlined in our draft decision, we anticipate that removing the design planning requirements should reduce capex requirements for NSW distributors based on the following.61 The Australian Energy Market Operator (AEMO) estimated:
NSW customers could save up to $50 a year on their electricity bills from 2015 without any detrimental effect to current reliability levels if a probabilistic approach to distribution reliability was adopted over the current and next financial year.62
The Australian Energy Market Commission (AEMC) estimated that capex could reduce by '$140 million under the modest reduction scenario to $530 million under the extreme reduction scenario' over a five year timeframe for the three NSW distributors.63
Even without the change in standards, it could be expected that NSW distributors' capex would come down for the 2014–2019 period given the significant capex invested from 2005–06 to meet the standards. As noted by the AEMC:
We note that significant investment has been made since the NSW distribution reliability requirements were increased in 2005 and that future investment will be incremental in order to maintain reliability at the current level.64
Ausgrid considers that we are incorrect in concluding that the removal of the design planning standards was a key driver of reduced expenditure. Rather, Ausgrid considers that it's the reduction in demand as well as the completion of backlog expenditure that drives the reduction in its forecast total expenditure. Ausgrid stated:65
It is also relevant to remake the point from our submission that the reason the licence conditions came to exist was to remedy the loss of supply security that had been allowed to diminish during a prolonged period of under-funding and consequent constraint on prudent investment. Having restored those more prudent levels, there would be no need for further “backlog” expenditure in the next period. With the prospect of much lower forecast demand growth, Ausgrid’s need for capacity augmentation is expected to be very low – with or without the licence conditions.
Further, its consultant, Jacobs, states that historical trend projections are useful only for the purposes of providing a context for the future projections rather than being a predictor of future need.66 In its view, this is so because it can't be assumed that
60 AER, Draft Decision Ausgrid distribution determination 2015-2019, Attachment 6, p. 6-41.61 AER, Draft Decision Ausgrid distribution determination 2015-2019, Attachment 6 p. 6-27.62 AEMO, Submission to AEMC's Review of Distribution Reliability Outcomes and Standards, Draft Report - NSW
Workstream, p. 1.63 AEMC, Review of Distribution Reliability Outcomes and Standards, Final Report - NSW Workstream, 31 August
2012, p. vi, http://www.aemc.gov.au/media/docs/NSW-workstream-final-report-160466c4-733b-4cf2-b4e3-4095c6d9819b-0.pdf.
64 AEMC, Review of Distribution Reliability Outcomes and Standards, Final Report - NSW Workstream, 31 August 2012, p. iii, http://www.aemc.gov.au/media/docs/NSW-workstream-final-report-160466c4-733b-4cf2-b4e3-4095c6d9819b-0.pdf.
65 Ausgrid, Revised Regulatory Proposal, p.83.66 Ausgrid, Attachment 1.01 - Jacobs - Reliability Impact Assessment, p34
32 Attachment 6 – Capital expenditure | Ausgrid Final decision 2015–19

historical drivers of investment will be identical in the future especially where there is an ageing asset base.67
We note that one of the capex factors that the AER is expressly required to have regard to is the actual and expected capex of the distributor during the preceding regulatory control periods.68 That is, the NER recognises that past expenditure is an important factor to consider in assessing forecast expenditure. We accept, as Jacobs points out, that it provides context for future projections. It also demonstrates the level of expenditure that a distributor has previously incurred to provide its services.
As a starting point, past expenditure is indicative of future expenditure if the operating environment remains similar over the time period. If there is a material change in operating environment, then this needs to be factored into any trend analysis. We consider that the removal of design planning standards from the licence conditions in 2014 is such a material change. For this reason, we maintain our position that at the total capex level, our trend analysis indicates that the 2009-14 regulatory period is likely to be higher than the efficient level of capex in the 2014-19 period.69
6.4.6 Interrelationships
There are a number of interrelationships between Ausgrid's total forecast capex for the 2014–2019 period and other components of its distribution determination that we have taken into account in coming to our draft decision. Table 6-4 summarises these other components and their interrelationships with the total forecast capex.
67 Ausgrid, Attachment 1.01 - Jacobs - Reliability Impact Assessment, p3468 NER, cl. 6.5.7(e)(5).69 We have applied trend analysis deterministically for non -network capex, because we consider there is a high
level of recurrent expenditure in this category.
33 Attachment 6 – Capital expenditure | Ausgrid Final decision 2015–19

Table 6-4 Interrelationships between total forecast capex and other components
Other component Interrelationships
Total forecast opex
There are elements of Ausgrid's total forecast opex that are related to its total forecast capex. These are:
the labour cost escalators that we approved in refer Attachment 7.
the amount of maintenance opex that is reflected in Ausgrid's opex base year that we approved in Attachment 7.
The labour cost escalators are interrelated with capex because Ausgrid's total forecast capex includes expenditure for capitalised labour. Maintenance opex is also related to capex, although we did not approve a specific amount of maintenance opex as part of assessing Ausgrid's total forecast opex. This is because the amount of maintenance opex that is reflected in Ausgrid's opex base in part determines the extent to which Ausgrid needs to spend repex during the 2014–2019 period.
Forecast demand
Forecast demand is related to Ausgrid's total forecast capex. Growth driven capex, which includes augex and customer connections capex, is typically triggered by a need to build or upgrade a network to address changes in demand or to comply with quality, reliability and security of supply requirements. Hence, the main driver of growth-related capex is maximum demand and its effect on network utilisation and reliability.
Capital Expenditure Sharing Scheme (CESS)
The CESS is related to Ausgrid's total forecast capex. In particular, the effective application of the CESS is contingent on the approved total forecast capex being efficient, and that it reasonably reflects the capex criteria. As we note in the capex criteria table below, this is because any efficiency gains or losses are measured against the approved total forecast capex. In addition, in future transmission determinations we will be required to undertake an ex post review of the efficiency and prudency of capex, with the option to exclude any inefficient capex in excess of the approved total forecast capex from Ausgrid's regulatory asset base. In particular, the CESS will ensure that Ausgrid bears at least 30 per cent of any overspend against the capex allowance. Similarly, if Ausgrid can fulfil their objectives without spending the full capex allowance, it will be able to retain 30 per cent of the benefit of this. In addition, if an overspend is found to be inefficient through the ex post review, Ausgrid risks having to bear the entire overspend.
Service Target Performance Incentive Scheme (STPIS)
The STPIS is related to Ausgrid's total forecast capex, in so far as it is important that it does not include any expenditure for the purpose of improving supply reliability during the 2014–2019 period. This is because such expenditure should be offset by rewards provided through the application of the STPIS.
Further, the forecast capex should be sufficient to allow Ausgrid to maintain performance at the targets set under the STPIS. The capex allowance should not be set such that there is an expectation that it will lead to Ausgrid systematically under or over performing against its targets.
Contingent project
A contingent project is related to Ausgrid's total forecast capex. This is because an amount of expenditure that should be included as a contingent project should not be included as part of Ausgrid's total forecast capex for the 2014–2019 period.
We have not identified any contingent projects for Ausgrid during the 2014–2019 period.
Source: AER analysis.
6.4.7 Consideration of the capex factors
In deciding whether or not we are satisfied Ausgrid's forecast reasonably reflects the capex criteria, we have had regard to the following capex factors when applying
34 Attachment 6 – Capital expenditure | Ausgrid Final decision 2015–19

our assessment techniques to the total proposed capex forecast, and where relevant, to different sub-categories of proposed expenditure. Table 6-5 summarises how we have taken into account the capex factors.
Table 6-5 AER consideration of the capex factors
Capex factor AER consideration
The most recent annual benchmarking report and benchmarking capex that would be incurred by an efficient distributor over the relevant regulatory control period
We have had regard to our most recent benchmarking report in assessing Ausgrid's proposed total forecast capex and in determining our alternative estimate for the 2014–2019 period. This can be seen in the metrics we used in our assessment of Ausgrid's capex performance.
The actual and expected capex of the Ausgrid during any preceding regulatory control periods
We have had regard to Ausgrid's actual and expected capex during the 2009–2014 and preceding regulatory control periods in assessing its proposed total forecast capex.
This can be seen in our assessment of Ausgrid's capex performance. It can also be seen in our assessment of the forecast capex associated with the capex drivers that underlie Ausgrid's total forecast capex.
For non-network related capex, we rely on trend analysis to arrive at an estimate that meets the capex criteria.
The extent to which the capex forecast includes expenditure to address concerns of electricity consumers as identified by Ausgrid in the course of its engagement with electricity consumers
We have had regard to the extent to which Ausgrid's proposed total forecast capex includes expenditure to address consumer concerns that have been identified by Ausgrid. On the information available to us, including submissions received from stakeholders, we have been unable to identify the extent to which Ausgrid's proposed total forecast capex includes capex that address the concerns of its consumers that it has identified.
The relative prices of operating and capital inputsWe have had regard to the relative prices of operating and capital inputs in assessing Ausgrid's proposed real cost escalation factors for materials. We discuss this in Appendix D.
The substitution possibilities between operating and capital expenditure
We have had regard to the substitution possibilities between opex and capex. We have considered whether there are more efficient and prudent trade-offs in investing more or less in capital in place of ongoing operations. See our discussion about the interrelationships between Ausgrid's total forecast capex and total forecast opex in Table 6-4 above.
Whether the capex forecast is consistent with any incentive scheme or schemes that apply to Ausgrid
We have had regard to whether Ausgrid's proposed total forecast capex is consistent with the CESS and the STPIS. See our discussion about the interrelationships between Ausgrid's total forecast capex and the application of the CESS and the STPIS in Table 6-4 above.
The extent to which the capex forecast is referable to arrangements with a person other than the distributor that do not reflect arm's length terms
We have had regard to whether any part of Ausgrid's proposed total forecast capex or our alternative estimate that is referable to arrangements with a person other than Ausgrid that do not reflect arm's length terms. We did not identify any parts of Ausgrid's proposed total forecast capex or our alternative estimate that is referable in this way.
Whether the capex forecast includes an amount relating to a project that should more appropriately be included as a contingent project
We have had regard to whether any amount of Ausgrid's proposed total forecast capex or our alternative estimate that relates to a project that should more appropriately be included as a contingent project. We did not identify any such amounts that should more appropriately be included as a contingent project.
35 Attachment 6 – Capital expenditure | Ausgrid Final decision 2015–19
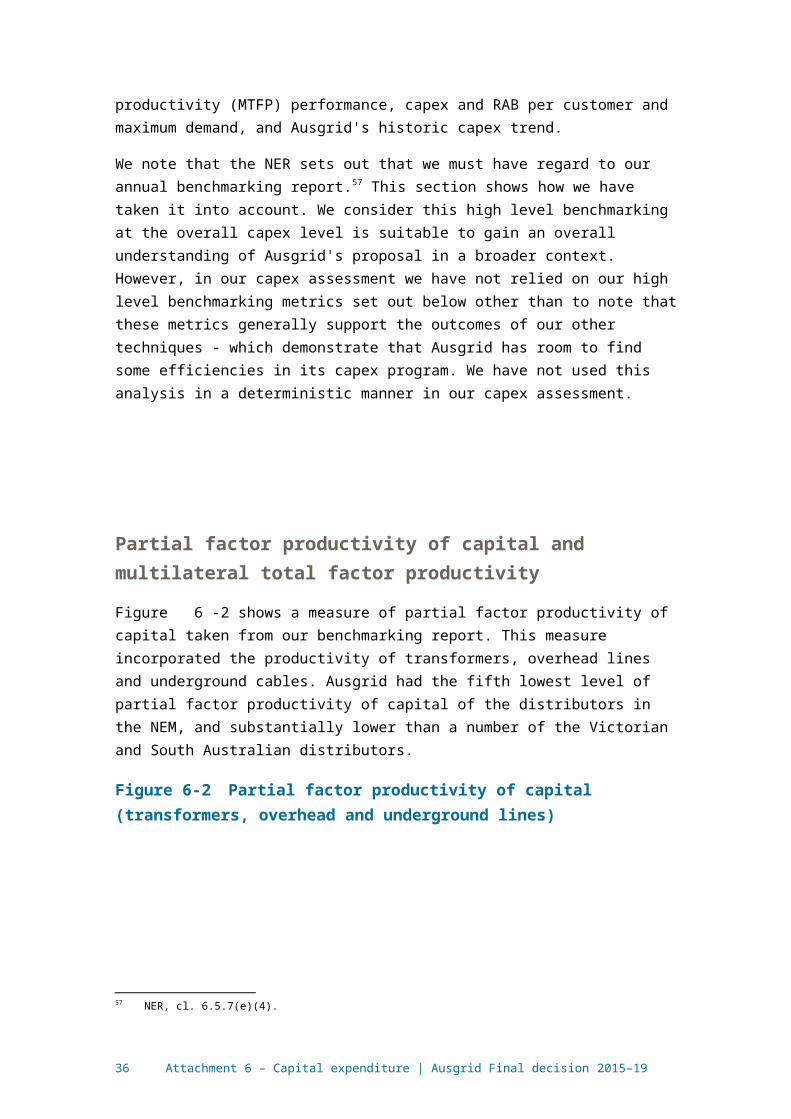
Capex factor AER consideration
The extent to which Ausgrid has considered and made provision for efficient and prudent non-network alternatives
We have had regard to the extent to which Ausgrid made provision for efficient and prudent non-network alternatives as part of our assessment of the capex associated with the non-network capex driver. We discuss this further in Appendix B.
Any other factor the AER considers relevant and which the AER has notified Ausgrid in writing, prior to the submission of its revised regulatory proposal under is a capex factor
We did not identify any other capex factor that we consider relevant.
Source: AER analysis.
6.5 Clarification of numerical differencesIn our draft decision, some discrepancies arose when we allocated Ausgrid's 'balancing item' across the expenditure driver categories. We used the balancing item identified in Ausgrid's RIN of $145.7 million. In developing the RIN templates we had included provision for a balancing item to allow businesses to remove the double counting of expenditure that might be included in more than one driver. It was not expected that the balancing item would have large positive values, as was the case for Ausgrid. We therefore considered it necessary to allocate the balancing item across the expenditure categories for the purposes of constructing an alternative forecast. Ausgrid submitted that this distorted a clear picture of the proposal.70
Ausgrid's revised proposal included further information to assist us in clarifying these discrepancies.71 Following consideration of this information we no longer consider this adjustment is required. Ausgrid submitted that the capital contributions should be treated only as a revenue equivalent item and there is no basis for allocating the value of the capital contributions into Ausgrid’s capital expenditure forecasts.72 The capital contributions are assets that are paid for by connecting consumers and then are gifted to the distributor to be managed and operated for the remainder of their life. Ausgrid explained that no funds are received for these assets and as such the value that Ausgrid ascribes to them should be excluded from the calculations.73 We accept that this is an appropriate allocation of the balancing item and treatment of capital contributions.
Table 6-6 sets out a reconciliation of all stages of our decision making process presented on a consistent basis. This information is provided to assist stakeholders in comparing forecasts across the decision making process. The change that we have adopted to the treatment of gifted assets does not change the underlying analysis set out in our draft decision.
70 Ausgrid, Revised Regulatory Proposal, p. 74.71 Ausgrid, Revised Regulatory Proposal, p. 74.72 Ausgrid, Revised Regulatory Proposal, p.90.73 Ausgrid, Revised Regulatory Proposal, p.90.
36 Attachment 6 – Capital expenditure | Ausgrid Final decision 2015–19

Table 6-6 Allocation of balancing item to driver
$ million ($2013/14) Initial Proposal
Initial Proposal(after allocating balancing item)
Draft Decision Revised Proposal
Final Decision
Augmentation 489.5 509.0 376.4 303.0 303.0
Connections 164.5 171.1 171.1 213.3 213.3
Replacement 3,106.6 3,226.4 1,768.8 2,197.2 1,678.4
Reliability 0.0 0.0 0.0 13.0 19.5
Non-Network 307.6 307.6 279.2 384.2 351.3
Capitalised overheads
729.2 729.2 477.3 645.0 645.0
Real cost escalation 0.0 0.0 -4.3 0.0 -9.3
Balancing item 145.7 0.0 0.0 0.0 0.0
Capcons (Gifted Assets)
(allocated across categories)
(allocated across categories)
(allocated across categories)
477.3 477.3
TOTAL GROSS CAPEX 4,943.3 4,943.3 3,068.6 4,232.9 3,678.5
Capcons 522.3 522.3 522.3 477.3 477.3
TOTAL NET CAPEX 4,421.0 4,421.0 2,546.3 3,755.6 3,201.2
Source: AER analysis.
37 Attachment 6 – Capital expenditure | Ausgrid Final decision 2015–19

A Assessment TechniquesThis appendix describes the assessment approaches we have applied in assessing
Ausgrid's proposed forecast capex. The extent to which we rely on each of the assessment techniques is set out in Appendix B.
The assessment techniques that we apply in capex are necessarily different from those we apply in the assessment of opex. This is reflective of differences in the nature of the expenditure being assessed. As such, we use some assessment techniques in our capex assessment that are not suitable for assessing opex and vice versa. We set this out in our Expenditure Assessment Guideline, where we stated:74
Past actual expenditure may not be an appropriate starting point for capex given it is largely non-recurrent or 'lumpy', and so past expenditures or work volumes may not be indicative of future volumes. For non-recurrent expenditure, we will attempt to normalise for work volumes and examine per unit costs (including through benchmarking across distributors) when forming a view on forecast unit costs.
Other drivers of capex (such as replacement expenditure and connections works) may be recurrent. For such expenditure, we will attempt to identify trends in revealed volumes and costs as an indicator of forecast requirements.
The assessment techniques that we have used to asses Ausgrid's capex are set out below.
A.1 Economic benchmarkingEconomic benchmarking is one of the key outputs of our annual benchmarking
report. We are required to consider economic benchmarking as it is one of the capex factors under the NER.75 Economic benchmarking applies economic theory to measure the efficiency of a distributor's use of inputs to produce outputs, having regard to environmental factors.76 It allows us to compare the performance of a distributor against its own past performance, and the performance of other distributors. Economic benchmarking helps us to assess whether a distributor's capex forecast represents efficient costs.77 As stated by the AEMC, 'benchmarking is a critical exercise in assessing the efficiency of a NSP'.78
A number of economic benchmarks from the annual benchmarking report are relevant to our assessment of capex. These include measures of total cost efficiency and overall capex efficiency. In general, these measures calculate a distributor's efficiency with consideration given to its inputs, outputs and its operating environment. We have considered each distributor's operating environment in so far as there are factors that are outside of a distributor's control but which affect a distributor's ability to
74 Expenditure Assessment Guideline p.8.75 NER, cl. 6.5.7(e)(4).76 AER, Explanatory Statement: Expenditure Forecasting Assessment Guidelines, November 2013.77 NER, cl. 6.5.7(c).78 AEMC, Economic Regulation Final Rule Determination, p. 25.
38 Attachment 6 – Capital expenditure | Ausgrid Final decision 2015–19

convert inputs into outputs.79 Once such exogenous factors are taken into account, we expect distributors to operate at similar levels of efficiency. One example of an exogenous factor that we have taken into account is customer density. For more on how we have forecast these measures, see our annual benchmarking report.80
In addition to the measures in the annual benchmarking report, we have considered how distributors have performed on a number of overall capex metrics, including capex per customer, and capex per maximum demand. We have calculated these economic benchmarks based on actual data from the previous regulatory control period.
The results from the economic benchmarking give an indication of the relative efficiency of each of the distributors, and how this has changed over time.
A.2 Trend analysisWe have considered past trends in actual and forecast capex. This is one of the
capex factors to which we are required to have regard to under the NER.81
Trend analysis involves comparing NSPs' forecast capex and work volumes against historic levels. Where forecast capex and volumes are materially different to historic levels, we have sought to understand what has caused these differences. In doing so, we have considered the reasons given by the distributors in their proposals, as well as changes in the circumstances of the distributor.
In considering whether a business' capex forecast reasonably reflects the capex criteria, we need to consider whether the forecast will allow the business to meet expected demand, and comply with relevant regulatory obligations.82 Demand and regulatory obligations (specifically, service standards) are key drivers of capex. More onerous standards will increase capex, as will growth in maximum demand. Conversely, reduced service obligations or a decline in demand will likely cause a reduction in the amount of capex required by a distributor.
Maximum demand is a key driver of augmentation or demand driven expenditure. As augmentation often needs to occur prior to demand growth being realised, forecast rather than actual demand is relevant when a business is deciding what augmentation projects will be required in an upcoming regulatory control period. However, to the extent that the forecast demand changes, a business should incorporate this updated information and reassess the need for the projects. Growth in a business' network will also drive augmentation and connections related capex. For these reasons it is important to consider how trends in capex (and in particular, augex and connections) compare with trends in demand (both maximum demand and customer numbers).
For service standards, there is generally a lag between when capex is undertaken (or not) and when the service improves (or declines). This is important in considering the expected impact of an increase or decrease in capex on service levels. It is also
79 AEMC, Economic Regulation Final Rule Determination, p.113. Exogenous factors could include geographic factors, customer factors, network factors and jurisdictional factors.
80 AER, Annual Benchmarking Report, 2014.81 NER, cl. 6.5.7(e)(5).82 NER, cl. 6.5.7(a)(3).
39 Attachment 6 – Capital expenditure | Ausgrid Final decision 2015–19

relevant to consider when service standards have changed and how this has affected a NSP's capex requirements.
We have looked at trends in capex across a range of levels including at the total capex level, for growth related capex, for replacement capex, and for each of the categories of capex, as relevant. We have also compared these with trends in demand and changes in service standards over time.
A.3 Category analysisExpenditure category level analysis allows us to compare expenditure across
NSPs, and over time, for various levels of capex:
overall costs within each category of capex
unit costs, across a range of activities
volumes, across a range of activities
asset lives, across a range of asset classes which we have used in assessing repex.
Using standardised reporting templates, we have collected data on augex, repex, connections, non-network capex, overheads and demand forecasts for all distributors in the NEM. The use of standardised category data allows us to make direct comparisons across distributors. Standardised category data also allows us to identify and scrutinise different operating and environmental factors that affect the amount and cost of works performed by distributors, and how these factors may change over time.
A.4 Predictive modellingPredictive modelling uses statistical analysis to determine the expected efficient
costs over the regulatory control period associated with the demand for electricity services for different categories of works. We have two predictive models:
the repex model
the augex model (used in a qualitative sense)
The use of the repex and augex models is directly relevant to assessing whether a distributor's capex forecast reasonably reflects the capex criteria.83 The models draw on actual capex incurred by a distributor during the preceding regulatory control period. This past capex is a factor that we must take into account.84
The repex model is a high-level probability based model that forecasts asset replacement capex (repex) for various asset categories based on their condition (using age as a proxy) and unit costs. In instances where we consider a distributor’s proposed repex does not conform to the capex criteria, we have used this (in combination with other techniques where appropriate) to generate a substitute forecast.
83 NER, cl. 6.5.7(c).84 NER, cl. 6.5.7(e)(5).
40 Attachment 6 – Capital expenditure | Ausgrid Final decision 2015–19

The augex model is used to forecast the amount of augmentation driven by increases in maximum demand. It compares utilisation thresholds with forecasts of maximum demand to identify the parts of a network segment that may require augmentation.85 The model then uses capacity factors to calculate required augmentation, and unit costs to derive an augex forecast for the distributor over a given period.86 In this way, the augex model accounts for the main internal drivers of augex that may differ between distributors, namely peak demand growth and its impact on asset utilisation. We can use the augex model to identify general trends in asset utilisation over time as well as to identify outliers in a distributor's augex forecast.87 We have not relied heavily on the augex model for this reset. This is because much of the augex in the 2009–2014 period was due to compliance with the design standard in the licence conditions rather than reflecting growth in demand. We consider the augex model will be applied to a greater degree in future determinations. This is likely to occur when demand driven augex is a more material driver of expenditure.
A.5 Engineering reviewWe have engaged engineering consultants, EMCa, to assist with our review of
distributors' capex proposals. This has involved reviewing distributor's processes, and specific projects and programs of work.
In particular, in respect of augex and repex, our engineering consultants considered whether the distributor's:
forecast is reasonable and unbiased, by assessing whether the distributor’s proposed capex is a reasonable forecast of the unbiased efficient cost of maintaining performance at the required or efficient service levels.
risk management is prudent and efficient, by assessing whether the business manages risk such that the cost to the customer of achieving the capex objectives at the required or efficient service levels is commensurate with the customer value provided by those service levels.
Costs and work practices are prudent and efficient, by assessing whether the distributor uses the minimum resources reasonably practical to achieve the capex objectives and maintain the required or efficient service levels.
These factors relate directly to our assessment of whether the distributor's proposal reflects the efficient costs that a prudent operator would require to achieve the capex objectives:88
If a capex forecast is reasonable and unbiased, the forecast should reflect the efficient costs required to meet the capex objectives. That is, there should be no systemic biases which result in a forecast that is greater than or less than the efficient forecast. Further, the forecast should be reasonable in that it reflects what a prudent operator would incur to achieve the capex objectives.
85 Asset utilisation is the proportion of the asset's capability under use during peak demand conditions.86 For more information, see: AER, Guidance document: AER augmentation model handbook, November.87 AER, 'Meeting summary – distributor replacement and augmentation capex', Workshop 4: Category analysis
work-stream – Replacement and demand driven augmentation (Distribution), 8 March 2013, p. 1.88 NER, cl. 6.5.7(c).
41 Attachment 6 – Capital expenditure | Ausgrid Final decision 2015–19

If the distributor's risk management is prudent and efficient, the distributor's forecast is likely to reflect the costs that a prudent operator would require to achieve the capex objectives. A prudent operator would consider both the probability of a risk eventuating and the impact of the risk (if it were to occur) in determining whether to undertake work to mitigate the risk.89
If the distributor's costs and work practices are prudent and efficient, the distributor will have the appropriate governance and asset management practices to ensure that the distributor has determined an efficient capex forecast that is based on a realistic expectation of the demand forecast and cost inputs required to achieve the capex objectives.
The engineering consultants applied a sampling approach in considering the above factors. Where this revealed concerns about systemic issues, we asked the engineers to take a broader sample and to quantify the likely impact of these biases.
In some cases we have also reviewed specific capex projects or programs of work to determine whether these meet the capex criteria. These reviews have been undertaken in respect of particular capex categories including for non-network capex and have included the assessment of:
the options the distributor investigated to address the economic requirement (for example, for augmentation projects the review should have included an assessment of the extent to which the distributor considered and provided for efficient and prudent non-network alternatives90)
whether the timing of the project is efficient
unit costs and volumes, including comparisons with relevant benchmarks
whether the project should more appropriately be included as a contingent project91
deliverability of the project, given other capex and opex works
the relative prices of operating and capital inputs and the substitution possibilities between operating and capital expenditure92
the extent to which the capex forecast is referable to arrangements with a person other than the distributor that, in the opinion of the AER, do not reflect arm's length terms93, where relevant
the extent to which the capex forecast includes expenditure to address the concerns of electricity consumers as identified by the distributor in the course of its engagement with electricity consumers.94 This is most relevant to core network expenditure (augex and repex) and may include the distributor's consideration of the value of customer reliability (VCR) standard or a similar appropriate standard.
89 This approach is supported by NERA Economic Consulting, see NERA, Economic Interpretation of cll. 6.5.6 and 6.5.7 of the National Electricity Rules, Supplementary Report, Ausgrid submission, 8 May 2014, p. 7.
90 NER, cl. 6.5.7(c)(10).91 This principally relates to augex. See NER, cl. 6.5.7(e)(9A).92 This principally relates to augex. See NER, cll. 6.5.7(e)(6) and (e)(9A).93 NER, cl. 6.5.7(e)(9).94 NER, cl. 6.5.7(e)(5A).
42 Attachment 6 – Capital expenditure | Ausgrid Final decision 2015–19

B Assessment of capex driversWe present our detailed analysis of the sub-categories of Ausgrid's revised forecast
capex for the 2014–2019 period in this Appendix. These sub-categories reflect the drivers of forecast capex over the 2014–2019 period. These drivers are augmentation capex (augex), customer connections capex, replacement capex (repex), reliability improvement capex, capitalised overheads and non-network capex.
As we discuss in the capex attachment, we are not satisfied that Ausgrid's proposed total forecast capex reasonably reflects the capex criteria. In this appendix we set out further analysis in support of this view. This further analysis also explains the basis for our alternative estimate of Ausgrid's total forecast capex that we are satisfied reasonably reflects the capex criteria. In coming to our views and our alternative estimate we have applied the assessment approach that we discuss in section 6.3.
This appendix sets out our findings and views on each sub-category of capex. The structure of this appendix is:
Section B.1: alternative estimate
Section B.2: forecast augex
Section B.3: forecast customer connections capex, including capital contributions
Section B.4: forecast repex
Section B.5: forecast reliability improvement capex
Section B.6: forecast capitalised overheads
Section B.7: non-network capex
Section B.8: demand management.
In each of sections B.1 - B.8 we examine eight sub-categories of capex which we include in our alternative estimate. For each such sub-category, we explain why we are satisfied the amount of capex that we include in our alternative estimate reasonably reflects the capex criteria (alternative estimate).
B.1 Alternative estimateHaving examined Ausgrid's proposal, we formed a view on our alternative estimate of the capex required to reasonably reflect the capex criteria. Our alternative estimate is based on our assessment techniques, explained in section 6.3 and Appendix A. Our weighting of each of these techniques, and our response to Ausgrid's submissions on the weighting should be given to particular techniques, is set out under the capex drivers below.
We have considered the interaction between the removal of the design planning standards, the minimum reliability standards and the historical reliability that Ausgrid has been achieving. We consider that our decision takes into account the removal of
43 Attachment 6 – Capital expenditure | Ausgrid Final decision 2015–19

the design planning standards and provides a level of capex that is commensurate with the removal of this standard. Further, we consider Ausgrid will be able to maintain both its average reliability level and meet its minimum reliability standards within our approved capex allowance. Our approved capex allowance must also be considered in the context of the significant capex program undertaken in the previous regulatory period.
We are satisfied that our alternative estimate reasonably reflects the capex criteria.
B.2 AER findings and estimates for augmentation expenditure
Our estimate of required augex for Ausgrid for the 2014–19 period is $303 million ($2013–14). This is consistent with Ausgrid's augex forecast included in their revised proposal (excluding overheads).
In our draft decision, we did not accept Ausgrid's initial proposed augex of $399 million ($2013–14). We concluded that it did not reasonably reflect the capex criteria. Table B-1 compares the forecasts across the decision making process.
Table B-1 Augex forecasts comparisons
$ million ($2013/2014) Initial Proposal AER Draft Decision Revised Proposal Final Decision
$ million 399 286 303 303
% reduction from initial proposal
- -28% -25% -25%
Source: AER Analysis.
Note: As set out in section 6.5, due to the change in approach to allocating capital contributions and gifted assets
between our draft and final decisions, the amounts set out in the draft decision are not directly comparable
with the final decision. In addition, the initial augex proposal included reliability capex which we assessed
separately but did not remove from the assessed augex allowance. This table removes gifted assets from
the initial proposal and the draft decision so that it is comparable with Ausgrid's revised proposal. The
change that we have adopted to the treatment of gifted assets for the final decision does not change the
underlying analysis set out in our draft decision.
B.2.1 Revised proposal
Ausgrid's revised proposal of $303 million ($2013–14) is lower than its initial proposal. Ausgrid submits that it agrees that the principles identified in our draft decision should apply to the assessment of its augex proposal.95 Ausgrid identifies these principles as changes in demand forecasts and the flexibility to apply risk based cost benefit analysis to augex decisions in the context of its revised licence conditions.96
In particular, following the draft decision:
95 Ausgrid, Revised Regulatory Proposal 1 July 2014 - 30 June 2019, 20 January 2015, p. 84.96 Ausgrid, Revised Regulatory Proposal1 July 2014 - 30 June 2019, 20 January 2015, p. 84.
44 Attachment 6 – Capital expenditure | Ausgrid Final decision 2015–19

Ausgrid reviewed its area plan augex to account for changes in demand forecasts and other inputs since it prepared its initial proposal.97 As a result of reductions in demand growth, Ausgrid deferred additional sub-transmission projects with the outcome that all new sub-transmission projects have now been deferred.98 However, Ausgrid submits that over 50 per cent of such forecast expenditure is comprised of projects that are currently in progress (that are more than 80 per cent complete), and therefore it is not prudent to defer these projects.99
Ausgrid revised its high voltage distribution capacity model (i.e. 11kV model) to reflect changes in demand growth at the zone substation level and to recognise the expected impact of risk-based cost benefit analysis on expenditures following the removal of deterministic licence conditions.100 However, Ausgrid submits that applying a flat 15 per cent reduction to its forecast (as applied in the draft decision) is not appropriate because the forecast contained a substantial element of in-flight projects.
Ausgrid made no changes to its low voltage capacity augex because this program is driven by new customer connections and there is no relationship to average growth rates at the zone substation level.101
Ausgrid states that these adjustments take into account the draft decision and differences in both demand forecasts and planning methodology since the initial proposal was submitted.102 In addition, Ausgrid states that it has applied further top down adjustments to account for expected project and labour efficiency improvements in the later years of the period.103
Nonetheless, Ausgrid also disagrees with the outcome of the draft decision and the robustness of the evidence on which it is based.104 In particular, Ausgrid submits that our 15 per cent top down adjustment based on findings from our consultant, WorleyParsons is not justified.105
Ausgrid acknowledges that it has not fully implemented changes to its planning standards, but submits that it had implemented an interim planning standard on 1 July 2014 to reflect the expectation that new planning standards would give Ausgrid greater flexibility with regards to the timing of high cost investments.106 The key change from this interim standard was to defer major sub-transmission growth projects beyond 2019.107 As noted above, Ausgrid deferred its remaining sub-transmission projects following the draft decision.
97 Ausgrid, Revised Regulatory Proposal1 July 2014 - 30 June 2019, 20 January 2015, p. 89.98 Ausgrid, Revised Regulatory Proposal1 July 2014 - 30 June 2019, 20 January 2015, p. 89.99 Ausgrid, Revised Regulatory Proposal1 July 2014 - 30 June 2019, 20 January 2015, p. 85. 100 Ausgrid, Revised Regulatory Proposal1 July 2014 - 30 June 2019, 20 January 2015, p. 89.101 Ausgrid, Revised Regulatory Proposal1 July 2014 - 30 June 2019, 20 January 2015, p. 89.102 Ausgrid, Revised Regulatory Proposal1 July 2014 - 30 June 2019, 20 January 2015, p. 84.103 Ausgrid, Revised Regulatory Proposal1 July 2014 - 30 June 2019, 20 January 2015, p. 87.104 Ausgrid, Revised Regulatory Proposal1 July 2014 - 30 June 2019, 20 January 2015, p. 84.105 Ausgrid, Revised Regulatory Proposal1 July 2014 - 30 June 2019, 20 January 2015, p. 84 and 89.106 Ausgrid, Revised Regulatory Proposal1 July 2014 - 30 June 2019, 20 January 2015, p. 85.107 Ausgrid, Revised Regulatory Proposal1 July 2014 - 30 June 2019, 20 January 2015, p. 85
45 Attachment 6 – Capital expenditure | Ausgrid Final decision 2015–19
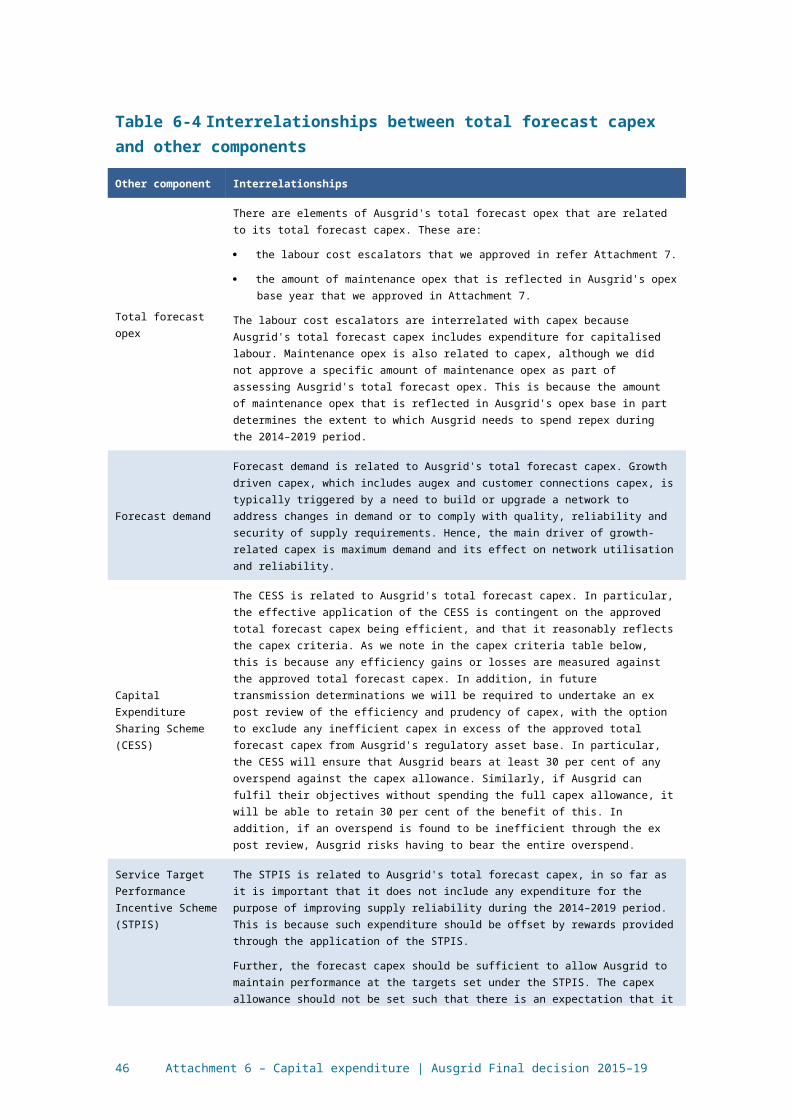
Ausgrid also states that it agrees with statements in our draft decision that it is reasonable to use the latest estimates for VCR in any cost benefit analysis based on these values but it is more useful to consider the VCR values at a granular level that is particular to augex. The most recent results published by AEMO indicated that the average VCR in NSW was lower than previously surveyed. However, Ausgrid notes the recent VCR for particular network segments (in particular residential customers) were actually higher than previously surveyed.108 Ausgrid concludes that this may advance projects rather than defer projects in its distribution network. However, Ausgrid also notes that the very low demand forecasts have meant that Ausgrid has not observed this effect.109
B.2.2 AER approach
In our draft decision of Ausgrid's augex forecast, we applied three assessment techniques:110
trend analysis, comparing the proposed augex with historic expenditure levels, taking into account changes in demand, network capacity and design and planning standards;
an engineering review of Ausgrid's forecasting processes and methodology undertaken by our consultants, WorleyParsons; and
the augex model to generate trends in network utilisation.
The key drivers for the difference between our draft decision and Ausgrid's proposed initial forecast were the:
likely ability of Ausgrid to make further savings by applying risk-based cost benefit analysis assessment techniques following the removal of deterministic planning criteria from Ausgrid’s Distribution Licence Conditions on 1 July 2014. This was supported by advice from WorleyParsons relating to Endeavour Energy, that suggested prudent augex savings of between 10 and 20 per cent during the 2014–19 period could be made through the greater use of risk-based assessments to new and ongoing programs of work. Our draft decision applied a 15 per cent reduction to Ausgrid's augex forecast in light of this advice.
downward revised demand forecast that was reflected in our estimate of the high voltage (HV) feeder expenditure. We applied a linear adjustment to the forecast capex for Ausgrid's high voltage network, based on revised spatial demand forecasts from Ausgrid which suggested a 31.5 per cent decrease in forecast demand (calculated using 'ratcheted demand' analysis). This linear reduction was based on evidence provided by Ausgrid of a linear relationship between demand and its 11kV network expenditure.
108 This contrasts to the VCR for agricultural and industrial customers in NSW which are much lower than previously surveyed. The reductions in VCR for these customers are the primary driver of lower average VCR in NSW.
109 Ausgrid, Revised Regulatory Proposal1 July 2014 - 30 June 2019, 20 January 2015, p. 87110 AER, Draft Decision, Ausgrid distribution determination, 2015-16 to 2018-19, Attachment 6: Capital expenditure,
November 2014, p. 48
46 Attachment 6 – Capital expenditure | Ausgrid Final decision 2015–19

We concluded also that Ausgrid's proposed augex forecast may be higher than it requires to meet localised demand growth in its network based on observations in network utilisation and capacity. See our draft decision for more detail.111
Submissions from AGL, Origin, the Energy Retailers' Association of Australia (ERAA) and the Energy Markets Reform Forum (EMRF) endorsed our draft decision:
AGL submitted that it supported our draft decision because it is hard to justify that Ausgrid requires high levels of capex given that they are facing no demand or energy growth in the current regulatory period.112
Origin submitted that our alternative program represents the most representative alternative that meets the capex criteria as set out in the NER. In support of this, it supports our view that the excess capacity in the network needs to be utilised before supporting further augmentation and agree with our approach to apply a ratcheted demand to provide an indication of the potential need for augmentation.113
The ERAA submitted that the AER’s alternative program better reflects the capex criteria set out in the National Electricity Rules. In support of this the ERAA stated that the improvements in network utilisation, coupled with downgraded demand and security of supply requirements, should drive an observable reduction in the amount of required capex over the 2014–19 period.114
The EMRF noted that we undertook a number of studies (benchmarking, trend analysis, utilization studies, review of forecasting methodology, value of customer reliability - VCR - impacts and a modelling of augex needs based on inputs) that all delivered similar results and contradicted Ausgrid's augex forecast.115
However, the Energy Users Association of Australia (EUAA) submitted that we should adopt further reductions to Ausgrid's augex proposal.116 In support of this, EUAA submitted that:
We should substitute Ausgrid's demand forecasts with forecasts provided by credible independent forecasters. It notes that Ausgrid's augex is built on demand forecasts that are not supported by independent forecasting from AEMO.117
We did not quantify the impacts of Ausgrid's excess capacity and did not demonstrate that it has been appropriately considered in our augmentation capex assessments.118
111 AER, Draft Decision, Ausgrid distribution determination, 2015-16 to 2018-19, Attachment 6: Capital expenditure, November 2014, Appendix A.1.
112 AGL submission to NSW DNSP s draft decisions, p. 2.113 Origin submission to NSW DNSP s draft decisions, pp. 10-12.114 ERAA submission to NSW DNSP s draft decisions, p. 2.115 EMRF submission to NSW DNSP s draft decisions and revised proposals, p. 59.116 EUAA submission to NSW DNSP s draft decisions, p. 34.117 EUAA submission to NSW DNSP s draft decisions, p. 31 and 34.118 EUAA submission to NSW DNSP s draft decisions, p. 32.
47 Attachment 6 – Capital expenditure | Ausgrid Final decision 2015–19

Whilst there are likely to be areas in the networks that have genuine capacity expansion needs, the EUAA does not consider that our assessment process has appropriately scrutinised the networks’ augmentation capex justifications.119
Our adjustments to address the implications of the reduced reliability standards (as reflected in the removal of deterministic planning criteria from the licence condition) do not sufficiently reflect the Ausgrid's reduced reliability-capex requirements.120
Our final decision on Ausgrid's demand forecasts is set out in Appendix C. In summary, we are satisfied that the demand forecasts for the 2014–19 period proposed by Ausgrid in its regulatory proposal (May 2014) reasonably reflect a realistic expectation of demand.
In relation to the use of network capacity trends, in our draft decision we used trends in network utilisation rates in order for us, as well as stakeholders, to gain a broader understanding of trends over time particularly against aggregated augex trends. On the basis of these observations, we sought further detailed analysis based on a technical review by our consultants WorleyParsons. Our reductions to Ausgrid's augex forecast were based on the findings of this technical review. In this final decision, we also have not made any specific adjustments based on our utilisation analysis.
In relation to the technical review, we have reassessed our conclusions based on further evidence submitted by Ausgrid in its revised proposal (as discussed in detail below) in relation to the efficiencies that Ausgrid can achieve through risk-assessed cost benefit analysis.
B.2.3 AER augex findings
Overall, we are satisfied that Ausgrid has addressed the two substantive issues we raised in the draft.
In relation to our findings on demand, Ausgrid has updated its forecasts to take into account actual demand data since the submission of its initial proposal. It has also reconfigured its forecasting model for HV expenditure to address differences in growth rates between HV feeders to account for different areas of growth in its network.121 This resulted in increased forecast capex in some parts of the network. However, Ausgrid also now includes post-model adjustments to reflect the expected impact of risk based cost benefit analysis on expenditures following the removal of deterministic licence conditions.122 The overall impact is a 25 per cent reduction in Ausgrid's HV network forecast when compared to its initial proposal.
In relation to our findings on the need for greater use of risk-based assessments, Ausgrid has reviewed its augmentation programs and identified additional efficiencies based on risk-assessment cost-benefit analysis. It appears that Ausgrid's approach to cost-benefit analysis explains the difference between our substitute estimate in our draft decision and its forecast augex in its revised proposal. We discuss this below.
119 EUAA submission to NSW DNSP s draft decisions, p. 31.120 EUAA submission to NSW DNSP s draft decisions, p. 33.121 Ausgrid, Revised Regulatory Proposal1 July 2014 - 30 June 2019, 20 January 2015, p. 89.122 Ausgrid, Revised Regulatory Proposal1 July 2014 - 30 June 2019, 20 January 2015, p. 89.
48 Attachment 6 – Capital expenditure | Ausgrid Final decision 2015–19

First, Ausgrid's initial proposal did not include sub-transmission growth projects that were deferred based on interim planning standards. This was acknowledged by WorleyParsons in its report.123 We acknowledge that such deferral is prudent. Our 15 per cent adjustment was based on findings for Endeavour Energy which may not accurately reflect the deferral of sub-transmission projects by Ausgrid. In this respect, we accept that our adjustment may have been overstated.
Second, Ausgrid in its revised proposal put forward a number of 'in-flight' augmentation projects, some of which were over 80 per cent complete in the 2009–14 period. Ausgrid submitted that it was not prudent to apply a top down adjustment to the costs of these projects. Such an approach is consistent with the advice provided by WorleyParsons:
Given the advanced state of construction of these projects, it is not practicable to reassess or re-scope these against the new licence conditions.124
We agree and consider it would not be prudent to re-scope, and potentially defer, projects that are already well in-progress with some close to completion. Because our 15 per reduction was based on findings for Endeavour Energy, it may not accurately reflect the specific projects that are already under construction by Ausgrid. In this respect, our adjustment may have been overstated.
In light of our review of the further evidence submitted by Ausgrid, we accept that a top down 15 per cent reduction to Ausgrid's overall augex forecast is unlikely to reflect Ausgrid's efficient and prudent capex requirements given a realistic expectation of the demand forecast and cost inputs. We have therefore modified our position from the draft decision. We accept that the reductions proposed by Ausgrid in its revised proposal reasonably reflect efficient reductions based on the application of risk-assessed cost-benefit analysis for the 2014–19 period.
We also note Ausgrid's submission that it has made a top down adjustment for expected project and labour efficiency improvements in the later years of the period. Ausgrid has not provided a detailed breakdown of the impact of the adjustment. However, to the extent that its revised proposal is overall 25 per cent lower than its initial proposal, this does indicate that Ausgrid has extensively revised its approach and adopted more rigorous techniques for assessing its forecast expenditure.
Ausgrid also assessed the impact of the new VCRs on its augex forecast as we requested in our draft decision. It submitted that the most recent results VCR show that residential VCR has actually increased compared to previous surveys (even though the average VCR has decreased), which may support advancing rather than deferring projects in its distribution network. However, Ausgrid also notes that the very low demand forecasts have meant that Ausgrid has not observed this effect.125
123 WorleyParsons, Review of proposed augmentation capex in NSW DNSP regulatory proposals 2014 - 2019, 17 November 2014, p. 13.
124 WorleyParsons, Review of proposed augmentation capex in NSW DNSP regulatory proposals 2014 - 2019, 17 November 2014, p. 11.
125 Ausgrid, Revised Regulatory Proposal1 July 2014 - 30 June 2019, 20 January 2015, p. 87.
49 Attachment 6 – Capital expenditure | Ausgrid Final decision 2015–19
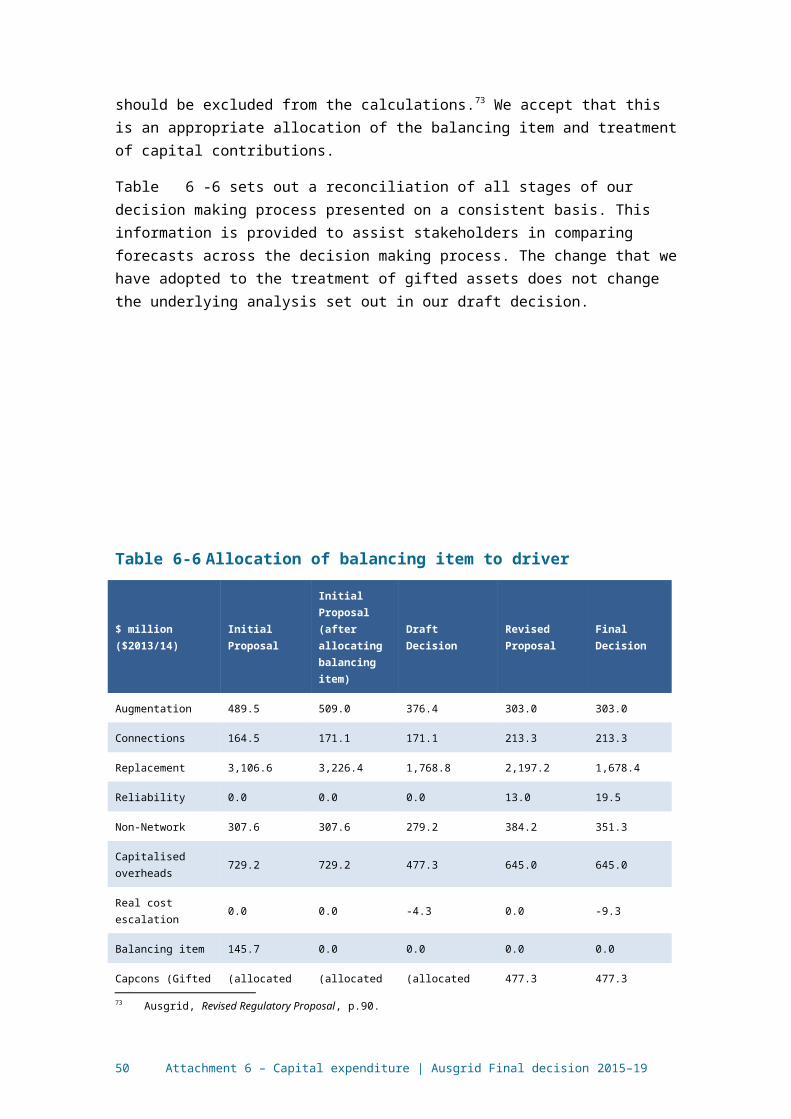
B.3 AER findings and estimates for connectionsThe contestability framework in New South Wales allows customers to choose their own accredited service provider and negotiate efficient prices for connection services. Given the competition between service providers, we do not regulate the majority of connection services in New South Wales. There is, however, a cost involved in augmenting and extending the shared networks to connect new commercial and industrial sites, and multi-unit residential developments. These costs, referred to as 'connections' in this decision, are regulated and funded by all consumers.
In NSW, capital contributions are made up of the value of assets constructed by third parties which are then gifted Ausgrid to be operated and maintained. These contributions are subtracted from total gross capex and as such decrease the revenue that is recovered from all consumers.
B.3.1 AER findings and estimates for connections and contributions
We accept Ausgrid's revised proposal for connections capex of $213.3 million ($2013–14). Similarly, we accept Ausgrid's proposed forecast for capital contributions of $477.3 million ($2013–14).
Our draft decision accepted Ausgrid's connections forecast of $193.6 million ($2013–14).126 In addition, we accepted the capital contributions forecast of $522.3 million ($2013–14). We accepted the forecast after considering trends relative to recent expenditure and our assessment that the forecast was consistent with expected construction activity in NSW. Our draft decision set out our full reasons for accepting the Ausgrid forecasts.
The EUAA notes the uncertainty in the NSW networks' customer connection forecasts and acknowledges various submissions made to us challenging the assumptions of the underlying forecasts.127
We still consider that forecast dwelling growth and construction expenditures are reasonable proxies for growth in connection services. In this final decision we maintain our view that both the connection and customer contribution forecasts are reasonable having regard to the trend of construction activity in NSW. The difference between the amount accepted in our draft and final decisions is explained below.
Connections policy framework
Ausgrid's revised proposal increase its forecast for connections expenditure from $193.6 to $213.3 million ($2013–14) and reduces customer contributions to $477.3
126 As set out in section 6.5, due to the change in approach to allocating capital contributions and gifted assets between our draft and final decisions, the amounts set out in the draft decision are not directly comparable with the final decision. This figure accounts for the removal of gifted assets from the proposal.
127 EUAA submission to NSW DNSP s draft decisions, pp. 34–35.
50 Attachment 6 – Capital expenditure | Ausgrid Final decision 2015–19

million ($2013–14).128 These changes are driven by corrections based on the implementation of the connections policy which commenced on 1 July 2014.129
Ausgrid's connection policy framework determines the costs that a new customer must pay to connect to the network (and the costs that are shared with existing customers through network charges). Under the new framework which commenced on 1 July 2014, the costs to the individual customer are likely to increase, with less of the cost shared with existing consumers.130
This new framework applied to all connection applications submitted after 1 July 2014. However, in its initial proposal, Ausgrid incorrectly assumed that the policy would apply to connection applications that had been submitted prior to 1 July 2014 with the actual work involved in the connection to be undertaken after 1 July 2014. This means that Ausgrid had under-forecast its connections expenditure in its initial proposal.
In its revised proposal, Ausgrid has corrected this error and increased its forecast for connections expenditure from $193.6 to $213.3 million ($2013–14) and reduced customer contributions to $477.3 million ($2013–14).131 We are satisfied that these estimates correctly apply the new connections framework and have applied them in our final decision.
B.4 AER findings and estimates for replacement expenditure
Repex is driven by a service provider's need to replace its assets. In the long run, a service provider's assets will no longer meet the requirements of the network and need to be replaced, refurbished or removed.132 Replacement may occur when an asset fails, or a condition assessment may find it is likely to fail soon and replacement is the most economic option. It may also occur because jurisdictional safety regulations mean it can no longer be safely operated on the network, or because the risk of using the asset exceeds the benefit of continuing to operate it on the network.
In general, the majority of network assets will remain in efficient use for far longer than a single five year regulatory period. As a consequence, a distributor will only need to replace a portion of its network assets in each regulatory control period. The majority of its assets will remain in commission beyond the end of the regulatory control period, and be replaced in subsequent regulatory periods.
Our assessment of repex seeks to establish the portion of Ausgrid's assets that will likely require replacement over the 2014–19 period, and the associated expenditure.
B.4.1 Position
128 Ausgrid, Revised Regulatory Proposal 1 July 2014 - 30 June 2019, 20 January 2015, p. 90.129 Ausgrid, Revised Regulatory Proposal 1 July 2014 - 30 June 2019, 20 January 2015, p. 90.130 Ausgrid, Revised Regulatory Proposal 1 July 2014 - 30 June 2019, 20 January 2015, p. 90.131 Ausgrid, Revised Regulatory Proposal 1 July 2014 - 30 June 2019, 20 January 2015, p. 90.132 Assets may also be replaced due to network augmentation. In these cases the primary reason for the asset
expenditure is not the replacement of an asset that has reached the end of its economic life, but the need to deploy new assets to augment the network, predominantly in response to changing demand.
51 Attachment 6 – Capital expenditure | Ausgrid Final decision 2015–19

We do not accept Ausgrid's revised proposed repex. We have instead included in our alternative estimate of overall total capex, an amount of $1,678 million ($2013-14) for repex, excluding overheads. This is 25 per cent lower than Ausgrid's revised proposal. We are satisfied that this amount reasonably reflects the capex criteria.
B.4.2 Revised proposal
Ausgrid's revised proposal is $2,197 million, $510m or 19 per cent lower than its initial proposal of $2,707 million.133 Ausgrid submitted that the lower forecast was achieved by:134
the application of cost benefit analysis techniques to major cable and switchgear renewal projects
improved segmentation within replacement and duty of care program categories and improved understanding of consequences arising from further development of its risk cost assessment approach
top down allocation of efficiency improvements arising from project scope efficiencies for major projects currently in the planning phase and medium term unit cost improvements from current efficiency programs.
Ausgrid's revised proposal is lower than its initial proposal, reflecting the above points, but remains higher than the amount of repex included in our draft decision ($1,769 million).
B.4.3 Explanation of AER approach
We have applied several assessment techniques to assess Ausgrid’s forecast of repex against the capex criteria. These techniques were:
analysis of Ausgrid’s long term total repex trends
predictive modelling of repex based on Ausgrid's assets in commission
technical review of Ausgrid’s approach to forecasting, costs, work practices and risk management
consideration of various asset health indicators and comparative performance metrics.
In response to Ausgrid's comments about some of the above assessment techniques, we have clarified our application of those techniques and the extent to which we have relied on the outcomes of each in this final decision. In the course of doing so, we have addressed the further information Ausgrid has provided in its revised proposal.
We primarily use our predictive modelling to assess approximately 79 per cent of Ausgrid's proposed repex in combination with the findings of EMCa's technical review.
133 Ausgrid's original proposal included $3,226 million for repex, as indicated by its response to reset RIN template 2.1. Following the release of the draft decision, Ausgrid provided an updated response to the RIN template, indicating that $2,707 million of its proposal was primarily driven by repex.
134 Ausgrid, Revised Regulatory Proposal and Preliminary Submission, 20 February 2015, p. 104.
52 Attachment 6 – Capital expenditure | Ausgrid Final decision 2015–19

Ausgrid's revised proposal also incorporates predictive modelling to determine some of its proposed repex.135 However, it has excluded a greater amount of repex from the model than we consider appropriate.
For the remaining categories of expenditure, we do not use our predictive modelling but rely instead on the analysis of historical expenditure for those categories as supported by the findings of EMCa's technical review.
We note that the other three assessment techniques were considered, but were not ultimately used to reject Ausgrid's forecast of repex or develop our alternative estimate, though our findings from those other assessment techniques are consistent with our overall conclusion.
Trend analysis
We recognise the limitations of expenditure trends, especially in circumstances where replacement needs may change over time (e.g. a distributor may have a lumpy asset age profile or legislative obligations may change over time). In recognising these limitations, we have used this analysis to draw general observations in relation to repex, but we have not used it to reject Ausgrid's forecast of repex or develop our alternative estimate.
Predictive modelling
The repex model can predict the reasonable amount of repex Ausgrid would require if it maintains its current risk profile for condition-based replacement into the next regulatory period. Using what we refer to as calibrated replacement lives in the repex model gives an estimate that reflects Ausgrid's 'business as usual' asset replacement practices. We explain the calibrated replacement life scenario, along with other input scenarios, further at section B.4.3.
Ausgrid stated that the outcome of our predictive modelling is, 'the dominant quantitative input,'136 to our alternative estimate against which we have assessed Ausgrid's proposed repex. We agree with Ausgrid that we use predictive modelling to estimate a quantum of business as usual repex for the modelled categories to assist in our assessment. However, predictive modelling is not the only assessment technique we have relied on in assessing Ausgrid's proposal. Our other techniques, which are mostly qualitative in nature, allow us to form a view on whether or not business as usual expenditure appropriately reflects the capex criteria.
Any material difference from the calibrated (business as usual) estimate could be explained by evidence of a non-age related increase in asset risk in the network (such as a change in jurisdictional safety or environmental legislation) or evidence of significant asset degradation that could not be explained by asset age. We use our qualitative techniques, particularly Energy Market Consulting Associates' (EMCa) technical review, to assess whether there is any such evidence. In this way, we
135 Ausgrid, Revised regulatory proposal, 20 February 2015, p. 104.136 Ausgrid, Revised regulatory proposal, p. 92.
53 Attachment 6 – Capital expenditure | Ausgrid Final decision 2015–19

consider that the repex model does serve as a 'first pass' test, as set out in our Expenditure Guideline.137
We recognise that our predictive modelling cannot perfectly predict Ausgrid's necessary replacement volumes and expenditure over the next regulatory period, in the same way that no prediction of future needs will be absolutely precise. However, we consider the repex model is suitable for providing a reasonable statistical estimate of replacement volumes and expenditure for certain types of assets, where we are satisfied we have the necessary data. We explain our reasons for this in Appendix F of our draft decision.138
The model has the advantage of providing both a bottom up assessment, as it is based on detailed sub-categories of assets using data provided by the service providers, and once aggregated it provides a well-founded high level assessment of that data. The model can also be calibrated using data on Ausgrid's entire stock of network assets, along with Ausgrid's actual replacement practices, to estimate the repex required to maintain its current risk profile.
We recognise that there are reasons why some assets may be better assessed outside of the model. Where we considered this was justified, we have separately assessed those assets by using techniques other than predictive modelling.
Technical review
Ausgrid's proposed repex was subject to a technical review by EMCa. EMCa assessed Ausgrid’s approach to forecasting, including whether it has had regard to robust cost-benefit analysis where appropriate. It also assessed Ausgrid's costs, work practices and risk management approach. This was to identify whether risk was systematically overestimated and, in turn, whether its approach to repex and repex forecasts were in accordance with its risk profile in the next regulatory period. EMCa provided a further report in response to Ausgrid's revised proposal. We evaluated EMCa's findings in its subsequent report in the course of our repex assessment in this final decision.
As set out above, we have relied on EMCa's reports to assess whether Ausgrid's risk profile is different in the next regulatory period, such that it requires repex above the business as usual prediction of our repex model. We have also relied on it, in combination with an analysis of historic repex, to inform our assessment of repex programs to which we did not apply our predictive modelling.
Asset health indicators and comparative performance metrics
We have used a number of asset health indicators with a view to observing asset health. Asset utilisation is one such indicator. We have relied on changes in asset utilisation to provide an indication as to whether Ausgrid's assets are likely to deteriorate more or less than would be expected given the age of its assets. Utilisation
137 AER, Expenditure Forecast Assessment Guideline for Electricity Distribution, November 2013, p. 11138 AER, Draft decision, Ausgrid distribution determination, Attachment 6: Capital expenditure, Appendix F, November
2014.
54 Attachment 6 – Capital expenditure | Ausgrid Final decision 2015–19

in particular is a useful check on the outcomes of our predictive modelling in that unlike the other indicators, and the predictive modelling itself, it is not age based.
The remaining indicators we have used are aged based. We acknowledge that these are less useful for providing a check on the outcomes of our predictive modelling because the model also assumes age is a reasonable proxy for asset condition. While providing some context for our decision, we have not relied on these age-based indicators to any extent to inform our alternative estimate. We do note that Ausgrid has also used age based indicators in its revised proposal. Ausgrid's use is consistent with a general acceptance that the age of assets is a reasonable proxy for asset condition. This assumption accords with our use of our predictive modelling.
Another factor we have had regard to in our draft decision in assessing Ausgrid's repex allowance was its performance on relevant performance metrics. Similar to trend analysis our use of these high level benchmarks has been to inform the relative efficiency of Ausgrid's previous repex. However, we have not used this analysis in rejecting Ausgrid's proposal and in developing our alternative estimate.
B.4.4 AER repex findings
Trends analysis
We have conducted a trend analysis of repex. The NER requires that we consider the actual and expected capital expenditure during any preceding regulatory control period.139
Our use of trend analysis is to gauge the degree to which the proposed repex is consistent with past expenditure. We recognise limits of expenditure trends, especially in circumstances where replacement needs may change over time (e.g. a service provider may have a lumpy asset age profile or legislative obligations may change over time).
Ausgrid provided historical repex trends of repex in its revised proposal that differed from the trends used in our draft decision. Figure 6-7 reproduces Ausgrid's long term historical repex trends and the 2014-19 period forecasts. This incorporates the revised trend historical trends provided by Ausgrid.
Ausgrid highlighted in its revised proposal that sourcing historical data prior to 2009-14 period is difficult given the varied definitions of replacement capex Ausgrid has used for reporting.140 We acknowledge there may be data consistency issues prior to the
139 NER, cl 6.5.7(e)(5).140 Ausgrid considered we mischaracterised the profile of its historic trend in repex in our draft decision. Ausgrid's
revised proposal includes a chart superimposing what it considers is the correct trend over that included in our draft decision (Ausgrid's Revised Regulatory Proposal and Preliminary Submission p.94). We note the corrected trend in Ausgrid's revised proposal plots Ausgrid's initial repex forecast on a basis which was not available to us at the time of the draft decision. Also Ausgrid's corrected trend represents direct costs only for the 2009-14 and 2014-19 regulatory periods. We have included overheads on a proportional basis and at a rate consistent with our decision to improve comparability with the regulatory accounts data that is inclusive of overheads). Further we note
55 Attachment 6 – Capital expenditure | Ausgrid Final decision 2015–19

2009-14 period. However, we are satisfied that the initial years in Figure 6-7 indicate that recent actual and expected repex is materially above that incurred by Ausgrid in the early 2000s.
Figure 6-7 Trends in Ausgrid's repex including overheads (real $ million June 2014)
200
400
600
800
1 000
1 200
2001
/02
2002
/03
2003
/04
2004
/05
2005
/06
2006
/07
2007
/08
2008
/09
2009
/10
2010
/11
2011
/12
2012
/13
2013
/14
2014
/15
2015
/16
2016
/17
2017
/18
2018
/19
Repex including overheads ($ million, real June 2014)
AER allowance including overheads Ausgrid Revised Proposal including allowance for overheadsSupplementary RIN following draft decision RIN proposal at time of draft decisionRegulatory Accounts
Sustainable level of annual repex 1
Long term average repex 2
Source: AER analysis.
For illustrative purposes we have included the AER allowance and two horizontal lines showing the long term average actual repex across this time series and Ausgrid's proxy of long term sustainable repex as discussed in its revised proposal.141
Ausgrid in its revised proposal was critical of our use of historic trends to indicate the efficient level of replacement expenditure noting that it is fundamentally flawed and could be described only as ‘very generally indicative’ at best.142 This view was supported by its consultant Jacobs. Jacobs fundamentally disagrees with the AER’s premise that the future requirement for sustainable long term replacement expenditure for a distributor can be predicted by looking at recent past expenditure.143
However, we note that Ausgrid appears to support the use of trend analysis, submitting that:
The appropriate use of such high level indicators should be to identify where deeper analysis is required to understand the situation. In this case, an understanding of the circumstances provides an insight into the investment conditions faced by Ausgrid over the past 15 and future 5 years.144
Ausgrid's corrected trend applies a uniform historical CPI deflator of 2.50 per cent per annum whereas our deflators are derived from actual CPI figures published by the ABS (Series Cat no 6401.0).
141 Ausgrid, Revised regulatory proposal, p. 93.142 Ausgrid, Revised regulatory proposal, p. 94.143 Ausgrid, Revised regulatory proposal, Attachment 5.08, Jacobs Review of AER Draft Decision - Repex. p. I.144 Ausgrid, Revised Regulatory Proposal, p. 94.
56 Attachment 6 – Capital expenditure | Ausgrid Final decision 2015–19

As discussed above we have clarified the extent to which we have relied on trend analysis. We agree with Ausgrid that trend analysis can be informative as it does provide insights regarding the scale of its proposed repex against previous repex. In particular, this analysis indicates that while Ausgrid's proposed expenditure is lower than in the previous regulatory control period, this expenditure is high relative to the long term trend. Further, Ausgrid submitted in its revised proposal that its forecast represents a return to a steady state or sustainable level of repex.145 We note, however, that Ausgrid's proposal is seeking expenditure above what it considers to be a steady state level.
Ausgrid's revised proposal noted difficulties in applying trend analysis to assess the efficient level of repex particularly "where the original asset base has been established in a "lumpy" fashion, for example due to the boom periods of the 1960s and 1970s, which is the case for Ausgrid."146
We recognise that trend analysis may not take into account any 'lumpiness' in asset age profiles. This is one of the reasons why we have given limited weight to trend analysis. We have taken account of this lumpiness of Ausgrid's asset age profile through the use of predictive modelling.
Ausgrid's also submitted that several factors influenced its pattern of repex investment for the 2009-14 period, notably:147
early in the 2009-14 period delivering on large scale increases in repex created deliverability issues with the rapid scaling up of replacement works;
expenditure in the later years was below initial expectations as a result of several top down reviews of the need and timing of replacement projects, both within Ausgrid and under the Networks NSW framework;
higher than anticipated brownfield replacement costs distorted some project costs/benefits leading to efficient deferral; and
Ausgrid is responding to incentives inherent in the regulatory framework.
We are not satisfied the above factors regarding Ausgrid's repex profile are necessarily applicable to the 2014-19 period such that they would support the proposed expenditure profile or fully explain the previous profile. In particular:
as Ausgrid underspent its overall capex allowance in the 2014-19 period, the 'V' shaped expenditure profile between regulatory periods in Figure 6-8 suggests that network efficiencies identified by the Networks NSW reform process have either not been sustainable or may not be full reflected in Ausgrid's forecast;
the 2014-19 period forecast does not represent the large scale increase in repex that occurred in the initial years of the 2009-14 period;
145 Ausgrid, Revised Regulatory Proposal, p. 93.146 Ausgrid, Revised Regulatory Proposal, p. 94; Ausgrid, Revised regulatory proposal, Attachment 5.08 Jacobs
Review of AER Draft Decision - Repex, p. I.147 Ausgrid Revised Regulatory Proposal and Preliminary Submission, pp. 93–94.
57 Attachment 6 – Capital expenditure | Ausgrid Final decision 2015–19

Ausgrid's cost estimation techniques embedded in the 2014-19 forecast would be expected to incorporate lessons learned from the deferral of brownfield replacement projects in the 2009-14 period;
Ausgrid's view that it sought efficiencies towards the end of the 2009-14 regulatory period is counter intuitive given incentive for efficient capex declined through the 2009-14 period (without a capital expenditure sharing scheme (CESS)). The introduction of the CESS for the 2014-19 period was in part motivated by the need to strengthen and provide for continuous incentives for expenditure efficiencies over time.148
Figure 6-8 Actual and expected repex ($ million real June 2014)
0
200
400
600
800
2009/10 2010/11 2011/12 2012/13 2013/14 2014/15 2015/16 2016/17 2017/18 2018/19
Repex($m real June 2014)
Source: AER analysis.
Our observations from the trend analysis support the need for a more detailed review using our other assessment techniques to inform our view of the efficient and prudent amount of total proposed repex.
Predictive modelling
We use predictive modelling to estimate how much repex Ausgrid is expected to need in future, given how old its current assets are, and based on when it is likely to replace the assets. In this final decision, as in our draft decision, we have arrived at a modelling outcome based on calibrated replacement lives as the basis for our repex estimate. When combined with forecast unit costs based on Ausgrid's data, this results in an estimate that reflects Ausgrid's existing approach to managing risk. This modelling outcome gave an estimate of $1,296 million for the six modelled asset categories. We have decided to apply this estimate only after considering the findings from our other techniques.
148 AER, Explanatory Statement Capital Expenditure Incentive Guideline, p. 10.
58 Attachment 6 – Capital expenditure | Ausgrid Final decision 2015–19

As discussed below, we are also of the view that part of Ausgrid's "other" asset category for land and support systems should be considered as part of this estimate. Once this expenditure is included, our estimate of repex for the six modelled asset groups is $1,378 million.
The 'business as usual' repex estimate from our predictive modelling is based on:
Ausgrid's current risk profile as evidenced by its own replacement practices. Our estimate trends forward Ausgrid's current approach to asset risk management, weighted by the actual age of its assets.
Ausgrid's own forecast unit costs for the next regulatory period. These reflect the unit costs Ausgrid expects to incur over the next five year period based on information it provided under the RIN and which it recently updated.
This estimate uses Ausgrid's own forecast unit costs, but it effectively 'calibrates' the proposed forecast replacement volumes to reflect a volume of replacement that is consistent with Ausgrid's recent observed replacement practices.
In the draft decision, we considered a reasonable range of model outcomes before deciding on an alternative repex forecast. Both ends of this range were based on the use of calibrated lives. However, we used Ausgrid's forecast unit costs and the average benchmarked unit cost from all service providers in the NEM to provide a range of outcomes.149
In our draft decision, we ultimately decided that the service provider’s own data provided the best estimation of unit cost, and applied Ausgrid's forecast costs rather than the industry benchmark. We are of the same view in the final decision.
In its revised proposal, to the extent that Ausgrid accepts our predictive modelling outcomes, it has done so because it accepts that for some outcomes the conditions and data are appropriate and the model can provide, 'a useful insight into the appropriateness of an expenditure forecast.'150 In Ausgrid's view the model is suitable for, 'validating expenditure in categories of replacement expenditure that are characterised by large numbers of individual replacements, involve project durations shorter than 12 months and have sufficient data to be statistically valid.'151 Accordingly, in its revised proposal Ausgrid adopted the repex modelling for $914.4 million of its proposed repex (excluding overheads).152 Ausgrid adopted the AER's approach, and used calibrated replacement lives in its repex modelling.153
Beyond this, Ausgrid sought to exclude additional categories from assessment under the repex model. Ausgrid considers the model is not well suited to dealing with any class of expenditure that is not fundamentally related to asset age, with non-homogenous asset categories, and with large projects that commonly span multiple
149 AER, Draft decision, Ausgrid distribution determination, Attachment 6, November 2014, pp. 6–72.150 Ausgrid, Revised regulatory proposal, p. 103. 151 Ausgrid, Revised regulatory proposal, p. 103. 152 Ausgrid, Revised regulatory proposal, p. 105. 153 Ausgrid, Revised regulatory proposal, p. 105.
59 Attachment 6 – Capital expenditure | Ausgrid Final decision 2015–19

years. Ausgrid also considers it was unable to ensure all of the data inputs were fit for purpose.154
For the reasons we outline below, we do not agree with Ausgrid's position including its proposal to exclude additional categories and sub-categories of assets from the model. Consequently, our final decision maintains our position from the draft decision.
Model inputs
The repex model uses the following inputs:
The asset age profile input is the number of assets in commission and when each one was installed.
The replacement life input is a mean replacement life and standard deviation (i.e. on average, how old assets are when they are replaced).
The unit cost input is the unit cost of replacement (i.e. on average, how much each asset costs to replace).
In the draft decision, we described using the repex model to create three modelling scenarios. In each of the three modelling scenarios (base case scenario, calibrated scenario and benchmark scenario) we combined different data for the final two inputs.
Under all scenarios, the first input is Ausgrid's asset age profile (how old Ausgrid's existing assets are). This is a fixed input in all three scenarios.
The second and third inputs can be varied by using different input assumptions about:
how long we expect an asset to last before it needs replacing; and
how much it costs to replace it.
The repex model takes the replacement life input for each asset category and applies it to the actual age of the assets in each asset category. In doing this it calculates how many assets are likely to need replacement in the near future.155 The model then applies a unit cost input to calculate how much expenditure is needed for that amount of replacement in each asset category. This is aggregated to a total repex forecast for each of the next 20 years.
Table B-2 outlines the replacement lives and unit cost inputs we tested in the repex model. As part of our assessment, we compared the outcomes of using Ausgrid's estimated replacement lives and its unit costs, both forecast and historical, with the replacement lives and unit costs achieved by other NEM distributors. We also used the repex model to calculate calibrated replacement lives that are based on Ausgrid's past five years of actual replacement data. These reflect Ausgrid's recent past approach to replacement.156
154 Ausgrid, Revised regulatory proposal, p. 102. 155 The repex model predicts replacement volumes for the next 20 years.156 For discussion on how we prepared each of the inputs see: AER, Draft decision, Ausgrid distribution determination
2015-16 to 2018-19, Attachment 6: Capital expenditure, Appendix F, November 2014.
60 Attachment 6 – Capital expenditure | Ausgrid Final decision 2015–19

We calculated historic unit costs by dividing historic expenditure by historic volumes. We calculate forecast unit costs by dividing forecast expenditure by forecast volumes. Forecast unit costs were significantly lower than historical unit costs.
Detail on how we prepared the model inputs is at appendix F in our draft decision.157
Table B-2 Repex model inputs
Input AER comments in draft decision
Mean replacement lives
Ausgrid estimated replacement lives
When used in the repex model, Ausgrid's estimated replacement lives produced forecast repex estimates several times higher compared to when we used any other replacement lives, and several times higher than Ausgrid's own repex forecast.
The model also forecast a sharp 'step-up/trend down' forecast expenditure profile. That is, it predicted there was a significant amount of repex required in the first year of the forecast period. This indicates the replacement lives used by Ausgrid are likely to be too short and do not represent its actual replacement behaviour as they predict a large unrealistic 'backlog' of replacement of assets that were far older than would be expected if the replacement lives were accurate.
Calibrated replacement lives based on Ausgrid data
As set out above, we considered Ausgrid's estimated replacement lives were not appropriate. By contrast, calibrated replacement lives reflect Ausgrid's actual approach to replacement in the most recent five years. We discuss these calibrated replacement lives in detail below.
Benchmark estimated replacement lives
We developed a series of benchmark replacement lives using the data collected from all NEM distributors in the category analysis RINs. For model inputs we used the average, third quartile (above average), and longest replacement lives of all NEM distributors for each category.
As with Ausgrid's estimated replacement lives, we found using these benchmark replacement lives produced sharp 'step-up/trend down' forecast expenditure, indicating the replacement lives used are likely to be too short for modelling purposes as they predict a large unrealistic 'backlog' of replacement. When used in the model these also produced outcomes higher than Ausgrid's own forecasts.
Benchmark calibrated replacement lives
We developed benchmark calibrated lives by first using the repex model to calculate calibrated lives based on the replacement data from all NEM distributors. For model inputs we again used the average, third quartile (above average), and longest of the calibrated lives of all NEM distributors for each category.
When applied to the model for Ausgrid, these lives produced outcomes lower than when we used the calibrated lives based on Ausgrid's data. The calibrated benchmark replacement lives will reflect to some extent the particular circumstances of a distributor and this may not be applicable to the business under review. At most, this input allowed us to check that Ausgrid's calibrated lives were reasonable against its peer service providers in the NEM.
Unit cost of replacement
Ausgrid unit costs (historic)
Unit costs achieved in the most recent five years
When used in the repex model, Ausgrid's historic unit costs as submitted under its RIN gave forecast outcomes several times higher than when we used any other unit cost, and several times higher than Ausgrid's own repex forecast. This indicates historic unit costs are not likely to reflect a realistic expectation of future input costs.
Industry Benchmark unit costs
We developed industry benchmark unit costs using the data collected from all NEM distributors in the category analysis RINs. For model inputs we used the average, first quartile (below average), and lowest unit costs of all NEM distributors for each asset
157 AER, Draft decision, Ausgrid distribution determination 2015-16 to 2018-19, Attachment 6: Capital expenditure, Appendix F, November 2014.
61 Attachment 6 – Capital expenditure | Ausgrid Final decision 2015–19

category.
Applying the average benchmark unit costs in the repex model for Ausgrid gave an outcome that was slightly lower compared to when we used Ausgrid's forecast unit costs. The outcomes when using the first quartile and lowest unit cost benchmark numbers were significantly lower. We considered the benchmark average unit cost was a useful comparison with the cost of other distributors in the NEM.
Ausgrid unit costs (forecast)
Unit costs Ausgrid forecasts for the next five years
As outlined above we considered it was not appropriate to use Ausgrid's historic unit costs. We compared industry benchmark unit costs to Ausgrid's forecast unit costs and observed that Ausgrid's forecast unit costs did not result in significantly higher forecasts. As a result we accepted the use of Ausgrid's own forecast unit costs rather than industry benchmarks.
Source: AER analysis.
Calibrated replacement lives input
The calibrated replacement lives use Ausgrid's recent asset replacement practices to estimate a replacement life for each asset type. These replacement lives are calculated by using Ausgrid's past five years of replacement volumes, and its current asset age profile (which reveals how many, and how old, Ausgrid's assets are), to find the age at which, on average, Ausgrid replaces its assets. The calibrated replacement life represents this age. We explain the process of calculating calibrated lives in our repex model handbook.158
Our premise is that these calibrated replacement lives necessarily form the basis of a business as usual forecast for repex because they are derived from the service provider's actual replacement practice observed over the past five years.
The service provider decides to replace each asset at a certain time by taking into account the age and condition of its assets, its operating environment, and its regulatory obligations. If the service provider is currently meeting its network reliability, quality and safety requirements by replacing assets when they reach a certain age, then by adopting the same approach to replacement in future they are likely to continue to meet their obligations.
However, if underlying circumstances are different in the next regulatory control period, then the business as usual approach to replacement age may no longer allow a distributor to meet its obligations. We consider a change in underlying circumstances is constituted by a genuine change in the underlying risk of operating an asset, genuine evidence that there has been a change in the expected non-age related condition of assets from the last regulatory control period, or a change in regulatory obligations (e.g. obligations governing safety and reliability).
If we are satisfied that there is evidence of a change in a service provider's underlying circumstances, we will accept that future asset replacement should not be based on a business as usual approach. This means that where there is evidence that a service provider's risk profile has changed then it may be necessary to provide a forecast of repex that exceeds the business as usual estimate. This higher forecast would be required in order to satisfy us that the amount reasonably reflects the capex criteria.
158 AER, Replacement expenditure model handbook, November 2013, p. 20.
62 Attachment 6 – Capital expenditure | Ausgrid Final decision 2015–19

Ausgrid considered one of the key weaknesses of the model is its assumption under the calibrated lives scenario that past replacement volumes and expenditures are the best indicator of future efficient needs, and "back-solves" an asset life that fits that construct.159 It submitted a report by Jacobs to support its position. Jacobs considered the repex modelling and calibration process were fundamentally flawed in logic.
We reviewed the submissions of Ausgrid and Jacobs and maintain our reasoning from the draft decision. Our predictive modelling approach is well established having been used by us in previous distribution determinations and by other regulators.160 It has been refined following extensive consultation as part of the Better Regulation program. It was clear from our engagement with stakeholders in that process that calibration is understood to be an integral part of good practice in repex modelling for the very reason that it utilises updated data provided by the business being regulated. It is not an arbitrary process or one which involves manipulation of inputs to arrive at a pre-determined outcome. It is a systematic process, with a transparent purpose.
Jacobs also submitted that future replacement needs cannot be predicted by looking at recent past expenditure. However, we consider that Jacob's understanding in this respect fundamentally misconstrues the workings of the model. We reiterate that using calibrated replacement lives in the repex model is not trending forward past expenditure or volumes. It is trending forward Ausgrid's approach to replacement given its current stock of assets in commission and asset age profile. It is akin to maintaining a business as usual approach. We further assess whether there is evidence that the service provider requires a different forecast to meet the capex criteria through our application of other assessment techniques.
Jacobs submitted that we failed to recognise other factors such as the investment cycle of each asset class, one-off major projects or changing asset characteristics. We disagree for two key reasons. The use of calibrated replacement lives captures Ausgrid's recent replacement practices and the age of all its assets in commission. This is expected to reflect all relevant factors Ausgrid considers when replacing its assets. Further, and as discussed in our draft decision, we do recognise that some assets should not be modelled for a variety of reasons.161 We discuss our approach to un-modelled assets below.
Jacobs is of the view that we did not substantiate why Ausgrid's base case replacement lives (that is, the replacement lives proposed by Ausgrid) were inappropriate, or why the calibrated lives were most suitable. As discussed in our draft decision, we considered the asset lives Ausgrid submitted were inappropriate as they produced an outcome under the base case scenario modelling that was significantly higher than when we used other input lives (calibrated and benchmark), and even higher than Ausgrid's own forecasts. They also produced a replacement profile heavily weighted towards the first year of the regulatory control period. Such an outcome is not
159 Ausgrid, Revised regulatory proposal, p 102. 160 OFGEM, Strategy decisions for the RIIO-ED1 electricity distribution price control - Tools for cost assessment,
March 2013, p. 44; AER, Final decision: Victorian electricity distribution network service providers: Distribution determination 2011–2015, October 2010; AER, Final decision: Aurora Energy distribution determination, April 2012.
161 AER, Draft decision, Ausgrid distribution determination, Attachment 6, Appendix F, November 2014, pp. 6–135.
63 Attachment 6 – Capital expenditure | Ausgrid Final decision 2015–19

consistent with Ausgrid's recent approach to asset replacement. If the base case replacement lives were accurate then based on the modelling outcome we would have to accept that Ausgrid has maintained many assets on its network far longer than their average replacement life would suggest as reasonable. We do not consider that this can be accepted given the evidence of Ausgrid's recent replacement practices. The base case data is problematic because it leads to such an anomalous outcome. By contrast, the calibrated lives are the only replacement lives based on Ausgrid's recent observed practices.
Jacobs proposed its own replacement lives and unit costs which it considered reflected typical Australian industry practice. We tested these inputs in the repex model. These inputs produced outcomes significantly higher than Ausgrid's own forecast. This leads us to question the suitability of the replacement lives proposed by Jacobs to estimate Ausgrid's future repex needs. As with our conclusions about the replacement lives proposed by Ausgrid, we are not satisfied that this data would result in capex that reasonably reflects the capex criteria.
Ausgrid's view on calibration life
Ausgrid has criticised the appropriateness of the calibration process in estimating average replacement lives.162 Ausgrid pointed to a particular asset class as evidence that the calibration process is flawed. This was 11kV Fuse, which had a modelled replacement life of 134 years.163 However, we note Ausgrid has not identified any repex for this asset over the last five years, nor has it proposed any for the next five years. The oldest reported asset of this type in Ausgrid’s network is 90 years old. That no replacement of these assets has taken place over the last five years and no replacement is proposed for the next five years indicates that these assets have a long replacement life.
Nonetheless, in these circumstances, where there is no data for a particular asset category or sub-category on which to calibrate the predictive model, we considered it reasonable to include an economic life based on an industry benchmark. This approach was used for other assets in our draft decision, as outlined in the data collection and refinement section of our draft decision (section F.3). In our updated final decision modelling, we have applied this to all sub categories that lacked historical replacement volumes.
The findings for a single subcategory (e.g. 11kV fuse), particularly one where Ausgrid reported no proposed expenditure, does not invalidate the economic life calibration process. Where replacement expenditure is available, the calibration process is used in conjunction with actual data on the age of Ausgrid's network to estimate an appropriate life. While there are some outliers from this process, we found the overall replacement cost weighted average economic life of Ausgrid’s network was
162 Ausnet Services and Energy Networks Association expressed similar concerns to Ausgrid; Ausnet Services, Draft Decisions NSW/ACT Electricity Distribution Determination 2015-19, 12 February 2015, p. 4; Energy Networks Association, AER Draft decision for NSW and ACT electricity distributors, ENA response, 13 February 2015, p. 12.
163 Ausgrid, Revised regulatory proposal, p 103.
64 Attachment 6 – Capital expenditure | Ausgrid Final decision 2015–19

approximately 62 years. This figure is very close to the 60 year asset life assumption used by Ausgrid to derive a “sustainable cost” in its revised proposal.164
Finally, Ausgrid has acknowledged that age is a good proxy for asset condition.165 This supports our use of calibrated asset lives in the repex model.
Proposed model exclusions
Ausgrid submitted that a number of its assets were unsuitable for inclusion in statistical modelling. It listed five criteria in support of this:
Assets need to be homogenous
Population size and historical data
Asset size
Replacement activity primarily driven by deterioration in condition over time; and
Asset replacement plans relate to the key asset measure.
We address each of these below. It follows that, given our conclusions below, we do not agree with Ausgrid that the assets that it seeks to exclude from predictive modelling (underground cables, zone substation, switchgear and duty of care (compliance related) expenditure) should not be excluded from our predictive modelling. Before we address the five dot points above, we have made some observations about our modelling.
In general we consider that the exclusion of asset subcategories from the model lessens its usefulness as an overall assessment tool. For this reason, we consider any proposed exclusions of asset subcategories should be subject to a high degree of scrutiny. This is also the reason why we conducted a detailed consultation process on the model inputs, both before and after the commencement of this review of Ausgrid's revenue requirements.
As noted in the draft decision166, prior to this determination, we engaged in an extensive data collection process with industry as an outcome of the Better Regulation process. Part of this process was defining and collecting information suitable for use in predictive modelling. The full process is set out in the data specification section below. A key consideration of this process was determining a set of asset subcategories that were granular enough to be compared across different service providers. The process involved extensive consultation with service providers and other stakeholders, and the outcome was the sub category list included in templates 2.2 and 5.2 of the reset RIN. Further information on this process is included in the relevant better regulation guidelines and explanatory documentation.167
Homogeneous assets
164 Ausgrid, Revised regulatory proposal, p 93. 165 Ausgrid, Revised regulatory proposal, Attachment 5.11, p. 1.166 AER, Draft decision, Ausgrid distribution determination, Attachment 6, Appendix F, November 2014, p. 6-131.167 AER, Expenditure Forecast Assessment Guideline for Electricity Distribution, November 2013.
65 Attachment 6 – Capital expenditure | Ausgrid Final decision 2015–19

Ausgrid contended that assets need to be relatively similar to allow their populations to be modelled statistically. The issue is how close to homogeneous the assets must be. We recognise that assets are not perfectly homogeneous. Differences in local conditions and environmental factors will influence the type of asset being installed, and the type of labour and equipment required for installation.
By specifying asset subcategories at a detailed and granular level, we have ensured that each asset population contains assets that are close to each other in function. Further, when aggregated across the asset population, individual differences between asset units will tend to become less important.
In addition, we derived unit costs from Ausgrid's own forecasts, so any prediction of lower asset volumes will result in a proportional, pro rata reduction in the forecast expenditure on that asset from the repex model. That is, our approach to estimating repex maintains the predicted cost mix, while adjusting for differences in volume.
We consider the detailed and granular asset subcategories modelled contain sufficiently comparable units to allow for meaningful statistical analysis of the population. Our data collecting process supports this. At the time of the Better Regulation review, we worked with Ausgrid and other distributors to provide several opportunities for developing the asset subcategories. Following Ausgrid lodging its initial proposal and its RIN data we worked with Ausgrid to understand its data and how to best allocate it to the asset subcategories where appropriate.
Population size and historical data
Population size is considered in the repex handbook.168 The repex model uses the entire asset population, in the form of the asset age profile, to derive its estimate. The degree of confidence from a statistical function is related to population size, with higher populations leading to greater degrees of confidence. Ausgrid has some asset classes with small populations (smaller than 100 units). However, the asset subcategories with relatively small populations do not make up a significant part of Ausgrid's repex program. Indeed, Ausgrid either forecast no repex for these assets in the next regulatory period or a very small amount. Further, for those assets where Ausgrid forecast repex, the predictive model outputs largely matched Ausgrid's forecast, and, in aggregate, gave a slightly higher estimate. For these reasons we do not consider it necessary to exclude any assets because of the size of their population.
Asset size
Ausgrid also submitted that large projects should be excluded because there is a mismatch between installation data and the incurrence of cost. It also notes that using five years of historical data is not sufficient for these large categories.
The asset size does not impact on the statistical process. The model in its simplest form is indifferent to asset size and value. So long as a sufficient population of the
168 AER, Replacement expenditure model handbook, November 2013, p. 10.
66 Attachment 6 – Capital expenditure | Ausgrid Final decision 2015–19
asset subcategory exists, predictive modelling can be employed to estimate business as usual replacement volumes. Unit costs simply weight the volume outputs from the model. In this case, the unit costs adopted are based on Ausgrid's own forecasts, such that any volume reduction predicted by the model will have a pro-rata impact on the forecast of asset replacement.
Replacement activity driven primarily by deterioration of condition over time
Ausgrid submitted that only assets that are replaced on a "wear-out" basis are suitable for inclusion in the repex model. We do not agree. The calibrated model is based on the replacement age of assets, calibrated by the recent replacement practices of the service provider. If an asset was removed before it had reached the end of its economic life, that is, before it had "worn out", the calibration process would take that into account when determining the replacement age. Consequently, if a proactive replacement program has been used in the past, the model will derive replacement lives based on this proactive approach, and not on the "wear out date" of the assets.
As noted elsewhere, the repex model is used to find a business as usual estimate of repex. In doing so, it trends forward current proactive and reactive approaches to asset replacement. We separately assess whether Ausgrid has justified the need for a departure from this estimate on the basis of an increase in risk or major asset deterioration that is not related to age. It is also worth noting that Ausgrid has stated that: 169
Ausgrid’s failure data has revealed that there is a good correlation between asset age and condition for 11kV switchgear, switchboards and subtransmisison cables.
This supports our view that age is a good proxy for asset condition for the assets Ausgrid has excluded from its own repex modelling.
Asset replacement plans relate to the key asset measure
Ausgrid submitted that some of its replacement programs that relate to drivers such as safety do not necessarily correspond to the drivers of repex used in the repex model. It uses the example of a safety driven replacement of a water crossing for overhead conductor having little in common with the historical volume of overhead conductor replacement.
When using the repex model, we are not assessing individual replacement plans. We are estimating a business as usual forecast of repex based on Ausgrid's current approach to asset risk, including safety considerations. Ausgrid's current approach to mitigating safety risks through its repex program are captured in the calibration process. Our technical review of repex supports the view that Ausgrid tends to overstate its risks, leading to it also tending to overstate its future repex needs.
Technical review
169 Ausgrid, Revised regulatory proposal, Attachment 5.11, p. 1.
67 Attachment 6 – Capital expenditure | Ausgrid Final decision 2015–19

Our draft decision set out our approach to engaging EMCa to undertake a technical review to test Ausgrid's repex forecast against the capex criteria. We engaged EMCa to test whether Ausgrid's:
repex forecast is reasonable and unbiased
costs and work practices are prudent and efficient; and
risk management is prudent and efficient.
Broadly, on these aspects EMCa found in its October 2014 report that:170
Several systemic issues meant that Ausgrid's repex needs were overstated and its repex forecast was likely to have overestimation bias.
Ausgrid's asset management decisions are characterised by a lack of robust options being considered, or cost-benefit analysis supporting the timing and volume of replacement activity. Ausgrid's repex program is also likely to have material deliverability risk.
Ausgrid's approach to risk is overly conservative.
We engaged EMCa to consider whether Ausgrid's revised proposed forecast repex reflected an efficient and prudent expenditure forecast. EMCa reviewed new information Ausgrid provided with its revised proposal in response to EMCa's October 2014 report.
EMCa was of the view that Ausgrid has substantively addressed the systemic issues EMCa identified in its October 2014 report, as evidenced by its lower forecast repex. However, EMCa found that Ausgrid has retained a residual bias towards conservative risk assessment and cost over-estimation. EMCa considered that Ausgrid's revised repex forecast:171
has mitigated concerns regarding its application of contingency allowances and is in most cases based on reasonable estimates of efficient costs
reflects a more effective top down approach incorporating enhanced qualitative risk assessment
is supported by a comprehensive delivery strategy and resourcing plan.
However, EMCa considered there was further scope for Ausgrid to make expenditure reductions to achieve a prudent and efficient level of expenditure. EMCa was of the view that the following contributed to residual over-estimation bias:172
There is evidence of conservative risk bias in Ausgrid's underground cable replacement and switchgear programs. There was limited application of enhanced risk quantification to other expenditure programs, and there appears to be further potential to defer expenditure.
170 EMCa, Review of Proposed Replacement Capex in Ausgrid's Regulatory Proposal 2014 - 2019, October 2014, pp, i–iii.
171 EMCa, Review of Proposed Replacement Capital Expenditure in Ausgrid's Revised Regulatory Proposal, April 2015, p. ii.
172 EMCa, Review of Proposed Replacement Capital Expenditure in Ausgrid's Revised Regulatory Proposal, April 2015, p. ii, 6–11.
68 Attachment 6 – Capital expenditure | Ausgrid Final decision 2015–19

Ausgrid's pole replacement program remains inadequately justified in its activity forecast and costs. Ausgrid did not provide any new information clarifying the basis of its costs, or rationale for the lower repex forecast for the program, that addressed EMCa's initial concerns.
EMCa also responded to Ausgrid's criticism of its approach. EMCa is of the view that Ausgrid's reduced repex forecast in its revised proposal demonstrated the validity of EMCa's initial finding that Ausgrid's original forecast did not comply with the expenditure criteria in the NER.173 EMCa considered its assessment was consistent with the Better Regulation guidelines as it conducted a top down assessment of Ausgrid's governance management and forecasting methodologies. EMCa considers it would likely have reached similar conclusions if it conducted a detailed bottom up review as Ausgrid's reduced repex forecast evidenced that the issues EMCa identified were real, systemic and material.174
We consider EMCa's revised findings support the outcomes of our overall assessment which is that a lower amount of repex than Ausgrid's revised proposed amount is more likely to contribute to a prudent and efficient amount of total forecast capex for the 2014–19 period.
Un-modelled repex
As with the draft decision, repex categorised as: supervisory control and data acquisition (SCADA), network control and protection (collectively referred to hereafter as SCADA); Pole top structures; and "Other" in Ausgrid's RIN response was not included in the repex model. As noted in Appendix F of the draft decision, we did not consider these asset groups were suitable for inclusion in the model, either because of lack of commonality, or because we did not possess sufficient data to include them in the model.175 Together, these categories of repex account for $344 million of Ausgrid's proposed repex.176
Because we are not in a position directly to use predictive modelling for these asset categories, we have placed more weight on an analysis of historical repex and EMCa's findings in relation to these categories. Our analysis of these is included below.
SCADA, network control and protection
173 EMCa, Review of Proposed Replacement Capital Expenditure in Ausgrid's Revised Regulatory Proposal, April 2015, p. ii.
174 EMCa, Review of Proposed Replacement Capital Expenditure in Ausgrid's Revised Regulatory Proposal, April 2015, p. 17.
175 AER, Draft decision, Ausgrid distribution determination, Attachment 6, Appendix F, November 2014, p. 6-135.176 Ausgrid provided updated information on 11 December 2014 that included the direct cost associated with its
repex, including SCADA. Ausgrid had earlier submitted an updated reset RIN on 12 September 2014, where it moved categories of capex previously not included in one of the defined asset groups into the SCADA group. The response of 11 December 2014 moved these categories back to the "other" asset group. We do not consider this is consistent with its previous responses, and have considered those categories as part of the SCADA asset group, rather than the "other" asset group; Ausgrid, email to the AER entitled "Updated expenditure data", 11 December 2014; Ausgrid, Response to AER information request AER AUSGRID 022, 12 September 2014.
69 Attachment 6 – Capital expenditure | Ausgrid Final decision 2015–19

The revised proposal includes $180 million for replacement of SCADA, network control and protection (collectively referred to as SCADA). This represents a 31 per cent increase over the 2009–14 regulatory control period, or $43 million.
Ausgrid's initial proposal included $218 million for SCADA. EMCa reviewed Ausgrid's SCADA as part of its advice on the initial proposal. EMCa considered there was inadequate condition based support for the proposed increased expenditure. EMCa considered that the forecasts put forward by Ausgrid do not provide analysis of credible replacement alternatives, and did not provide sufficient evidence that the costs incurred in undertaking the works are efficient. EMCa concluded that Ausgrid's supporting documents did not present an appropriate level of analysis and justification to support an expenditure program of above $100 million. Based on the lack of supporting information we agreed with EMCa's view that a step change in expenditure from historical levels has not been adequately justified.
In reviewing the Ausgrid's revised proposal, EMCa noted that Ausgrid had recognised that the lack of data for the secondary protection and control systems asset class implies a higher level of uncertainty and that a better informed view of consequences as “informed by our revised risk-cost assessments” had reduced the program by 50 per cent.177
EMCa noted that Ausgrid had addressed the three concerns identified in its report on the draft decision by enhancing its risk-cost assessment and adopting its preferred option, which was to reduce proposed expenditure while it collected more data to confirm future CBRM-based expenditure. However, EMCa also noted that it did not have visibility of Ausgrid’s rationale for selecting a 50 per cent program reduction.178
In reaching our view on Ausgrid's SCADA, we have taken EMCa's specific views on SCADA into account. We consider the lack of visibility on Ausgrid's reasons for including a reduced SCADA replacement program in its revised proposal casts doubt on whether an increase in repex from the 2009-14 regulatory control period is justified, particularly in light of EMCa's overall views on systemic issues with Ausgrid's forecasting approach and assessment of risk. We also note that our repex modelling results indicate that Ausgrid's business as usual repex for those six modelled asset groups is significantly lower than Ausgrid's revised proposal. While this analysis did not directly consider SCADA, it does indicate that, when considered in aggregate, for the majority of its repex programs, Ausgrid forecasts repex in excess of what would be expected given its current risk profile.
Taking all of this into account, we see no justification for the step change proposed by Ausgrid. In the absence of any persuasive reason to depart from the amount allocated to Ausgrid in the last regulatory period, we are satisfied that Ausgrid's SCADA repex from the 2009–14 period of $137 million is sufficient to meet the capex criteria.
177 EMCa, Review of Proposed Replacement Capital Expenditure in Ausgrid's Revised Regulatory Proposal, April 2015, p. 10.
178 EMCa, Review of Proposed Replacement Capital Expenditure in Ausgrid's Revised Regulatory Proposal, April 2015, p. 10.
70 Attachment 6 – Capital expenditure | Ausgrid Final decision 2015–19

Pole top structures
In the draft decision, we considered Ausgrid's forecast of $68 million of expenditure on pole top structures was likely to be reasonable. Ausgrid's revised proposal includes $30.5 million of repex for pole top structures. We consider this amount to be reasonable for the same reasons outlined in the draft decision.179
Other repex
In the draft decision, we considered Ausgrid's forecast of $138 million of repex for "other" repex was reasonable.180 The assets included in "other" in the draft decision included:
Distribution voltage regulation
Buildings
STS Reactors and Capacitors
Sub-Transmission Main OH Easement
STS Building
STS DC Systems
Zone Reactors and Capacitors.
Ausgrid has included $132 million for the above categories in the revised proposal. We consider this amount to be reasonable for the same reasons outlined in the draft decision.181
Ausgrid included two additional categories in "other" assets in its revised proposal. These are $35.6 million for "Land (i.e. strategic system property)" and $71.2 million for "Support costs (i.e. GIS data capture and switching)". We sought further information from Ausgrid on where these items originated in the initial proposal.182 Ausgrid advised us that:
For the original RIN response from September 2014 which was subsequently used in the draft decision, the costs associated with these two items were part of the balancing item in RIN table 2.1.1 (i.e. they did not form any part of the RIN).
For the revised RIN response provided in December 2014, the associated repex costs for these two items were smeared across each asset category in
179 AER, Draft decision, Ausgrid distribution determination, Attachment 6, Appendix F, November 2014, pp. 6–55.180 In the draft decision, only the $111 million for buildings was included in our forecast of capex. This was a
miscalculation, and the forecast should have included the full $138 million for "other" repex.181 AER, Draft decision, Ausgrid distribution determination, Attachment 6, Appendix F, November 2014, pp. 6–55.182 AER, Information request, Re: AER AUSGRID 051 (FOLLOW UP) : Replacement expenditure (Repex), 6 March
2015.
71 Attachment 6 – Capital expenditure | Ausgrid Final decision 2015–19

order to maintain the same repex structure to address some fundamental concerns relating to indirect costs and balancing items.183
From the response provided by Ausgrid, we are of the view that the proposed expenditure under these categories was originally included in the various forecast of asset replacements included in the repex model. Consequently, we consider it appropriate to include expenditure on these items in our consideration of business as usual repex. The calibrated outcome of our predictive model was 23 per cent lower than Ausgrid's forecast repex. We have applied the same adjustment to the land and support system assets. This has resulted in a total of $27 million for "Land" and $55 million for "Support costs". As noted above, we have added this amount to the calibrated outcome of the repex model, and considered it as part of Ausgrid's business as usual repex.
Network health indicators
In preparing a proposal, distributors must factor in the condition or health of its network assets when determining the level of capex they require to maintain the quality, reliability and security of supply.184 One issue we considered is the condition of Ausgrid's assets currently in commission.185 In assessing this, we have considered:
utilisation of the network (where spare capacity should be correlated to asset condition for some asset categories)
the age of Ausgrid's network.
Like the trend analysis, our observations from performance metrics support the need for a more detailed review using our other assessment techniques to inform our view of the efficient and prudent amount of total proposed repex.
Asset utilisation
Consistent with our draft decision, one indicator of asset health we examined was the effect changes in the utilisation level of network assets have on their need for replacement. As we discuss in our analysis of augex above, Ausgrid has significant spare capacity in its network based on past investments to meet expected demand that did not eventuate. All else being equal we expect a positive correlation between asset condition and lower network utilisation.
In our draft decision, we stated:
…with the lower expected demand and the lower value of customer reliability, the cost of in service asset failure is reduced compared to past periods. This should increase the deferral period for the efficient timing of asset replacement which should reduce replacement costs relative to the past. In addition, lower demand should provide opportunities for some assets to be replaced at a lower
183 Ausgrid, Ausgrid response to AER information request AER AUSGRID 051B, 13 March 2015.184 NER 6.5.7(3)185 AER, Ausgrid Draft Decision Attachment 6: Capital Expenditure pp. 6–55.
72 Attachment 6 – Capital expenditure | Ausgrid Final decision 2015–19

a capacity which should also reduce replacement costs compared to the past.186
In its revised proposal Ausgrid submitted there is no evidence or engineering review to suggest a correlation between asset utilisation and asset deterioration is realistic.187 Ausgrid stated:
Electricity network assets do not exhibit wear out characteristics that relate to usage levels like automobiles might. While overloading of assets can shorten the life of the asset due to thermal degradation of components, running assets at less than rated loading does not prolong their life.
We maintain our view that in some instances a correlation does exist between utilisation and conditional deterioration of an asset. This relationship is evidenced in the design standards for all distributors. However we recognise that:
The relationship between asset utilization and condition is not uniform between asset types. For example; poles and fuses.
The relationship is not necessarily linear (e.g. condition may not be materially impacted until a threshold point is reached).
The condition of the asset may be difficult to determine (e.g. overhead conductor). As such early-life asset failures may be due to utilisation or, more commonly, a combination of factors (e.g. utilisation and vibration).
Table B-3 below describes our view regarding the general relationship between an asset type's utilisation and its condition and major asset classes.
Table B-3 Utilisation and asset deterioration by asset type
Asset type Generalised observation
Poles and pole-top structures Generally not impacted by electrical utilisation.
Overhead conductors
Impacted by high levels of electrical utilisation. Low and moderate utilisation will have a minimal impact on condition, while increasing utilisation above design standards will have a compounding impact on condition. Conductors that have been historically overloaded may exhibit reduced tensile strength and increased brittleness and therefore be more prone to conductor failure.
Underground Cables
Impacted by high levels of electrical utilisation. Low and moderate utilisation will have a minimal impact on condition, while increasing utilisation above design standards will have a compounding impact on condition. Underground cables that have been historically overloaded may exhibit overheating and therefore be more prone to conductor failure through joint failure or insulation failure.
Transformers
Impacted by high levels of electrical utilisation. Low and moderate utilisation will have a minimal impact on condition, while increasing utilisation above design standards will have a compounding impact on condition. High levels of utilisation can result in failure of the insulating materials and a short-circuit.
Switchgear Impacted by electrical load and by duty cycle. All utilisation can impact condition (where utilisation is measured as both the number of operations and the load made or broken when operated). Typically operation of the unit will result in degradation of the contact surfaces. Both the duty cycle and the
186 AER, Ausgrid Draft Decision Attachment 6: Capital Expenditure pp. 6–60.187 Ausgrid, Revised Regulatory Proposal and Preliminary Submission, p. 99.
73 Attachment 6 – Capital expenditure | Ausgrid Final decision 2015–19

electrical current that is connected/interrupted will impact condition.
Non-network assets Generally not impacted by electrical utilisation.
Source: AER analysis.
We do note that high levels of utilisation can occur through many practices. Even for assets that are generally lightly loaded, emergency and switching conditions can introduce short term levels of utilisation that may impact the condition of the asset. In general, a lightly loaded network will also be less subject to overload conditions from emergency and switching conditions.
These observations are of a general nature. They support our view that there is a need for a more detailed review using our other assessment techniques to ascertain the efficient and prudent amount of total proposed repex.
Asset age
As set out in our draft decision we are satisfied asset age is a reasonable proxy for asset condition which affects the repex requirements on the network. Ausgrid in its initial proposal agrees with this proposition.188 We observed that Ausgrid's residual asset lives for most major asset categories have been increasing since 2006. This indicates in aggregate that the average age of its assets has improved over time. This suggests that Ausgrid may require less repex to maintain its network now than it has in the previous regulatory control period.
Consistent with our draft decision, Figure 6-9 plots the estimated residual service life of Ausgrid's assets across time.189 It indicates that in aggregate Ausgrid's residual asset lives have been improving since 2006. We have reproduced this chart below (Figure 6-9) along with our qualitative analysis.
188 Ausgrid, Revised Regulatory Proposal and Preliminary Submission, p. 31.189 AER, Ausgrid Draft Decision Attachment 6: Capital Expenditure, pp. 6–56.
74 Attachment 6 – Capital expenditure | Ausgrid Final decision 2015–19

Figure 6-9 Ausgrid Asset Lives – estimated residual service life
Source: Ausgrid - EBT RIN - 4. Assets (RAB) - Table 4.4.2 Asset Lives – estimated residual service life (Standard
control services).
The above shows that the overall average residual lives for most of Ausgrid's assets have been improving since 2006. This suggests that the health of Ausgrid's asset base has improved over the last eight years. This also suggests that Ausgrid may require less repex to maintain its network now than it has in the previous regulatory control period. Ausgrid did not respond to this aspect of our draft decision.
Again, we have not used this technique to reject Ausgrid's revised proposal. Instead, the results point to the need for a more detailed assessment.
Comparative performance metrics
Another technique we employed in our draft decision in assessing Ausgrid's proposed repex was its performance against specific metrics. Similar to trend analysis as discussed in section B.4.4 our use of these high level benchmarks has been to draw general observations from past performance. This analysis indicates that Ausgrid appears to compare unfavourably with other distributors and is an outlier on these metrics.190 However, we have not used this analysis in rejecting Ausgrid's proposal and developing our alternative estimate.
Ausgrid in its revised proposal indicated it has significant concerns about the benchmarking approaches included in our draft decision. Ausgrid noted many of performance metrics used relate to potentially misleading views of asset age and
190 AGL referenced performance metrics in its submission on Ausgrid's revised proposal; AGL, Re: NSW Electricity Distribution Network Determinations 2014-19: AER Draft Decisions and Revised Regulatory Proposals, 13 February 2015, p.2.
75 Attachment 6 – Capital expenditure | Ausgrid Final decision 2015–19

condition and other characteristics that make one distribution business different from another.191
Network scale
To account for network scale across service providers' total repex, we applied two normalising factors relating to customer and capacity density. In effect, we have applied customer and capacity density to identify the spread of network assets across distributors. When we investigated the relative performances of different networks on these measures, networks with a high proportion of assets on long rural feeders tended to incur more repex relative to more urbanised networks. We noted that in Ausgrid's case it has only 6.4 per cent of its assets on rural long feeders (compared to around 50 per cent for the predominately rural networks).192
Ausgrid in its revised proposal noted that:
Comparing distribution businesses based on density measures is a legitimate approach, but only after correcting for key underlying factors like size, scope and asset age in some appropriate way. This (the AER's draft decision) betrays a fundamental misunderstanding about the function of normalisation that questions further the draft decisions reliance on drawing invalid conclusions from inappropriate metrics.193
Further Jacobs in its review of elements of our draft decision noted that customer and capacity density are largely unrelated to the underlying drivers of repex.194 We do not accept that measures of network density are unrelated to the underlying drivers of repex. We agree that the spread of assets on a network has limited correlation to the condition of the assets (i.e. the driver of replacement volumes). We do however expect that a low density network would incur relatively higher unit costs associated with replacing isolated network assets. This is consistent with our draft decision where we discuss the impact of density factors.195 In this context we note that Ausgrid incurs relatively more repex than networks such as Ausnet and Powercor which have significantly more assets on long rural feeders.196
We agree with Jacobs' expectation that Ausgrid incur higher than average repex in absolute terms amongst service providers given it is the largest distributor in terms of customers served and asset base size. We recognised the limitations of this analysis in the draft decision and taking these limitations into account we have only considered this analysis in terms of whether it is supportive of the outcomes from our other techniques (e.g. this analysis indicated that Ausgrid compared unfavourably to other service providers by a significant margin). Further we do not accept Ausgrid's view that a high proportion of sub transmission assets and HV assets invalidates any use of these metrics (refer to appendix F of our draft decision).
191 Ausgrid, Revised Regulatory Proposal and Preliminary Submission, p. 95.192 AER analysis of Category Analysis RINs Table 2.2.2 lines asset in commission by feeder type.193 Ausgrid, Revised Regulatory Proposal and Preliminary Submission, p. 94.194 Ausgrid, Revised regulatory proposal, Attachment 5.08, Jacobs Review of AER Draft Decision - Repex p. II.195 AER, Ausgrid Draft Decision Attachment 6: Capital Expenditure, pp. 6-119-20.196 AER analysis of Category Analysis RINs Table 2.2.2 lines asset in commission by feeder type.
76 Attachment 6 – Capital expenditure | Ausgrid Final decision 2015–19

Size of asset base
Another performance metric we had regard to aims to normalise for the size of a service provider's asset base. Intuitively the more assets that exist on a network, the more that will eventually need replacing. In making this assessment and consistent with our draft decision we compared service providers on the basis of the cumulative repex incurred across the regulatory years 2008-13 as a proportion of their opening RABs (the RAB serving as a proxy of asset base size number of assets that exist on a network).
In our draft decision we noted197:
Service providers submitted that repex depends not only on the size of their RABs, but the characteristics of their RAB as well.198 Some service providers also submitted that this measure fails to account for the age and condition of the RAB, any capex and opex trade-offs, whether a service provider employs a deterministic or probabilistic replacement strategy and a service provider's particular investment cycle (noting the limited number of years used to determine service providers propensity for replacement (repex being the aggregate of only five years of expenditure).
In its revised proposal Ausgrid considered this measure represented a small improvement in comparing service providers incurred repex.199 However, Ausgrid stated the 2008 RAB is not the most appropriate measure of business size. Ausgrid highlighted differences in the scope of its network compared to almost every other service provider, especially those in Victoria due to the inclusion of a substantial transmission component and the more significant role of higher voltage assets in the NSW distribution sector generally and Ausgrid in particular.200 As we note in our draft decision we consider there are both advantages and disadvantages associated with higher voltage assets both in terms of their unit costs and volumes. For example, all else being equal, a network operating its high voltage network at 11kV rather than 22kV, will have lower cost feeder assets but will require more of them.201 We consider across networks these effects are likely to balance each other out in determining the whether a service provider incurs higher repex.
Further, Ausgrid pointed to the fact that it embodies three distinct service territories – arguably the densest and highest economic value CBD, a well-established urban zone, and a rural network; Ausgrid also noted its substantially older asset age profile of its network as a relevant factor. We have assessed the impacts of network health, such as asset age in our discussion of network health indicators below. We also note below that Ausgrid's weighted average remaining life trends indicate that overall remaining asset lives are increasing for most major asset categories.
197 AER, Ausgrid Draft Decision Attachment 6: Capital Expenditure, pp. 6-55.198 NSP Responses to AER Category analysis circulated 15 August 2014.199 Ausgrid Revised Regulatory Proposal and Preliminary Submission, p. 96.200 Ausgrid, Revised Regulatory Proposal and Preliminary Submission, p. 96.201 AER, Ausgrid Draft Decision, Attachment 6, pp. 6-113.
77 Attachment 6 – Capital expenditure | Ausgrid Final decision 2015–19

B.5 AER findings and estimates for reliability improvement capex
Reliability improvement capex includes capex to meet network reliability performance obligations set out in Ausgrid's licence conditions.
B.5.1 Position
We consider an amount of $19.5 million (excluding overheads) reasonably reflects the capex criteria. Ausgrid's revised proposal contained $19.5 million (gross capex) in reliability improvement capex. However, Ausgrid also proposed an offset of $6.6 million to account for the proportion that would be expected to be funded by marginal STPIS revenue as a result of this expenditure.202 Accordingly, the net capex Ausgrid proposed to include in its capital allowance is $12.85 million. This is a 54 per cent reduction from the proposed allowance of $28.3 million in its initial proposal.
In our draft decision, we noted that we consider that Ausgrid's proposed methodology was sound. However, we did not accept Ausgrid's proposed expenditure of $28.3 million because:203
Ausgrid had not identified what component of this proposed capex is augex and repex related. This information is necessary to ensure we do not double count this expenditure (e.g. if this expenditure is mainly repex related we have already taken this into account in our alternative estimate of repex.
It is also not clear to us the extent to which Ausgrid's proposal is related to its proposed improvement in SAIDI during the 2014–2019 period.
Ausgrid clarified in its revised proposal that this expenditure was not classified as repex. We are now satisfied this expenditure is not already included in our repex assessment. As such, the cost of undertaking these projects has not been provided for in the repex assessment and so a separate assessment of this capex is appropriate. We have assessed this expenditure as a standalone item and we are satisfied that no double counting will occur using this approach.
We then considered whether these projects should be funded through the STPIS instead of being included in the estimate of total forecast capex. Generally, we do not consider it appropriate for the total forecast capex to fund specific programs of reliability improvement, because these reliability improvements should be funded by the operation of the STPIS. However, it is important to note that the STPIS is based on an average level of reliability. Meeting the schedule 3 licence conditions involves rectifying specific issues (often on specific feeders), which often only affect a small number of users and rectifying these issues is likely to negligible marginal impact on the average reliability levels. Accordingly, the cost of addressing poor reliability on these feeders is not fully recovered through the STPIS scheme.
As such, we are satisfied that it is appropriate to account for these projects in total forecast capex as it will allow Ausgrid to meet its regulatory obligations. In its revised 202 Ausgrid, Revised Regulatory Proposal, p. 109.203 AER, Draft Decision Ausgrid distribution determination 2015-2019, Attachment 6, pp. 6–74.
78 Attachment 6 – Capital expenditure | Ausgrid Final decision 2015–19

proposal Ausgrid proposed an offset of $6.6 million to its capex allowance to account for any marginal STPIS revenue. However, we do not consider it appropriate to adjust Ausgrid's total forecast capex in this manner, because this would require us to approve an estimate that is less than required to reasonably meet the capex criteria (noting that the shortfall would be expected to be recovered through the STPIS). We consider that in principle an adjustment to the STPIS targets should be made to account for the impact this expenditure may have on average performance. However, as we expect the impact to on the STPIS targets to be small, we are not proposing to make an adjustment to the targets in this case.
B.6 AER findings and estimates for capitalised overheads
Capitalised overheads are costs associated with capital works that have been capitalised in accordance with Ausgrid's capitalisation policy. They are generally costs shared across different assets and cost centres.
B.6.1 Position
Whilst we have concerns with Ausgrid's forecast, in the absence of sufficiently robust evidence to the contrary, we accept Ausgrid's revised proposal of $645.0 ($2013-14) of forecast capitalised overheads reasonably reflects the capex criteria.
B.6.2 Revised proposal
Ausgrid’s revised proposal included $645.0 million ($2013-14) of forecast capitalised overheads, which was 15 per cent lower than its initial proposal of $729.2 million. Ausgrid states that this is a result of a lower forecast of direct capital expenditure and by improved productivity and management of overheads.204
B.6.3 AER approach
As a logical proposition we consider that reductions in Ausgrid's forecast expenditure should see some reduction in the sized of Ausgrid's total overheads. Our assessment of Ausgrid's proposed direct capex, demonstrates that a prudent and efficient distributor would not undertake the full range of direct expenditure contained in Ausgrid's revised proposal and it follows that we would expect some reduction in the size of Ausgrid's capitalised overheads. Indeed, Ausgrid accepts this to the extent that its revised proposed capitalised overheads are less than its initial proposal as a result of its lower than forecast of direct capex. We do accept that some of these overheads are relatively fixed in the short term and so are not correlated to the size of the expenditure program. However, we consider that a portion of the overheads should vary in relation to the size of the expenditure.
204 Ausgrid, Revised Regulatory Proposal, p. 112.
79 Attachment 6 – Capital expenditure | Ausgrid Final decision 2015–19
In our draft decision we applied an adjustment based on an observed historical ratio of overheads to capital expenditure. However, as a result of submissions on this approach from several distributors, we accept that this approach implicitly assumed that all overheads were variable.205 Accordingly, we do not consider it appropriate to apply our draft position in the final decision.
We also received a number of submissions which indicated that our draft decision did not accord with the distributors' CAMs or relevant accounting standards (ASB 116). While we do not agree with the issues raised, this point is not key to our position on forecast capitalised overheads in this final decision. We note that a distributor is required to submit a proposal consistent with its CAM. We do not apply the CAM directly as the CAM is not designed to be an assessment technique which we could practically apply in assessing the capex criteria. Similarly, while each of the distributors will need to continue applying AASB 116, our forecast methodology does not need to be explicitly based on this standard.
We have engaged in considerable consultation with Ausgrid regarding its overheads.206 We sought to understand how overheads vary with the size of Ausgrid's expenditure program and in particular to quantify the proportion of overheads that are fixed and varied. Ausgrid stated that:207
Ausgrid considers its total overhead expenditure to be fixed. This also extends to direct capitalised overheads which do not fluctuate and are therefore not dependent on the scope of the capital program.
However, Ausgrid has also separately stated that:
our view is that overheads are, in the main, fixed but that some aspect is variable in the short term and, in the long run, all costs are variable. It is not easy to establish what component is variable in the short term
In our view, it is unlikely that these costs are wholly fixed and we note that Ausgrid's submissions on this point have not been entirely consistent. We provided some regression analysis to Ausgrid and the other NSW/ACT distributors, which attempted to quantify the relationship between expenditure and capitalised overheads.208 Our analysis indicates that some portion of these overheads are variable. However, in response the distributors identified a number of data issues underlying this regression analysis. Ausgrid and the other distributors also pointed to non-recurrent overheads and one-off adjustments are present in the historical data, which undermines the trend analysis. Service providers submitted that, factors which undermines this trend analysis include:209
accounting adjustments to overhead costs such as year-end adjustments for provisions that account for employee related entitlements should be removed to
205 Endeavour, Revised Regulatory Proposal, p. 132; Essential, Revised Regulatory Proposal, p. 144.206 AER, Info request Ausgrid 055 plus follow-ups requests207 Ausgrid, Response to AER information request Ausgrid 055208 AER, Info request Ausgrid 055 plus follow-ups requests209 AER, Info request Ausgrid 055 plus follow-up requests; AER, Info request Endeavour 047 plus follow-ups
requests; AER, Info request Essential 047 plus follow-ups requests; AER, Info request Actew 061 plus follow-ups requests.
80 Attachment 6 – Capital expenditure | Ausgrid Final decision 2015–19

reveal an underlying overhead cost trend. After removing these adjustments they contend the explanatory power of the regression is poor.
The relationship does not demonstrate causality and the distributors propose a number of other reasons for the observed relationship.
Limited number of data points for the regression.
We do not discount our regression analysis entirely, but at this stage accept that it is not sufficiently robust to form the basis of a mechanistic adjustment to Ausgrid's capitalised overheads. Without evidence to the contrary, we accept Ausgrid's proposed capitalised overheads reasonably reflect the capex criteria.
B.7 AER findings and estimates for non-network capex
Ausgrid proposed forecast non-network capex of $384.2 million ($2013-14, direct costs) in its revised proposal. This is an increase of $50.8 million from Ausgrid's initial proposal of $333.4 million ($2013-14, direct costs).210
B.7.1 Position
We do not accept Ausgrid's revised proposal for non-network capex. As discussed below, and consistent with our draft decision, we are not satisfied that Ausgrid's forecast land and buildings capex reasonably reflects the efficient costs that a prudent operator would require to achieve the capex objectives given a realistic expectation of demand and cost inputs.211 We remain of the view that Ausgrid's forecast buildings and property capex is front-loaded and overstated due to the observed delays in the schedule of projects and the likelihood of future changes in project timing, scope and cost. We consider that buildings and property capex of $131.4 million, as part of an overall forecast for non-network capex of $351.3 million, reasonably reflects the efficient costs of a prudent operator.
In modelling Ausgrid's required revenue for the 2014–19 period, we have also accounted for forecast disposals of fleet assets which Ausgrid omitted from its revised regulatory proposal.
B.7.2 Revised proposal
In its revised proposal, Ausgrid did not agree with our draft decision to reduce forecast buildings and property capex by 20 per cent based on observed delays in the schedule of projects and the likelihood of future changes in project timing, scope and cost. Ausgrid's revised proposal for non-network capex:
included forecast land and buildings capex of $164.3 million ($2013-14, direct costs), consistent with the estimate provided in its initial proposal212
210 Ausgrid, Revised regulatory proposal, 20 January 2015, p. 110. Ausgrid's revised proposal clarified the correct value for non-network capex in its initial proposal was $333.4 million ($2013-14, direct costs only), not $307.6 million as set out in our draft decision.
211 NER, cl. 6.5.7(c).212 Ausgrid, Revised regulatory proposal, 20 January 2015, p. 110.
81 Attachment 6 – Capital expenditure | Ausgrid Final decision 2015–19

included $55.6 million for a new category of non-network capex related to SCADA and network control, which Ausgrid had incorrectly allocated across other categories of network capex in its initial proposal213
reflects our draft decision to accept forecast capex for motor vehicles, information technology, and plant and tools.214
B.7.3 Buildings and property capex
In our draft decision, we found that a forecast spike in buildings and property capex in 2015–16 and 2016–17 is driving a high level of non-network capex forecast for those years compared to all other years of the 2014–19 period. In relation to Ausgrid's forecast buildings and property capex, we concluded that:215
Ausgrid’s schedule of non-network property expenditure is intentionally frontloaded and is unlikely to be achieved in practice. The delivery risks identified by Ausgrid in relation to planning consents, design development, latent conditions within the ground and inclement weather are highly likely to result in project deferrals rather than any expedition of the projects
forecast non-network property capex should be more equally distributed over the five years of the 2014–19 period to reflect a realistic expectation of capex delivery
based on an observed historical pattern of project deferrals and re-scoping, we consider it likely that a proportion of projects proposed by Ausgrid for the 2014–19 period will again be re-scoped, deferred or not completed within the period
given the forecast decline in Ausgrid's staffing numbers and system work volumes across the 2014–19 period, any deferrals or scope adjustments within the 2014–19 period due to project specific factors are unlikely to be offset by new projects
Board approval for each of the three major property projects has been delayed by 12-15 months beyond the date scheduled in each business case
in some instances, the cost information presented in Ausgrid's business cases is unlikely to reflect a reasonable estimate of the efficient cost of the projects as the accuracy of cost estimates is described as plus or minus 40 per cent.
Ausgrid's revised proposal for non-network property capex reflected the estimate provided in its initial proposal, with minor adjustments. Ausgrid stated that it disagrees with the assertions made in our draft decision, and submitted that:216
its strategy to reduce its CBD presence and relocate staff to adjacent metropolitan depots relies on the timing of the three proposed major projects
delaying the proposed investment timing would lead to an opex requirement to fund a lease extension, assuming one was available
213 Ausgrid, Revised regulatory proposal, 20 January 2015, pp. 110-111.214 Ausgrid, Revised regulatory proposal, 20 January 2015, p. 110.215 AER, Draft decision - Ausgrid distribution determination - Attachment 6 - Capital expenditure, November 2014,
pp. 6-77 to 6-78.216 Ausgrid, Revised regulatory proposal, 20 January 2015, p. 110.
82 Attachment 6 – Capital expenditure | Ausgrid Final decision 2015–19

the capex forecasts result from a careful consideration of project timing, scope and cost, and input from independent external review of Ausgrid's requirements
key considerations including the size and make up of Ausgrid's ongoing workforce and logistics requirements are reflected in its submission.
Ausgrid referred to its previous response to the AER's information request on non-network buildings and property capex (AER Ausgrid 031)217, but did not submit any new information or additional documentation to support its revised proposal.218
In relation to the timing of projects, Ausgrid's revised proposal referred to the need for a lease extension in one case if the proposed investment timing was delayed.219 However, we note that Ausgrid has focussed on its three major property projects. We consider that not all of Ausgrid's proposed property projects are driven by end of lease arrangements or the need to relocate staff or functions. For example, proposed projects at Oatley, Wallsend, Dee Why, and Maitland, as well as the depot refurbishment and specialist sites programs, relate to the development of existing facilities to improve site efficiencies and/or replace ageing assets.220 The timing of these projects is not driven by end of lease or relocation imperatives. In our view, Ausgrid has sufficient flexibility within its overall non-network property program to prioritise or defer expenditure to manage end of lease or other timing imperatives in particular cases.
In relation to the quantum of forecast buildings and property capex, Ausgrid has submitted that its capex forecasts result from a careful consideration of project timing, scope and cost. Ausgrid considers that key considerations including the size and make up of Ausgrid's ongoing workforce and logistics requirements are reflected in its submission.221 However, Ausgrid has not specifically addressed the issues raised in our draft decision concerning the observed historical pattern of project deferrals and re-scoping, actual delays in achieving Board approval of property projects, and the potential inaccuracy of cost estimates for some projects.
Further, Ausgrid submitted that its non-network buildings and property capex reflects key considerations including the size and make up of Ausgrid's ongoing workforce and logistics requirements.222 However, we consider that this is not apparent from the information submitted by Ausgrid. Ausgrid submitted that the purpose of its non-network buildings and property capex program is to provide fit for purpose accommodation facilities for its staff to enable them to perform Ausgrid's network and corporate functions.223 We agree with Ausgrid that expectations of future workforce and logistics requirements are therefore key drivers of non-network buildings and property capex. Relevantly, Ausgrid's revised proposal:
217 Ausgrid, Response to Information Request AER AUSGRID 031, 9 September 2014. 218 Ausgrid, Revised regulatory proposal, 20 January 2015, p. 110.219 Ausgrid, Revised regulatory proposal, 20 January 2015, p. 110.220 Ausgrid, Attachment 5.28 - Overview of non-system property capex, May 2014, p. 18.221 Ausgrid, Revised regulatory proposal, 20 January 2015, p. 110.222 Ausgrid, Revised regulatory proposal, 20 January 2015, p. 110.223 Ausgrid, Attachment 5.28 - Overview of non-system property capex, May 2014, p. 4.
83 Attachment 6 – Capital expenditure | Ausgrid Final decision 2015–19

reduced forecast total capex by 15 per cent, and forecast opex by 5.8 per cent, when compared to its initial proposal224
stated that further improvements in forecast labour productivity are expected to result in a reduction of approximately1300 positions over the five years to 2019225
identified increased staff exit costs of approximately $115 million compared to its initial proposal.226
However, despite these identified reductions in staffing and work volumes from its initial proposal, Ausgrid has essentially maintained its initial proposal for the level of non-network buildings and property capex required to meet workforce and logistics accommodation requirements. We consider that this adds further weight to our conclusion that Ausgrid is likely to re-scope or defer a proportion of the buildings and property expenditure proposed for the 2014–19 period as its needs and requirements change over time. We therefore maintain our draft decision that Ausgrid's non-network buildings and property capex is likely to be overstated and does not reasonably reflect the efficient costs of a prudent operator.
In determining our estimate of non-network buildings and property capex, we have not sought to determine which of the proposed projects Ausgrid should pursue in the 2014–19 period. This is a matter for Ausgrid. Our alternative estimate is based on:
smoothing the forecast capex over the five years of the 2014–19 period, to account for the identified front-loading and project delivery risks
a reduction of 20 per cent to account for the observed 12-15 month delay in the schedule of major projects and the likelihood of future changes in project timing, scope and cost in the context of declining staff numbers and work volumes.
In our view, our estimate of $131.4 million is sufficient for Ausgrid to continue to invest in a range of prudent construction, refurbishment and maintenance projects. For example, this total amount is sufficient for Ausgrid to undertake the three major property projects proposed at Homebush, Chatswood and Alexandria, or a range of other prudent investments, depending on its workforce and logistics accommodation priorities.
B.7.4 Non-network SCADA and network control
Ausgrid's revised proposal for non-network capex included a new category of expenditure related to non-network SCADA and network control. Ausgrid proposed capex of $55.6 million ($2013-14, direct costs) for this category. This amount reflects capex that Ausgrid incorrectly allocated across various categories of network capex in its initial proposal.227 As such, Ausgrid's revised proposal for this category represents a reallocation of capex rather than an increase in expenditure from Ausgrid's initial regulatory proposal.
224 Ausgrid, Revised regulatory proposal, 20 January 2015, pp. 4-5.225 Ausgrid, Revised regulatory proposal, 20 January 2015, p. 173.226 Ausgrid, Revised regulatory proposal, 20 January 2015, p. 173.227 Ausgrid, Revised regulatory proposal, 20 January 2015, pp. 110-111.
84 Attachment 6 – Capital expenditure | Ausgrid Final decision 2015–19

Ausgrid submitted that its trend analysis of non-network SCADA and network control capex shows that forecast expenditure is reasonable relative to historic rates of expenditure.228 Ausgrid's trend analysis of non-network SCADA and network control capex, in the format set out in our draft decision for other categories of non-network capex, is shown in Figure 6-10 below.
Figure 6-10 Ausgrid's non-network capex by category ($million, 2013-14)
Source: Ausgrid, Revised regulatory proposal, 20 January 2015, p. 111.
Ausgrid has forecast a significant reduction in non-network SCADA and network control capex in the 2014–19 period. Capex for this category is forecast to be relatively flat and at historically low levels throughout the 2014–19 period. This aligns with Ausgrid's technology strategy, which states that SCADA and network control capex will be limited to the maintenance of existing systems and infrastructure.229 On this basis, we are satisfied that this level of capex reflects the high level drivers of expenditure in this category, and as such reasonably reflects the efficient costs of a prudent operator.
B.7.5 Asset disposals
In assessing Ausgrid's forecast non-network capex, we sought further information regarding Ausgrid's forecast disposals of non-network assets in the 2014–19 period.230 Specifically, we sought clarification of Ausgrid's forecast disposals of:
motor vehicles in the 2014–19 period
a property in Surry Hills, which TransGrid has proposed to acquire from Ausgrid in 2015-16.
228 Ausgrid, Revised regulatory proposal, 20 January 2015, p. 111.229 Ausgrid, Attachment 5.27 - Technology Capital Expenditure Plan Overview, 23 May 2014, p. 38.230 AER, Information request AER AUSGRID 050, 2 February 2015.
85 Attachment 6 – Capital expenditure | Ausgrid Final decision 2015–19

Ausgrid did not account for any disposals of motor vehicle assets in its revised regulatory proposal. In response to our information request, Ausgrid advised that in fact it expected proceeds from the sale of fleet assets over the 2014–19 period of $16.2 million ($nominal).231
In relation to the disposal of its Surry Hills site, Ausgrid advised that its revised regulatory proposal modelling had included an estimate of $52.88 million ($nominal) for the disposal of this site. However, Ausgrid advised that since that initial estimate was prepared, it had agreed to sell this property to TransGrid in 2015-16 for an agreed value of $50 million ($nominal).232
We have accounted for these disposals in modelling Ausgrid's required revenue for the 2014–19 period.
B.8 Demand managementDemand management refers to non-network strategies to address growth in demand and/or peak demand. Demand management can have positive economic impacts by reducing peak demand and encouraging the more efficient use of existing network assets, resulting in lower prices for network users, reduced risk of stranded network assets and benefits for the environment.
Demand management is an integral part of good asset management for network businesses. Network owners can seek to undertake demand management through a range of mechanisms, such as incentives for customers to change their demand patterns, operational efficiency programs, load control technologies, or alternative sources of supply (such as distributed or embedded generation and energy storage).233
The current incentive frameworks and obligations in the NER are designed to encourage distributors to make efficient investment and expenditure decisions. However, the NER recognises that the planning and investment framework and the incentive regulation structure may not be sufficient by themselves to remove any bias towards network capital investment over non-network responses.
As such, the NER set out that distributors should examine non-network alternatives when developing network investments through the regulatory investment test for distribution (RIT-D) process. The RIT-D requires distributors to consult with stakeholders on the need for new capex projects and consider all credible network and non-network options as part of their planning processes. Its aim is to create a level playing field for the assessment of non-network options, such as demand-side management, against network options.
The NER also require us to consider the extent to which a business has considered efficient and prudent non-network alternatives in our assessment of capex proposals.234 In addition, the NER require us to develop and implement mechanisms to incentivise distributors to consider economically efficient alternatives to network
231 Ausgrid, Response to Information Request AER AUSGRID 050, 10 February 2015, p. 2.232 Ausgrid, Response to Information Request AER AUSGRID 050, 10 February 2015, p. 1.233 AER Draft Decision 2014–19, Ausgrid: Attachment 6: Capital expenditure, p 6–81-82.234 NER, clause 6.5.7(3)(10).
86 Attachment 6 – Capital expenditure | Ausgrid Final decision 2015–19

solutions. As set out in our demand management incentive scheme attachment (attachment 12), we are continuing Ausgrid's demand management innovation allowance.
B.8.1 Position
We have maintained our view from the draft decision that it is most appropriate to rely on the incentive framework, together with the requirements in the RIT-D and the distribution Annual Planning Report, to drive the efficient use of demand management. The benefits of capex deferral would be shared with consumers through the Capital Expenditure Sharing Scheme (CESS).
Accordingly, our alternative estimate of required capex does not include a generic reduction to overall system capex for potential for deferred capital needs through the use of demand management initiatives.
Our decision not to include a generic capex offset for possible future demand management activities does not impact on our consideration of the business cases for specific demand management proposals, or the consideration of non-network alternatives within the RIT-D process. Where a specific capex/opex trade-off can be shown to meet the capex and opex criteria we will include the amounts in the forecasts. This approach is consistent with the capital expenditure factor that requires us to have regard to the extent to which the distributor has considered, and made provision for, efficient and prudent non-network alternatives.235
B.8.2 Revised proposal on demand management
Ausgrid's original proposal included $22.1 million additional opex and $1.3 million additional capex over the 2014–19 period for broad-based demand management initiatives. Ausgrid's revised proposal resubmits this additional opex and capex. Our consideration of Ausgrid’s opex proposals for a broad-based demand management program is included in attachment 7.
Ausgrid also resubmits its proposed Demand Management Benefit Sharing Scheme (DMBSS). In doing so, it noted that reliance on the modest innovation fund and the RIT-D would result in less demand management than is cost effectively viable.236 We recognise the importance of strengthening demand management incentives in order to defer network augmentation. A benefit sharing scheme, such as that proposed by Ausgrid, could well be effective in strengthening incentives in this regard.
The AEMC is currently considering a rule change to strengthen the incentives for distributors to consider non-network alternatives.237 The AEMC is currently considering submissions to its consultation on the rule change. We do not consider it appropriate to develop an alternative incentive structure in parallel to the AEMC's review through
235 NER Clause 6.5.7(e)(10).236 Ausgrid’s Revised Regulatory Proposal and Preliminary Submission, February 2015, p 113.237 AEMC, National Electricity Amendment (Demand Management Incentive Scheme) Rule 2015 Consultation Paper,
19 February 2015.
87 Attachment 6 – Capital expenditure | Ausgrid Final decision 2015–19

Ausgrid's regulatory proposal. The AEMC will be able to consider how any changes to the NER can be implemented in the 2014-19 regulatory period through transitional arrangements. Further details on our demand management incentive scheme are contained in attachment 12.
B.8.3 Draft decision position
Distributors are required to transparently consider non-network alternatives through the RIT-D process. Through the RIT-D process and other initiatives developed as part of the demand management innovation allowance, it is expected that some amount of system capex currently in the forecast will be efficiently deferred. In our draft decision, we considered whether it was appropriate to estimate the amount of capex that may be efficiently deferred through the use of demand management initiatives and explicitly reduce the capex forecast by this amount.
In our draft decision, we did not include an explicit capex forecast reduction in anticipation of the deferrals that may be achieved through demand management. Based on the available information, and subject to further input from stakeholders, we formed the view that it was most appropriate to rely on the incentive framework and the RIT-D process to drive the efficient use of demand management. Any capex deferral would be shared with consumers through the CESS.
However, we also noted that an analysis of Ausgrid's capex during the 2009–14 period had shown that it was able to defer 9.2 per cent of system capex through demand management initiatives. We invited stakeholder commentary on whether this estimate should be used to explicitly adjust the capex forecast for the 2014–19 period. We also noted that in order to apply a capex/opex trade-off we would need to assess the efficient opex required to fund the demand management initiatives.238
B.8.4 Reasons for final decision
We have not received any specific stakeholder commentary on the appropriate capex offset that should be included in the forecast. However, EnerNOC questions the appropriateness of simply removing 9.2 per cent from the capex allowance on the assumption that it ought to be deferrable.239
EnerNOC also raises concerns with the approach we sought views on as it suggests that we have reduced capex associated with demand management without allowing the associated opex for demand management initiatives.240 As set out above and consistent with our consideration of opex step-changes in attachment 7, our position is to only apply a specific capex/opex trade-off where it can be shown to meet the capex and opex criteria. However, we have not applied an additional generic capex offset associated with likely demand management activities.
No other stakeholders provided views on the appropriateness of estimating a generic capex deferral associated with future demand management activities. Accordingly, we
238 AER Draft Decision 2014–19, Ausgrid: Attachment 6: Capital expenditure, p 6–82.239 EnerNOC submission on 2015-19 draft decisions and revised proposals for NSW DNSPs p6.240 EnerNOC submission on 2015-19 draft decisions and revised proposals for NSW DNSPs p5.
88 Attachment 6 – Capital expenditure | Ausgrid Final decision 2015–19

maintain our view that the efficient capex/opex trade-off is most efficiently discovered through reliance on the incentive framework, together with the RIT-D process.
89 Attachment 6 – Capital expenditure | Ausgrid Final decision 2015–19

C DemandThe level of expected demand is fundamental to a distributor's forecast capex and
opex and to our assessment of that forecast expenditure.241 This attachment sets out our decision on Ausgrid's forecast total system demand for the 2014–19 period.242
System demand trends give a high level indication of the need for expenditure on the network to meet changes in demand. Forecasts of increasing system demand generally signal an increased requirement for growth capex, and the converse for forecasts of stagnant or falling system demand.243 Accurate, or at least unbiased, demand forecasts are important inputs to ensuring efficient levels of investment in the network. For example, excessively high demand forecasts may lead to inefficient expenditure as distributors install unnecessary capacity in the network.
In the draft decision, we accepted Ausgrid's forecast whilst noting our expectation that updated forecasts would be included in the revised proposal. 244 In this final decision, we find that Ausgrid's system demand forecast reasonably reflects a realistic expectation of demand. We formed this view after considering the updated forecasts contained in Ausgrid's revised proposal and comparing these to the most recent independent demand forecasts prepared by AEMO.
This attachment does not consider localised demand growth (spatial demand) that may drive the need for specific growth projects or programs.
C.1 AER positionWe are satisfied that the demand forecasts for the 2014–19 period proposed by Ausgrid, in its revised proposal (January 2015), reasonably reflect a realistic expectation of demand.245 Though we acknowledge that demand forecasting is not a precise science and will inevitably contain errors, the evidence before us supports our conclusion.
C.2 AER approachOur consideration of demand trends in Ausgrid's network relied primarily on comparing demand information from the following sources:
Ausgrid's revised proposal
forecasts from AEMO246
241 NER, clause 6.5.6(c)(3) and 6.5.7(c)(3).242 In this attachment, 'demand' refers to summer maximum, or peak, demand (megawatts, MW) unless otherwise
indicated.243 Other factors, such as network utilisation, are also important high level indicators of growth capex requirements.244 AER, Draft Decision, Ausgrid distribution determination, 2015-16 to 2018-19, Attachment 6: Capital expenditure,
November 2014, p. 118.245 NER, clause 6.5.6(c)(3) and 6.5.7(c)(3).246 AEMO, National electricity forecasting report for the National Electricity Market, June 2014, p. 4-4.
90 Attachment 6 – Capital expenditure | Ausgrid Final decision 2015–19

stakeholder submissions in response to Ausgrid's revised proposal (as well as submissions made in relation to the NSW/ACT distribution determinations more generally).
C.3 Ausgrid's revised proposalAusgrid's revised demand forecasts incorporate the latest actual demand data
(from summer 2013/14 and winter 2013). These revised forecasts are considerably lower than the forecasts provided in its initial regulatory proposal.247 Indeed, Ausgrid has progressively downgraded its demand forecasts since its initial regulatory proposal for the previous 2009–14 regulatory control period.248
In October 2014, Ausgrid stated that improvements in its forecasting process, and not just lower economic growth forecasts, explained its lower demand forecasts.249 Ausgrid has improved its forecasting methodology to take better account of top down econometric factors and to incorporate a revised normalisation approach. Ausgrid's revised normalisation approach improves its calculation of its weather correction metric and is carried out at the substation level on a seasonal basis. As a result, the starting point at many zone substations has changed. This, combined with a lower underlying growth projection, has resulted in a reduction in forecast demand at most points on the system.
The AEMO forecasted similar trends of low system demand growth for Ausgrid's network and for the NSW region more generally. We note that AEMO had downgraded its demand forecast for the NSW region in its most recent report. 250
Ausgrid's regulatory proposal described its demand forecasting methods, including approaches to:
weather correction
accounting for spot loads
accounting for transfers
accounting for embedded generation.251
As part of our final decision on system demand forecasts, we compared Ausgrid's revised system demand forecast to the sum of AEMO's connection point (CP) forecasts for Ausgrid's network.252
Figure 6-11 and Table C-4 provide an overall system level view of Ausgrid's revised demand forecasts, the changes made since its regulatory proposal and a comparison of the AEMO forecasts.
247 Ausgrid, Attachment 5.02 2014 Spatial demand forecast, January 2015.248 Ausgrid, Regulatory proposal: 1 July 2014 to 30 June 2019, 30 May 2014, p. 37.249 Ausgrid, Ausgrid’s response to the AER’s information request of 26 September 2014, 2 October 2014, p. 1;
Ausgrid, P50 2013 2014: Development forecast all zones, 2 October 2014; AER analysis.250 AEMO, National electricity forecasting report for the National Electricity Market, June 2014, p. 4-4.251 Ausgrid, Regulatory proposal: Attachment 5.04: (INV-STD-10022) Planning standard - Demand forecast and
related documents, May 2014.252 AEMO, Final Transmission Connection Point Forecasts, October 2014.
91 Attachment 6 – Capital expenditure | Ausgrid Final decision 2015–19

Figure 6-11 Maximum system demand (summer coincident)
0
1000
2000
3000
4000
5000
6000
7000
Demand(MW) Actual
Actual (Weather corrected)
Forecast - Regulatory proposal (Weather corrected (50% POE))
Forecast - Revised Regulatory proposal (Weather corrected (50% POE))
Forecast - AEMO (Weather corrected (50% PoE))
Table C-4 Maximum system demand - Weather corrected (50% PoE) (MW)
2014-15 2015-16 2016-17 2017-18 2018-19
Average annual growth
(2014-19)
Regulatory proposal (May 2014) - Summer
5594 5591 5667 5778 5878 0.70%
Revised proposal (January 2015) - Summer
4888 4812 4750 4719 4716 -0.21%
Regulatory proposal (May 2014) - Winter
4897 4891 4957 5029 5119 0.12%
Revised proposal (January 2015) - Winter
4544 4543 4490 4497 4516 -0.37%
C.3.1 AEMO forecasts
In July 2014, AEMO published the first edition of transmission CP forecasts for New South Wales and Tasmania.253 These forecasts are AEMO’s independent electricity maximum demand forecasts at transmission connection point level, over a 10-year outlook period.254 The Standing Council on Energy Resources (SCER) intended these
253 AEMO, Transmission connection point forecasting report for New South Wales and Tasmania, July 2014, p. 6.254 AEMO, Website: http://www.aemo.com.au/Electricity/Planning/Forecasting/Connection-Point-Forecasting/
Transmission-Connection-Point-Forecasts, accessed 3 September 2014.
92 Attachment 6 – Capital expenditure | Ausgrid Final decision 2015–19

demand forecasts to inform our regulatory determinations.255 In addition, AEMO has published the National Electricity Forecasting Report (NEFR) since 2012, and published the latest edition in June 2014 (2014 NEFR).256 The NEFR includes AEMO's summer and winter demand forecasts for all regions (states) in the National Electricity Market. More information about the AEMO process is included in our draft decision.257
Figure 6-11 compares AEMO's demand forecasts and the forecasts proposed by Ausgrid in both its initial and revised regulatory proposals.258 Ausgrid's initial growth trend was consistent with AEMO's CP forecasts over the 2014–19 period. This was despite having different datasets and forecasting approaches. Ausgrid's revised demand forecasts show a marginal decline in demand over the 2014–19 period.
As set out in our draft decision several stakeholders raised concerns that Ausgrid, as well as the other NSW/ACT distributors, were using overly conservative demand forecasts as inputs to their regulatory proposals. That is, many stakeholders considered that the forecasts included in the initial proposal were too high.259
The Energy Retailers Association of Australia noted that the NSW distributors' revised demand forecasts should drive an observable reduction in the amount of required capex over the 2014–19 period.260
Ausgrid's marginal decline in forecast demand submitted in its revised proposal, to some extent addresses the views of stakeholders on levels of demand. Further, the changes made by Ausgrid result in a high degree of overlap with the independently determined forecasts of AEMO.
255 AER, Better regulation: Explanatory Statement: Expenditure Forecast Assessment Guideline, November 2013, p. 182.
256 AEMO, National electricity forecasting report for the National Electricity Market, June 2014.257 AER, Draft Decision, Ausgrid distribution determination, 2015-16 to 2018-19, Attachment 6: Capital expenditure,
November 2014, p 6-118.258 We summed AEMO's coincident demand figures for each CP in Ausgrid's network for each year. 259 AER, Draft Decision, Ausgrid distribution determination, 2015-16 to 2018-19, Attachment 6: Capital expenditure,
November 2014, p 6-90 - 6-91.260 ERAA, Submission on NSW DNSPs draft decisions - 13 February 2015, p. 2.
93 Attachment 6 – Capital expenditure | Ausgrid Final decision 2015–19

D Real material cost escalationReal material cost escalation is a method for accounting for expected changes in
the costs of key material inputs to forecast capex. Ausgrid in its revised regulatory proposal includes forecasts for changes in the prices of commodities such as copper, aluminium, steel and crude oil, rather than the prices of physical inputs themselves (e.g., poles, cables, transformers) used to provide network services. Ausgrid has also escalated construction costs in its forecast.
D.1 PositionWe are not satisfied that Ausgrid's revised proposed real material cost escalators (leading to cost increases above CPI) which form part of its total forecast capex reasonably reflect a realistic expectation of the cost inputs required to achieve the capex objectives over the 2014–19 period. We maintain our view, as set out in our draft decision, that zero per cent real cost escalation is reasonably likely to reflect the capex criteria including that it is likely to reasonably reflect a realistic expectation of the cost inputs required to achieve the capex objectives over the 2014–19 period.
Consistent with our position in the draft decision, our approach to real materials cost escalation does not affect the proposed application of labour and construction cost escalators which apply to Ausgrid's forecast capex for standard control services.261
D.2 Ausgrid's revised proposalIn its revised proposal, Ausgrid has applied the same material and labour cost escalators to various asset classes proposed in its initial regulatory proposal submitted in June 2014.262 Table D-5 shows the revised material cost escalators calculated for Ausgrid by Competition Economics Group (CEG).
Table D-5 Ausgrid's revised real materials cost escalation forecast—inputs (per cent)
2014–15 2015–16 2016–17 2017–18 2018–19
Aluminium 12.9 1.5 1.0 2.7 2.8
Copper -2.6 -1.6 -1.4 0.8 1.1
Steel -6.0 -0.4 2.0 0.7 1.0
Oil -12.1 -1.6 1.1 1.0 0.9
Construction 0.7 1.1 -0.2 0.1 0.8
Labour1 0.89 0.87 1.40 1.62 1.44
Source: Ausgrid, Revised regulatory proposal, p. 115 and Attachment 5.15A - CEG updated cost escalation factors,
December 2014.
261 AER, Draft Decision Ausgrid distribution determination 2015–16 to 2018–19, November 2014, p. 6-138.262 Ausgrid, Regulatory proposal, p. 115.
94 Attachment 6 – Capital expenditure | Ausgrid Final decision 2015–19

1 Based on AER's approach in its Draft Decision.
Details of Ausgrid's approach to forecasting escalation are provided for in our draft decision.263 CEG commodities forecasts are applied to each physical asset based on contracts Ausgrid has with its equipment suppliers which include a price adjustment formulae indicating how much of a commodity input is included in each asset.264
In its revised proposal, Ausgrid rejected the AER's findings on material cost escalation because:265
the estimate of cost inputs derived from the draft decision is almost identical (a difference of $4.28 million or less than one tenth of a per cent) to that proposed by Ausgrid and therefore demonstrates that Ausgrid’s proposal represented a realistic estimate and should have been accepted
Ausgrid does not accept that there are no proven links between its material costs and commodity prices as these commodity price pass throughs are commonly embedded in commercial contracts with suppliers and this was demonstrated in its previous regulatory submissions and accepted by the AER in the 2009-14 determination
the three consultant's commodity forecasts referred to in the AER's draft decision when viewed as cumulative price changes have almost an identical view of the change in prices over the regulatory period, but different expectations of volatility
the AER's statement in its draft decision that the opportunity that electricity service providers can mitigate the risks associated with changes in material input costs by including hedging strategies or price escalation provisions in their contracts with suppliers of inputs may be theoretically possible, but it is neither common commercial practice, nor a realistic option, and
the AER implicitly adopts the CPI as the nominal material cost escalator but offers no justification, consultation or analysis to support this contention.
Ausgrid endorsed the AER's draft decision to retain construction cost escalators as proposed and agreed with the proposed approach to labour cost escalation.266
D.3 ReasonsWe are not satisfied that Ausgrid's forecast is based on a sound and robust methodology for the reasons outlined below. We therefore consider that it does not reasonably reflect the capex criteria.267 This criteria includes that the total forecast capex reasonably reflects a realistic expectation of cost inputs required to achieve the
263 AER, Draft Decision Ausgrid distribution determination 2015–16 to 2018–19, November 2014, pp. 6-139-140.264 AER, Draft Decision Ausgrid distribution determination 2015–16 to 2018–19, November 2014, pp. 6-139-140.265 Ausgrid, Revised regulatory proposal, p. 114-115.266 Ausgrid, Revised regulatory proposal, p. 115.267 NER, clause 6.5.7(c).
95 Attachment 6 – Capital expenditure | Ausgrid Final decision 2015–19

capex objectives.268 Accordingly, we have not included it as part of our alternative estimate in our final decision on total forecast capex. We are satisfied that zero per cent real cost escalation is reasonably likely to reflect the capex criteria and this is reflected in our alternative estimate.
This conclusion is based on the following:
the degree of potential inaccuracy of commodities forecasts
there is little evidence to support how accurately Ausgrid's materials escalation model forecasts reasonably reflect changes in prices paid by Ausgrid for physical assets in the past and by which we can assess the reliability and accuracy of its materials model forecasts; and
there is insufficient supporting evidence to show that Ausgrid has considered whether there may be some material exogenous factors that impact on the cost of physical inputs.
The weight of the information clearly evidences that there is a real potential for inaccuracy in commodity forecasts. This possibility in conjunction with the lack of evidence in support of Ausgrid's forecasts is such that we cannot conclude with a sufficient degree of certainty that commodity forecasts are either accurate or likely to be accurate. We associate this possibility with a real risk that consumers would pay more than Ausgrid's costs for its physical assets if we were to accept its material cost escalation.
Our decision not to accept Ausgrid's material cost escalation means that Ausgrid's real costs will be escalated annually by no more than CPI under its tariff variation mechanism. As part of its tariff variation mechanism, by default CPI ensures that Ausgrid's increased costs generally will be taken into account. This is not to suggest that CPI measures is a proxy for the movement in the prices of Ausgrid's physical assets. We acknowledge that CPI is directed at measuring changes in the price of a basket of goods and services which account for a high proportion of expenditure by the CPI population group (i.e. metropolitan households); it does not measure the movement in the prices paid for the physical assets purchased by network service providers. However, the CPI provides for a necessary degree of certainty for Ausgrid and consumers that a measured and well understood basis for increasing Ausgrid's costs is reflected in its revenue and prices. By contrast, the degree of possible inaccuracy of commodities' forecasts is such that it is not reasonable to use commodities' forecasts, in addition to CPI, to reflect changes in the prices paid by Ausgrid for assets. Commodities' forecasts do not display the same level of rigour as CPI to satisfy us that consumers should incur additional costs above CPI. In reaching this conclusion, we have had regard to the revenue and pricing principle that Ausgrid should be provided with a reasonable opportunity to recover at least the efficient costs it incurs in providing direct control services. We consider that if we were to apply Ausgrid's material costs escalation, there is possibility that it will recover in excess of its efficient costs. This, combined with an absence of evidence to support a conclusion that it would be in the long term interests of consumers to incur prices that reflected more than the CPI, were fundamental to our conclusion.
268 NER, clause 6.5.7(c)(3).
96 Attachment 6 – Capital expenditure | Ausgrid Final decision 2015–19

In the following discussion, we have addressed each of the specific details raised by Ausgrid in its revised regulatory proposal.269 We have also addressed related points made by AusNet Services in its submission.270
Similar material escalation estimates
We acknowledge that the impact of Ausgrid's proposed capex materials cost escalation for the 2014-19 period is materially comparable to our draft decision that zero per cent real materials cost escalation should apply to Ausgrid's proposed capex program. The relatively low value of Ausgrid's estimate of materials cost escalation for its proposed capex program of $4.28 million reflects the magnitude and sign ((+) or (-)) of its revised material cost escalators shown in table E1 above. Ausgrid's forecast real materials cost escalators have low or negative values, reflecting an environment of generally depressed commodity prices.271
However, in an alternative environment of increasing forecast commodity prices, the impact of real materials cost escalation would be such that Ausgrid's proposed capex would be expected to be significantly higher than Ausgrid's estimate of $4.48 million for the 2014-19 regulatory period.
Moreover, it is our view that on the basis of the degree of the potential inaccuracy of commodities forecasts and lack of evidence to support how accurately Ausgrid's materials escalation model reasonably reflects changes in prices paid by Ausgrid for its physical assets, that we consider zero per cent cost escalation is likely to reasonably reflect a realistic expectation of Ausgrid's cost inputs.
269 Ausgrid, Revised regulatory proposal, p. 113-115.270 AusNet Services, Draft Decisions NSW/ACT Electricity Distribution Determination 2015-19, 12 February 2015.271 See for example RBA: Index of Commodity Prices January 2015 (released 2 February 2015), where the Reserve
Bank of Australia's Index of Commodities Prices has fallen by 20.4 per cent over the previous year in SDR (Special Drawing Rights) terms.
97 Attachment 6 – Capital expenditure | Ausgrid Final decision 2015–19

Link between forecast prices of commodities and asset prices
Ausgrid stated that commodity price pass throughs are commonly embedded in commercial contracts with suppliers and this was demonstrated in its previous regulatory submissions and accepted by the AER in the 2009-14 determination.
In its submission, AusNet Services made a similar point about our past practice. It submitted that evidence of historic materials cost increases would be useful for our assessment of future materials costs but that a lack of this has not precluded us from making regulatory decisions on this matter in the past, and should not prevent us from continuing to properly analyse expert evidence and assess forecast materials costs.272
We recognise that our approach differs in some respects to our past practice. This is as a result of the development of our Expenditure Forecast Assessment Guideline (Expenditure Guideline). As stated in our draft decision, we assessed Ausgrid's proposed real material cost escalation based on our approach as set out in our Expenditure Guideline to assessing the input price modelling approach to forecast materials cost.273 The Guideline was a result of changes made by the AEMC in 2012 as to how we are to determine the total amount of revenue each electricity and gas network business can earn. After extensive consultation with stakeholders in the development of the Expenditure Guideline, we consider that it marks a significant improvement in our approach to expenditure assessment. It reflects both a review of assessment techniques employed throughout our first round of network determinations and how these can be improved (e.g. materials cost escalation). Most importantly, it also sets out a number of new assessment techniques.
As we concluded in our draft decision, we considered that we had seen limited evidence to demonstrate that the commodity input weightings used by service providers to generate a forecast of the cost of material inputs have produced unbiased forecasts of the costs the service providers paid for manufactured materials.274 We considered it important that such evidence be provided because the changes in the prices of manufactured materials are not solely influenced by the changes in the raw materials that are used. Notwithstanding Ausgrid's statement that commodity price pass throughs are commonly embedded in commercial contracts, we consider that Ausgrid's revised regulatory proposal does not include supporting data or information which demonstrates movements or interlink-ages between changes in the input prices of commodities and the prices Ausgrid paid for physical inputs. Ausgrid's material cost input model assumes a weighting of commodity inputs for each asset class but does not provide information which explains the basis for the weightings or that the weightings applied have produced unbiased forecasts of the costs of Ausgrid's assets. For these reasons, there is no basis on which we can conclude that the forecasts are reliable.
In respect of Ausgrid's statement that commodity price pass throughs are commonly embedded in commercial contracts to manage uncertainty and expected materials
272 AusNet Services, Draft Decisions NSW/ACT Electricity Distribution Determination 2015-19, 12 February 2015.273 AER, Draft Decision Ausgrid distribution determination 2015–16 to 2018–19, November 2014, pp. 6-141-142.274 AER, Draft Decision Ausgrid distribution determination 2015–16 to 2018–19, November 2014, pp. 6-141-142.
98 Attachment 6 – Capital expenditure | Ausgrid Final decision 2015–19

price risk, we consider that there is significant potential that the commodity prices reflected in such contracts are likely to differ from the five year commodity escalator forecasts used in Ausgrid's cost input model. Ausgrid has provided no details regarding its contractual arrangements as to the frequency of any pass throughs (i.e. how closely aligned are pass throughs to costs). As such, we consider that there is a high probability for significant variation between the commodity price pass throughs and those proposed by Ausgrid in its cost input model. Evidence of the potential inaccuracy of commodities forecasting is shown in our comparison of commodity forecasts provided by CEG in its December 2013 and December 2014 reports (a period of 12 months) as set out below.
Variation in cumulative revised real materials cost escalation
Ausgrid contend that the commodity forecasts of each of three consultants referred to in the AER's draft decision do not have markedly different views of future commodity prices when viewed as cumulative price changes, although their expectations of volatility differ. Ausgrid has provided figures for aluminium and steel showing the progressive escalation index for each of the consultants (CEG, SKM and BIS Shrapnel).
In its submission, AusNet Services stated that based on the recent forecasts of real price growth for aluminium and steel by CEG, SKM and BIS Shrapnel showing the progressive escalation index for each of the consultants, AusNet Services consider that although experts in materials costs may have differing views of the volatility of commodities prices, their views of average real price growth in relevant materials costs is generally consistent. 275
We have undertaken our own analysis of the cumulative variation of the material input cost escalation forecasts of the three consultants as shown in Table D-2.
Table D-2 Variation in cumulative revised real materials cost escalation forecasts 2014-15 to 2018-19—inputs (per cent)
Aluminium Copper Steel Oil
CEG and SKM
13.7 452.0 8.5 131.8
SKM and BIS Shrapnel
30.2 45.7 18.8 114.3
CEG and BIS Shrapnel
48.1 200.0 8.7 95.5
Source: AER, Draft Decision Ausgrid distribution determination 2015–16 to 2018–19, November 2014, p. 6-113.
As table D-2 shows, although the dispersion between commodities varies, there is still considerable variation in the cumulative forecast prices of commodities between the three consultants. Cumulative variation between the consultants was lowest for steel and greatest for copper. Notwithstanding the magnitude of forecast variation between
275 AusNet Services, Draft Decisions NSW/ACT Electricity Distribution Determination 2015-19, 12 February 2015.
99 Attachment 6 – Capital expenditure | Ausgrid Final decision 2015–19

consultants, the issue of commodity forecast uncertainty remains. That is, even assuming all three consultant's commodity price forecasts for the 2014-19 regulatory period were identical, the degree of the potential inaccuracy of commodities forecasts is significant. The outcome of this analysis is consistent with our view, as set out in our draft decision, that276:
recent studies which show that forecasts of crude oil spot prices based on futures prices do not provide a significant improvement compared to a ‘no-change’ forecast for most forecast horizons, and sometimes perform worse
evidence in the economic literature on the usefulness of commodities futures prices in forecasting spot prices is somewhat mixed. Only for some commodities and for some forecast horizons do futures prices perform better than ‘no change’ forecasts; and
the difficulty in forecasting nominal exchange rates (used to convert most materials which are priced in $US to $AUS). A review of the economic literature of exchange rate forecast models suggests a “no change” forecasting approach may be preferable to the forward exchange rate produced by these forecasting models.
This view is reinforced in our comparison of commodity forecasts provided by the same consultant (CEG) between December 2013 and December 2014. Table D-3 compares CEG's real material cost escalation forecasts for December 2013 and December 2014.
Table D-3 CEG real materials cost escalation forecast December 2013 and 2014—inputs (per cent)
2014–15 2015–16 2016–17 2017–18 2018–19
Aluminium
December 2013
December 2014
Difference (actual)
Difference (%)
4.2
12.9
8.7
207.1%
5.8
1.5
-4.3
-74.1%
5.0
1.0
-4.0
-80.0%
4.2
2.7
-1.5
-35.7%
3.6
2.8
-0.8
-22.2%
Copper
December 2013
December 2014
Difference (actual)
Difference (%)
-0.9
-2.6
-1.7
188.9%
1.1
-1.6
-2.7
-245.5%
0.3
-1.4
-1.7
-566.7%
-0.3
0.8
1.1
-366.7%
-0.7
1.1
1.8
-257.1%
Steel
December 2013
December
0.6
-6.0
3.2
-0.4
0.6
2.0
0.3
0.7
-0.1
1.0
276 AER, Draft Decision Ausgrid distribution determination 2015–16 to 2018–19, November 2014, p. 6-146.
100 Attachment 6 – Capital expenditure | Ausgrid Final decision 2015–19

2014–15 2015–16 2016–17 2017–18 2018–19
2014
Difference (actual)
Difference (%)
-6.6
-1,100.0%
-3.6
-112.5%
1.4
233.3%
0.4
133.3%
1.1
-1,100.0%
Crude oil
December 2013
December 2014
Difference (actual)
Difference (%)
-0.5
-12.1
-11.6
2,320%
2.8
-1.6
-4.4
-157.1%
2.6
1.1
-1.5
-57.7%
2.1
1.0
-1.1
-52.4%
1.8
0.9
-0.9
-50.0%
Construction
December 2013
December 2014
Difference (actual)
Difference (%)
0.5
0.7
0.2
40.0%
0.7
1.1
0.4
57.1%
0.5
-0.2
-0.7
-140.0%
0.4
0.1
-0.3
-75.0%
0.1
0.8
0.7
700.0%
Source: CEG, Escalation factors affecting expenditure forecasts, December 2013, pp. 21, 24, 27 and 31 and CEG,
Updated cost escalation factors, December 2014, pp. 6, 7, 9, 10 and 12.
As table D-3 shows, there is considerable variation between CEG's commodity cost escalation forecasts between its December 2013 and December 2014 reports. Aluminium, copper, steel and crude oil all showed significant forecast variation between the two periods. The largest forecast variation was for crude oil which showed an absolute variation of 11.6 percentage points in 2014-15. Aluminium also showed considerable variations, the largest being 8.7 percentage points in 2014-15. Consistent with the current environment of depressed commodity prices, the majority of the commodity forecast variations exhibited a reduction in forecast prices between 2014-15 and 2018-19 between the December 2013 and December 2014 CEG reports.
Table D-3 also shows that the variation in forecast construction factors between December 2013 and December 2014 was lower than the variation in the forecast commodities factors between the two periods. This is consistent with our view that construction cost escalators can be more reliably and robustly forecast than material input cost escalators, because these are not intermediate inputs and in respect to labour escalators, productivity improvements have been factored into the analysis.
The variation in CEG's commodity cost escalation forecasts between December 2013 and December 2014 demonstrates the significant uncertainty in the modelling of material input cost escalators to reliably and accurately estimate the prices of intermediate outputs used by service providers to provide network services. This supports our view that Ausgrid's forecast real material cost escalators do not
101 Attachment 6 – Capital expenditure | Ausgrid Final decision 2015–19

reasonably reflect a realistic expectation of the cost inputs required to achieve the capex objectives over the next regulatory period.277 Also, the commodity cost escalation forecasts would apply for the duration of the regulatory period, further amplifying the risk of commodity forecast error and subsequent impact on the accuracy of estimating the prices of network assets.
Ausgrid also stated that zero per cent real cost escalation could not be supported as a more reasonable estimate based on its analysis of the cumulative variation of the consultant's commodities price forecasts. We have not accepted Ausgrid's proposed real materials cost escalation because we consider there is likely to be significant uncertainty in forecasting commodity input price movements. We concluded that where we are not satisfied that a forecast of real cost escalation for materials is robust, and we cannot determine a robust alternative forecast, then real cost escalation should not be applied in determining a service provider's required capital expenditure. We accepted that there is uncertainty in estimating real cost changes but we considered the degree of the potential inaccuracy of commodities forecasts is such that there should be no escalation for the price of input materials used by Ausgrid to provide network services. We also consider that the variation in the direction ((+) or (-)) between consultants of forecasts for the same commodity is a reflection of the lack of reliability of commodity forecasts.
In its submission, the Energy Markets Reform Forum (EMRF) stated that the issue of the issue of the volatility and unexpected nature of material forecasts is probably most exemplified in recent times, where the spot price for oil, coal and iron ore have seen massive falls in very short time frames.278
Mitigation of risk
We stated in Ausgrid's draft decision that electricity service providers can mitigate the risks associated with changes in material input costs by including hedging strategies or price escalation provisions in their contracts with suppliers of inputs (e.g. by including fixed prices in long term contracts).279 Ausgrid stated in its revised proposal that whilst such contracts with suppliers of inputs may be theoretically possible, it is neither common commercial practice, nor a realistic option. Ausgrid also stated that pushing escalation risk to suppliers does not insulate an electricity service provider from the risk, but rather crystallises the expected value in the up-front price.
We do not have access to Ausgrid's contracts with its suppliers but we consider there may be some scope for Ausgrid to negotiate contracts such that risks of material input cost increases are shared between the parties. We also consider that Ausgrid is likely to have leverage to negotiate with its suppliers to mitigate the risk of material input cost increases. As we stated in our draft decision, in considering the substitution possibilities between operating and capital expenditure280, we noted that it is open to
277 NER, clause 6.5.7(a).278 EMRF, Submission on NSW DNSPs draft decision and revised proposals, 16
February 2015, p. 24.279 AER, Draft Decision Ausgrid distribution determination 2015–16 to 2018–19, November 2014, p. 6-147.280 NER, cl. 6.5.7(e)(7).
102 Attachment 6 – Capital expenditure | Ausgrid Final decision 2015–19

an electricity service provider to mitigate the potential impact of escalating contract prices by transferring this risk, where possible, to its operating expenditure.
Other factors affecting input cost prices
Our draft decision highlighted a number of factors we consider impact on Ausgrid's input costs, namely:281
1. exogenous factors which may impact on the accuracy and reliability of using commodity forecasts to predict input costs. Such factors include changes in technologies which affect the weighting of commodity inputs, suppliers of the physical assets changing their sourcing for the commodity inputs and the general volatility of exchange rates
2. input cost mitigation, including:
o potential commodity input substitution as the price of a commodity increases relative to other commodities
o the substitution potential between opex and capex when the relative prices of operating and capital inputs change
o the scale of any operation change to the electricity service provider's business that may impact on its capex requirements, including an increase in capex efficiency, and
o increases in productivity that have not been taken into account by Ausgrid in forecasting its capex requirements
3. strategic contracts with suppliers to mitigate the risks associated with changes in material input costs
4. the impact that material input cost escalation has on reducing the incentives for electricity service providers to manage their capex efficiently, and
5. the relevance of material input cost escalation post the 2009 commodities boom experienced in Australia.
We consider that these factors lend further support to our conclusion that Ausgrid's revised regulatory proposal real material cost escalators do not reasonably reflect a realistic expectation of the cost inputs required to achieve the capex objectives over the 2014-19 regulatory period. Although Ausgrid did comment on the issue of strategic contracts with suppliers to mitigate the risks associated with changes in material input costs, it did not address any of the other factors listed above in its revised regulatory proposal.
281 AER, Draft Decision Ausgrid distribution determination 2015–16 to 2018–19, November 2014, pp. 6-145-148.
103 Attachment 6 – Capital expenditure | Ausgrid Final decision 2015–19