capital flows in asia - the national bureau of economic … · · 2013-11-20first, capital flows...
TRANSCRIPT
This PDF is a selection from an out-of-print volume from the National Bureauof Economic Research
Volume Title: Capital Flows and the Emerging Economies: Theory, Evidence,and Controversies
Volume Author/Editor: Sebastian Edwards, editor
Volume Publisher: University of Chicago Press
Volume ISBN: 0-226-18470-6
Volume URL: http://www.nber.org/books/edwa00-1
Conference Date: February 20-21, 1998
Publication Date: January 2000
Chapter Title: Capital Flows in Asia
Chapter Author: Takatoshi Ito
Chapter URL: http://www.nber.org/chapters/c6170
Chapter pages in book: (p. 255 - 296)

Capital Flows in Asia
Takatoshi Ito
8.1 Introduction
It was just a few years ago that capital flows to Asian emerging markets were praised as a model for the rest of the world. A majority of capital flows to Asia took the form of foreign direct investment (FDI) rather than portfolio investment. Although portfolio investment is quick to come and quick to go, it is less likely, many believe, for FDI to reverse direction. Capital flows to Asia increased investment, which in turn contributed to Asian nations’ achieving higher growth. Then high growth performances attracted furthei- capital inflows. A virtuous cycle of capital flows and eco- nomic growth was indeed an important part of the Asian miracle. In the wake of the Asian crisis, however, the praises all but disappeared. Even Asia could not withstand the shocks of volatile capital outflows caused by a sudden change in investors’ expectations.
When the baht was floated on 2 July 1997, it was hardly a surprise for many foreign exchange dealers, treasury officials and central bankers of G7, and academic economists. However, few predicted that the exchange rates would depreciate as much as they actually did or that the crisis would spread to other countries in the region, especially to Korea, in the follow- ing months. Indonesia had been praised by the World Bank until just be- fore the Thai devaluation. There was little sign of trouble in Korea until three months after the baht devaluation. There was no warning of con-
Takatoshi Ito is professor in the Institute of Economic Research at Hitotsubashi Univer- sity, Tokyo, and a research associate of the National Bureau of Economic Research.
Comments from Sebastian Edwards, Martin Feldstein, Carmen Reinhart, Dani Rodrik, Aaron Tornell, and other conference participants were extremely helpful. All views and opin- ions expressed in the paper are the author’s and do not necessarily reflect those of institutions that the author is and has been affiliated with at present or in the past.
255
256 Takatoshi Ito
tagion in the International Capital Markets report of 1997 (published in September 1997). The International Monetary Fund (IMF) financial support package was negotiated and accepted by the Thai authorities in August, followed by Indonesia in November and Korea in December. Af- ter six months, there is no clear assessment whether the contagion has stopped. It turns out that the Asian currency crisis of 1997 is broader and deeper than the Mexican peso crisis of 1994-95.
From the end of June to the end of December 1997, the Indonesian rupiah depreciated more than 140 percent, while the Korean won and the Thai baht depreciated more than 80 percent, vis-a-vis the US. dollar. The Malaysian ringgit and Philippine peso depreciated about 50 percent. Even the Singaporean dollar and Taiwanese dollar depreciated close to 20 per- cent. The least affected were the Hong Kong dollar and Chinese renminbi, both of which kept the nominal exchange rate to the U.S. dollar.
Stock prices in these countries have also plummeted. In the ASEAN-4 (Thailand, Malaysia, the Philippines, and Indonesia) and Korea, stock prices fell by more than one-half from January to December of 1997. Withdrawal of funds from the stock market by foreign investors at least partly explains a simultaneous collapse of stock and currency markets.
These exchange rate and stock price movements reflect the strong out- flow of capital from these Asian countries. Even relatively large foreign re- serves, in terms of import months, were not enough in Thailand and Ko- rea. In the case of Thailand, speculations in the forward market exhausted foreign reserves (in terms of spot-forward net positions) and, in the case of Korea, refusal of rollovers to Korean commercial banks by foreign banks exhausted the “usable” Korean foreign reserves.
The Asian cases of 1997 also suggest a strong contagion. Countries in the region are greatly affected by a currency crisis in any one of them. Although there are similarities among countries in crisis, differences are also pronounced. Common features include external shocks, the yen- dollar exchange rate movement, and internal factors such as a weak bank- ing system and large short-term borrowings. One cannot deny the possibil- ity that a crisis in one country suddenly changes investors’ minds about the prospects of other countries.
The rest of this paper is organized as follows. The next section describes how capital flowed into Asia from 1991 to 1996. Section 8.3 summarizes the crisis of 1997. The similarities and differences between Mexico and Asian countries, and also those among Asian countries, will be shown. In section 8.4, lessons from this episode of currency crises will be drawn. Section 8.5 concludes.

Capital Flows in Asia 257
-1 0
8.2 Capital Flows to Asia
U
8.2.1 Overview
Capital flows to Asia have been a focus of intensive study in the last several years, especially after the currency crisis of the 1997. Figure 8.1 shows the total gross capital inflows-direct investment, portfolio invest- ment, and other capital flows (78bed, 78bgd, 78bid lines of International Financial Statistics, 1MF)-to the ASEAN-4 and China for the period 1976-97. Several characteristics are evident. First, capital flows to these countries increased markedly in the 1990s (until the crisis of 1997). Sec- ond, capital flows to China after 1993 dwarf the flows to other countries. Third, among ASEAN countries, Thailand was the largest recipient of capital flows between 1988 and 1996. However, with the currency crisis, Thailand’s inflows became outflows in 1997. Fourth, capital flows to Indo- nesia and Malaysia were larger than those to other countries from 1982 to 1984, but have declined since then.
Let us focus on net private capital flows in the 1990s and compare Asia with other regions. Table 8.1 shows global capital flows to developing and transition economies. Net private capital flows to emerging markets in- creased sevenfold from 1990 to 1996. In 1990, total capital flows to emerg- ing markets (developing countries and transition economies) were about $30 billion, of which two-thirds went to Asia and one-third to Latin Amer- ica. In 1993, the total amount of capital flows was up to $160 billion, of which Asia and Latin America received about 40 percent each. A majority of flows to Asia took the form of direct investment and an overwhelming portion of flows to Latin America took the form of portfolio investment.
Fig. 8.1 Capital flows to Asia: All types

Table 8.1 Net Private Capital Flows to Emerging Markets (US$ billions)
1990 1991 1992 1993 1994 1995 1996 1997
Emerging markets Total 31.0 126.9 120.9 164.7 160.5 192.0 240.8 173.7
FDI 17.6 31.3 37.2 60.6 84.3 96.0 114.9 138.2 Portfolio 17.1 37.3 59.9 103.5 87.8 23.5 49.7 42.9 Others -3.7 58.4 23.8 0.7 -11.7 72.5 76.2 -7.3
Total 19.1 35.8 21.7 57.6 66.2 95.8 110.4 13.9 FDI 8.9 14.5 16.5 35.9 46.8 49.5 57.0 57.8 Portfolio -1.4 1.8 9.3 21.6 9.5 10.5 13.4 -8.6 Others 11.6 19.5 -4.1 0.1 9.9 35.8 39.9 -35.4
Total 24.9 29.0 30.3 32.6 35.1 62.9 72.9 -11.0 FDI 6.2 7.2 8.6 8.6 7.4 9.5 12.0 9.6 Portfolio 1.3 3.3 6.3 17.9 10.6 14.4 20.3 11.8
1. Asia
la. Affected
Others 17.4 18.5 15.4 6.1 17 1 39.0 40.6 -32.3
Total 10.1 26.1 56.0 64.3 47.4 35.7 80.5 91.1 FDI 6.7 11.0 13.6 12.8 24.3 25.3 36.9 51.2 Portfolio 17.5 14.7 30.4 61.1 60.6 -0.1 25.2 33.5 Others - 14.0 0.3 12.0 -9.5 -37.5 10.5 18.5 6.5
Total 3.5 -2.4 7.2 12.2 18.4 29.8 21.3 34.5 FDI -0.3 2.4 4.2 6.0 5.4 13.2 13.1 18.2 Portfolio 0.0 0.0 0.1 4.5 4.1 2.9 2.9 7.3 Others 3.7 -4.8 2.9 I .7 8.9 13.6 13.6 9.0
Total -1.7 67.4 36.0 30.6 28.5 30.7 28.7 34.3 FDI 2.2 3.5 5.9 5.9 7.9 7.9 7.9 11.0 Portfolio 1.1 20.7 16.3 16.3 13.7 10.2 8.9 10.8 Others -5.0 43.3 8.4 8.4 7.0 12.5 11.8 12.6
2. Latin America
3. Transition economies
4. Other regions
Source: IMF, lnternutionul Cupitul Murkets, September 1998 Notes: “Others” includes short- and long-term credits, loans (not including use of IMF credit), currency and deposits, and other accounts receivable and payable. “Other regions” includes the Middle East, Europe, and Africa.

Capital Flows in Asia 259
The large ratio of portfolio flows to Latin American countries in 1991-93 became a source of instability in the wake of, if not a trigger of, the Mexi- can peso crisis. In 1995, net portfolio investment to Latin America became negative in the wake of the Mexican peso crisis. The total private flows also declined sharply. Capital flows to Latin America recovered sharply only in 1996, contributing to a new record high for the capital flows to emerging markets exceeding $240 billion, of which about one-half went to Asia and one-third to Latin America.
Several reasons for the sharp rise in capital flows from 1990 to 1996 have been pointed out in the literature. First, a declining trend of the in- terest rates in the advanced countries prompted institutional investors to search for high-yield opportunities in many emerging markets.' The pur- suit of high yield was reinforced by the investors' desire to diversify their portfolio internationally. Second, on the recipient side, emerging markets liberalized restrictions on inward investment. Some developing countries introduced economic reforms including financial sectors. Others allowed direct investment into various industries. These factors are analyzed in IMF (1995).
During the episode of strong capital inflows, several host countries com- plained that the volume of capital inflows was too great and was causing adverse side effects, overheating domestic economies to speculative ap- preciation pressure. Thailand and Malaysia in particular received inflows amounting to more than 10 percent of gross domestic product (GDP). Thailand was accumulating foreign reserves as a result of intervention to prevent appreciation even with current account deficits of 8 percent (of GDP) in 1 995796. Without intervention, the currency would have appre- ciated. Intervention was probably only partly sterilized. There are some signs that capital inflows contributed to a real estate boom in Thailand and Malaysia. More detailed discussions on the inflow problem are found in IMF (1995).
The picture changed sharply in 1997. The Thai baht was effectively de- valued in July of that year and the Thai government asked the IMF for as- sistance in August. The currency crisis spread to Indonesia, Malaysia, the Philippines, and Korea in the subsequent months. Private capital fled from these countries. In the end net private capital flows to Asia fell from $1 10 billion in 1996 to a mere $14 billion in 1997. Net portfolio investment to Asia became negative in 1997 for the first time since 1990. If the affected countries-Indonesia, Korea, Malaysia, the Philippines, and Thailand-
1. An influence of the U.S. interest rate on global capital flows to the emerging markets was pointed out in the Mexican crisis of 1994-95. The declining interest rate in the United States from 1992 to 1994 prompted a large volume of capital flows to Latin America and other emerging market economies. The rapid interest rate hike in the United States from February 1994 to the summer of 1994 is thought to be one of the many reasons for capital outflows from Mexico, which finally caused the currency devaluation in December 1994.

260 Takatoshi Ito
were singled out, the net private capital that fled was on the order of $1 1 billion. Even during the crisis, FDI to Asia did not decline from 1996 to 1997. This reflects both investors’ confidence in the long-run prospects of Asian economies and host countries’ willingness to be acquired in hard times. It is also notable that portfolio flows declined sharply in both the Latin American countries in 1995 and the Asian economies in 1997. How- ever, the drop in portfolio flows was much more dramatic among Latin American countries in the aftermath of the Mexican crisis.
In terms of total net private capital flows, the decline among Asian countries from 1996 to 1997 was much more dramatic than the decline for Latin American countries from 1994 to 1995. There are two factors to consider. First, in the Mexican crisis of 1994-95, the crisis was effectively stopped by the IMF packages to Mexico at the end of January 1995 and to Argentina in March 1995. In contrast, the Asian currency crisis spread from Thailand to Indonesia to Korea. This contributed to a much larger decline in net capital flows to Asia in 1997 than to Latin America in 1995. Second, in both crises, bank lending and credits were sharply reversed (see “Others” line in table 8.1) among Asian economies.
8.2.2 Scenario: Virtuous and Vicious Cycles
Net capital inflows make it possible for a host country to run current account deficits without running down foreign reserves. They increase the resources that the host country can use. In Asia, capital inflows were mostly used for investment. The saving rate is already high in many Asian countries, especially in Malaysia and Singapore, but the investment rate is even higher. Investment, both FDI and domestic companies and govern- ment projects, is believed to have contributed to higher growth. Higher growth in turn invites more investment.
One of the factors that helped exports and economic growth of the East Asian countries in the last two decades was a long-term trend of yen ap- preciation. There are at least two ways yen appreciation contributes to economic growth of the Asian economies. First, as the yen appreciates, Asian products become more price competitive against Japanese goods in the world markets, especially in the Japanese and U.S. markets. For ex- ample, Korean shipbuilding, steel, and semiconductors are direct competi- tors to Japanese counterparts in the world market. Although they may not compete directly in the same quality category, they indirectly compete in the same product category. Hence, yen appreciation promotes business chances for manufacturing companies based in East and Southeast Asian economies.
Second, yen appreciation has convinced many Japanese companies of the benefits of moving production facilities out of Japan. Looking for pro- duction sites where high-quality workers are available at low wages, Jap- anese manufacturing companies shifted production abroad, mainly to

Capital Flows in Asia 261
Asia.2 Technological transfers with Japanese management helped the Asian countries increase productivity in manufacturing. Some of the facil- ities in Asia became productive enough to export to the United States, Japan, and the rest of the world.
Hence, the low interest rate and yen appreciation were external shocks to the Asian economies in 1994-96. Yen appreciation produced more Jap- anese direct investment in Asia. Foreign direct investment from Japan and other advanced countries provided the host countries with technology transfer and export capability. Asian exports grew at the rate of 20 to 30 percent. Low interest rates in the industrial countries including Japan pro- duced the portfolio flows to the Asian economies. Those portfolio flows were used for investment rather than consumption. Asian economies were totally confident in their export-led growth strategy and the World Bank’s “East Asian miracle” gave a seal of approval.
The currency “stability” vis-a-vis the U.S. dollar was instrumental in bringing in direct and portfolio investment. The investors had confidence in Asian countries that were virtually pegged to the U.S. dollar. The cur- rency risk was considered by the investors and borrowers to be minimal, and the credit risk was also considered minimal due to high economic growth. The interest rates in the Thailand were higher than in the United States, and that invited bank deposits and short-term bond investment.
Growth in one Asian country is further amplified by growth in other countries in the region, as countries are connected by trade and investment flows. The “multiplier” of growth among countries in the region was con- sidered to be rather high.
Large curreqt account deficits in some countries were a source of con- cern for some economists. But high economic growth made it possible to assert that the “grow-out-of-debt” scenario would work. The low total productivity growth pointed out by Young (1992, 1994) and Krugman (1994) raised some doubts about the sustainability of high growth. But industrialization and sophistication of the industries were impressive enough to erase these doubts. Essentially, high growth invited more capital inflows, which produced even higher exports and economic growth. This is the virtuous cycle, as schematically depicted in figure 8.2. Until 1996, almost all observers were confident that the virtuous cycle would work for the foreseeable future.
The virtuous cycle was suddenly interrupted in 1996-97. Exports from most Asian countries sharply declined for several reasons. The yen depre- ciation from 1995 to 1997 reduced Asian goods’ competitiveness. Slow growth produced lower economic growth. However, even before the crisis, there had been growth recession: From 1995 to 1996, the growth rate in
2. Japanese manufacturing companies also shifted their production to North America, partly to avoid trade conflicts and partly to prepare for NAFTA.

262 Takatoshi Ito
Low Interest Rate Yen Appreciation
Foreign Reserves Increase
Fig. 8.2 A , Capital inflow phase, 1990-95; B, Capital outflow phase, 199698
Thailand was down from 8.8 percent to 5.5 percent, in Malaysia from 9.5 percent to 8.6 percent, in Singapore from 8.7 percent to 6.8 percent, and in Korea from 8.9 percent to 7.1 percent. On the other hand, growth was hardly affected in Indonesia, the Philippines, China, and Taiwan.
The growth rate of Japanese FDI and portfolio flows to Asia was slow- ing down due to the yen depreciation, but capital flows to Asia continued to be strong because of increased flows from Europe and the United States in 1996. In fact, there was no significant change in FDI and capital flows until the devaluation in July 1997.
Japanese FDI to Asia, mostly assembly plants of finished products, has stimulated industrialization. Factories built by Japanese FDI, however, continue to require imports of parts and semifinished goods from Japan. The domestic production of parts has become a challenge for Asian coun- tries, which have recorded large trade deficits against Japan. (An exception is Indonesia, which records surpluses against Japan.)
Once the currency was destabilized in July-August 1997 among ASEAN countries, capital inflows to the region were cut substantially. As discussed above, net private capital flows to the Asian region in 1997 be- came only one-tenth that of 1996. Most of the outflows took place in

Capital Flows in Asia 263
B External Factors
Yen Depreciation
Current Account Balance I C a p i t a l O u t n o w I
Currency Depreciation
Other Countries
speculative attack
IForeign Reserves Decrease
Fig. 8.2 (cont.)
banking flow reversal. All the logic of the virtuous cycle worked in reverse. The vicious cycle (see fig. 8.2) set in after September 1997: Capital out- flows caused the currency to depreciate; depreciation made the real econ- omy and the banking sector weaker; weak economies made investors pes- simistic; and pessimism encouraged further capital outflows.
8.2.3 FDI to Asia
Foreign direct investment to Asia has increased steadily during the 1990s. Table 8.2 shows the FDI flows to selected Asian countries and econ- omies measured by host countries’ a~thori t ies .~
From table 8.2 (panel A), it is evident that all Asian countries signifi- cantly increased FDI inflows during the 1990s. The increases are most
3. Precise definitions of FDI are different from country to country. Some countries include reinvestment, others do not; some countries count both the foreign investment and domestic partners’ contributions in the case of joint ventures; most countries are on the reporting basis, while China is on the disbursement basis; and for Singapore and Malaysia, only manu- facturing sectors are included, while for other countries, all sectors are included. For precise definitions, see the comparative table of definitions in Economic Planning Agency (1998, 80). Therefore, numbers are not exactly comparable across countries.

Table 8.2 Gross FDI Inflows (US$ millions)
A. Time-Series of FDI Inflows
1990 1991 1992 1993 1994 1995 1996 1997
China Korea Taiwan Singapore Indonesia Thailand Malaysia Philippines Vietnam
3,500 803
2,302 1,224 8,751 8,029 6,517
96 1 512
4,400 1,396 1,778 1,425 8,778 4,988 6,202
778 1,147
1 1,000 895
1,46 1 1,678
10,323 10,022 6,975
284 1,926
27,500 1,044 1,213 1,966 8,144 4,285 2,443
520 2,615
33,800 1,317 1,63 1 2,833
23,724 5,875 4,321 2,374 3,722
37,500 1,941 2,925 3,423
39,915 16,492 3,652 1,871 6,524
42,400 3,203 2,461 4,054
29,931 13,124 6,812
967 8,497
45,300 6,971 4,267 3,979
33,833 10,616 4,018 1,993 5,550
B. Cross-Section by Source Country, 1995
Korea Taiwan Hong Kong China Singapore Malaysia Philippines Thailand Indonesia 1995 1994 1995 1995 1995 1994 1995 1995 1995 Total
Total 1,914.4 1,523.9 566 37,520.5 4,852.4 4,242.5 1,871 16,492 39,914.7 108,897.4 United States 644.9 293.7 198 3,083 2,075.8 473.6 621.9 2,582.2 2,770.5 12,749.6 Japan 418.3 391 5 14.1 3,108.5 1,152.5 667.1 101.2 7,891.4 3,792 18,036.1 Germany 44.6 91.5 386.4 247.6 0.9 174.7 1,344.6 2,290.3 United Kingdom 86.7 29.2 -85.5 914.1 35.5 125 301.8 6,322.1 7,728.9 France 35.2 15.5 287 18.9 26.2 498.4 881.2
Netherlands 170.1 79.9 34.7 114.1 12.1 5.6 360 776.5 Switzerland 9.8 -39.6 63.5 13.2 100.3 44.9 192.1 Other EU 0 37.2 345.5 382.7 EU total 346.4 216.1 -90.4 2,028.4 13.2 334.1 131.5 689.8 8,938.3 12,607.4 Others 504.8 623.1 -55.7 29,300.6 1,610.9 2,767.7 1.010.4 5.328.6 24.413.9 65.504.3
Italy 263.3 20 49.6 22.8 355.7
Source: Panel A: Economic Planning Agency, Japan, Asiun Economies 1998 (in Japanese), 1998. Panel B: Economic Planning Agency, Krizui Bunsrki (Econumic Analysis), no. 156, “Applied General Equilibrium Analysis of Current Global Issues-APEC, FDI, New Regionalism and Environment” (by Kanemi Ban et al.), March 1998. Notes: Based on each country’s direct investment figures. China’s figure is based on disbursement basis. Others are on the approval basis.

Capital Flows in Asia 265
significant in China, where there was a fifteenfold increase in six years (1990 to 1996, before the East Asian crisis). Other countries-Korea, Sin- gapore, Indonesia, Thailand, and Vietnam-saw from twofold to fourfold increases in the first six years of the 1990s.
Panel B of table 8.2 shows the source countries of FDI to Asia in 1995. Japan provided the most FDI to the total of nine Asian countries (the four newly industrializing economies [NIEs], ASEAN-4, and China). In some countries (Korea, Taiwan, Singapore, and the Philippines), the United States is the leading FDI source country, while for others, Japan is the leader. Europe collectively was investing into Asia in an amount similar to the U.S. investment. However, for most Asian countries, the impact of FDI is dictated by the behavior of Japanese and U.S. investors.
As the largest investor in the region, the role of Japan in FDI into Asia is crucial. The data are collected by the Japanese Ministry of Finance and are compiled on a voluntary (formerly mandatory) reporting basis. Table 8.3 shows changes in the Japanese FDI to the nine Asian economies in the 1 9 9 0 ~ . ~ The Japanese FDI to the world was below $5 billion a year un- til 1980. It grew to more than $10 billion in 1984. Only two years later, the amount had doubled, exceeding $22 billion. It reached $67 billion in 1989. In the beginning of the 1990s, FDI in fact declined to $36 billion before rising again to about $50 billion. Out of the total FDI in the postwar period-$617 billion-more than half took place in the 1990s. The largest recipient is Indonesia, closely followed by Hong Kong and China. Japan invested in the NIEs (Korea, Taiwan, Singapore, and Hong Kong) during the 1980s as well as the 1990s (the ratio of FDI investment in the 1990s to all the other years is below 60 percent). In contrast, more than 60 percent of Japanese FDI to Thailand, Malaysia, and the Philippines was made in the 199Os, reflecting both the rapid rise of these economies and the sharp rise in Japanese investment in them. At the beginning of the 1990s, Indo- nesia, Thailand, and Malaysia were the preferred destinations of Japanese FDI. On average Indonesia has received more than Y150 billion (about $1.3 billion) annually in the 1990s. By the mid-l990s, however, China had become the top host of Japanese FDI. In 1995, China received more than Y430 billion (about $4 billion) of Japanese FDI.
Foreign direct investment is often said to be a preferred form of invest- ment for host countries. (Direct investment is usually defined as a pur- chase of more than 10 percent in equities of a particular company.) Com- pared with bank credits, bank deposits, or bonds, it is more difficult and costly to withdraw investments that have become factories and other real assets. Moreover, direct investment brings foreign management and tech-
4. These numbers do not necessarily agree with host countries’ data presented in table 8.2, panel B. Possible reasons are mentioned in n. 3.

Table 8.3 FDI from Japan, Time-Series across Countries (US% billions)
1990-97 1951-97 1990s 1990 1991 1992 1993 1994 1995 1996 1997 Total Total (“h)
Total 56,911 41,584 34,138 36,025 41,051 51,478 Asia 7,054 5,936 6,425 6,637 9,699 12,380 Malaysia 725 880 704 800 742 576 Singapore 840 613 670 644 1,054 1,187 Thailand 1,154 807 657 578 719 1,242 Indonesia 1,105 1,193 1,676 813 1,759 1,608 Philippines 258 203 160 207 668 719 Hong Kong 1,785 925 735 1,238 1,133 1,149 Taiwan 446 405 292 292 278 456 Korea 284 260 225 245 400 450 China 349 579 1,070 1,69 1 2,565 4,485
Source: Annual Report of International Finance, 1999, Tokyo: Ministry of Finance.
48,101 11,634
573 1,117 1,406 2,419
560 1,489
522 416
2,515
54,025 12,194
792 1,826 1,869 2,517
524 696 450 443
1,989
363,312 71,958
5,792 7,951 8,432
13,089 3,299 9,150 3,141 2,723
15,243
617,206 112,423
8,298 13,664 11,701 23,524 4,620
17,215 5,427 6,577
17,716
58.9 64.0 69.8 58.2 72.1 55.6 71.4 53.2 57.9 41.4 86.0 -
Notes: FDI from Japan in this table is on the “reporting basis” of cross-border investment. It may not match with actual disbursement because some reported investment may be canceled and some will be carried out without reporting (no penalty). New FDI financed locally or reinvestment from past FDI is not covered by this table. FDI numbers are announced in yen after 1995. They are converted to the U.S. dollar using the average exchange rate of the year.

Capital Flows in Asia 267
80000
70000
60000
50000
40000
30000
20000
10000
0
+- Yen-Dollar Rare
1976 1977 1978 1979 1980 1981 1982 1983 1984 1985 1986 1987 1988 1989 1990 1991 1992 1993 1994 1995 1996 1997
Fig. 8.3 FDI and the yen-dollar rate
nology transfers, which are expected to contribute to improving industrial- ization levels of a host country.
8.2.4 FDI Determinants
According to the virtuous cycle hypothesis, FDI from Japan is moti- vated by optimistic expectations of the prospects for the Asian economies and yen appreciation. The Japanese firms moved production to Asian economies as the yen appreciated. The level of the yen-dollar rate influ- ences the flow of FDI from Japan to Asian countries. Figure 8.3 shows the correlation between the level of the yen-dollar rate and FDI from Japan to Asian co~ntries.~ This shows the rapid rise of FDI from 1986 to 1989, which appears to be a lagged response to the sharp yen appreciation (drop in the yen-dollar rate) from 1985 to 1988.
Foreign direct investment flows from Japan to Asia, in aggregate or in individual countries, can be analyzed in a more rigorous manner. For ex- ample, the yen-dollar exchange rate is an important motivation for FDI flows from cost-conscious Japanese manufacturing firms. For each indus- try, there seems to be a threshold value of the yen such that, when the firm judges that the yen is persistently above the threshold, it moves its production facility to Asia. It may take a year to convince the firm that the yen is “persistently” above a certain level, so the yen-dollar rate is lagged one period. But in this way generally the yen-dollar exchange rate can be understood to determine the locations of production facilities for
350
300
250
200
150
100
50
0
5. The Asian countries in this illustration include the four NIEs, ASEAN-4, China, and other broadly defined Asian countries. The category follows “Asia” in the Ministry of Fi- nance data source.

268 Takatoshi Ito
Japanese exporters. The most labor-intensive portion of the production process is often outsourced first, after which the semifinished or finished products are then exported back to Japan or other countries.
Japanese FDI is also motivated by the prospect of the growth of Asian economies, as some of the products are intended to be consumed locally. Japanese auto makers have set up production, sometimes in joint ventures, in Thailand, Indonesia, and Malaysia, for example, mainly to sell autos in those countries. This is done primarily to avoid high tariffs on auto im- ports.
With these considerations, the log of FDI flow from Japan to Asia is regressed on the log of the yen-dollar exchange rate (lagged one year) and growth rate, in aggregate or the individual countries. Unfortunately, the FDI data are only available annually, and the sample period is from 1976 to 1997. Table 8.4 shows regression results.
In the aggregate specification, the log of aggregate FDI flows from Japan to eight Asian countries (four NIEs and ASEAN-4), FDI8, is re- gressed on the log of the yen-dollar exchange rate of year t - 1 and the average growth rate of these eight countries. The negative coefficient of the yen-dollar rate implies that FDI from Japan to the eight Asian econo- mies tends to increase as the yen appreciates (drop of the yen-dollar rate). The positive coefficient of the growth rate implies that an increase in growth rates of the Asian economies tends to increase FDI from Japan to these economies.
For individual countries, the log of aggregate FDI flows from Japan to an Asian country is regressed on the log of the yen-dollar exchange rate of year ( t4 - l), and the growth rate of year (t). Results in general confirm effects of the yen-dollar exchange rate and the optimistic expectation, driven by actual growth rate, on the FDI flows from Japan. In each econ- omy, either the yen or the growth rate is statistically significant (at least at 5 percent, except for Taiwan, where there is significance only at 10 per- cent) with expected signs. In Korea, the Philippines, and Malaysia, both variables are significant.
8.2.5
When foreign capital flows in as direct investment, it has at least two positive effects on the economy. First, it adds to the domestic saving to be- come funds for investment. Second, it often comes with technology spill- overs.
There are many studies of the impact of FDI on the host country.6 Re- cent studies, such as Belderbos, Capannelli, and Fukao (2000) and Urata
Effects of FDI on the Economy
6. For an overview of the theory of FDI and its surge in the 1980s, see Graham and Krugman (1991, 1993). A seminal work on Japanese FDI is Kojima (1978).

Table 8.4 Determinants of FDI
Growth Dependent (of respective R2
Variable Constant Trend Log(Yen(t - 1)) economy) D. W.
Log(FDI8)
Log(FD1Kor)
Log(FD1Tai)
Log(FD1Hon)
Log(FD1Sin)
Log(FD1Tha)
Log(FDI1nd)
Log(FD1Phi)
Log(FDIMa1)
12.439 (3.02) [0.003] 10.842 (2.50) [0.013] 4.534
(1.32) [0.186] 12.854 (2.98) [0.003] 15.820 (2.76) [0.006] 6.520
(1.52) [0.129] 5.673
(0.65) [0.515] 30.05 (4.38) [O.OOO]
-8.392 (- 1’.37)
[0.172]
0.058 (1.38) [O. 1681 0.024
(0.58) [0.013] 0.147
(4.33) [O.OOO] 0.056
(1.33) [O. 1841 0.022
(0.46) [0.643] 0.164
(4.00)
0.057 (0.66) [0.509]
-0.101 (-1.70)
[O ,0001
[0.089] 0.260
(4.54) [O.OOO]
-1.111 (-1.71)
-1.335 (-1.83)
-0.397 (-0.67)
[OSOO] - 1.425 (-2.03)
-1.915 (- 1.99)
-0.880 (- 1.25)
[0.2 131 -0.156 (-0.1 1)
[0.912]
[0.087]*
[0.068]
[0.042]**
[0.047]**
-4.604 (-3.98)
[O.OOO]*** 1.804
(1.80) [0.072]*
0.068 (2.41) [0.015]** 0.128
(7.18)
0.069 (1.87) [0.06 11 * 0.010
(0.18) [0.855]
[O.OOO]***
-0.027 (- 1.38)
[0.169] 0.146
(4.26)
0.145 (2.37)
[O.OOO]***
[0.012]** -0.060 (-1.95)
[0.051]* 0.132
(4.27) [O.OOO]* **
0.86 1.65
0.74 1.55
0.81 0 .59
0.68 0.96“
0.81 1.44
0.92 2.02
0.36 1.95
0.86 2.16
0.84 1.81
Note: Sample period, 1976:l-1996: 1. Estimations are executed by RATS with the “Rnbusterrors” op- tion, using a consistent covariance matrix allowing for heteroskedasticity and autocorrelation (LAGS = 2), when necessary.
FDI8 = the sum of FDI from Japan to the four NIEs and ASEAN-4. Log(Yen) = log of the yen-dollar rate, average of the year. Growth rate = growth rate of the respective economy of the equation. In the case of FDI8, the
growth rate is the weighted average of growth rates of the eight economies, with nominal GDP in dollars as weights, in percent.
‘Sample period 1977:l-1996: 1. *Significant at the 10 percent level. **Significant at the 5 percent level. ***Significant at the 1 percent level.
t-statistics are in parentheses. Significance levels are in brackets.

270 Takatoshi Ito
and Kawai (2000), show the significant technological spillovers to the sub- sidiaries in Asia from the Japanese manufacturing firm^.^
The growth rate of the Asian economy is regressed on the level of FDI in year (t - l), the change in the yen-dollar exchange rate, Japan’s growth rate, and the U.S. growth rate. Yen appreciation (drop in the yen-dollar rate) will enhance competitiveness of Asian exporters that compete with Japan’s exporters. Therefore the change in the exchange rate will promote exports of the Asian economies, contributing to their economic growth. The coefficient of the change in the yen-dollar exchange rate is expected to be negative. The two most important markets for most Asian economies are Japan and the United States. Therefore, the income effects of Japanese and US. economic growth should appear in the economic growth of Asian economies as positive coefficients on Japan’s economic growth rates and US. economic growth rates.8
Our main interest here is whether the lagged FDI will increase economic growth rate, controlling for the exchange rate and the economic growth rates of the two most important trading partners. The specification that only FDI of year (t - 1) is included assumes a high dissemination of tech- nology transfer and a temporary boost of productivity. The statistically significant positive coefficient on the FDI term is indicative of growth- enhancing technology transfers.
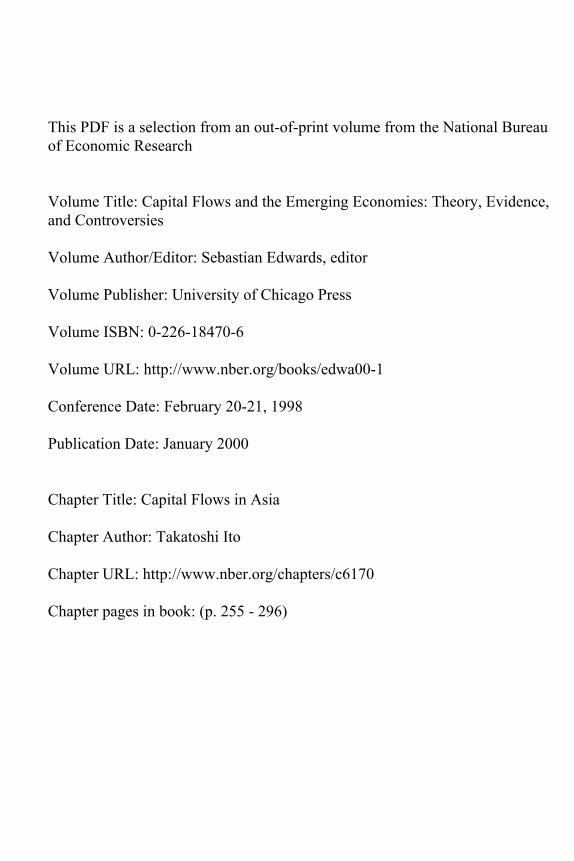
Table 8.5 shows the regression results. For the aggregate of the eight econ- omies, results are consistent with the theoretical predictions mentioned above. The first row shows the result for the aggregate of the eight Asian economies (the four NIEs and ASEAN-4). The weighted average of growth rates of the economies tends to increase when the level of FDI from Japan
7. Belderbos, Capannelli, and Fukao (2000) examined the determinants of local contents among 157 Japanese electronics manufacturing subsidiaries in Asia. Local contents, the sum of in-house value added, and local outsourcing are considered to be a key for benefits to host countries, as they yield technology transfers. The authors found that local contents are lower in greenfield subsidiaries, subsidiaries of R&D-intensive parents, and export-oriented subsidiaries in ASEAN-4 and China. In contrast, local contents are higher in export- oriented subsidiaries located in the NIEs in those subsidiaries that have a higher domestic sales ratio, and in subsidiaries of a vertical keiretsu firm with strong intrakeiretsu supplier relationships. Urata and Kawai (2000) attempt to measure the intrafirm spillovers by com- paring total factor productivity changes in the parent and subsidiaries. They found that capability to absorb technologies, reflected in educational level and in experiences in indus- trial production, in the host countries is very important for them to absorb technology trans- fer from foreign firms, both in the forms of intrafirm technology transfer and local technol- ogy transfers.
8. The major channel to growth from the exchange rate, Japanese growth, and U.S. growth is considered to be through exports. The “East Asian miracle” (World Bank 1993) was very much a story of tremendous export growth. In the 1980s and the first half of the 1990s, many economies in Asia achieved sustained export growth of 20 percent or more. Export promotion, instead of import protection, was a successful incentive. All Asian countries, which were agrarian economies only decades ago, rapidly modernized manufacturing firms and began to export more sophisticated manufactured goods. See Ito (1998b) for a detailed analysis of Asian export deceleration in 1995-96.

Table 8.5 Impact of FDI on Growth Rate ~
Dependent R2
Variable Constant Log(FDIx(t - 1))” YenChg Japangr USgr D. W.
Asia8gr 0.422 (0.20) [0.838]
Korea 0.603 (0.13)
Taiwan 5.598 (2.95) [0.003]
Hong Kong 16.945 (4.68) [O.OOO]
Singapore 8.925 (2.79) [0.005]
Indonesia 9.173 (1.24) [0.215]
[0.212]
(continued)
0.589 (2.30)
0.827 [0.021]**
(1.25) [0.212]
-0.241 (-0.77)
-1.813 (-4.05)
-0.056 (-0.14)
[0.890] -0.3.52
(-0.35)
[0.442]
[O.OOO]***
[0.720]
-0.058 (-3.25)
-0.080 (-2.36)
-0.1 16 (-3.99)
[0.001]***
[0.018]**
[O.OOO]*** -0.035
(-0.66)
0.073 (1.17) [0.238] 0.021
(0.73) [0.460]
[0.512]
0.361 (3.02) [0.003]*** 0.445
(1.98) [0.048]** 0.474
(2.15) [0.032]** 0.113
(0.40) [0.686]
-0.216 ( -0.55)
-0.175 (-0.72)
[O.SSS]
[0.469]
0.237 0.14 (3.41) 1.79 [0.001]*** 0.468 0.14
(1.19) 1.89 [0.235] 0.497 0.51
(4.18) 2.74
0.268 0.25 (0.98) 2.15 [0.327] 0.097 0.17
(0.57) 1.32 [0.566] 0.141 0.21
(0.54) 1.22 [0.590]
[O.OOO]** *
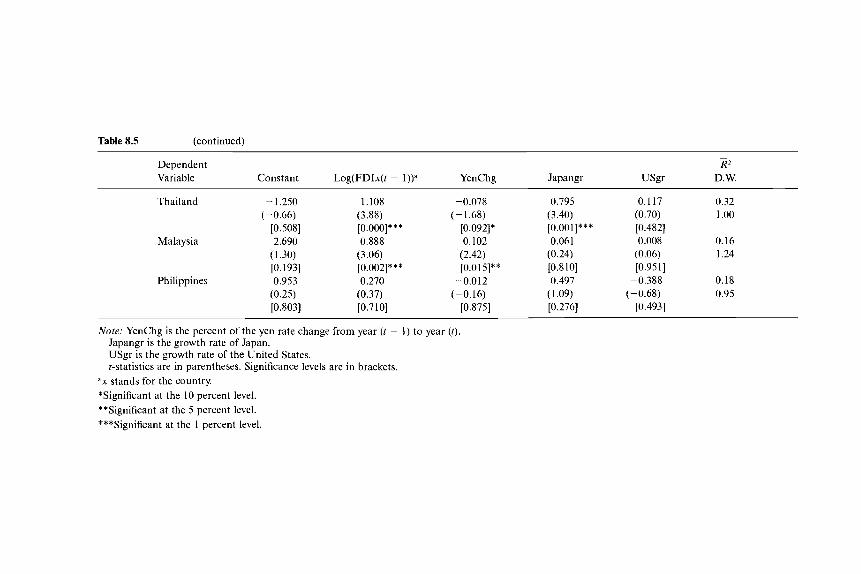
Table 8.5 (continued)
Dependent Variable Constant
Thailand - 1.250 (- 0.66)
[0.508] Malaysia 2.690
(1.30) [0.193] 0.953
(0.25) [0.803]
Phi 1 i p p i n e s
Log(FDIx(t - 1)y
1.108 (3.88)
0.888 (3.06)
0.270 (0.37) [0.710]
[O.OOO]***
[0.002]***
YenChg
-0.078 (-1.68)
[0.092]* 0.102
(2.42)
-0.012 (- 0.16)
[0.875]
[0.015]**
~
R2
Japangr USgr D.W.
0.795 0.117 0.32
[0.001]*** [0.482] 0.061 0.008 0.16
(0.24) (0.06) 1.24 [0.810] [0.951] 0.497 -0.388 0.18
(1.09) (-0.68) 0.95 [0.276] [0.493]
(3.40) (0.70) 1 .oo
Note: YenChg is the percent of the yen rate change from year ( t - 1) to year (t). Japangr is the growth rate of Japan. USgr is the growth rate of the United States. t-statistics are in parentheses. Significance levels are in brackets. stands for the country.
*Significant at the 10 percent level. **Significant at the 5 percent level. ***Significant at the 1 percent level.

Capital Flows in Asia 273
in the preceding year is high, implying the boost to productivity associated with FDI. The growth rate becomes higher if the yen appreciates (a neg- ative sign denotes yen appreciation) from the preceding year. Higher growth in Japan and the United States helps the growth of these econo- mies. Estimates are that a 10 percentage point appreciation in the yen in- creases the average Asian growth rate by 0.5 percent in these economies. A 1 percentage point increase in Japanese and U.S. growth rates increases the average Asian growth rate by 0.4 and 0.2 percent respectively.
For individual economies, results are not as prominent as the aggregate equation. The FDI effect on growth is evident for Hong Kong, Thailand, and Malaysia. The yen-dollar exchange rate seems to influence growth in Korea, Taiwan, Thailand, and Malaysia. In these economies, a 10 percent- age point appreciation in the yen boosts the economic growth rate by 1 percent. Japanese economic growth has a positive spillover effect on Ko- rea, Taiwan, and Thailand, while U.S. economic growth has a positive ef- fect only on Taiwan. Regressions for Singapore, Indonesia, and the Philip- pines did not produce any meaningful result.
8.2.6 Portfolio Flows
Portfolio investment consists of equities, bonds, and other securities in- vestment. Bank deposits and lending and cross-border transfers between bank branches are usually classified as “other types” of capital flows. Table 8.6 shows three types of gross capital flows-FDI, portfolio, and other-to Korea, ASEAN-4, and China, The values are in terms of their percentage of GDP so that the relative impact to the economy can be as- sessed. Between 1994 and 1996 (that is, after the Mexican crisis and before the Asian crisis), these countries received a large amount of capital inflows, but composition was very different across countries.
China and Malaysia are the two countries that encouraged and received FDI. Their portfolio inflows are minimal or even negative in the case of Malaysia. Except for Malaysia in 1992 and 1993, other types of capital in- flows were also very small.
Thailand received the most capital inflows measured as a percentage of GDP between 1993 and 1996. The total capital inflows were about 10 percent of GDP between 1993 and 1996. Most notably, portfolio inflows and other types of inflows were higher than FDI. Since portfolio or other types of capital flows are considered to be much more mobile than FDI, this feature was an ominous sign of the coming currency crisis, at least in retrospect. The precise mechanism of movement of “hot money,” however, is debatable.
In the case of the Mexican crisis in December 1994, it has been argued that sudden and massive outflows in the days after the “surprise” 15 per- cent devaluation is to blame for bringing down the peso by almost 50 percent in one week. Mostly, short-term securities investment, especially

Table 8.6 Different Types of Capital Flows as a Percentage of GDP
Korea Thai 1 and Indonesia Philippines Malaysia China
Year FDI POR OTH FDI POR OTH FDI POR OTH FDI POR OTH FDI POR OTH FDI POR OTH
1990 1991 1992 1993 1994 1995 1996 1997
0.31 0.09 2.17 2.85 -0.04 8.17 1.03 0.40 0.79 2.38 2.04 -0.08 9.77 1.27 0.24 1.61 1.60 1.89 0.83 5.81 1.39 0.18 3.17 -0.44 1.44 4.36 5.38 1.27 0.21 2.14 3.58 0.95 1.72 6.82 1.19 0.39 3.04 4.70 1.23 2.43 11.53 2.16 0.48 4.37 5.07 1.29 1.98 6.55 2.72 0.64 2.78 -1.88 1.97 2.80 -13.13 2.18
-0.09 -0.01 -0.07
1.14 2.19 2.04 2.20
- 1.23
3.29 1.20 -0.11 3.56 5.44 3.62 1.20 0.28 5.00 8.31 3.47 0.43 0.29 5.55 8.89 1.38 2.28 1.65 4.52 7.80
-0.87 2.48 1.41 5.56 5.99 1.20 1.99 3.53 4.10 4.73 0.11 1.82 6.14 7.63
-0.21 1.51 0.67 5.18
-0.59 -0.21 0.90 0.00 0.28 0.35 1.03 1.08 0.14 1.11
-1.92 5.46 2.31 0.08 -0.85 -1.10 11.59 4.58 0.61 -0.10 -2.28 -2.64 6.25 0.73 -0.28 -0.50 3.72 5.14 0.10 0.73
4.93 0.29 0.16 4.91 0.85 0.94
~ ~ ~~
Source: IMF, International Financiul Stutistics, 1998. Notes: FDI = foreign direct investment, line 78bed.
POR = portfolio investment, 78bgd. OTH = other capital flows, 78bid.

Capital Flows in Asia 275
tesobonos, by mutual funds and institutional investors were quickly with- drawn. Large portfolio investments have the potential to cause such a sud- den reversal of capital flows when investors’ assessments of the country change.
8.2.7 Bank Lending
In order to understand further what kind of money is invested, cross- border bank lending is investigated. Table 8.7, panel A, shows the balance of cross-border bank lending from industrial countries to developing countries. Total liabilities and short-term liabilities of recipient countries, as of end-June 1997, are shown in the first two columns. The breakdown of total lending, by countries of lending banks to each borrowing country is shown. The general tendency is for Japanese and European banks to lend to Asian countries, while U.S. and European banks lend to Latin American countries. Among the Asian countries, Japanese banks have higher shares in Thailand (54 percent), Indonesia (39 percent), and Ma- laysia (36 percent), while European banks, collectively, have more than 40 percent of shares in China, India, Malaysia, and Taiwan. Among the Latin American countries, U.S. banks’ share is between 20 and 28 percent, while that of European banks is about 50 percent.
As a percentage of GDP, total bank liabilities are highest in Thailand (0.38 I), followed by Malaysia, Indonesia, and Korea. These countries have higher ratios of bank liabilities to GDP than any Latin Americancountries.
Bank lending behavior is supposedly different from securities invest- ment. Although they are short term, bank loans are often made with the implicit underetanding of rolling over indefinitely. If the interest rate spread is maintained, bank lending is usually rolled over. However, once banks suspect that credit (default) risk has become critical, any interest rate spread may not keep the bank lending.
In order to assess the vulnerability to potential problems with bank lending, such as a sudden refusal of roll-overs, short-term lending to the foreign reserves is examined. The ratio of the stock of short-term liabilities to foreign reserves represents one possible measure of this type of vulnera- bility. If the ratio is higher than one, it implies that if all banks refuse to roll over the short-term loans, foreign reserves will be exhausted. Among Asian countries, the ratio exceeds one in Korea, Indonesia, and Thailand. These three countries needed IMF assistance later in 1997. In retrospect, this indicator would have been effective in predicting the Asian currency crisis. Among Latin American countries, the ratio exceeds one in Argen- tina and Mexico.
In table 8.7, panel B, the changes in these bank liability indicators from 1993 to 1997 are shown. For Asian countries, bank liabilities tended to increase for both the total liability to GDP ratio and the short-term liabil- ity to foreign reserve ratio. The exception is China for the latter indicator.

Table 8.7 Cross-Border Bank Lending
A. International Bank Lending to Selected Emerging Markets, June 1997
By Maturity By Nationality of Lending Banks Short-Term Total Liability Short TotallGDP Liabilit y/Foreign (US$ millions) (Up to 1 year) Japan United States Europe (96) Reserves
China Indonesia Korea Malaysia Philippines Taiwan Thailand Asia
Argentina Brazil Chile Colombia Mexico Latin America
57,922 58,726
103,432 28,820 14,115 25,163 69,382
389,441
44,445 71,118 17,573 16,999 62,072
251,086
30,137 34,661 70,182 16,268 8,293
21,966 45,567
242,273
23,891 44,223
7,615 6,698
28,226 13 1,304
32 39 23 36 15 12 54 32
4 7 8 8 7 6
5 8
10 8
20 10 6 8
23 23 23 20 28 24
48 38 35 44 48 57 28 40
59 45 51 59 43 50
0.071 0.265 0.213 0.293 0.162 0.092 0.381
0.158 0.096 0.146 0.105 0.185
0.234 1.629 2.106 0.609 0.726 0.243 1.411
1.303 0.772 0.447 0.674 1.187

B. Comparison of 1993 and 1997
Short-Term Total Liability/ Liability/ Japanese Share U S . Share European Share
GDP Foreign Reserves (“A) (“/o, (“/.I
1993 1997 1993 1997 1993 1997 1993 1997 1993 1997
China Indonesia Korea Malaysia Philippines Taiwan Thailand Asia
0.047 0.071 0.509 0.234 40 0.192 0.265 1.622 1.629 55 0.119 0.213 1.397 2.106 30 0.166 0.293 0.210 0.609 41 0.108 0.162 0.499 0.726 17 0.069 0.092 0.175 0.243 27 0.207 0.381 0.733 1.411 55
40
32 39 23 36 15 12 54 32
2 8
10 10 44 16 8 9
5 8
10 8
20 10 6 8
36 27 33 34 32 41 24 34
48 38 35 44 48 57 28 40
Argentina 0.107 0.158 1.193 1.303 7 4 32 23 49 59 Brazil 0.118 0.096 0.930 0.772 17 7 17 23 43 45 Chile 0.227 0.146 0.557 0.447 9 8 33 23 42 51 Colombia 0. I40 0.105 0.433 0.674 17 8 28 20 31 59 Mexico 0.138 0.185 1.029 1.187 7 7 35 28 42 43 Latin America 10 6 28 24 45 50
Source: Bank for International Settlements, The Maturity, Sectoral and Nationality Distribution of International Bank Lending, Basle, January 1998. Notes: Europe includes Austria, Belgium, France, Germany, Italy, Luxembourg, Netherlands, Spain, and the United Kingdom. Total liability/GDP and short-term liability/foreign reserves are June 1993 and June 1997; the country shares are December 1993 and June 1997.

278 Takatoshi Ito
The cases of Thailand and Malaysia stand out in their increases in the latter indicator. Asian countries relied on bank lending for their eco- nomic development.
For Latin American countries, movements are mixed. Between 1993 and 1997, some countries increased the total liability to GDP ratio and the short-term liability to foreign reserve ratio, while other countries de- creased these ratios.
The salient feature of the country share movement is the rapid expan- sion of European banks in both Asia and Latin America. In aggregate, European banks increased their share of lending to Asia by 6 percentage points, while the Japanese banks decreased lending by 8 points. In the case of Latin American countries, the European banks increased their share from 45 percent to 50 percent, while both the Japanese and U.S. banks decreased their shares by 5 percent. If the lending boom to Asia was to be blamed, which is a controversial “if,” then the European banks were the ones that seemed to lay the last brick in Asia.
In China, Indonesia, Korea, Malaysia, and Taiwan, European banks increased their share markedly at the expense of Japanese banks, while in the Philippines, European banks increased their share at the expense of the United States. Only in Thailand did Japanese banks maintain a sig- nificant share.
8.2.8 Too Much Capital Flows?
As explained in the beginning of this section, capital flows, especially FDI, are in general part of a ‘‘virtuous cycle” in developing countries. However, when the volume of capital flows, especially short-term flows, be- comes too large, monetary policy becomes difficult. (See Khan and Rein- hart 1995 for one of the earliest studies of this topic. See also IMF 1995.) Capital flows to Asian countries have been sometimes massive, sometimes exceeding 10 percent of GDP.
When the size of capital inflows becomes larger than current account deficits, there is an appreciation pressure on the currency. Having adopted the de facto dollar peg, many Asian countries have resisted the apprecia- tion pressure by intervening in the foreign exchange market. The stability in the exchange rate was considered to be important for nurturing ex- porting industries and inviting FDI inflows. As intervention continued, levels of foreign reserves among Asian countries soared in the 1990s. Inter- vention can be sterilized or left unsterilized. Unsterilized intervention will increase the monetary base, resulting in lower interest rates. The stimulat- ing effect of lower interest rates may cause inflation if the economy is al- ready at the full capacity of production, which is often the case for emerg- ing market economies that attract massive capital inflows.
In order to avoid inflation, intervention can be sterilized. Sterilized in- tervention is a combination of foreign exchange intervention and domestic

Capital Flows in Asia 279
open market operation to keep the monetary base constant (in levels or in proportion to GDP in a growing economy). Sterilized intervention will, in theory, keep the interest rate level. In practice, however, the interest rate may rise. Suppose the initial capital inflows were in the form of FDI. The domestic end of sterilization is most likely done in the short-term money market. Then, the short-term interest rate may increase, while the long- term interest rate will decline. The higher short-term interest rate will in- vite more capital inflows in the form of portfolio investment. Hence, steri- lized intervention may increase capital inflows.
Of course, a story related in terms of a policy decision tree is only a re- flection of the well-known economics principle: It is impossible for a small, open economy to have free capital flow, a fixed exchange rate, and inde- pendent monetary policy. The usual theoretical answer to this impossibil- ity problem is to float the exchange rate. A more heterodox answer is to adopt some mild forms of capital controls on short-term inflows, such as raising the reserve requirements on bank deposits by nonresidents or imposing withholding taxes on short-term instruments held by nonresi- dents. Many emerging markets did in fact adopt market-based capital con- trols (see IMF 1995).
There is an important footnote to the impossibility principle. Reducing fiscal deficits (or increasing fiscal surpluses) will ease the overheating pressure brought about by capital inflows. A contractionary impact of fis- cal surpluses, such as tax increases or expenditure cuts, is mitigated by the monetary stimulus of unsterilized intervention. In fact, several Asian countries, such as Thailand, adopted this option in the beginning of the 1990s. Many Asian countries did run fiscal surpluses.
The lessons on the danger of too much capital inflow seem to have been learned from the Mexican peso crisis of 1994-95. The governments of many emerging markets have been vigilant about monitoring capital flows. The Asian countries, however, did run into a problem in 1997. The next section analyzes what happened to capital flows in the midst of the cur- rency crisis in Asia.
8.3 The Currency Crisis of 1997
8.3.1 Overview
The Asian currency crisis has been analyzed in several papers and books (see Goldstein 1998; Krugman 1998; Montes 1998; Radelet and Sachs 1998, 2000). Various reasons for the currency crisis were suggested, with three factors identified as the major causes. First, the de facto dollar peg as the currency regime contributed to generating the crisis. China and Hong Kong have maintained the nominal fixed exchange rate to the U.S. dollar. Before the crisis, Thailand, Singapore, Malaysia, and Korea all

280 Takatoshi Ito
adopted a currency basket system. However, they in fact had a high weight on the U.S. dollar in the basket (see Frankel and Wei 1994), so the ex- change rate regime was de facto dollar pegged. In the period of yen ap- preciation, Asian exporters enjoy high growth contributing to an overall high economic growth, while in the period of yen depreciation, Asian economies’ performance becomes less impressive. In fact, the yen depreci- ation from 1995 to 1997 was partly the reason for the lower growth of Asian economies (except the Philippines) in 1996-97. Moreover, the dollar peg with high interest rates invited in short-term portfolio investment. In- vestors and borrowers mistook the stability of the exchange rate for the absence of exchange rate risk.
Second, a weak bank and nonbank sector complicated the currency crisis. Key industries of many Asian countries relied on bank lending for their fund needs. Banks in Korea were lending to industries that were deemed to be important from the point of view of industrial policy. Many Indonesian banks, including one or two state banks, had been seriously burdened by nonperforming loans. Thai finance companies (nonbanks) had large nonperforming loans from an asset inflation (1992-93) and de- flation (1996-97). A weak banking system becomes a signal to foreign speculators to attack the currency. When attacked, the central bank could employ a high interest rate policy to encourage capital to stay (or come in). But weak banks would make this policy counterproductive for the domestic banking policy. Knowing this, speculators are more willing to attack a country with a weak banking system. The banking crisis thus causes the currency crisis. Also, many bank liabilities and corporate debts were denominated in U.S. dollars. This was a reflection of the dollar peg. However, when the currency is devalued, dollar-denominated liabilities would become much larger in terms of the local currency. The currency crisis thus often causes the banking crisis. In this sense, the currency crisis and banking crisis are “twin crises” (Kaminsky and Reinhart 1996).
Third, short-term liabilities were mounting in some of the Asian econo- mies, most notably in Thailand, Indonesia, and Korea (recall tables 8.6 and 8.7). This short-term capital can be withdrawn quickly to put pressure on the exchange rate. Withdrawal of funds started slowly in Thailand in 1996. Once the Thai baht was floated, neighboring countries were on the alert list of investors. Withdrawal of short-term funds intensified after Sep- tember. The refusal to roll over bank loans particularly put pressure on the Korean won.
In addition to these common factors, there are idiosyncratic factors for individual countries. Speculative attack by hedge funds was a trigger for the Thai de facto devaluation, while Indonesia did not intervene so that foreign reserves were ample when it asked for a “precautionary” IMF program. The burst bubble was the major cause for weak financial systems

Capital Flows in Asia 281
in Bangkok, while reasons other than bubbles explain the weak banking system in Seoul and Jakarta. Controls on capital accounts had been elimi- nated for a long time in Indonesia, while there were significant capital controls in Korea. Thailand went through financial liberalization several years prior to the currency crisis. Political conflicts were a major problem in Indonesia, while Thailand and Korea had a solid political foundation.
More detailed analysis of mine can be found elsewhere (It0 1998a, 1998b, 1998~). The rest of this paper is devoted to a concise summary of the observations, emphasizing the role of capital flows and offering some new perspectives. What is new in this paper is to emphasize the common factors and idiosyncratic factors of Asian currency crisis. But, first, back- ground of the crisis must be described.
8.3.2
Several changes in the Asian economic performance occurred in 1996. First, exports precipitously declined in most Asian countries. Export growth rates in 1994 and 1995 had reached 20 to 30 percent in China, Ko- rea, Singapore, Thailand, Malaysia, and Philippines. Then, in 1996, ex- ports of all countries went down sharply. Thai export growth, for example, slowed from more than 20 percent to virtually zero within a year. Korea and Taiwan suffered from a recession in the semiconductor industries. Figures 8.4 and 8.5 show the remarkable decline in exports of NIEs and ASEAN-4 in 1996-97. (More detailed analysis of export deceleration is found in Ito 1998b.) Second, because the region depended heavily on ex- ports, the decline in exports substantially brought down economic growth.
Shift of the Wind in 1995-96
+ Hong Kong 50 -A- Singapore - Taipei, China
40
30
20
10
0
-1 0
-20 '
Fig. 8.4 Export (%value) growth rates 1981:l-972, NIEs Source: IFS.

282 Takatoshi Ito
Fig. 8.5 Export ($value) growth rates: 1981:l-97:2, ASEAN-4 Source: IFS.
Third, in some countries, such as Thailand, stock prices started to decline. All of these changes were signaling the end of a long boom. Capital flows, which are sensitive to yields, started to reverse direction.
As exports declined and economic growth slowed, a virtuous cycle turned into a vicious cycle (recall fig. 8.2).
8.3.3 Thailand
The crisis first hit Thailand, which seemed most vulnerable by tradi- tional measures. In 1996, the current account deficit of Thailand had reached 8 percent of GDP, the same level that brought Mexico into a cur- rency crisis in 1994. The export growth rate plummeted from 20 percent per year to virtually zero, although a decline in the economic growth rate was only modest, from about 9 percent to 7 percent. In retrospect, it can be seen that Thailand had experienced a bubble economy from 1993 to 1995. The economy was overheated and stock prices had soared in 1993, as capital flows increased, especially in the form of portfolio flows. (See Ito 1998c and Nukul Commission 1998.)
Note that a major slow down in exports had also occurred back in 1984-85. Recall that the dollar appreciated. This supports the working hypothesis described in the previous sections that dollar appreciation (yen depreciation) is bad for Asian exports and growth.
After the asset bubble burst, banks in Thailand had nonperforming loan problems. In particular, finance companies faced serious problems and borrowed from domestic and foreign banks to finance their property

Capital Flows in Asia 283
loans. The weakness in the financial system, along with large current ac- count deficits, invited speculative attacks on the baht.
The speculative attack came in several waves, between December 1996 and the spring of 1997, before the massive speculative attack in May 1997. For one week in May, some investors sold the baht in the spot market and others in the futures (or swap) market. The central bank intervened to defend the dollar peg regime, which had been in place since 1984. The dollar peg was considered to be instrumental to winning the confidence of foreign investors. The net result for the central bank position was to lose the foreign reserves in forward position. Although the announced, on-balance figure of the foreign reserve was close to $30 billion, it would be revealed later that the amount of off-balance dollar selling futures con- tracts exceeded $20 billion. Although the market knew that there were central bank interventions in the futures (swap) market, as a result of de- fending the baht from speculators, the precise number had not been known. When the central bank decided to float the currency on 2 July, the market was surprised only by the timing.
In the case of the Mexican crisis, the Mexican government did not an- nounce the decline in foreign reserves for almost ten months. This non- transparent practice was criticized because market discipline could not work. This was one of the major reasons that the IMF introduced the Special Data Dissemination Standard (SDDS). In the Thai crisis, the for- eign reserves figures were correctly disclosed every month with a one- month lag for statistics collection in compliance with SDDS. However, it was off-balance liability that was not disclosed to the market and that finally brought down the fixed exchange rate peg.
After the baht was floated, it immediately depreciated by 15 percent. Within a few weeks, Malaysia, the Philippines, and Indonesia either floated or significantly widened the band. Central banks of these countries intervened occasionally, but the amount of intervention was limited.
Although the rate was floated, the baht problem was not over. The Bank of Thailand was carrying large forward positions, and commercial banks had large short-term liabilities that could not be rolled over in the follow- ing months. The market knew that the Bank of Thailand was carrying forward contracts, but the amount was not accurately known. Thailand sought liquidity assistance from Japan and the United States in vain. In May the Bank of Thailand introduced capital controls that prohibited res- idents from lending money to nonresidents in offshore markets. The off- shore rate deviated from onshore rates in May and June, but deviations became very small after the rate was floated. By the end of July, Thailand decided to ask for assistance from the IMF.
There were two kinds of problems in putting together an IMF program for Thailand. First, the amount of a support package would have to be large, and the limits on standby loans might not be enough. Second, it was

284 Takatoshi Ito
not clear what kind of conditionality should be mandated. After intense negotiations, Thailand agreed to IMF conditions that included tightened monetary and fiscal policy, as well as concrete action programs for finance companies. The assistance program also included contributions from Ja- pan and other Asian countries. The IMF’s portion was $4 billion (close to 500 percent of quota for Thailand), while the other Asian countries, in- cluding Japan, pledged an additional $13.2 b i l l i ~ n . ~ It was a quite unusual arrangement in that the Japanese Export-Import Bank provided a parallel loan of $4 billion with the IMF. The agreement was signed on 20 August 1997.
As mentioned above, one of the problems that Thailand experienced during the crisis was the fragile financial system, in particular nonper- forming loan problems in the finance companies. In June, the worst sixteen finance companies were suspended. An additional forty-two finance com- panies were suspended before the IMF agreement was signed in August.
The IMF program did not put an end to the depreciation of the baht. As a result, other currencies in the region became further affected.
The loss of foreign reserves was a major concern in Thailand. The termi- nation of foreign bank lending was also a cause and effect of depreciation. Capital flows out of Thailand were acute (recall fig. 8.1), and they took place mostly in terms of bank lending withdrawal (recall table 8.6).
8.3.4 Indonesia
Indonesia was thought to be doing well with macroeconomic manage- ment. The exchange rate had flexibility (slow depreciation vis-a-vis the U.S. dollar on the slide schedule with a band around it) and intervention was restrained to conserve foreign reserves. Indonesia’s fundamentals were better than those of neighboring countries. Toward the end of Sep- tember, however, the Indonesian rupiah depreciated suddenly, and it was decided in Jakarta to seek IMF assistance. This decision was a little sur- prising in that there was little evidence that the central bank needed to build up foreign reserves at that point. Also, problems in the Indonesian economy lie in the real sector, namely, inefficient big national projects and nontransparent family businesses of the president. The IMF conditions would look quite different from those of other plans.
On 5 November, the IMF program was agreed upon. At the same time, coordinated intervention by other Asian central banks was carried out to help prop up the value of the rupiah. A most remarkable aspect of the IMF program for Indonesia was to close down (not just suspend) sixteen banks with questionable assets. One bank was owned by President Su- harto’s son. Depositors were paid off only up to a certain amount. There
9. The IMF’s contribution of $4 billion, or 500 percent of the quota allowed to Thailand, was considered to be the limit at that time, set by the precedent of the Mexican package.

Capital Flows in Asia 285
was also no announcement about the health of the remaining banks. This caused a run on some of weaker banks.
One area of uncertainty that was not completely resolved was the size of corporate debts to foreigners. Many firms borrowed from foreign banks (in foreign currency denomination), but the total amount was not known at the time. The IMF, the World Bank, and the Asian Development Bank (ADB) decided to extend $23 billion to Indonesia. The United States, Ja- pan, Singapore, and Asian countries pledged a “secondary line” of support.
Having an IMF program, however, did not stop the depreciation of the rupiah. Ironically, a real currency crisis came after the IMF program was signed. In mid-December, a rumor of President Suharto’s poor health, based on his canceling an appearance at an international conference, pushed down the rupiah. Also, whether structural reforms would be car- ried out was questioned, especially after a bank that had been closed was replaced by a new bank managed by the same person at the same site. After President Suharto announced a new fiscal year budget on 6 January, which was more than 40 percent larger than the previous year’s budget, the rupiah was sold heavily. The rate broke the level of 10,000 rupiahs to the dollar and went down to the point where its value was just one-sixth of what it was a year earlier. The rupiah’s movement was much more in- fluenced by political news. In the process of rupiah depreciation, foreign investors’ role was not as heavy as capital flight.
8.3.5 Korea
Korea was initially thought to be remote from a crisis. Its fundamentals had turned around for better earlier in 1997. The exchange controls were reasonably stringent, so that it would be difficult to speculate against the won. Nonresidents cannot borrow the won. The Korean won did not de- preciate more than 20 percent until the end of October. However, suddenly in November, the currency came under heavy pressure. Foreign banks that had lent to Korean banks decided to withdraw funds by not rolling over their lending. The Korean central bank reportedly lent foreign reserves, as foreign currency deposits, to commercial banks, which could not raise funds without paying prohibitively high risk premiums (Korean premium).
Korea decided to ask for IMF assistance toward the end of November, and obtained it on 4 December. Negotiation was carried out in an unu- sually fast manner. The amount of assistance was also unusually large. The IMF would provide $21 billion, supplemented by $10 billion from the World Bank and $4 billion from ADB. The United States, Japan, and other countries would provide additional $36 billion, bringing the total to $57 billion.
One of the most critical elements in the Korean crisis was how much for- eign banks would roll over their lending to Korean banks. It was estimated that short-term liabilities would be close to $100 billion, if guarantees pro-

286 Takatoshi Ito
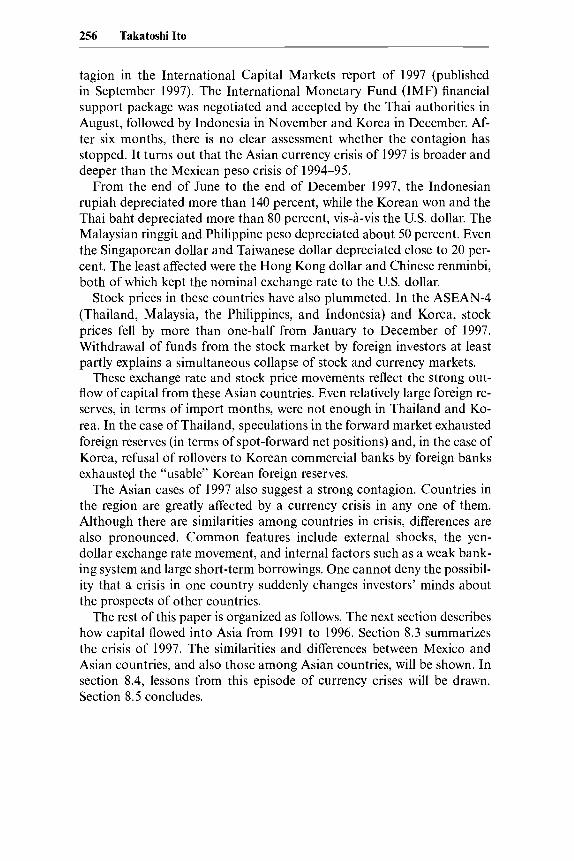
vided by the Korean corporations to their subsidiaries abroad are counted. Table 8.8 summarizes how Korea’s external liabilities have changed.
Pressure on the won did not stop with the IMF program of 4 December. Acute problems in liquidity developed for Korean banks. It was not until 24 December, when administrative pressure from monetary authorities of G7 was applied on commercial banks to maintain lending to Korean banks, that the crisis was contained.
Recall that the short-term bank liability to foreign reserve ratio was highest in Korea (table 8.7). The Korean currency crisis, unlike that in Thailand or Indonesia, can be understood in terms of a “bank run” (Ra- delet and Sachs 1998, 2000).
8.3.6 Contagion
The experience of the Asian currency crises in 1997 certainly exemplifies the process of contagion. In the case of the Mexican peso crisis, the “te- quila effect” did not succeed in changing the exchange rate regime, despite pressures on Argentina and Asian countries. In the case of Asian currency crises, however, depreciation spread to a large number of countries.
An interesting question for further research is whether a contagion model, such as that by Eichengreen and Rose (1996), would have predicted such spillovers at the point that Thailand decided to float. How much increase in probability of devaluation of the rupiah, the ringgit, and the Philippine peso would the Thai devaluation of 2 July have indicated? When investigated closely, a contagion process was more complicated than just spillovers from Thailand. Through the summer and up to September, the Thai baht was the currency most depreciated, followed by the rupiah, the peso, and the ringgit. From October to November, however, the de- grees of depreciation for the baht and the ringgit were about the same, nearly 40 percent. Up to November, the Korean won depreciated only about 15 to 20 percent. As the crisis in Seoul deepened, the won depreci- ated further. This process indicates that the direction of spillovers changes over time. This was not the case in a simple devaluation-led crisis like Mexico’s in 1994.
Figure 8.6 shows the changes in the currencies of the NIEs and ASEAN-4. From July to October, the baht was the most depreciated cur- rency. Other ASEAN currencies were following the movement of the baht. The magnitude of the peso, ringgit, and rupiah depreciation was about one- half that of the baht depreciation until September 1997. Then the rupiah suddenly depreciated at the end of September. From September to No- vember, the rupiah movement seemed to influence other currencies. The Korean won depreciated sharply in December, reflecting the liquidity prob- lem mentioned above. The Indonesian rupiah depreciated further in Janu- ary 1998. Therefore, sources of contagion seem to shift from one country to another, as political and economic shocks occur in various countries.
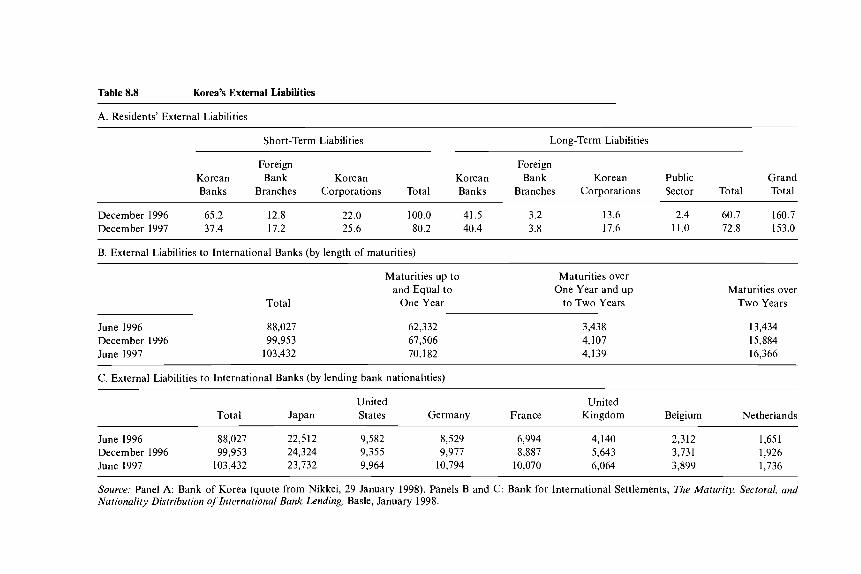
Table 8.8 Korea’s External Liabilities
A. Residents’ External Liabilities
Short-Term Liabilities Long-Term Liabilities
Foreign Foreign Korean Bank Korean Korean Bank Korean Public Grand Banks Branches Corporations Total Banks Branches Corporations Sector Total Total
December 1996 65.2 12.8 22.0 100.0 41.5 3.2 13.6 2.4 60.7 160.7 December 1997 37.4 17.2 25.6 80.2 40.4 3.8 17.6 11.0 72.8 153.0
B. External Liabilities to International Banks (by length of maturities)
Total
Maturities up to and Equal to
One Year
Maturities over One Year and up
to Two Years Maturities over
Two Years
June 1996 December 1996 June 1997
88,027 99,953
103,432
62,332 67,506 70,182
3,438 4,107 4,139
13,434 15,884 16,366
C. External Liabilities to International Banks (by lending bank nationalities)
United United Total Japan States Germany France Kingdom Belgium Netherlands
June 1996 88,027 22,512 9,582 8,529 6,994 4,140 2,312 1,651 December 1996 99,953 24,324 9,355 9,977 8,887 5,643 3,731 1,926 June 1997 103,432 23,732 9,964 10,794 10,070 6,064 3,899 1,736
Source: Panel A: Bank of Korea (quote from Nikkei, 29 January 1998). Panels B and C: Bank for International Settlements, The Maturity, Sectoral, und Nurionality Distribution oflnternational Bunk Lending, Basle, January 1998.

5' E
- -
Lm
-
NW
gV
Im
.l
w(
DO
0
1 997
/01/
01
1997
/01/
15
1997
/01/
29
8
1997
/02/
12 -
1997
/02/
26 -
1997
/03/
12 -
19
97/0
3/2G
-
1997
/04/
09 -
1997
/04/
23 -
1997
/05/
07 -
19
97/0
5/21
-
1997
/06/
04 -
1997
/06/
18 -
1997
/07/
02 -
19
97/0
7/16
-
1997
/07/
30 -
19
97/0
8/13
-
1997
/08/
27 -
19
97/0
9/10
-
1997
/09/
24 -
1997
/10/
08 -
1997
/10/
22 -
1997
/11/
05 -
1997
/11/
19 -
1997
/12/
03 -
19
97/1
2/17
-
1997
/12/
31 -
y",,-
1998
/01/
14 -
~ _..
. 9-
1998
/02/
11 -
,-2>
1998
/01/
28 - '"\
1998
/02/
25 -
1998
/03/
11 -
,. 19
98/0
3/25
-
L.
2
..., #
1997
/01/
15 -
19
97/0
1/29
-
1997
/02/
12 -
19
97/0
2/26
-
1997
/03/
12 -
19
97/0
3/26
-
1997
/04/
09 -
1997
/04/
23 -
1997
/05/
07 -
1997
/05/
21 -
1997
/06/
04 -
1997
/06/
18 -
1997
/07/
02 -
19
97/0
7/16
-
1997
/07/
30 -
1997
/08/
13 -
1997
/08/
27 -
1997
/09/
10 -
1997
/09/
24 -
1997
/10/
08 -
1997
/10/
22 -
1997
/11/
05 -
1997
/11/
19 -
1997
/12/
03 -
9 8 fi'
ij
i
:
I:
i:
1.
:.
1997
/12/
31
1998
/01/
14
1998
/01/
28
1998
/02/
11
1998
/02/
25 -
1998
/03/
11 -
1998
/03/
25 - - -
-
-

Capital Flows in Asia 289
8.4 Lessons: Capital Flows and Reversal
Many reasons for capital inflows and their subsequent reversal have been suggested. Depending on which reason is accepted, the prescription to prevent a future crisis will be different. In this section, I review some of the current thinking on the issue.l0
8.4.1 Moral Hazard
A first hypothesis is that capital flows to Asia can be characterized as the result of moral hazard. Some observers have pointed out that the im- plicit guarantee of deposits and financial institutions by emerging markets invites too much capital flows (Goldstein 1997, 1998; Krugman 1998; Mc- Kinnon and Pill 1996). Deposits that pay higher interest rates than the ad- vanced countries are attractive to investors, especially when the economy is growing fast and the exchange rate stability appears to be secured. Mex- ico before 1994 and Thailand before 1997 are prime examples. The host countries received capital that could not be put into productive use with long-run returns exceeding the interest rates paid to creditors. In Mexico this resulted in a consumption boom and in Thailand a real estate boom. Investors remained complacent just before the crises because they felt their investments were protected by the government guarantee. In the case of Mexico, a large part of capital inflows were explicitly guaranteed be- cause they were government securities (tesobonos). In the case of Thai- land, capital flows that rapidly rose in 1994 to 1997 were through its off- shore banking facility (BIBF). Investors must have felt that deposits were implicitly guaranteed because the government would bail out banks, as in advanced countries.
Moreover, investors may be reassured by the IMF's handling of Mexico in 1995, because investors were not asked to involuntarily roll over their investment. Borrowers were also mistaken. They might not have invested prudently. They tend to go for a high-risk, high-return project. If the proj- ect fails, the government would bail out the bank, and if the project suc- ceeds, the bank benefits. The situation is well known in the deposit insur- ance literature. Explicit and implicit guarantees caused the moral hazard among investors and borrowers.
If moral hazard is the problem, there are two general solutions. First, prudential regulation on borrowers to avoid building the dangerous posi- tions is important. Second, burden sharing on lenders, once a problem develops, would deter future irresponsible lenders.
One problem with this argument, however, is the timing of the crisis. Why the capital inflows reversed in 1997 so dramatically cannot be ex-
10. I owe thanks to Dani Rodrik for suggesting to me some of the policy implications included in this section.

290 Takatoshi Ito
plained adequately from moral hazard. If the blanket guarantee was to be believed, there was no reason for investors to flee so quickly.
Another problem with the moral hazard explanation is the cross- sectional differences. Why were Indonesia and Korea affected most se- verely, while the Philippines and Malaysia seem to have escaped the worst of the crisis? The blanket guarantees were the same for Asia, and other macroeconomic fundamentals were similar. The moral hazard argument alone would not explain the cross-sectional differences.
One way to combat the moral hazard problem is to ask the involved parties to take losses from easy lending and borrowing. Many observers point out the problem of moral hazard on the part of borrowers. However, overborrowing is overlending. How could the IMF ask “lenders,” for ex- ample, those who held tesebonos in the Mexican crisis or who invested in fifty-eight companies in Thailand, to take losses? In fact, the IMF pack- ages are usually strict enough that countries do not accept them willingly; the penalty of mismanagement has been severe, negative economic growth for Mexico and Thailand after the crisis. There is little scope for moral hazard on the part of a country to mess up the economy (at least for a decade or two after one crisis). The IMF did not “bail out the country” in Mexico’s case because the money was repaid, as it will be in the Asian cases. What IMF packages bail out in Mexican-type crises is actually a group of lenders to the countries, by recovering the asset values (currency, stock, tesobonos, Brady bond, and other bond prices). If Mexican teso- bonos holders had been asked to take some losses in the Mexican peso crisis, they might not have extended so much credit to some of the Asian countries that got into trouble in 1997. It would be difficult to devise a program to ask for a fair share of burdens on lenders without causing an international systemic risk, unless the IMF intervenes swiftly.
Another solution is to strengthen prudential regulations. Thailand re- laxed banking regulations and capital controls without strengthening bank supervision. Finance companies were outside of the more strict bank regulation. A lack of policy contributed to easy lending. Korean merchant banks were outside the bank regulation that restricted large lending to a single customer. A lesson here is that financial deregulation has to be accompanied by strengthening bank and nonbank supervision.
8.4.2 Bank Run
Radelet and Sachs (1 998, 2000) argue that the Asian currency crises were caused by sudden shifts in investors’ behavior. Those countries that relied on short-term capital inflows were caught in the liquidity crisis when investors refused to roll over lending. In the case of the Mexican crisis of 1994-95, it was the short-term government securities (tesobonos) that became a focus of the rollover problem. In Thailand and Korea, domestic

Capital Flows in Asia 291
banks could not obtain enough dollars to repay short-term borrowings when rollovers were refused. Banks were not insolvent by any standard. It was a liquidity problem, or a problem of bank run (Diamond and Dyb- vig 1983).
When the currency crisis of a country is analyzed as a bank run, inves- tors’ behavior of withdrawing funds from the country does not have to be irrational. Given that other creditors are withdrawing funds, it is rational for an investor to withdraw funds. In fact, it is rational to be first in line.
The situation in Korea in November and December 1997 fits the bank run model best. Korean banks faced an acute liquidity shortage in US. dollars and the monetary authorities helped them by providing the foreign reserves (as deposits to commercial banks). When foreign reserves were exhausted, there was no choice but to ask for the IMF’s assistance.
If the bank run is the sole reason for the crisis, establishing the interna- tional lender of last resort would be a good solution. Suppose that the IMF was the international lender of last resort. The IMF would inject foreign reserves, and the central bank would help commercial banks un- wind the liability positions, when rollovers are refused. In fact, having the lender of last resort would convince lenders not to refuse to roll over. This is a straightforward application of the role of domestic central banks in international circumstances. If this analogy to the domestic central bank is applicable, the IMF lending to help prevent a bank run should not be tied to stringent conditionality, and disbursement must be quick and front loaded.
The reservation about such an international lender of last resort also comes from the. analogy to the domestic central bank. In order to provide liquidity in a massive amount, the monetary authorities regularly conduct strict examinations. Weak institutions are closed or at least restricted in their activities. When a liquidity crisis occurs, the monetary authorities must have confidence that financial institutions are essentially sound be- fore they inject liquidity to help financial institutions. Similarly, the mone- tary authorities of the emerging markets have to demonstrate that the li- quidity support from the international lender of last resort does not go into insolvent institutions. Therefore any recommendation for establishing the international lender of last resort should be accompanied by the pro- posal to strengthen the banking system and its supervision. Moreover, in practice, it is often very difficult to distinguish the liquidity problem from the insolvency problem.
The best solution to an international bank run is to make the IMF the international lender of last resort. Funding has to be increased and conditionality has to be relaxed. If necessary, a regional fund, comprising the neighboring countries that may be affected by contagion, should be created to supplement the IMF coffer.

292 Takatoshi Ito
8.4.3 Herd Behavior
Similar to the idea of the bank run, the model of herd behavior has been developed in the finance literature. In relation to stock market crashes, Scharfstein and Stein (1990) and Banerjee (1992) developed the so-called herd behavior model. Investors behave as in a herd because it maximizes profits to behave as others do. When others are investing, it is more likely that prices will go up and the currencies will appreciate, so that it makes sense to invest. When others are withdrawing, it is rational to go along be- cause prices and currencies will go down. The self-fulfilling prophecy works.
One might question this simple model by arguing that markets have a self-regulating mechanism that would bring the economy back to equilib- rium. A currency depreciation shock by capital flows should promote ex- ports and thus in the long run increase pressure to appreciate the currency. For example, depreciation would hurt the balance sheet of banks and cor- porations that borrowed in foreign currencies. Thus, lending from banks would be limited and the interest rate would rise. Business activities would be depressed and would struggle to obtain working capital. Depressed domestic demand, consumption, and investment would further depress business activities.
In the meantime, if the inflation rate increases due to the depreciated currencies, the real exchange rate does not warrant much increase in ex- ports. Foreign debts (denominated in nominal terms in foreign currencies) are mushroomed in local currencies.
The fate of Indonesia seems to fit this description of herd behavior and multiple equilibria well. How else could we explain the still-suffering econ- omy (at - 15 percent growth rate) at the exchange rate level that is one- sixth of the precrisis level? Other countries, such as Thailand and Korea, also have negative growth, even though their currencies have depreciated by 30 to 40 percent.
Herd behavior can be dealt with by capital controls or a stand-still agreement imposed by the IMF. Temporary capital controls on outflows may calm the market. A stand-still agreement would be an effective tool to start the negotiation process of corporate debts or sovereign bonds. This would eliminate the incentive to withdraw funds first.
8.4.4 Irrational Exuberance and a Bubble
The last model is more ad hoc. Excessive capital inflows can be charac- terized by irrational “exuberance” (a famous word of Alan Greenspan’s on U.S. stock prices) that sooner or later results in an eventual crash. The stock prices and real estate prices of some Asian cities-for example, in Thailand, Hong Kong, and Malaysia-increased so much because of the capital inflows, which were prompted by high economic growth. However,

Capital Flows in Asia 293
at least in the end, the level of stock prices could not be rationalized by fundamentals. The stories of real estate bubbles in some Asian cities were similar to Japan’s bubble and burst cycle from 1985 to 1998. Ito and Iwai- sako (1 996) explain the stock price movements by applying the stochastic bubble model, a la Blanchard and Watson (1982). A similar methodology can be applied to the Asian crisis.
8.4.5 Early Warning Signal
It has become a popular exercise to look for variables that help predict a future crisis. Frankel and Rose (1996), Eichengreen and Rose (1996), Goldstein (1996), and Kaminsky, Lizondo, and Reinhart (1998) have contributed to the literature of early warning signals. Frankel and Rose (1996) identify, for example, the size of current account deficits and the composition of bank borrowing (short-term and foreign-currency- denominated loans) as factors that increase the probability of a future crisis (large devaluation). Goldstein (1996) lists seven factors as presump- tive indicators of vulnerability to a financial crisis: an upturn in interna- tional interest rates; a mismatch between the government’dbanking sys- tem’s short-term liabilities and its liquid assets; a large current account deficit; an overvalued exchange rate; a weak banking system and large fis- cal deficits that put constraints on the authorities’ willingness to increase interest rates; a boom in bank lending followed by a fall in asset prices; and high susceptibility to contagion due to similarities to a financial crisis elsewhere (more likely if the crisis is close by). Eichengreen and Rose also confirm a contagion effect, namely that probability of a crisis in- creases if a neighboring country experiences a crisis. Kaminsky, Lizondo, and Reinhart (1 997) attempt to calculate appropriate widths of thresholds of various macro variables. When an indicator moves beyond certain threshold levels, it is treated as a signal. In any given month, the system would estimate the probability of a crisis within the following twenty-four months conditional on the indicators issuing signals at that moment. The variables are chosen on the basis of indicating correct signals (while min- imizing false signals) for a crisis. Although the results are encouraging, there are as many false signals as correct signals even for variables that are less noisy.
8.5 Concluding Remarks
In this paper, characteristics of capital flows in Asia before and after the crisis of 1997 were summarized. Although some common factors are available, each crisis has its own idiosyncratic factors. In fact, Thailand, Indonesia, and Korea present much different kinds of “food for thought,” just as their ethnic foods are different. Thailand is much like a classic

294 Takatoshi Ito
attack on the reserve for a country with large current account deficits, while Korea seems to be an international bank run. Indonesian problems cannot be understood without investigating political and social shocks. These differences reflect underlying bank and corporate liability struc- tures, which is a result of their policies during the capital inflow phase. The capital outflow crisis investigation must begin with research on capital inflows. For this reason, the detailed data analyses and the description of idiosyncratic factors in this paper may be useful for further research.
References
Banerjee, Abhijit. 1992. A simple model of herd behavior. Quarterly Journal of Economics 107:797-8 17.
Belderbos, RenC, Giovanni Capannelli, and Kyoji Fukao. 2000. The local content of Japanese electronics manufacturing operations in Asia. In The role of for- eign direct investment in East Asian economic development, ed. T. Ito and A. 0. Krueger. Chicago: University of Chicago Press.
Blanchard, Olivier, and Mark W. Watson. 1982. Bubbles, rational expectations, and financial markets. In Crisis in the economic and financial structure, ed. P. Wachtel. Reading, Mass.: Lexington Books.
Diamond, D., and P. Dybvig. 1983. Bank runs, deposit insurance and liquidity. Journal of Political Economy 91:401-19.
Economic Planning Agency. 1998. Assessment of tradelinvestment liberalization and environmental policy using an applied general equilibruim model. Economic Analysis, no. 156 (in Japanese). Tokyo: Economic Planning Agency, Economic Research Institute.
Eichengreen, Barry, and Andrew Rose. 1996. Contagious currency crises: Chan- nels of transmission. In Changes in exchange rates in rapidly developing countries: Theory, practice, andpolicy issues, ed. T. Ito and A. 0. Krueger. Chicago: Uni- versity of Chicago Press.
Frankel, Jeffrey A,, and Andrew K. Rose. 1996. Currency crashes in emerging markets: Empirical indicators. NBER Working Paper no. 5437. Cambridge, Mass.: National Bureau of Economic Research, January.
Frankel, Jeffrey A., and Shang-Jin Wei. 1994. Yen bloc or dollar bloc? Exchange rate policies of the East Asian economies. In Macroeconomic linkage; Savings, exchange rates, and capitalgows, ed. T. Ito and A. 0. Krueger. Chicago: Univer- sity of Chicago Press.
Goldstein, Morris. 1996. Presumptive indicatorslearly warning signals of vulnera- bility to financial crises in emerging-market economies. Washington, D.C.: Insti- tute f i r International Economics, January. Photocopy.
. 1997. The case for an international banking standard. Washington, D.C.: Institute for International Economics.
. 1998. The Asian financial crisis: Causes, cures, and systemic implications. Washington, D.C.: Institute for International Economics.
Graham, Edward M., and Paul R. Krugman. 1991. Foreign direct investment in the United States. 2d ed. Washington, D.C.: Institute for International Economics.
. 1993. The surge in foreign direct investment in the 1980s. In Foreign direct investment, ed. Kenneth A. Froot. Chicago: University of Chicago Press.

Capital Flows in Asia 295
IME 1995. International capital markets: Developments, prospects, and policy issues. Washington, D.C.: International Monetary Fund.
. 1996. International capital markets: Developments, prospects, and policy is- sues. Washington, D.C.: International Monetary Fund.
Ito, Takatoshi. 1998a. Bail-out, moral hazard, and credibility: IMF and World Bank policies in crises of the 21st century type. Paper presented at the Wharton Conference on Asian Twin Financial Crises, Tokyo, 10 March.
. 1998b. Asian exports: Principal causes of deceleration. Asian Develop- ment Bank. Mimeo.
. 1998c. The development of the Thailand currency crisis: A chronological review. Japan Export-Import Bank, RIID Review 24 (September): 66-93.
Ito, Takatoshi, and Tokuo Iwaisako. 1996. Explaining asset bubbles in Japan. Monetary and Economic Studies, Bank o j Japan 14 (July): 143-93.
Kaminsky, Graciela L., Saul Lizondo, and Carmen M. Reinhart. 1998. Leading indicators of currency crises. IMF Staff Papers 45, no. 1 (March): 1-48.
Kaminsky, Graciela L., and Carmen M. Reinhart. 1996. The twin crises: The causes of banking and balance-of-payments problems. Washington, D.C.: Board of Governors of the Federal Reserve System, February. Photocopy.
Khan, Mohsin S., and Carmen M. Reinhart. 1995. Macroeconomic management in APEC economies: The response to capital inflows. In Capital Jtows in the APEC region, ed. M. Khan and C. Reinhart, 15-30. IMF Occasional Paper no. 122. Washington, D.C.: International Monetary Fund.
Kojima, Kiyoshi. 1978. Direct foreign investment. London: Croom Helm. Krugman, Paul. 1994. The myth of Asia’s miracle. Foreign Afsairs 73, no. 6 (No-
VemberlDecember): 62-78. . 1998. What happened to Asia? Unpublished paper, Massachusetts Insti-
tute of Technology. Available at http://web.mit.edu/krugman/www/disinter. html.
McKinnon, Ronald, and Huw Pill. 1996. Credible liberalizations and international capital flows: The overborrowing syndrome. In Financial deregulation and inte- gration in East Asia, ed. T. Ito and A. 0. Krueger. Chicago: University of Chi- cago Press.
Montes, Manuel F. 1998. The currency crisis in Southeast Asia. Updated ed. Singa- pore: Institute of Southeast Asian Studies.
Nukul Commission. 1998. The Nukul Commission report: Analysis and evalua- tion on facts behind Thailand’s economic crisis. Bangkok: Nation Multimedia Group.
Radelet, Steven, and Jeffrey Sachs. 1998. The East Asian financial crisis: Diagno- sis, remedies, prospects. Paper presented at Brookings Panel, Washington, D.C., 26-27 March.
. 2000. The onset of the East Asian financial crisis. In Currency crises, ed. Paul Krugman. Chicago: University of Chicago Press. Forthcoming.
Scharfstein, David, and Jeremy Stein. 1990. Herd behavior and investment. Ameri- can Economic Review 80 (June): 465-79.
Urata, Shujiro, and Hiroki Kawai. 2000. Intrafirm technology transfer by Japanese manufacturing firms in Asia. In The role of foreign direct investment in East Asiun economic development, ed. T. Ito and A. 0. Krueger. Chicago: University of Chi- cago Press.
World Bank. 1993. The East Asian miracle: Public policy and economic growth. Washington, D.C.: World Bank.
Young, Alwyn. 1992. A tale of two cities: Factor accumulation and technical change in Hong Kong and Singapore. NBER macroeconomics annual, ed. Olivier Blanchard and Stanley Fischer, 13-54. Cambridge, Mass.: MIT Press.

296 Takatoshi Ito
. 1994. Lessons from the East Asian NICS: A contrarian view. Europeun Economic Review 38~964-73.
Comment Dani Rodrik
Takatoshi Ito suggests in his conclusions that the crises in Thailand, In- donesia, and Korea offer different types of “food for thought,” just as the region’s ethnic foods differ. While the spices may have been different in each case, it seems to me that these were just condiments on the same old dish that international capital markets have been serving with regularity over the last twenty years.
Whether driven by moral hazard, financial panic, herd behavior, or ir- rational exuberance, the boom-and-bust pattern of international lending appears to be integral to the operation of international financial markets. When the crisis strikes, it is always easy to find weaknesses in the bor- rowing economies to justify ex post the reversal of flows: crony capitalism, industrial policies, exchange rates pegged too rigidly to the dollar, weak financial sectors, implicit insurance, and so on. No one can doubt that these were problems of varying degrees of seriousness in the East Asian economies most severely affected. But it takes a large buildup of short- term external liabilities-denominated in a currency other than your own-to metamorphose these weaknesses into the financial and real melt- downs that Thailand, Indonesia, and South Korea have experienced. Fig- ure 8C. 1. shows the close correlation between exposure to short-term debt and currency collapse in East Asia.
Asian-style capitalism-with different ethnic spices in each case-did not evolve in the last five years. Furthermore, this is not the first time that many of these countries have experienced external imbalances. South Korea had a mini debt crisis in 1980 that cost it 5 percentage points of gross domestic product (GDP) in one year. But as Ito emphasizes, large capital inflows, particularly of a short-term kind, are a relatively recent phenomenon. We get the real fireworks only when domestic problems meet international financial markets.
There is much useful information in Ito’s paper on the patterns of capi- tal inflows to the region. I must say I am less convinced than he is by the evidence on spillovers from direct foreign investment (DFI). Regressions of output growth on lagged DFI do not provide particularly meaningful evidence, in part because investors are forward looking and in part be-
Dani Rodrik is professor of international political economy at the John F. Kennedy School of Government, Harvard University, and a research associate of the National Bureau of Economic Research.