capital gains taxation and inefficient block ownership · rüdiger fahlenbrach, dirk jenter, and...
TRANSCRIPT
1
Capital gains taxation and inefficient block ownership
Rüdiger Fahlenbrach, Dirk Jenter, and Eric Nowak*
This Version: March 17, 2018
Preliminary and incomplete
Abstract
We analyze plausibly exogenous changes in corporate minority block ownership in Germany and their consequences for firm value. In December 1999, Germany passed a tax reform that repealed the corporate capital gains tax of approximately 50% on domestic corporate holdings. The tax reform caused many German firms, in particular banks and insurance firms, to sell their minority equity stakes in other publicly listed German firms, altering the network of corporate holdings and corporate control in Germany. We ask whether the realization-based taxation of corporate capital gains discouraged value-enhancing asset reallocation by creating a “lock-in” effect prior to the reform. If corporations had a sub-optimal set of shareholders prior to the reform, we would expect their value to increase after the tax reform. We find supportive evidence of this conjecture.
* Fahlenbrach ([email protected]) is Associate Professor at Ecole Polytechnique Fédérale de Lausanne and is affiliated with the Swiss Finance Institute and the European Corporate Governance Institute. Jenter is Associate Professor at London School of Economics and affiliated with NBER. Nowak is full professor at the University of Lugano and is affiliated with the Swiss Finance Institute. We thank Alexander Eisele, Steve Schmidt and Biljana Seistrajkova who provided excellent research assistance.

2
1. Introduction
By the mid-1990s, there were growing concerns that “Germany Incorporated”, or a system in which the
ownership of publicly listed firms was dominated by cross-holdings and minority stakes held by banks,
was past its prime. Observers argued that Germany would do better by emulating the Anglo-Saxon
system, with a developed financial market, an active market for corporate control, owners free of debt-
equity conflicts, and dispersed equity ownership (e.g., Wenger and Kaserer (1998)). These critics were
also concerned about the anticompetitive effects of common ownership by banks and insurance
companies, very similar to the issues that have recently been discussed in the United States (e.g., Azar,
Schmalz, and Tecu (2017)). There was however also a more positive view of the German system. Under
this view, German banks and industrial firms were large, informed, and long-term investors that improved
the performance of firms in which they held minority equity stakes by monitoring management and
corporate policies (e.g., Grundfest (1990) or Gorton and Schmid (2000)).
Accumulated, unrealized capital gains on cross-holdings were perceived as a major impediment to
moving toward a more Anglo-Saxon system. Because most minority stakes had been held for a long time,
there was a sizeable difference between the book values of these stakes and their current market values,
creating a substantial lock-in effect. We use the surprise proposal to eliminate the corporate capital gains
tax on the sale of corporate cross-holdings that was first disclosed in December 1999 to examine whether
banks, insurance companies, but also industrial firms sold minority stakes after the removal of the capital
gains tax, and if so, whether these changes to the ownership structure of German industrial firms had
consequences for their valuation.
We first show that corporate ownership of German publicly listed firms indeed changed significantly
across the years of the tax reform, and that it changed more for the group of firms that had minority
blocks held by insurance companies and banks. The network of cross-holdings thinned significantly
between 1999 and 2007. We then demonstrate that the stock prices of affected firms reacted positively to
3
the announcement of the tax reform. Perhaps unsurprisingly, firms with large accumulated capital gains in
their portfolio of minority blocks increased significantly in value (see also Edwards et al. (2004) and von
Beschwitz (2017)). But we also find strong evidence of positive announcement returns for those firms in
which banks and insurance firms held non-strategic stakes, which suggests that the market expected
value-increasing changes in corporate policies under new ownership. These announcement returns are
economically sizeable, at 1.4% to 1.9% over the one-day event window.
In a final step, we examine whether firms changed their corporate behavior after bank and insurance
blocks were sold. We examine differences in firm value measured by Tobin’s Q. The idea is that, because
of the high capital gains tax before 2002, there were German industrial firms with ownership structures
that were not optimal. These firms had shareholders who were not the firms’ optimal shareholders but
who were trapped by high accumulated capital gains. After the reform, such shareholders sell, the firms’
ownership structures improve, and firms can make better decisions which are reflected in increases in
firm value. We indeed find that firm value as proxied by Tobin’s Q is negatively correlated with the
presence of a financial blockholder. This effect holds for regressions with industry-fixed or firm-fixed
effects.
The decision to sell a minority block is not exogeneous, however, and unobservable firm characteristics
might drive both the divestment decision of the financial firm as well as the future changes in
performance. To address this endogeneity problem, we carry out an intention-to-treat analysis in the spirit
of Frydman and Hilt (2017) and von Beschwitz (2017). We construct a treatment group that consists of all
German firms with a minority stake held by a bank or insurance company in 1997 and a control group
that consists of firms without such equity stakes in 1997. We estimate firm-fixed effects regressions of
Tobin’s Q between 1997 and 2007 (centered around the year of the implementation of the tax reform) on
a treatment indicator interacted with a post-reform dummy. We find that firms that had a bank or
insurance blockholder in 1997 indeed started to perform significantly better after the tax reform was
formally implemented in 2002. The effect is economically significant – firms with a bank blockholder in

4
1997 experience an improvement in performance of approximately 12% relative to the average Tobin’s
Q.
Our paper contributes to four strands of the literature. There is a large body of work that studies the
relation between block ownership and firm value.1 Holderness and Sheehan (1988), McConnell and
Servaes (1990) and Mehran (1995) study the US and find no correlation between outside block ownership
and Tobin’s Q. The international evidence is more positive. Lins (2003) studies 18 emerging markets and
finds that Tobin's Q is positively related to the fraction of decision rights held by non-management
blockholders. Claessens et al. (2002) show that outside blockholdings positively correlates with the
market to book ratio in the eight analyzed East Asian economies. Edmans and Holderness (2017), in their
review of the literature, note however that none of the above studies addresses the fundamental
endogeneity concerns first voiced by Demsetz and Lehn (1985) that block ownership and firm value
could potentially be driven by unobservable characteristics. We believe that we can make, in our setting,
progress towards identification.
There has recently been renewed interest in the economic consequences of tax reforms for the behavior of
firms.2 Doidge and Dyck (2015) show that introducing corporate income taxes to income trusts in Canada
led to significant declines in market value and changing corporate policies. Heider and Ljungqvist (2015)
use staggered corporate income tax changes across U.S. states to show that firms increase leverage when
corporate income taxes increase. Our paper, similarly, analyzes firms’ response to an unusually large and
surprising tax change.
Prior research has demonstrated that capital gains taxation has a large impact on investor behavior. Jin
(2006) shows that capital gains taxes are an important impediment to selling by some institutional
investors. Ivković, Poterba, and Weisbenner (2005) find a strong lock-in effect for capital gains in taxable
accounts relative to tax-deferred accounts for individual investors. Dai et al. (2008) examine capital gains 1 Holderness (2003) and Edmans and Holderness (2017) survey the extensive literature on the topic. 2 For an overview of the earlier literature on taxes and corporate policies, see, e.g., Graham (2003) or Graham (2008).

5
taxation and show that capital gains taxes affect both demand and supply of shares, using the Taxpayer
Relief Act of 1997. Investors may be less reluctant to buy a block of shares because they know they will
have to pay capital gains taxes in the future (capitalization effect). Once they own blocks, they may be
reluctant to sell them because capital gains make sales less attractive (lock-in effect). Our paper
contributes to the literature by studying a situation in which the accumulated corporate capital gains were
extremely large.
Finally, there is a literature on the German capital gains tax reform. Gieralka and Drajewicz (2001),
Edwards, et al. (2004), and Beschwitz (2017)) examine the event returns on the announcement of the
reform and find positive announcement returns for those firms that own large minority stakes in other
companies. Edwards et al. (2004), for example, find a positive market reaction for the six banks and
insurance companies with the largest minority holdings in industrial firms. They also find, using a
subsample of firms and a long event window, some weak evidence that the industrial firms held by these
banks experience a positive announcement return. Both effects are consistent with the market believing in
positive valuation effects from a reshuffling of ownership in German corporations. Several papers have
shown the thinning of cross-holdings after the tax reform. Rünger (2012) examines the rate at which
corporate minority holdings in other firms are sold and shows that it is unusually high in 2002 compared
to the surrounding years, consistent with firms making use of the enactment of the tax reform to sell their
minority stakes. Weber (2009) shows that the mean and median size of major voting blocks in Germany
have declined between 1999 and 2005. Because the most significant decline occurred between 2001 and
2003 she argues that this could be attributed to an isolated effect of the corporate tax reform. Höpner and
Krempel (2006), Kengelbach and Roos (2006), and Wójcik (2003) provide descriptive statistics on the
time-series of corporate cross-holdings in Germany.
Sautner and Villalonga (2010) show that a tax-reform induced decline in ownership concentration leads to
more diversification and less efficient internal capital markets. Von Beschwitz (2017) uses the tax reform
to test a “cash windfall” hypothesis in the spirit of Blanchard, Lopez-de-Silanes, and Shleifer (1994). His

6
main finding is that firms who sell their corporate minority stakes have large inflows of money that they
spend on value-destroying acquisitions. Dittmann, Maug, Schneider (2010) do not find any evidence of
monitoring or shareholder-value maximization of the firms in which banks held minority stakes. Our
focus is instead on the consequences of the dissolution of financial minority stakes for the valuation of the
affected industrial firms.
There is also a literature that examined the benefits and cost of the German bank-based corporate
governance system, especially the impact of bank minority ownership on firm performance (e.g., Cable
(1985), Elsas and Krahnen (2003), Lehmann and Weigand (2000) and Gorton and Schmid (2000)). The
results of this literature are mixed – Cable (1985) and Gorton and Schmid (2000) find positive effects of
bank ownership on firm performance, while Chirinko and Elston (2006) do not find any effect of bank
influence on firm performance. While these earlier studies are important, they typically examine single
cross-sections or periods of time in which ownership was extraordinarily stable, two issues which we can
circumvent.3
The remainder of the paper is organized as follows. Section 2 provides details on the tax reform that was
announced in December 1999 and implemented in January 2002. Section 3 describes the data. Section 4
provides summary statistics on the evolution of ownership in our sample and carries out an event study of
the tax reform announcement returns. Section 5 shows the main empirical results on changes in corporate
policies post-reform, and Section 6 concludes.
2. The German Capital Gains Tax Reform
The elimination of the capital gains taxation from the sale of crossholdings that have been held for more
than one year was a surprising byproduct of a long-announced and planned tax reform in Germany. On
December 21, 1999, the German government proposed a broad tax reform plan that would reduce the
3 For more details on the methodological issues in these studies, see Dittman, Maug, and Schneider (2010).

7
federal corporate income tax rate from 40% for retained earnings and 30% for distributed earnings to a
uniform rate of 25% for all types of profits. It also entailed a plan for the abolition of the imputation
system of dividends that was said to disadvantage foreign investors.4 These two elements had been widely
discussed and were considered to be no surprise. The December 21st announcement never mentioned the
elimination of taxes on capital gains from the sales of crossholdings, however. Edwards et al. (2004)
provide compelling evidence that this part of the reform came as a true surprise when it was confirmed on
December 23, 1999. Because much of the debate around the validity of a difference-in-difference
estimate is centered around the possible endogeneity of the event itself, the analysis in Edwards et al.
(2004) and the many discussions on the surprise of the reform in national and international newspapers
immediately following the announcement are important corroborating pieces of evidence for the validity
of our experiment.
The initial announcement of the repeal of capital gains on sales of crossholdings was followed by lengthy,
uncertain political negotiations. The reform was formally ratified by a vote of the upper house
(Bundesrat) on July 14, 2000, with a formal repeal of the taxes on realized capital gains from the sale
crossholdings starting in January 2002.
The reform continued to be controversial, even after passing, and the conservative candidate for the next
German elections in 2002 threatened to reintroduce taxes on capital gains from the sale of minority
stakes. German corporations responded to this threat by “stepping up the basis” of their stakes, i.e. by
realizing the accumulated capital gains through sales at current market values to other companies within
the same group. Hence, any reintroduced capital gains tax would have to be paid only on capital gains
accumulated between the time of the internal sale and the time of the eventual sale, significantly reducing
the lock-in effect. During the year 2003, the tax laws changed slightly, and a small minimum trade tax
4 The corporate tax paid on distributed profits was treated as a prepayment of the shareholder’s liability to personal income tax on those dividends. In effect, distributed profits were untaxed at corporate level but subject to a 30 percent withholding tax that was fully creditable against personal tax. Under the new system, all profits are taxed at 25 percent and imputation is replaced by including in the base of the personal income tax only half of the dividend received (see Keen (2002) for more details).
8
and corporate income tax was re-introduced (roughly, only 95% of the capital gains were exempt from
taxation).
Overall, we believe that the element of surprise at announcement and the sheer magnitude of the tax
savings, both because of the high tax burden pre-reform and the prevalence of long-held cross-holdings,
make this tax reform an ideal laboratory for studying its effect of dissolution of minority blockholdings.
2.1 The tax on capital gains from the sale of crossholdings prior to the reform
It is informative to precisely document how high the tax burden on capital gains from the sale of
crossholdings was in 1999. German corporations, at the time of the announcement of the tax reform, were
subject to three taxes on the capital gains from crossholdings: A trade tax (Gewerbesteuer) with a base
rate of 5% times a municipality-specific multiplier, a corporate income tax of 40% (Körperschaftssteuer),
as well as a solidarity tax (Solidaritätszuschlag) that was 5.5% of the corporate income tax.
Because of the municipality-specific multiplier, there was no one common tax rate for all German
corporations. But to give one specific example, Deutsche Bank would have had to pay the following
amount of taxes on $100 of capital gains from the sale of a cross-holding in 1999 (adapted from Edwards
et al. (2004) and Neu (2000)). In 1999, Deutsche Bank held its industrial minority stakes via a subsidiary
located in Eschborn, which at the time had a trade tax multiplier of 280% (Späthe (2012)). The trade tax
thus would have been 2.8 x 5% = 14%, or $14. The trade tax is deductible from income when computing
the corporate income tax, so that the corporate income tax would have been 0.4 x ($100 - $14) = $34.40.
Finally, the solidarity tax is applied, leading to an additional tax of 0.0550 x 34.40 = $1.89. Hence, the
total tax burden for Deutsche Bank in 1999 on the sale of $100 of a minority stake would have been $14 +
$34.40 + $1.89 = $50.29. After the tax reform, the taxes due on the sale of a minority stake went down to
zero.
9
A necessary condition for these tax savings is that industrial corporations actually had material capital
gains, i.e. that the book values of the stakes were substantially lower than the market values. Höpner and
Krempel (2004) examine the origins of the German minority stakes and show that many originated in the
era of industrialization and expanded in two waves in the 1920s and the 1950s. They therefore conclude
that the book values of these stakes must be substantially lower than the market values. Späthe (2011) has
internal data for the book values for Deutsche Bank’s industrial stakes and shows that in 1999, the market
value of Deutsche Bank’s minority stakes in publicly listed German companies is about 6 times higher
than their book values. Von Beschwitz (2017) gathers data from annual reports for the five financial
companies with the most equity stakes and estimates that the market values of these stakes are
approximately 3 times as high as the book values. Overall, it seems clear that large capital gains had
accumulated on these minority stakes through time. The calculations demonstrate why companies with a
large portfolio of minority equity stakes increased dramatically in value after the capital gains tax reform
was revealed (e.g., the calculations in von Beschwitz (2017), or Edwards et al. (2004)).
2.2 Evidence on the importance of tax considerations in the management of minority stakes of German corporations prior to the reform
German corporations with a large portfolio of minority stakes managed those stakes in tax efficient ways
prior to the reform. For example, the percentage ownership for a large number of minority stakes
clustered just above 10%. If a German corporation owned a stake of 10 % or more in another company, it
had certain tax privileges to prevent double taxation (‘Steuerprivileg der Schachtelbeteiligung’). Many
industrial and financial corporations with individual minority stakes smaller than 10% formed joint
limited liability companies in which they pooled their individual stakes. The limited liability company
then held a stake of more than 10%, was entitled to the tax privileges and, importantly, could pass them
through to its corporate owners. These tax privileges explain the existence of entities such as, e.g., the
“Frankfurter Gesellschaft für Chemiewerte” holding large blocks in our data.

10
One other piece of evidence is that large German corporations moved the location of the subsidiaries
managing their minority stakes to jurisdictions with low multipliers for trade tax to save taxes on dividend
distributions.5
2.3 Market conditions in Germany after the tax reform
One thing to keep in mind when thinking about the dissolution of Germany Incorporated are the difficult
market conditions after the passage of the new tax legislation. Figure 1 shows the evolution of the
German stock market index DAX, from 1998 to 2010. It decreased from approximately 8,000 points in
January 2000 to approximately 5,000 points by January 2002, and approximately 2,200 points by January
2003. These adverse market movements may have delayed the sale of minority stakes. Hence, we
examine, as does von Beschwitz (2017), a longer post-event period when we study the long-term effects
on firm value.
3. Data
We start with a list of all publicly listed firms that were part of the composite DAX (CDAX) at the end of
1998, and follow these firms through time until 2009. The CDAX is a share index of all stocks traded on
the Frankfurt Stock Exchange in the General Standard or Prime Standard market segments. The CDAX
contains both the common stock and preferred stock of several German firms. We exclude the preferred
shares to avoid including the same firm multiple times in our sample and because we are interested in
voting rights. We concentrate on firms with more than Euro 25 million in market capitalization.
5 Deutsche Bank, for example, moved the subsidiary from Frankfurt (with a trade tax multiplier of 515%) to Eschborn, a suburb of Frankfurt (with a multiplier of 280%) in 1997 and then again from Eschborn to the tiny village of Norderfriedrichskoog in Northern Germany with 40 inhabitants but a trade tax multiplier of 0%. These tax optimization strategies became so prevalent that the German Government decided in the year 2003 to impose a minimum multiplier of 200% for all municipalities. Deutsche Bank then moved the subsidiary to the East German village of Sössen-Gostau, which applied the minimum multiplier of 200% (Späthe, 2012)
11
There was a large number of IPOs in Germany in 1997 and 1998. Not surprisingly, these IPO were
concentrated in the electronics and consumer goods sector. We exclude the 16 firms that had their IPO in
1997 and the 42 firms that had their IPO in 1998 because they do not have a history of ownership and also
because they are not part of the historically grown “Germany Incorporated” that is the focus of our study.
There were 27 firms listed on the CDAX with a dominant shareholder holding more than 90% of the
firm’s common equity at the end of 1997. Before the introduction of a new squeeze-out rule in January
2002 in Germany, the exclusion of minority shareholders was difficult and could be carried out only with
considerable efforts. After January 2002, many dominant shareholders of German corporations made use
of the new rule to squeeze-out the remaining shareholders (see, e.g., Croci, Ehrhardt, and Nowak (2013)).
Because the new squeeze-out rule overlaps with our tax reform, and because the affected firms were
essentially wholly owned subsidiaries, we exclude these 27 firms from our sample. We are left with a
sample of 243 German publicly listed firms.
We collect ownership data for sample firms from three sources. The passage of the German securities
trading law (Wertpapierhandelsgesetz / WpHG) in 1994 introduced reporting requirements for minority
stakes that are similar to those imposed by the Securities and Exchange Commission (SEC) in the U.S.
Originally, paragraph 21 WpHG stated that a shareholder crossing 5%, 10%, 25%, 50%, or 75%
thresholds of the votes of a German listed company had to notify the German Financial Supervisory
Authority (Bundesanstalt für Finanzdienstleistungsaufsicht, BAFIN). We have obtained the official
quarterly filings from BAFIN that track the initial filings and the amended filings whenever a threshold is
crossed, including filings that indicate falling below the 5% threshold.6 Second, Picoware (formerly
Commerzbank) sells a commercial database of the block ownership of German corporations, the “who
owns whom” database (“Wer gehört zu wem”). Picoware collects data from biannual surveys of
6 Becht and Boehmer (2003) and Wojcik (2003) use BAFIN data. Becht and Boehmer (2003) provide a detailed analysis of the strengths and weaknesses of BAFIN data.
12
companies. These data are available in electronic form, which may explain its relative popularity.7 Our
third source of ownership data are the annual reports of corporations in which changes in ownership are
reported according to the thresholds of the WpHG.
All three sources have their strengths and weaknesses. The BAFIN and Picoware data are generally of
high quality, but have some shortcomings that affect a study like ours which requires following owners
through time and recording the precise date at which ownership changes. One problem with Picoware is
that it is sometimes not possible to see the ultimate owner of a stake. We showed in Section 2 that for tax
reasons many German corporations held minority stakes through holding companies whose names are not
always easily traced to the ultimate owner (e.g., Dresdner Bank holds firms through the Herakles
Beteiligungsgesellschaft, Deutsche Bank holds firms through the BOJA Beteiligungsgesellschaft). If
these holding companies themselves do not participate in the Picoware survey, it is impossible to connect
them to the ultimate owner.
Issues also arise in the time-series, for both BAFIN and Picoware, because reported data can be stale.
BAFIN data in particular are not reliable when an owner falls below the 5% threshold, with reporting
delays of up to three years. Perhaps as a consequence, some of the studies on changes in the ownership of
German corporations relying on Picoware only collect data at two distant points in time (e.g., von
Beschwitz (2017) who collects data in 1997 and 2005), at the potential cost of being imprecise about the
timing of block sales.
Our overall conclusion from carefully inspecting the available data sources is that each one is helpful on
its own, but also has its deficiencies. Hence, our strategy is as follows. We start with the BAFIN
ownership data. Then, we compare the BAFIN data against Picoware. If we observe a change in
ownership, we verify the date of the change by looking at annual reports of corporations and searching the
internet for announcements of the sale. We hope that we have built an (almost) error-free database that
7 For example, Edwards et al. (2004), Foos and von Beschwitz (2014), and von Beschwitz (2017) all use Picoware data.

13
captures the time-series of large owners of German corporations from 1997 to 2009.8 Our classifications
of different owners and the rules to attribute ownership mirror those of two influential prior papers
(Gorton and Schmid (2000) and La Porta et al. (1999)).
Accounting and stock market data are from Datastream and CapitalIQ. German firms have different fiscal
year end months, but like in the U.S., most firms end their fiscal years in December. In our empirical
analysis, we make sure that the accounting variables are properly aligned with the ownership changes.
During our sample period, trading volume moved slowly from the floor at Deutsche Börse to the Xetra
electronic trading platform, especially for the largest German firms. In our event study of the
announcement returns of the tax change on December 23, 1999, we use closing prices from Deutsche
Börse or Xetra, whichever exchange has the larger trading volume. We have verified however that using
returns calculated only from Deutsche Börse does not affect our results.
4. Summary statistics and event returns
We start in Section 4.1 with summary statistics and figures documenting the evolution of ownership
between 1997 and 2009. Section 4.2 contains an event study of the tax reform announcement returns for
affected firms.
4.1. Evolution of block ownership and summary statistics
Figure 2 shows the number of blocks that are held by different types of owners at four snapshots during
our sample: 1997, 1999, 2003, and 2007.9 The graph shows, for each group, the number of blocks in all
sample firms at any given point in time, divided by the total number of sample firms at that point in time.
We standardize the number of blocks in this manner because we do not add firms after 1998, and we
8 For details on our ownership sample construction and the assumptions we have made, please see Appendix A. 9 We exclude blocks held by families and individuals from these statistics, because our focus in on corporate blocks. Families and individuals are the most common blockholders in German firms; their ownership is stable and does not change much throughout the years.

14
would like to avoid a mechanical decrease in the number of blocks due to sample attrition. A couple of
interesting points readily emerge from Figure 2. We observe the largest increase in stakes for the group of
foreign investment management firms. While those institutional investors were virtually not present in
German firms in the early sample period, they have become by 2007 the second largest blockholder group
after families. Not-for-profit foundations, German investment managers, and foreign governments hold
few stakes. There are few private equity stakes, but their number has been increasing throughout the
sample period. Block ownership by German Landesbanken is relatively constant through time, with slight
increases in 2003 and 2007. Stakes held by German communities, states, and the government (subsumed
under German government) are stable through time. These stakes are concentrated in the utility sector as
well as postal and telecommunication services.
We also observe a sizeable decrease in the stakes held by German publicly listed firms and German
banks. We observe the largest decrease during the period in which the tax reform is passed and enacted
(minus 10 percentage points for German industrial firms and minus 8 percentage points for German
banks), but also observe that the reduction in stakes continues until 2007. Insurance companies only
decrease their stakes between 2003 and 2007.
Figures 3a to 3c plot the network of minority holdings of German publicly listed industrial firms, banks,
and insurance companies in sample firms for the years 1997, 2003, and 2007. The three figures
demonstrate the sizeable reduction in the density of the network of “Germany Incorporated”. While
Kengelbach and Roos (2006) or Höpner and Krempel (2004) have demonstrated the reduction in the
network between 1996 and 2004, we can see from Figures 3b and 3c that there was an additional sizeable
reduction in the network between 2003 and 2007.
While it is commonly held that the capital gains tax reform played a major role in the dissolution of
“Germany Incorporated”, we would like to note that researchers have brought forward several additional
reasons. For example, the largest German banks refocused their activities on investment banking during

15
the 1990s, and equity stakes and board representation could impede investment banking activity due to
conflicts of interests (e.g., Beyer (2002) or Höpner and Krempel (2006)). Second, with the
internationalization of business activities, it became more and more difficult for banks to regulate
competition among German firms, reducing the value of the equity stakes. Finally, insurance companies
also lost interest in their German minority stakes as their business models changed and as they diversified
their portfolio internationally (Beyer (2002)).
Table 1 shows summary statistics for the block ownership of German firms between 1997 and 2009. For
tractability, we show statistics for total block ownership but then focus only on stakes held by German
financial firms (insurance companies and banks) as well as German non-financial industrial firms and
omit the other categories.
At the beginning of our sample, approximately half of our sample firms had a minority stake held by
other German corporations ((71+51) / 243). By the end of the sample, this reduced to 18% ((14+8)/128).
Almost all German firms have at least one blockholder, with the percentage varying between 97% and
99% in 2009. Total block ownership is fairly stable. Approximately 63% of shares of sample firms are
held by on average 2 blockholders.10 The largest blockholder holds on average approximately 51% of all
shares. Ownership of German firms is hence concentrated, especially compared to the U.S.11
We also learn from Table 1 that industry blocks tend to be much larger than bank blocks. The average
size of an industry block is 49%, while the average size of a bank block is only 19.6% in 1997. The
median size of a bank block is approximated one fourth of an industry block (12.50% vs 51.7%). These
numbers suggest that industry blockholdings are more likely to be strategic than bank blockholdings.
10 Recall that we exclude firms with a single owner holding at least 90% of shares from our sample, because those firms squeezed out their minority shareholders after a law change in 2002. Hence, the numbers we report for the earlier years are lower than what other papers have reported for Germany. 11 Holderness (2009) shows summary statistics for the ownership concentration of a sample of U.S. firms in 1995. For those firms, blockholders hold on average 43% of the shares, and the largest shareholder holds on average 26% of all shares.
16
In our empirical analysis, we are mostly interested in non-strategic stakes held by financial and non-
financial corporations in other German firms. Especially for financial corporations, it is not obvious why
they should continue to hold stakes in industrial corporations after the repeal of the capital gains tax. As
Edwards et al. (2004) and Höpner and Krempel (2004) point out, many crossholdings by banks and
insurers date back to equity received in lieu of cash payments from industrial firms following World War
II. These holdings likely serve little strategic purpose and represent resources that could be more
efficiently deployed in the firm’s primary business line. Similarly, once the financial firms’ stakes are
sold to retail investors or to a large owner with a strategic interest in the firm, more of a firm’s potential
value may be realized, either through takeover or increased efficiency within the firm. These firms with
minority blockholders are the focus of our study. We define a non-strategic stake as any stake that
represents less than 25% ownership of the firm. For full disclosure, Table 2 reports the full list of firms
with such stakes at the end of 1997. Panel A shows the 45 firms that have one (or more) minority
financial (bank or insurance) blockholders, and Panel B shows the 13 firms that have one (or more)
minority industrial blockholder. Identification in our paper comes from these firms. Panel A shows that
banks and insurance companies hold minority blocks in a wide variety of firms from different industries.
However, we also note that some of the firms listed in Panel A also hold themselves large stakes in other
companies (e.g., Allianz).
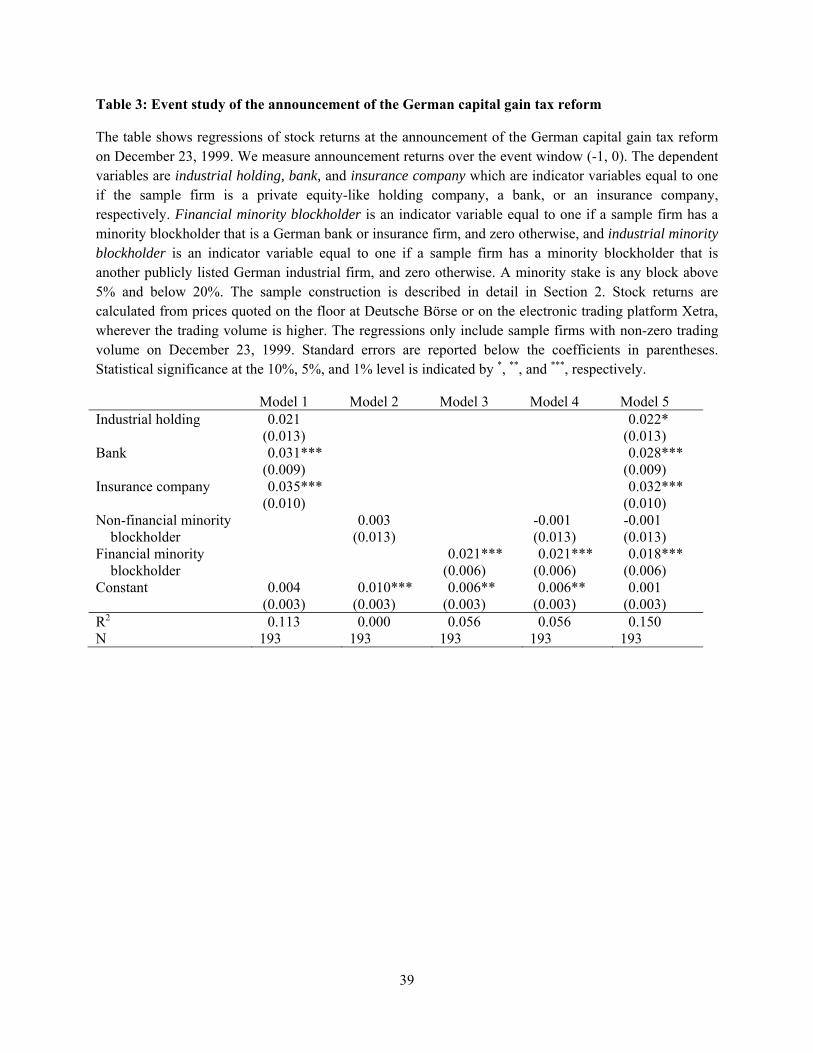
4.2. Event study of the announcement of the German capital gain tax reform
We now ask whether the stock market reacted to the announcement of the tax reform for our sample
firms. We expect to potentially observe two effects. First, companies such as Allianz, Deutsche Bank, or
Deutsche Beteiligungs-AG that hold a large portfolio of stakes in other corporations should significantly
appreciate in value because the unrealized capital gains on their minority stake portfolios can be realized
tax-free after the reform. We include indicator variables equal to one for companies in the banking,
insurance, or industrial holding industries. Based on the results in, e.g., Edwards et al. (2004), we expect

17
the coefficient on the banking and insurance indicator variable to be positive and strongly statistically
significant.
Second, if there was a lock-in effect that created inefficient ownership structures, we should also observe
a positive announcement return for the firms in which, e.g., Allianz or Deutsche Bank held a minority
stake. The reason is that the tax reform enables firms such as Deutsche Bank or Allianz to sell their
minority stakes to more suited owners and as a result, affected firms could potentially move to a more
efficient ownership structure. If these new owners help improve firm value and the market understands
this, we should see an immediate impact on stock prices for firms that have minority owners at the
announcement of the reform. We create two indicator variables to measure the second effect. The first
indicator variable is equal to one if a listed corporation has a minority shareholder (<=20% ownership)
that is a German industrial firm, and zero otherwise. The second indicator variable is equal to one if a
listed corporation has a minority shareholder (<=20% ownership) that is a German bank or insurance
company, and zero otherwise. We separate German industrial firms and German banks and insurance
companies, because the effect for industrial firms may be muted if the stakes are strategic. We only
examine stakes of smaller than 20% because such a threshold is often associated with more important
voting rights (e.g., La Porta et al. (1999)). Using a threshold of 25% leads to qualitatively and
quantitatively similar results.12
Many German stocks have low trading volume during the 1990s, which, for many critics of the German
system, was a consequence of the German bank-based economy and its large cross-holdings. The low
trading volume potentially leads to stale prices that could affect our event study. In particular, there are
many stock returns during the event window (-1, 0) on December 23, 1999 that are zero. We therefore
only use stocks that have non-zero trading volume (Table 3), which reduces our sample from 243 to 193
firms. In an additional test, we condition on at least a daily trading volume of 5,000 shares (Table 4). Note
12 The threshold of 25% is important under German corporate law because it is sufficient to block any major proposal at the annual general meeting of shareholders (“Sperrminorität”) (also see Chirinko and Elston (2006)).

18
however that the volume threshold criterion further substantially reduces the sample from 193 to 101
firms. We focus on a narrow event window, because the announcement of the broader tax reform in the
days before December 23rd could have also affected German firms. The strength and unusual feature of
the announcement of the repeal of the capital gains taxes is the true surprise and little other confounding
news on December 23, 1999.
Tables 3 and 4 show results. Column 1 of Table 3 shows the coefficient of a regression of the
announcement event return during the window (-1, 0) on the indicator variables for firms which ought to
be most affected by the tax reform because of their many stakes. It shows that banks (insurance
companies) increased in value on average by 3.1% (3.5%) on the announcement day. This finding is
consistent with the results of other studies, e.g. Edwards et al. (2004)). Column 2 of Table 3 shows that
the coefficient on the indicator variable equal to one if a company has a non-financial minority
blockholder is indistinguishable from zero. Column 3 focuses on financial minority blockholders. The
announcement returns are significantly higher if a company has a bank/insurance minority blockholder,
and the economic effect is sizeable at 2.1%. Column 4 includes both the non-financial and financial
minority block indicator variables; the coefficient and statistical significance on the financial minority
block variable remains the same. Column 5 deals with the issue that the largest firms with a sizeable
portfolio of minority stakes (e.g., Allianz or Deutsche Bank) themselves have minority blocks by other
banks or industrial firms, and that therefore the results of Columns 3 and 4 could potentially be driven by
the increase in value of the portfolio holdings, and not the inefficient ownership structure caused by the
financial minority blocks. In Column 5, we include both the financial industry indicator variable as well
as the indicator variables for whether a firm is owned by another corporation via a minority stake. The
coefficients on industrial holding, financial firm, and insurance company remain strongly significant,
varying between 2.2% and 3.2%. Importantly, the coefficient on financial minority blockholder remains
significant, too. The announcement returns of firms that have a banking minority stake (effect 2) are
positive and statistically and economically significant at 1.8%.

19
Overall, Table 3 shows that both firms that own minority stakes as well as firms that have minority bank /
insurance blockholders saw their market values increase on the day of the announcement of the tax
reform.
Table 4 shows results from the same regressions, but the regressions only include stocks with a daily
trading volume of at least 5,000 shares. Such a filter alleviates the concern that extremely low volume
may not incorporate all available information in prices. Model 1 shows strongly significant and
economically large, positive effects for those firms with a large portfolio of minority holdings (5.1% for
industrial holding companies and banks and 6.1% for insurance companies). The non-financial minority
blockholder indicator variable is significant in Model 2, but loses its significance once we control for
other variables in Columns 4 and 5. The financial minority blockholder indicator variable is positive and
significant throughout, confirming our earlier results that firms with financial minority blocks saw their
stock prices increase on December 23, 1999.
5. Changes in firm value and corporate policies after the tax reform
We now examine whether we can identify long-run changes in corporate valuations of non-financial firms
after the capital gain tax reform made the divestment of large financial minority stakes by banks and
insurance companies much more likely. Section 5.1 develops testable hypothesis. Section 5.2 explains our
identification strategy, and Section 5.3 shows simple summary statistics of corporate policy and
performance variables. Section 5.4 presents the empirical results.
5.1 Hypothesis development
The literature that examined the benefits and cost of the German bank-based corporate governance
system, especially the bank minority ownership for non-financial firms contrasts two views of the
German system (e.g., Cable (1985), Elsas and Krahnen (2003), Lehmann and Weigand (2000) or Gorton
20
and Schmid (2000)). One view is that German banks are large, active, informed investors that improve the
performance of firms because they are long-term investors who oversee firms' investment programs,
reduce principal-agent problems, and organize their internal capital markets, thus reducing inefficient
investment-cashflow sensitivities. On the other hand, banks may force firms to make decisions that are
good for bank minority shareholders, but not necessarily maximize firm value. For example, banks could
force firms to merge with distressed other companies in which the banks have stakes, prioritize dividends
over investments, or not invest in areas in which one of the other portfolio companies of the bank is
active.13 These arguments lead us to first test whether bank and insurance minority ownership is
positively or negatively related to firm value. We measure firm value using Tobin’s Q as defined in
Gompers, Ishii, and Metrick (2003).
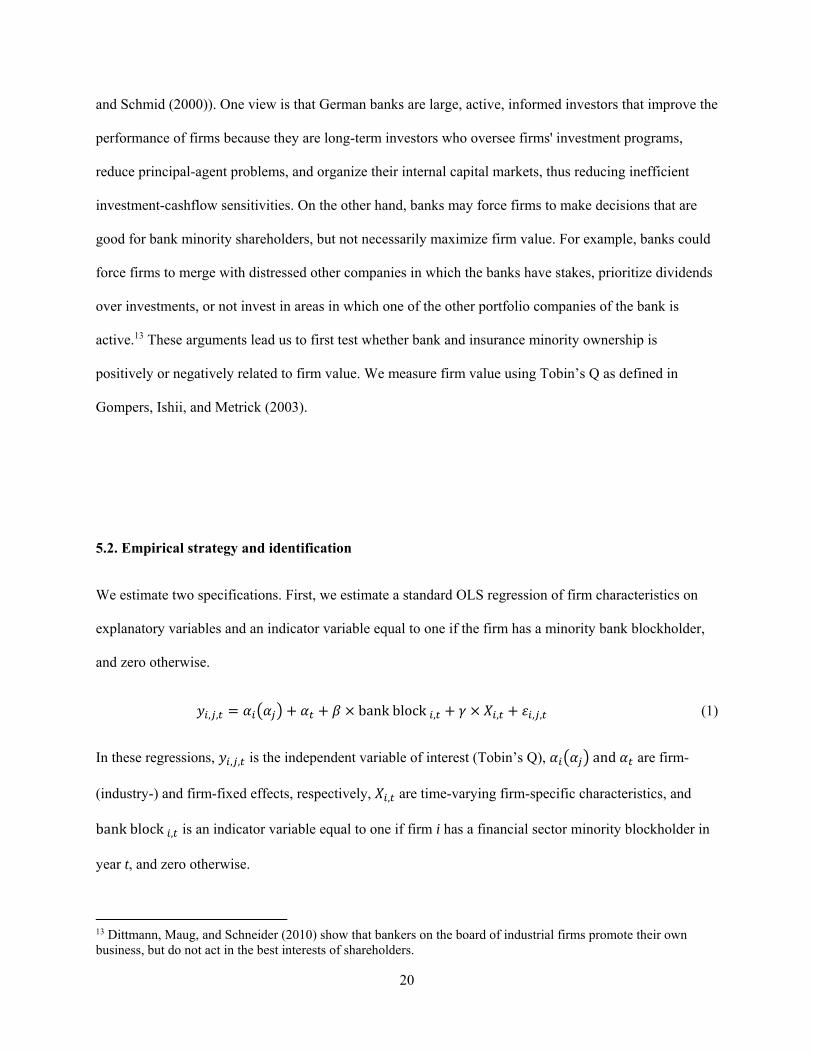
5.2. Empirical strategy and identification
We estimate two specifications. First, we estimate a standard OLS regression of firm characteristics on
explanatory variables and an indicator variable equal to one if the firm has a minority bank blockholder,
and zero otherwise.
, , bankblock , , , , (1)
In these regressions, , , is the independent variable of interest (Tobin’s Q), and are firm-
(industry-) and firm-fixed effects, respectively, , are time-varying firm-specific characteristics, and
bankblock , is an indicator variable equal to one if firm i has a financial sector minority blockholder in
year t, and zero otherwise.
13 Dittmann, Maug, and Schneider (2010) show that bankers on the board of industrial firms promote their own business, but do not act in the best interests of shareholders.
21
The decision to sell a minority block is not exogeneous, however, and unobservable firm characteristics
might drive both the divestment decision of the financial firm as well as the future changes in corporate
behavior. To alleviate this endogeneity problem, we carry out an intention-to-treat analysis in the spirit of
Frydman and Hilt (2017) and von Beschwitz (2017). Frydman and Hilt (2017) examine whether
investment bankers who are directors of railroads influence the level of debt and the interest rates paid by
these railroads on their debt. The decision of an investment banker to be a board member is of course not
exogeneous, and Frydman and Hilt (2017) need quasi-exogeneous variation in the strength of railroads’
relationships with underwriters. They use Section 10 of the Clayton Antitrust Act, passed in 1913 and
implemented in 1920, that prohibited bankers from serving on the boards of railroads for which they
underwrote securities. After the passage of the act, investment bankers had the choice to either
discontinue bond underwriting and remain on the board or to quit the board and continue underwriting.
Frydman and Hilt (2017) cannot use the decision to quit the board after the passage of Section 10 of the
act because such decision may be affected by the potential for future business. Their empirical framework
instead analyzes changes in the outcomes of railroads before and after 1920 using the strength of their
affiliations with bankers in 1913. The strength of affiliation is measured by the percent of underwriting
done up to 1913 by the banks represented on the railroads’ boards in that year.
We analyze the changes in corporate outcomes before and after the implementation of the corporate gains
tax reform in 2002 using the existence of a minority financial blockholder in 1997 – well before the tax
reform was discussed, announced, or implemented – for assignment to treatment and control group. We
therefore estimate firm-fixed effects regressions of Tobin’s Q between 1997 and 2007, centered around
the year of the implementation of the tax reform, on an intention-to-treat indicator interacted with a post-
reform dummy.
An added complication is that treated and control firms differ along a number of dimensions that could be
correlated with the outcome variables and bias the results of our difference-in-difference analysis. Treated
firms are, for example, larger, more likely to pay dividends, or have higher leverage. These variables,
22
however, could also be influenced by the treatment itself – for example, firms could grow more
aggressively if a monitoring bank blockholder is absent – which leads to a bad control problem (e.g.,
Angrist and Pischke (2009)). We therefore only control for the initial characteristics of treated and control
firms, and interact those characteristics with the post-reform dummy, following the strategy outlined in
Barrot (2016).
Hence, we estimate:
, bankblock1997 Post‐reform , Post‐reform , (2)
where , is Tobin’s Q of firm i in year t, and are firm- and time-fixed effects, respectively, ,
are firm-specific characteristics measured in 1997, bankblock1997 is an indicator variable equal to
one if firm i has a financial sector minority blockholder in 1997, and zero otherwise, and Post-reform is
an indicator variable equal to one if the year is 2003 and beyond, and zero otherwise. We address the
issue of serial correlation in difference-in-difference estimations when using long pre- and post-event
windows, raised by Bertrand, Duflo, and Mullainathan (2004), by clustering standard errors at the firm
level.
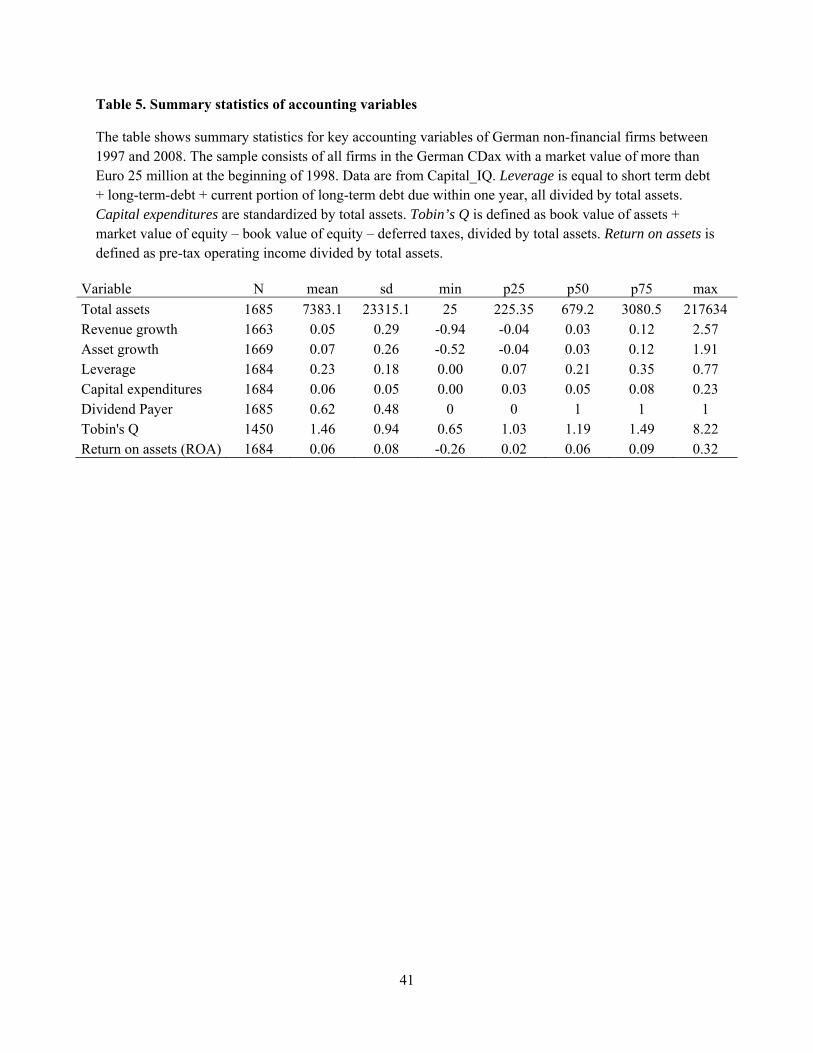
5.3. Summary statistics
Table 5 shows summary statistics for the firm characteristics on our panel of German non-financial firms
(i.e., excluding commercial banks and insurance companies) between 1997 and 2008. German sample
firms have average total assets of Euro 7.38 billion, but the median is much lower at Euro 679 million.
Mean and median revenue growth are 5% and 3%, respectively. Mean asset growth is 7%. German non-
financial firms have on average a leverage ratio of 23%, and spend 6% of total assets on capital
expenditures. During our sample period, on average 62% of them pay dividends. The mean Tobin’s Q is
1.46, and the median Tobin’s Q is 1.19. Mean and median return on assets is 6%.

23
5.4. Tobin’s Q and minority block ownership
We first estimate regressions of Equation (1). In Table 6, Columns 1 through 3 show results that include
time- and industry-fixed effects, while Columns 4 through 6 include time- and firm-fixed effects
regressions. Column 1 shows that firms with financial minority blockholders underperform other firms.
The effect is economically sizeable; having a financial blockholder is associated with a Tobin’s Q that is
0.205 units lower. Relative to the sample average Q of 1.46, this corresponds to a reduction of 14%.
Columns 2 and 3 break out the financial blockholders into blocks held by banks (Column 2) and blocks
held by insurance companies (Column 3). These additional results show that the results are driven by both
banks and insurance companies, with the coefficients being of comparable magnitude. Columms 4
through 6 estimate firm-fixed effects regressions, i.e. the coefficients are within estimates so that we
compare Tobin’s Q of the same firm during their time with and without a financial minority blockholder.
Column 4 shows that the presence of a financial minority blockholder is again strongly significant and
negative. The effect continues to be economically meaningful; firms improve Tobin’s Q by approximately
10% after their financial minority blockholder has sold its stake. In Columns 5 and 6, we break out the
effect and show that in the time-series, the insurance minority blocks have more explanatory power than
the bank minority blocks. The control variable, the natural logarithm of total assets, has the expected sign;
smaller firms have higher values for Tobin’s Q.
Table 7 shows the results from the intention to treat analysis. The treatment group consists of those firms
that have a financial minority blockholder in 1997 and the control group consists of all other firms. The
identifying assumption is that the capital gain tax reform of 1999/2002 did not change the operating
environment of the control and treatment group differently, except through its influence on the ownership
structure. In Columns 1 to 6, we also include the log of total assets in 1996, interacted with the post-
reform dummy, to alleviate concerns that the results are driven by differences in firm size. Columns 4
through 6 include additional pre-determined control variables such as the sales/assets ratio, PPE/assets,
and leverage, all measured in 1996. Columns 1 and 4 show the main result – German non-financial
24
companies that had a financial minority blockholder in 1997 have higher valuations in the years after the
tax reform, when it became much more likely that the minority blockholders would sell their stake. The
effect is economically meaningful; relative to the sample average Q of 1.46, Column 1 shows an increase
in Tobin’s Q of 11.6%, and Column 4 shows an increase of 14.2%. Therefore, it seems that firms which
were more likely to reshuffle their ownership structure after the capital gains tax reform indeed increased
in value. To the extent that our identification strategy is plausible, our results show evidence of value
increases caused by moving from an inefficient ownership structure to an efficient ownership structure.
Columns 2, 3, 5, and 6 split the financial minority blockholder in 1997 into bank minority blocks and
insurance minority blocks. The table shows positive and statistically significant coefficients for bank
blocks post reform in both specifications. While the insurance block is not significant in Column 3, it is
close in economic magnitude to the statistically significant block in Column 6.
Overall, the analysis in Table 7 suggests a positive, causal effect of reduction in bank minority ownership
on improvements in firm value. These results match the conclusions from the event study of Section 4.
6. Conclusion
On December 23, 1999, Germany passed a tax reform that repealed the corporate capital gains tax of
approximately 50% on domestic corporate holdings. The capital gains reform enabled banks and
insurance companies to sell their stakes in non-financial German corporations and significantly changed
the ownership structure of German firms. We analyze these plausibly exogenous changes in corporate
minority block ownership in Germany and its consequences for firm performance. If these corporate
capital gains taxes discouraged value-enhancing asset reallocation by creating a “lock-in” effect prior to
the reform, some corporations had a sub-optimal ownership structure.

25
We show that German corporations with financial sector minority blockholders appreciated in value on
the day the capital gains tax reform was announced. These announcement returns are economically
meaningful at 1.4% to 1.9%. We then use the existence of a bank minority block in 1997 to classify
German publicly listed corporations into treated and control firms and carry out an intention to treat
analysis of the changes in Tobin’s Q. We find that German corporations in which ownership could be
more easily reshuffled after the tax reform, experienced increases in Tobin’s Q of 10% to 14%, depending
on the specification. We believe that our setting brings us closer to a causal interpretation of changes in
ownership on changes leading to changes in Tobin’s Q.

26
References
Angrist, Joshua D., and Jörn-Steffen Pischke, 2009, Mostly harmless econometrics: An empiricist’s companion, Princeton University Press, Princeton, New Jersey.
Azar, José, Martin Schmalz, and Isabel Tecu, 2017, Anti-competitive effects of common ownership, Journal of Finance, forthcoming.
Barrot, Jean-Noël, 2016, Trade credit and industry dynamics: Evidence from trucking firms, Journal of Finance 71, 1975-2016.
Becht, Marco, and Ekkehart Boehmer, 2003, Voting control in German corporations, International Review of Law and Economics 23, 1-29.
Bertrand, Marianne , Esther Duflo, and Sendhil Mullainathan, 2004, How much should we trust differences-in-differences estimates?, The Quarterly Journal of Economics 119, 249-275.
Beyer, Jürgen, 2002, Deutschland AG a.D.: Deutsche Bank, Allianz, und das Verflechtungszentrum grosser deutscher Unternehmen, Max-Planck-Institut für Gesellschaftsforschung, working paper 02/4.
Blanchard, Olivier J., Florencio Lopez-de-Silanes, and Andrei Shleifer, 1994, What do firms do with cash windfalls?, Journal of Financial Economics 36, 337-360.
Cable, John, 1985, Capital market information and industrial performance: The role of West German banks, Economic Journal 95, 118-132.
Chirinko, Robert S., and Julie Ann Elston, 2006, Finance, control, and profitability: The influence of German banks, Journal of Economic Behavior & Organization 59, 69-88.
Claessens, Stijn, Simeon Djankov, Joseph P.H. Fan, and Larry H.P. Lang, 2002, Disentangling the incentive and entrenchment effects of large shareholdings, Journal of Finance 62, 2741-2771.

27
Croci, Ettore, Olaf Ehrhardt, and Eric Nowak, 2013, The corporate governance endgame – an economic analysis of minority squeeze-out regulation in Germany, working paper, University of Lugano.
Dai, Zhonglan, Edward Maydew, Douglas Shackelford, and Harold Zhang, 2008, Capital gains taxes and asset prices: Capitalization or lock-in?, Journal of Finance 63, 709-742.
Demsetz, Harold, and Kenneth Lehn, 1985, The structure of corporate ownership: Causes and consequences, Journal of Political Economy 93, 1155-1177.
Dittmann, Ingolf, Ernst Maug, and Christoph Schneider, 2010, Bankers on the boards of German firms: What they do, what they are worth, and why they are (still) there, Review of Finance 14, 35-71.
Doidge, Craig, and Alexander Dyck, 2015, Taxes and corporate policies: Evidence from a quasi natural experiment, Journal of Finance 70, 45-89.
Edmans, Alex, and Clifford G. Holderness, 2017, Blockholders: a survey of theory and evidence. In: Handbook of the Economics of Corporate Governance. Elsevier, Amsterdam
Edwards, Courtney H., Mark H. Lang, Edward L. Maydew, and Douglas A. Shackelford, 2004, Germany’s repeal of the corporate capital gains tax: The equity market response, Journal of the American Taxation Association 26 (supplement), 73-97.
Elsas, Ralf, and Jan P. Krahnen, 2004, Universal banks and relationships with firms, in: The German Financial System, Jan P. Krahnen and Reinhard H. Schmidt (editors), Oxford University Press, New York, NY.
Foos, Daniel, and Bastian von Beschwitz, 2014, Banks‘ equity stakes and lending: Evidence from a tax reform, working paper, Federal Reserve Board.

28
Frydman, Carola, and Eric Hilt, 2017, Investment banks as corporate monitors in the early twentieth century United States, American Economic Review 107, 1938-1970.
Gieralka, Adam and Agnieszka Drajewicz, 2001, Reaktion des deutschen Kapitalmarktes auf die Ankündigung und Verabschiedung der Unternehmenssteuerreform, Finanz Betrieb 5, 311-321.
Gorton, Gary, and Frank A. Schmid, 2000, Universal banking and the performance of German firms, Journal of Financial Economics 58, 29-80.
Graham, John R., 2003, Taxes and corporate finance: A review, Review of Financial Studies 16, 1075-1129.
Graham, John R., 2008, Taxation taxes and corporate finance, in B. Espen Eckbo, ed.: Handbook of Corporate Finance: Empirical Corporate Finance, Amsterdam (North Holland).
Grundfest, Joseph A., 1990, Subordination of American capital, Journal of Financial Economics 27, 89-114.
Heider, Florian, and Alexander Ljungqvist (2015), As certain as debt and taxes: Estimating the tax sensitivity of leverage from state tax changes, Journal of Financial Economics 118, 684-712.
Holderness, Clifford G., 2003, A survey of blockholders and corporate control, Economic Policy Review 9, 51-63.
Holderness, Clifford G., and Denis Sheehan, 1988, The role of majority shareholders in publicly held corporations: An exploratory analysis, Journal of Financial Economics 20, 317-346.
Holderness, Clifford G., 2009, The myth of diffuse ownership in the United States, Review of Financial Studies 22, 1377-1408.

29
Höpner, Martin, and Lothar Krempel, 2004, The politics of the German company network, Competition and Change 8, 339-356.
Höpner, Martin, and Lothar Krempel, 2006, Ein Netzwerk in Auflösung: Wie die Deutschland AG zerfällt, working paper, Max Planck Institute for the Study of Societies.
Ivković, Zoran, James Poterba, and Scott Weisbenner, 2005, Tax-motivated trading by individual investors, American Economic Review 95, 1605-1630.
Jin, Li, 2006, Capital gain tax overhang and price pressure, Journal of Finance 61, 1399-1430.
Kengelbach, Jens, and Alexander Roos, 2006, Entflechtung der Deutschland AG - Empirische Untersuchung der Reduktion von Kapital- und Personalverflechtungen zwischen deutschen börsennotierten Gesellschaften, M&A Review 1, 12-21
Keen, Michael, 2002, The German tax reform of 2000, International Tax and Public Finance 9, 603-621.
La Porta, Rafael, Florencio Lopez-de-Silanes, and Andrei Shleifer, 1999, Corporate ownership around the world, Journal of Finance 54, 471-517.
Lehmann, Erik, and Jürgen Weigand, 2000, Does the governed corporation perform better? Governance structures and corporate performance in Germany, European Finance Review 4, 157-195.
Lins, Karl V., 2003, Equity ownership and firm value in emerging markets, Journal of Financial and Quantitative Analysis 38, 159-184.
McConnell, John L., and Henri Servaes, 1990, Additional evidence on equity ownership and corporate value, Journal of Financial Economics 27, 595-612.
30
Mehran, Hamid, 1995, Executive compensation structure, ownership, and firm performance, Journal of Financial Economics 38, 163-184.
Rünger, Silke, 2012, The effect of Germany's repeal of the corporate capital gains tax - Evidence from the disposal of corporate minority holdings, Arqus working paper.
Späthe, Stephan H., 2012, The Value of Industrial Shareholdings in a Universal Bank: The Case of Deutsche Bank in the 1990s, working paper, Goethe University.
Sautner, Zacharias, and Belen Villalonga, 2010, Corporate Governance and Internal Capital Markets, working paper, Frankfurt School of Finance and Management.
von Beschwitz, Bastian, 2017, Cash windfalls and acquisitions, Journal of Financial Economics, forthcoming.
Weber, Anke, 2009, An empirical analysis of the 2000 corporate tax reform in Germany: Effects on ownership and control in listed companies, International Review of Law and Economics 29, 57-66.
Wójcik, Darius, 2003, Change in the German model of corporate governance: Evidence from blockholdings 1997 – 2001, Environment and Planning A 35, 1431-1458.

31
Figure 1: Time series of German stock market index DAX, 1998 – 2010
0
1000
2000
3000
4000
5000
6000
7000
8000
9000

32
Figure 2: Number of blocks by type in German publicly listed firms, 1997, 1999, 2003, and 2007
The figure shows the number of blocks held by different types of non-family blockholders in German publicly listed firms for the years 1997, 1999, 2003, and 2007. The graphs show the number of blocks held by each subgroup, divided by the number of sample firms in each year. Because our sample tracks firms through time, the number of firms decreases steadily (1997=244, 1999=243, 2003=192, and 2007=144). The standardization allows comparisons across years.
0
0.05
0.1
0.15
0.2
0.25
0.3
1997 1999 2003 2007

33
Figure 3a: Network of minority stakes of German publicly listed firms in sample firms, December 1997

34
Figure 3b: Network of minority stakes of German publicly listed firms in sample firms, December 2004

35
Figure 3c: Network of minority stakes of German publicly listed firms in sample firms, December 2007

36
Table 1: Ownership summary statistics of German sample firms, 1997-2009
1997 1998 1999 2000 2001 2002 2003 2004 2005 2006 2007 2008 2009
Number of firms 243.00 243.00 242.00 237.00 230.00 225.00 192.00 175.00 163.00 149.00 143.00 137.00 128.00
Number of firms with bank/insur block 71.00 67.00 61.00 59.00 55.00 58.00 45.00 36.00 26.00 21.00 19.00 16.00 14.00
Number of firms with industry block 51.00 48.00 50.00 46.00 39.00 35.00 24.00 20.00 15.00 12.00 12.00 9.00 8.00
% of firms with at least one blockholder 0.97 0.97 0.97 0.97 0.98 0.99 0.99 0.99 0.98 0.98 0.99 0.99 0.99
Mean total block ownership 60.48 62.02 64.52 66.66 68.02 69.60 67.22 65.60 63.31 62.40 61.81 62.05 62.28
Median total block ownership 64.24 65.98 69.71 71.61 74.02 74.24 72.19 73.65 70.02 68.68 66.82 66.99 66.62
Mean number of blocks / firm 1.86 1.84 1.79 1.83 1.86 1.92 2.01 1.99 1.97 2.03 2.08 2.15 2.20
Total number of blocks 452.00 446.00 433.00 433.00 428.00 431.00 385.00 348.00 321.00 303.00 298.00 295.00 281.00
Total number of bank/insur blocks 115.00 98.00 92.00 85.00 74.00 77.00 59.00 46.00 34.00 30.00 26.00 20.00 18.00
Total number of industry blocks 59.00 57.00 57.00 49.00 43.00 36.00 25.00 21.00 16.00 12.00 12.00 9.00 8.00
Mean size of block, in % 31.44 32.82 34.87 35.56 35.92 36.01 33.17 32.61 31.36 30.07 29.24 28.60 28.15
Mean size of bank/insur block, in % 19.57 18.67 18.17 19.47 21.56 20.53 19.99 21.57 20.50 21.33 26.12 27.29 24.82
Mean size of industry block, in % 49.38 49.13 52.30 60.05 62.27 67.07 67.23 58.41 53.10 59.78 64.72 52.25 52.09
Median size of block, in % 20.40 22.75 25.00 24.00 24.35 18.18 16.01 16.33 15.64 12.97 12.44 12.65 15.00
Median size of bank/insur block, in % 12.50 12.72 13.05 12.36 13.49 12.62 11.07 12.55 11.13 10.02 9.92 15.26 17.95
Median size of industry block, in % 51.70 51.70 53.73 63.90 66.14 79.07 79.13 75.73 50.01 76.66 81.82 53.52 53.74

37
Table 2: List of German publicly listed firms with corporate minority blockholders in 1997
Panel A: Companies with a minority blockholder from the financial sector:
Company Industry
1 AACHENER UND MUENCHENER BETEILIGUNGS-AG Insurance
2 ALLIANZ Insurance
3 BANKGESELLSCHAFT BERLIN Banking
4 BASF Chemical Industry
5 BAYER Chemical Industry
6 BAYERISCHE HYPOTHEKEN- UND WECHSELBANK Banking
7 BMW BAYERISCHE MOTORENWERKE Automobile
8 BREMER WOLL-KAEMMEREI Textile
9 BUDERUS Heavy Machinery
10 CONTINENTAL Automobile
11 DAIMLER-BENZ Automobile
12 DEUTSCHE BETEILIGUNGS UNTERNEHMENSBETEILIGUNGSGESELLSCHAFT
Industrial holdings
13 DEUTSCHE HYPOTHEKENBANK (ACTIEN-GESELLSCHAFT) Banking
14 DEUTSCHE LUFTHANSA Transportation
15 DEUTSCHE VERKEHRSBANK Banking
16 DOUGLAS HOLDING Consumer goods
17 DRESDNER BANK Banking
18 DYCKERHOFF Construction
19 FRESENIUS Chemical Industry
20 FUCHS PETROLUB OEL + CHEMIE Chemical Industry
21 HEIDELBERGER ZEMENT Construction
22 HOLSTEN-BRAUEREI Breweries
23 HOLZMANN, PHILIPP, Construction
24 IKB DEUTSCHE INDUSTRIEBANK Banking
25 KARSTADT Consumer goods
26 LEIFHEIT Consumer goods
27 LEONISCHE DRAHTWERKE Steel and Coal
28 LINDE Mechanical Engineering
29 MANNHEIMER VERSICHERUNGEN Insurance
30 METALLGESELLSCHAFT Steel and Coal
31 MUENCHENER RUECKVERSICHERUNGS-GESELLSCHAFT Insurance
32 NUERNBERGER BETEILIGUNGS-AG Insurance
33 PHOENIX Automobile
34 RWE Energy
35 SALAMANDER Textile
36 SCHERING Chemical Industry

38
37 SUEDZUCKER Consumer goods
38 THYSSENKRUPP AG Steel and Coal
39 VBH VEREINIGTER BAUBESCHLAG-HANDEL Consumer goods
40 VEBA Energy
41 VIAG Energy
42 VK MUEHLEN Consumer goods
43 VOSSLOH Electronics
44 WMF WUERTTEMBERGISCHE METALLWARENFABRIK Consumer goods
45 WUERTTEMBERGISCHE VERSICHERUNGS-BETEILIGUNGSGESELLSCHAFT Insurance
Panel B: Companies with a minority blockholder from the non-financial sector
1 THUEGA Energy
2 HARPEN Industrial holdings
3 BUDERUS Mechanical engineering
4 HOLZMANN, PHILIPP, Construction
5 BEWAG BERLINER KRAFT- UND LICHT Energy
6 AGIV FUER INDUSTRIE UND VERKEHRSWESEN Mechanical engineering
7 VEW VEREINIGTE ELEKTRIZITAETSWERKE WESTFALEN Energy
8 BAYERISCHE HYPOTHEKEN- UND WECHSELBANK Banking
9 NECKARWERKE STUTTGART Energy
10 KLOECKNER-WERKE Mechanical engineering
11 HEW HAMBURGISCHE ELEKTRICITAETS-WERKE Energy
12 HUTSCHENREUTHER Consumer goods
13 VK MUEHLEN Consumer goods
39
Table 3: Event study of the announcement of the German capital gain tax reform
The table shows regressions of stock returns at the announcement of the German capital gain tax reform on December 23, 1999. We measure announcement returns over the event window (-1, 0). The dependent variables are industrial holding, bank, and insurance company which are indicator variables equal to one if the sample firm is a private equity-like holding company, a bank, or an insurance company, respectively. Financial minority blockholder is an indicator variable equal to one if a sample firm has a minority blockholder that is a German bank or insurance firm, and zero otherwise, and industrial minority blockholder is an indicator variable equal to one if a sample firm has a minority blockholder that is another publicly listed German industrial firm, and zero otherwise. A minority stake is any block above 5% and below 20%. The sample construction is described in detail in Section 2. Stock returns are calculated from prices quoted on the floor at Deutsche Börse or on the electronic trading platform Xetra, wherever the trading volume is higher. The regressions only include sample firms with non-zero trading volume on December 23, 1999. Standard errors are reported below the coefficients in parentheses. Statistical significance at the 10%, 5%, and 1% level is indicated by *, **, and ***, respectively.
Model 1 Model 2 Model 3 Model 4 Model 5 Industrial holding 0.021 0.022* (0.013) (0.013) Bank 0.031*** 0.028*** (0.009) (0.009) Insurance company 0.035*** 0.032*** (0.010) (0.010) Non-financial minority 0.003 -0.001 -0.001 blockholder (0.013) (0.013) (0.013) Financial minority 0.021*** 0.021*** 0.018*** blockholder (0.006) (0.006) (0.006) Constant 0.004 0.010*** 0.006** 0.006** 0.001 (0.003) (0.003) (0.003) (0.003) (0.003) R2 0.113 0.000 0.056 0.056 0.150 N 193 193 193 193 193

40
Table 4: Event study of the announcement of the German capital gain tax reform, with volume threshold
The table shows regressions of stock returns at the announcement of the German capital gain tax reform on December 23, 1999. We measure announcement returns over the event window (-1, 0). The dependent variables are industrial holding, bank, and insurance company which are indicator variables equal to one if the sample firm is a private equity-like holding company, a bank, or an insurance company, respectively. Financial minority blockholder is an indicator variable equal to one if a sample firm has a minority blockholder that is a German bank or insurance firm, and zero otherwise, and industrial minority blockholder is an indicator variable equal to one if a sample firm has a minority blockholder that is another publicly listed German industrial firm, and zero otherwise. A minority stake is any block above 5% and below 20%. The sample construction is described in detail in Section 2. Stock returns are calculated from prices quoted on the floor at Deutsche Börse or on the electronic trading platform Xetra, wherever the trading volume is higher. The regressions only include sample firms with trading volume of at least 5,000 shares on December 23, 1999. Standard errors are reported below the coefficients in parentheses. Statistical significance at the 10%, 5%, and 1% level is indicated by *, **, and ***, respectively.
Model 1 Model 2 Model 3 Model 4 Model 5 Industrial holding 0.051** 0.050** (0.023) (0.023) Bank 0.051*** 0.044*** (0.014) (0.014) Insurance company 0.061*** 0.056*** (0.017) (0.016) Non-financial minority 0.057* 0.039 0.030 blockholder (0.031) (0.031) (0.029) Financial minority 0.027*** 0.025** 0.019** blockholder (0.009) (0.009) (0.009) Constant 0.006 0.014*** 0.007 0.007 0.001 (0.004) (0.004) (0.005) (0.005) (0.005) R2 0.224 0.033 0.082 0.096 0.279 N 101 101 101 101 101
41
Table 5. Summary statistics of accounting variables
The table shows summary statistics for key accounting variables of German non-financial firms between 1997 and 2008. The sample consists of all firms in the German CDax with a market value of more than Euro 25 million at the beginning of 1998. Data are from Capital_IQ. Leverage is equal to short term debt + long-term-debt + current portion of long-term debt due within one year, all divided by total assets. Capital expenditures are standardized by total assets. Tobin’s Q is defined as book value of assets + market value of equity – book value of equity – deferred taxes, divided by total assets. Return on assets is defined as pre-tax operating income divided by total assets.
Variable N mean sd min p25 p50 p75 max
Total assets 1685 7383.1 23315.1 25 225.35 679.2 3080.5 217634 Revenue growth 1663 0.05 0.29 -0.94 -0.04 0.03 0.12 2.57 Asset growth 1669 0.07 0.26 -0.52 -0.04 0.03 0.12 1.91 Leverage 1684 0.23 0.18 0.00 0.07 0.21 0.35 0.77 Capital expenditures 1684 0.06 0.05 0.00 0.03 0.05 0.08 0.23 Dividend Payer 1685 0.62 0.48 0 0 1 1 1 Tobin's Q 1450 1.46 0.94 0.65 1.03 1.19 1.49 8.22 Return on assets (ROA) 1684 0.06 0.08 -0.26 0.02 0.06 0.09 0.32

42
Table 6. Tobin’s Q and bank blockholdings
The table presents results from OLS regressions of Tobin’s Q on indicator variables for minority block ownership by banks and insurance companies and control variables. Financial minority blockholder is an indicator variable equal to one if a sample firm has a minority blockholder that is a German bank or insurance firm, and zero otherwise, bank minority blockholder is an indicator variable equal to one if a sample firm has a minority blockholder that is another German commercial bank, and zero otherwise, and insurance minority blockholder is an indicator variable equal to one if a sample firm has a minority blockholder that is another German insurance company, and zero otherwise. A minority stake is any block above 5% and below 20%. The sample construction is described in detail in Section 2. Tobin’s Q is the ratio of the market value of assets to the book value of assets: the market value is calculated as the sum of the book value of assets and the market value of common stock less the book value of common stock and deferred taxes. The control variables include the natural logarithm of total assets. All regressions include year-fixed effects. Columns 1 to 3 include industry-fixed effects based on the industry classification of Deutsche Börse, and Columns 4 to 6 include firm-fixed effects. Standard errors are reported in parentheses and are clustered at the firm-level. Statistical significance at the 10%, 5%, and 1% level is indicated by *, **, and ***, respectively. Model 1 Model 2 Model 3 Model 4 Model 5 Model 6 Log (assets) -0.028 -0.032 -0.033 -0.332* -0.330* -0.329* (0.039) (0.039) (0.038) (0.191) (0.191) (0.191) Financial minority -0.205** -0.138** blockholder (0.082) (0.058) Bank minority -0.196** -0.047 blockholder (0.092) (0.088) Insurance company -0.172* -0.165** minority blockholder
(0.090) (0.070)
Year-fixed effects Yes Yes Yes Yes Yes Yes Industry-fixed effects Yes Yes Yes No No No Firm-fixed effects No No No Yes Yes Yes R2 0.134 0.132 0.132 0.068 0.065 0.067 N 1450 1450 1450 1450 1450 1450

43
Table 7. Intention to treat Tobin’s Q analysis
The table presents results from regressions of Tobin’s Q on indicator variable for minority block ownership by banks and insurance companies and control variables. Financial minority block 1997 is an indicator variable equal to one if a sample firm has a minority blockholder that is a German bank or insurance firm in 1997, and zero otherwise, bank minority block1997 is an indicator variable equal to one if a sample firm has a minority blockholder that is another German commercial bank in 1997, and zero otherwise, and insurance minority block 1997 is an indicator variable equal to one if a sample firm has a minority blockholder that is another German insurance company in 1997, and zero otherwise. A minority stake is any block above 5% and below 20%. Post-reform is an indicator variable equal to one if the fiscal year end is after the date of the implementation of the reform, 2002. The sample construction is described in detail in Section 2. Tobin’s Q is the ratio of the market value of assets to the book value of assets: the market value is calculated as the sum of the book value of assets and the market value of common stock less the book value of common stock and deferred taxes. The control variables include the natural logarithm of total assets measured in 1996, interacted with the post-reform indicator variable (Columns 1 through 6). Columns 4 to 6 include as additional control variables the sales/assets ratio in 1996, PPE/assets in 1996, and leverage in 1996, all interacted with the post-reform indicator variable. All regressions include year-fixed effects and firm-fixed effects. Standard errors are reported in parentheses and are clustered at the firm-level. Statistical significance at the 10%, 5%, and 1% level is indicated by *, **, and ***, respectively.
Model 1 Model 2 Model 3 Model 4 Model 5 Model 6 Financial minority block 0.170** 0.207*** 1997 x Post-reform (0.077) (0.076) Bank minority block 0.149* 0.183** 1997 x Post-reform
(0.088) (0.078)
Insurance minority block 0.189 0.215* 1997 x Post-reform (0.119) (0.115) Log (assets) 1996 x -0.026 -0.022 -0.019 -0.022 -0.017 -0.014 Post-reform (0.038) (0.038) (0.038) (0.036) (0.037) (0.036) Sales/assets 1996 x -0.018 -0.015 -0.013 Post-reform (0.055) (0.055) (0.055) PPE/assets 1996 x -0.546** -0.542** -0.491* Post-reform (0.258) (0.258) (0.261) Leverage 1996 x 0.676* 0.658* 0.680* Post-reform (0.372) (0.374) (0.378) Year-fixed effects Yes Yes Yes Yes Yes Yes Firm-fixed effects Yes Yes Yes Yes Yes Yes R2 0.043 0.043 0.043 0.053 0.052 0.052 N 1440 1440 1440 1440 1440 1440

44
Appendix A – ownership database construction
1. We use BaFin information whenever we can. We only use other data sources if we do not have BaFin information or if we can demonstrate that BaFin information is wrong (did not update correctly) or reporting thresholds were passed but ignored.
2. Sometimes we have more accurate information on block percentage ownership from alternative sources (e.g., annual reports or internet searches) than BaFin because BaFin is only updated after thresholds are being passed. We ignore this more precise information and only correct entries where BaFin failed to update percentage ownership although thresholds were passed. Originally, $21 WpHG stated that a firm crossing 5%, 10%, 25%, 50%, or 75% of the votes of a German company listed on an official EU market has to notify the Bundesanstalt fuer Finanzaufsicht. Since January 2007, the thresholds are: 3, 5, 10, 15, 20, 25, 30, 50, 75%. To be consistent in the time-series, we continue to use the original thresholds even after 2007.
3. If we have ownership information for most years, but miss some intermediary years, we look at the changes between the adjacent years, and ascribe any changes in ownership we observe to the first missing year. E.g., we have the following data: Steve Schmidt 12/31/1998: 15.3%, Steve Schmidt 12/31/2001: 9.5%. We create two new data entries, 12/31/1999: Steve Schmidt 9.5%, 12/31/2000: Steve Schmidt: 9.5%. If there is a new blockholder in 2001, and we have missing years in 1999 and 2000 and cannot find information on the block purchase in SDC Platinum, we assume that the block purchase happens on 12/31/1999.
4. If ownership passes from 5.01 to 4.99%, we will record this as delta_ownership = -5.01%, because by the assumption (2) above, we should not have the more detailed information. An ownership increase from 4.5% to 5.01% will be recorded as the creation of a block of 5.01%. Clearly, this rule exaggerates the magnitude and incidence for some block transactions. It is, however, the same problem as in any other study that obtains ownership information from public disclosure based on thresholds (for example, all studies on the US).
5. We have assigned a firm-specific blockholder id that tracks blockholders in the time series. The purpose of this id is to distinguish between true transactions and merely changes in the names of immediate or ultimate blockholders which could happen, for example, if the blockholder is acquired. The blockholder id variable captures whether a block has actually been sold or not.
6. We record immediate and ultimate owners, but not intermediate owners. For the ultimate owner, we follow the immediate owner until the last block in the ownership chain decreases below 50%,or until the stake leaves Germany.
7. We classify foreign ultimate owners as either a) foreign industrial firm, b) foreign insurance firm, c) foreign bank, or d) foreign government.

45
8. Large share repurchase programs which create a minority stake in the own company are classified as such. Immediate owner = “Name of German AG “ Immediate owner legal form “Treasury shares”. Ultimate owner = blank, ultimate owner legal form = blank.
9. There are squeeze-outs in the data. We set the ownership of the large owner to 100% at the year-end of the annual meeting that decides on the squeeze out and record it as such in our database, even if it takes a couple of years for litigation to settle and the official delisting from the stock exchange only happens later.
10. It is sometimes difficult to distinguish between asset managers, banks, and private equity. If we cannot attribute a block to a specific corporate function, we use the most general notion of “investment management firm”. We change the status only if we know that the bank holds the stake in its own name.
11. Sparkassen as owners are classified as “öffentlich-rechtliches Kreditinstitut”.
12. Foundations are sometimes created out of individual / family stakes: If a foundation is established by taking (some of) an individual's stake, then this is not treated as a sale (delta_own = 0 for both the individual and the foundation).