capital improvement plan - spotsylvania.k12.va.us · capital improvement plan fiscal years 2018 -...
TRANSCRIPT

Freedom Middle School
Together, we prepare our students for their future.
CAPITAL IMPROVEMENT PLAN FISCAL YEARS 2018 - 2022
Approved - February 13, 2017 Published - February 28, 2017
Salem Elementary
Chancellor High School
Joint Fleet Transportation Facility

CAPITAL IMPROVEMENT PLAN 2018 – 2022
Approved – February 13, 2017
TABLE OF CONTENTS
SECTION PAGE
Capital Improvement Plan 2018– 2022 Summary ..........................................................2
CIP Project Summary by Department .............................................................................3
Funding Sources for Fiscal Years 2016-2022 ..................................................................7
CIP - Capital Project Requests:
Transportation .....................................................................................................14 Technology ............................................................................................................17 Maintenance .........................................................................................................21
Enrollment ........................................................................................................................28
Enrollment by School (Historical & Projected) ............................................................29
Enrollment by Grade by School (Actual) ......................................................................30
Enrollment by Grade by School (Projected) .................................................................31
Actual 2016-17 Enrollment Compared with Projected 2017-18 Enrollment .............32
Enrollment by Grade (Historical & Projected) .............................................................33
Enrollment Projections and Capacity (Chart) ..............................................................34
1

Capital Improvement Plan (CIP) Summary 2018 – 2022
The CIP provides a forecast of capital maintenance, capital technology, and capital transportation projects required to support Spotsylvania County Public Schools are planned, financed, and constructed. As a planning tool, the CIP addresses needs for the improvement of the division’s technology infrastructure, replacement of major equipment and vehicles, construction of new facilities as needed (including necessary land acquisition), as well as renovations and/or additions to existing school facilities. The capital projects included in the CIP are based on educational program requirements, School Board adopted educational policy standards, and the adequacy of existing facilities and equipment to accommodate present and proposed educational programs. Student enrollment and County population trends influence project recommendations. The Capital Improvement Plan is updated annually enabling adjustments to be made based on the latest information. Residential projects and their potential impact on school enrollments continue to be monitored and the school division will continue to work with the County Planning Department in this effort. Potential educational programming changes may also initiate changes in future CIP projects. Based on the approved 2018-2022 CIP, the CIP budget for FY18 is $27,361,447, a $3,902,835 or 16.6% increase over the FY17 Adopted Budget.
FY14 FY15 FY16 FY17 FY18 $ %Actual Actual Actual Adopted
BudgetApproved Variance Change
CAPITAL PROJECTS 10,417,969$ 6,204,768$ 19,498,756$ 23,458,612$ 27,361,447$ 3,902,835$ 16.60%
DEBT SERVICE 37,185,483 65,870,221 39,222,690 25,295,582 25,581,896 286,314 1.10%
Capital Improvement Plan (CIP) VS. Debt Service Analysis
FY14 FY15 FY16 FY17 FY18 $ %Function/Object Actual Actual Actual Adopted
BudgetApproved Variance Change
3000 PURCHASED SERVICES $ 4,630,430 $ 3,355,758 $ 9,729,752$ 10,720,000 $ 18,333,000 $ 7,613,000 71.00%5808 BOND ISSUENCE EXPENSES 73,717 43,390 87,668 - - - 0.00%6024 TECHNOLOGY SUPPLIES 1,480,527 844,285 4,723,602 8,370,554 4,432,500 -3,938,054 -47.00%8100 REPLACEMENT EQUIPMENT 213,965 - - - - - 0.00%8101 REPLACEMENT OF BUSES 3,268,460 708,092 4,307,189 3,672,636 4,039,836 367,200 10.00%8105 REPLACEMENT/SVC VEHICLES - - 26,126 - - - 0.00%8200 NEW EQUIPMENT 110,943 283,999 624,418 459,991 314,794 -145,197 -31.60%8201 BUSES - ADDITIONAL - 199,194 - 235,431 241,317 5,886 2.50%8204 ADD/BLDG CONSTRUCTION 639,927 770,050 - - - - 0.00%Total $ 10,417,969 $ 6,204,768 $ 19,498,756$ 23,458,612 $ 27,361,447 3,902,835 16.60%
2

CIP Project Summary
3

CIP Overview Summary
Capital Project Area FY 2018-2022 Total Project Cost (FY 2006 – 2022)
Capital Transportation Projects (Buses & Equipment) $20,476,679 $46,612,539
Capital Technology Projects (Upgrades & Replacements) $17,826,798 $63,793,519
Capital Maintenance Projects (Major Repairs & Replacements) $63,489,500 $121,664,954
Grand Total $101,792,977 $232,071,012
Capital Improvement Total Cost By Department
FY 2018 FY 2019 FY 2020 FY 2021 FY 2022
Transportation $4,427,947 $4,258,838 $3,967,516 $3,838,025 $3,984,353
Technology $4,432,500 $3,612,804 $3,525,750 $2,757,094 $3,498,650
Maintenance $18,501,000 $31,405,000 $3,930,500 $5,218,000 $4,435,000
Total $27,361,447 $39,276,642 $11,423,766 $11,813,119 $11,918,003
Note: The five year total is $101,792,977.
4

PROJECT DESCRIPTIONTransportation (Buses)
Location: Joint Fleet/Transportation Services FacilityCompletion: Annually (2018-2022)Budget (within CIP): $20,476,679Budget: $46,612,539
Technology Upgrades
Location: All schools and office sitesCompletion: Annually (2018-2022)Budget (within CIP): $17,826,798Budget: $63,793,519
Capital Maintenance
Location: All school and office sitesCompletion: Annually (2018-2022)Budget (within CIP): $63,489,500Budget: $121,664,954
Ni River Location: Ni River Middle SchoolCompletion: TBDBudget (within CIP): $0Building Construction: 1,050,000$ Site: 100,000$ Soft Cost: 23,000$
1,173,000$ Cost Allocation from BCWH ArchitectThornburg
Location: Thornburg Middle SchoolCompletion: TBDBudget (within CIP): $0Building Construction: 1,050,000$ Site: 100,000$ Soft Cost: 23,000$
1,173,000$ Cost Allocation from BCWH ArchitectElementary School #18
Location: 9823 Brock Road, Spotsylvania, VACompletion: TBDBudget (within CIP): $0 Building Construction 18,995,000$ Site: 3,000,000$ (20 Acres)Soft Cost: 4,199,000$
26,194,000$ Cost Allocation from BCWH Architect
Future Projections Outside 2018-2022
Estimated 4% Annual Escalation
4% Annual Escalation
4% Annual Escalation
(Expenditures during 2018-2022)
Four classroom addition and ancillary facilities to provide space for 100 additional students.
(Expenditures during 2018-2022)
One to two-story masonary structure with 38 regular classrooms, 5 special education rooms and 5 resource rooms. Encompassing 90,448 square feet. which includes an 8,500 sf. multipurpose room.
(Expenditures during 2018-2022)
Current CIP Projects
(Total allocations during project 2006-2022)
Maintenance repair / replacement of HVAC systems, roof systems, fire alarm systems, humidity controls, resurfacing parking lots, running tracks, refurbishing bleachers, telephone/intercom systems, flooring/carpeting, painting, replacing windows, door hardware, field vehicles, renovation of CoHS
(Allocation during 2018-2022)(Total allocations during project 2006-2022)
Four classroom addition and ancillary facilities to provide space for 100 additional students.
Purchase of school buses for "growth" and/or "replacement." These vehicles include 120 "seventy-seven passenger" buses, 37 "Special Needs" buses, 4 "Head Start" buses, 5 engine replacements and bus cameras.
(Allocation during 2018-2022)(Total allocations during project 2006-2022)
Projects include upgrading and/or replacing of systems, switches, cables, servers, blade servers, laptops, controllers, wireless systems, instructional solutions and disk expansion throughout the division.
(Allocation during 2018-2022)
CIP Summary Continued
5

Elementary School #19
One to two-story masonry structures with 38 regular classrooms, 5 special education rooms and 5 resource rooms. Encompassing 90,448 sf. which includes an 8,500 square feet. multipurpose room.
Location: Next to Spotsylvania High School Completion: TBD Budget (within
CIP): $0 (Expenditures during 2018-2022)
Building Construction: $ 18,995,000
4% Annual Escalation
Site: $ 3,000,000 (20 Acres) Soft Cost: $ 4,199,000 $ 26,194,000 Cost Allocation from BCWH Architect High School #6
One to two-story masonry structure encompassing 318,800 square feet including an auxiliary gymnasium, auditorium, and ancillary athletic fields and facilities.
Location: To Be Determined Completion: TBD Budget (within
CIP): $0 (Expenditures during 2018-2022)
Building Construction: $ 71,730,000
4% Annual Escalation
Site: $ 8,000,000 (80 Acres) Athletic
Stadium: $ 6,000,000
Soft Cost: $ 12,900,000 $ 98,630,000 Cost Allocation from BCWH Architect Middle School #8
One to two-story masonry structure encompassing 128,800 square feet including an auxiliary gymnasium and school forum.
Location: To Be Determined (possibly in northeastern portion of the county) Completion: TBD Budget (within
CIP): $0 (Expenditures during 2018-2022)
Building Construction: $ 25,760,000
4% Annual Escalation
Site: $ 4,500,000 (45 Acres) Soft Cost: $ 6,052,000 $ 36,312,000 Cost Allocation from BCWH Architect Acquisition of Future School Sites
Purchasing of school sites for Elementary School #20, High School #6, and Middle School #9. Location: To be determined
Completion: As growth and enrollment require Budget (within
CIP): $0 (Expenditures during 2018-2022)
Budget: $3,392,294
SUBTOTAL:
$130,278,035 (Expenditures for projects listed 2006-2017) SUBTOTAL:
$101,792,977
(Expenditures for projects listed 2018-2022) GRAND
TOTAL:
$232,071,012
Note: The Grand Total excludes future projects after 2022
6

Funding Sources
7

Project Name
Rollover from
Previous Year
Bond
Proceeds Proffers Adjustments
Projected
Expenses (in
current FY
only)
Funding
Balance
Obligated
Funding Project Balance
Additions to TMS and NMS
Elementary School #18
Elementary School #19
High School #6
Middle School #8
Site Acquisitions
Transportation (Buses) 693,730 4,075,558 4,769,288
Capital Maintenance Projects 2,260,264 10,512,500 12,772,764
Technology Upgrades 718,320 8,870,554 9,588,874
Totals 3,672,314 23,458,612 0 0 27,130,926 0 0 0
3,672,314
23,458,612
Adjustment-Earned Interest 0
Adjustment-Bond Issuance Costs 216,123
27,347,050
Unappropriated interest earnings
Total School Cap Projs FB -
Capital Project Tracking Sheet for (Actual) Fiscal Year 2017
New Funding Sources/ Adjustments
Total School Rollover
Total FY17 budget approved
Grand Total (rollover & FY17)
8

Project Name
Rollover from
Previous Year
Bond
Proceeds Proffers Adjustments
Projected
Expenses (in
current FY
only)
Funding
Balance
Obligated
Funding Project Balance
Additions to TMS and NMS
Elementary School #18
Elementary School #19
High School #6
Middle School #8
Site Acquisitions
Transportation (Buses) 4,427,947 4,427,947
Capital Maintenance Projects 18,501,000 18,501,000
Technology Upgrades 4,432,500 4,432,500
Totals 0 27,361,447 0 0 27,361,447 0 0 0
0
27,361,447
27,361,447
Unappropriated interest earnings
Total School Cap Projs FB -
Capital Project Tracking Sheet for (Projected) Fiscal Year 2018
New Funding Sources/ Adjustments
Total School Rollover
Total FY18 budget approved
Grand Total (rollover & FY18)
9

Project Name
Rollover from
Previous Year
Bond
Proceeds Proffers Adjustments
Projected
Expenses (in
current FY
only)
Funding
Balance
Obligated
Funding Project Balance
Additions to TMS and NMS
Elementary School #18
Elementary School #19
High School #6
Middle School #8
Site Acquisitions
Transportation (Buses) 4,258,838 4,258,838
Capital Maintenance Projects 31,405,000 31,405,000
Technology Upgrades 3,612,804 3,612,804
Totals 0 39,276,642 0 0 39,276,642 0 0 0
0
39,276,642
39,276,642
Unappropriated interest earnings
Total School Cap Projs FB -
Capital Project Tracking Sheet for (Projected) Fiscal Year 2019
New Funding Sources/ Adjustments
Total School Rollover
Total FY19 budget approved
Grand Total (rollover & FY19)
10

Project Name
Rollover from
Previous Year
Bond
Proceeds Proffers Adjustments
Projected
Expenses (in
current FY
only)
Funding
Balance
Obligated
Funding Project Balance
Additions to TMS and NMS
Elementary School #18
Elementary School #19
High School #6
Middle School #8
Site Acquisitions
Transportation (Buses) 3,967,516 3,967,516
Capital Maintenance Projects 3,930,500 3,930,500
Technology Upgrades 3,525,750 3,525,750
Totals 0 11,423,766 0 0 11,423,766 0 0 0
0
11,423,766
11,423,766
Unappropriated interest earnings
Total School Cap Projs FB -
Capital Project Tracking Sheet for (Projected) Fiscal Year 2020
New Funding Sources/ Adjustments
Total School Rollover
Total FY20 budget approved
Grand Total (rollover & FY20)
11

Project Name
Rollover from
Previous Year
Bond
Proceeds Proffers Adjustments
Projected
Expenses (in
current FY
only)
Funding
Balance
Obligated
Funding Project Balance
Additions to TMS and NMS
Elementary School #18
Elementary School #19
High School #6
Middle School #8
Site Acquisitions
Transportation (Buses) 3,838,025 3,838,025
Capital Maintenance Projects 5,218,000 5,218,000
Technology Upgrades 2,757,094 2,757,094
Totals 0 11,813,119 0 0 11,813,119 0 0 0
0
11,813,119
11,813,119
Unappropriated interest earnings
Total School Cap Projs FB -
Capital Project Tracking Sheet for (Projected) Fiscal Year 2021
New Funding Sources/ Adjustments
Total School Rollover
Total FY21 budget approved
Grand Total (rollover & FY21)
12

Project Name
Rollover from
Previous Year
Bond
Proceeds Proffers Adjustments
Projected
Expenses (in
current FY
only)
Funding
Balance
Obligated
Funding Project Balance
Additions to TMS and NMS
Elementary School #18
Elementary School #19
High School #6
Middle School #8
Site Acquisitions
Transportation (Buses) 3,984,353 3,984,353
Capital Maintenance Projects 4,435,000 4,435,000
Technology Upgrades 3,498,650 3,498,650
Totals 0 11,918,003 0 0 11,918,003 0 0 0
0
11,918,003
11,918,003
Unappropriated interest earnings
Total School Cap Projs FB -
Capital Project Tracking Sheet for (Projected) Fiscal Year 2022
New Funding Sources/ Adjustments
Total School Rollover
Total FY22 budget approved
Grand Total (rollover & FY22)
13

Transportation Capital Project Requests
14

School Buses
DEPARTMENT:
PROJECT NAME:
DESCRIPTION:
JUSTIFICATION:
TOTAL CAPITAL PROJECT COST:
Planning & Design
2006-2022
PROJECT CIP
FY06/07/08/09 FY10 FY11 FY12 FY13 FY14 FY15 FY16 FY17 FY18 FY19 FY20 FY21 FY22 Totals Totals
2017-2021
Financing/Funding Methods:
Proffers $0 $0 $0 $0 $0 $0 $0 $0 $0 $0 $0 $0 $0 $0 $0 $0
Va. Public School Authority $0 $0 $0 $0 $0 $0 $0 $0 $0 $0 $0 $0 $0 $0 $0 $0
General Obligation Bond $5,687,572 $0 $0 $1,178,089 $0 $3,512,465 $1,337,958 $4,382,228 $4,075,558 $4,427,947 $4,258,838 $3,967,516 $3,838,025 $3,984,353 $40,650,549 $20,476,679
State Aide $0 $0 $0 $0 $0 $0 $0 $0 $0 $0 $0 $0 $0 $0 $0 $0
Lease Purchase $0 $0 $0 $0 $0 $0 $0 $0 $0 $0 $0 $0 $0 $0 $0 $0
Federal Aid $0 $0 $0 $0 $0 $0 $0 $0 $0 $0 $0 $0 $0 $0 $0 $0
Transfer from General Fund Local
Revenues $0 $0 $0 $0 $2,650,074 $0 $0 $0 $0 $0 $0 $0 $0 $0 $2,650,074 $0
Service Charge $0 $0 $0 $0 $0 $0 $0 $0 $0 $0 $0 $0 $0 $0 $0 $0
Other $0 $3,311,916 $0 $0 $0 $0 $0 $0 $0 $0 $0 $0 $0 $0 $3,311,916 $0
Total Funding 5,687,572.00$ $3,311,916 $0 $1,178,089 $2,650,074 $3,512,465 $1,337,958 $4,382,228 $4,075,558 $4,427,947 $4,258,838 $3,967,516 $3,838,025 $3,984,353 $46,612,539 $20,476,679
Capital Expenditures
Professional Services $0 $0 $0 $0 $0 $0 $0 $0 $0 $0 $0 $0 $0 $0 $0 $0
Land $0 $0 $0 $0 $0 $0 $0 $0 $0 $0 $0 $0 $0 $0 $0 $0
Construction $0 $0 $0 $0 $0 $0 $0 $0 $0 $0 $0 $0 $0 $0 $0 $0
Vehicles & Equipment 5,687,572.00$ $3,311,916 $0 $1,178,089 $2,650,074 $3,512,465 $1,337,958 $4,382,228 $4,075,558 $4,427,947 $4,258,838 $3,967,516 $3,838,025 $3,984,353 $46,612,539.00 $20,476,679
Other $0 $0 $0 $0 $0 $0 $0 $0 $0 $0 $0 $0 $0 $0 $0 $0
Total Capital Expenditures $5,687,572 $3,311,916 $0 $1,178,089 $2,650,074 $3,512,465 $1,337,958 $4,382,228 $4,075,558 $4,427,947 $4,258,838 $3,967,516 $3,838,025 $3,984,353 $46,612,539 $20,476,679
$8,855,894
SCHOOL BUSES (purchase) Non-construction
Spotsylvania County Public Schools
$20,476,679
Property Acquisition Contruction/Implementation
N.A. FY 2018-2022
The revised recommendation replacement schedule for school buses is 15 years. The school division requests replacement of school buses older than 15 years for regular transportation needs and older than 10 years for special needs
buses. Maintenance and repairs are very expensive for the specially-equipped buses after this time period. Due to the changes in technology, it is not uncommon for a shortage or the non-existence of parts available after a few years
for the special equipment required in/on these buses. New emission standards require replacement of older buses as well.
Replacement of "regular" school buses that are at least fifteen (15) years old. Replacement of specially equipped school buses that are ten (10) years old. Add to the bus fleet to match the transportation needs of the school division
with regard to student ridership and enrollment.
15

Transportation
Capital Project Details 2018-2022
Description Qty
FY 2018 TotalCost
QtyFY 2019 Total
CostQty
FY 2020 Total Cost
QtyFY 2021
Total CostQty
FY 2022 Total Cost Total
REPLACEMENT BUSES 77-Passenger 24 $2,812,176 24 $2,882,472 22 $2,708,310 22 $2,776,026 22 $2,845,436 $14,024,420 SpEd 8 $993,144 6 $763,482 6 $782,568 6 $802,128 6 $822,186 $4,163,508 Head Start 2 $234,516 2 $241,552 0 0 0 $476,068Total Replacement Buses 34 $4,039,836 32 $3,887,506 28 $3,490,878 28 $3,578,154 28 $3,667,622 $18,663,996
ADDITIONAL BUSES 77-Passenger 1 $117,174 1 $120,103 2 $246,210 1 126,183$ 1 $129,338 $739,008 SpEd 1 $124,143 1 $127,247 1 $130,428 1 133,688$ 1 $137,031 $652,537Total Additional Buses 2 $241,317 2 $247,350 3 $376,638 2 259,871$ 2 $266,369 $1,391,545
ANCILLARY BUS EQUIPMENT (Cameras) $100,000 $100,000 $100,000 $0 $0 $300,000
BUS ENGINE REPLACEMENT 2 $46,794 1 $23,982 $0 $0 2 $50,362 $121,138
TOTAL $4,427,947 $4,258,838 $3,967,516 3,838,025$ $3,984,353 $20,476,679
16

Technology Capital Project Requests
17

Technology
DEPARTMENT:
PROJECT NAME: TECHNOLOGY Non-Construction
DESCRIPTION:
JUSTIFICATION:
TOTAL CAPITAL PROJECT COST:
Planning & Design
2006-2022
PROJECT CIP
FY06/07/08/09 FY10 FY11 FY12 FY13 FY14 FY15 FY16 FY17 FY18 FY19 FY20 FY21 FY22 Totals Totals
2017-2022
Financing/Funding Methods:
Proffers $0 $0 $0 $0 $0 $0 $0 $0 $0 $0 $0 $0 $0 $0 $0 $0
Va. Public School Authority $0 $0 $0 $0 $0 $0 $0 $0 $0 $0 $0 $0 $0 $0 $0 $0
General Obligation Bond (Bond Rf
2005 & 06) $17,793,079 $0 $0 $1,982,828 $0 $2,811,056 $1,488,120 $5,538,807 $8,870,554 $4,432,500 $3,612,804 $3,525,750 $2,757,094 $3,498,650 $56,311,242 $17,826,798
State Aide $0 $0 $0 $0 $0 $0 $0 $0 $0 $0 $0 $0 $0 $0 $0 $0
Lease Purchase $0 $0 $0 $0 $0 $0 $0 $0 $0 $0 $0 $0 $0 $0 $0 $0
Federal Aid $0 $0 $0 $0 $0 $0 $0 $0 $0 $0 $0 $0 $0 $0 $0 $0
Transfer from General Fund Local
Revenues $0 $0 $0 $0 $2,175,817 $0 $0 $0 $0 $0 $0 $0 $0 $0 $2,175,817 $0
Service Charge $0 $0 $0 $0 $0 $0 $0 $0 $0 $0 $0 $0 $0 $0 $0 $0
Other (Proffer) $58,819 $0 $0 $0 $0 $0 $0 $0 $0 $0 $0 $0 $0 $0 $58,819 $0
Other (Interest Earned on Bonds) $5,247,641 $0 $0 $0 $0 $0 $0 $0 $0 $0 $0 $0 $0 $0 $5,247,641 $0
Total Funding $23,099,539 $0 $0 $1,982,828 $2,175,817 $2,811,056 $1,488,120 $5,538,807 $8,870,554 $4,432,500 $3,612,804 $3,525,750 $2,757,094 $3,498,650 $63,793,519 $17,826,798
Capital Expenditures
Professional Services $0 $0 $0 $0 $0 $0 $0 $0 $0 $0 $0 $0 $0 $0 $0 $0
Land $0 $0 $0 $0 $0 $0 $0 $0 $0 $0 $0 $0 $0 $0 $0 $0
Construction $0 $0 $0 $0 $0 $0 $0 $0 $0 $0 $0 $0 $0 $0 $0 $0
Vehicles & Equipment $15,244,524 $2,548,555 $0 $1,982,828 $2,175,817 $2,811,056 $1,488,120 $5,538,807 $8,870,554 $4,432,500 $3,612,804 $3,525,750 $2,757,094 $3,498,650 $58,487,059 $17,826,798
Other $5,306,460 $0 $0 $0 $0 $0 $0 $0 $0 $0 $0 $0 $0 $0 $5,306,460 $0
Total Capital Expenditures $20,550,984 $2,548,555 $0 $1,982,828 $2,175,817 $2,811,056 $1,488,120 $5,538,807 $8,870,554 $4,432,500 $3,612,804 $3,525,750 $2,757,094 $3,498,650 $63,793,519 $17,826,798
#########
Spotsylvania County Public Schools
Maintenance, repair, and replacement of computers, servers, switches, and networks throughout the Spotsylvania County Schools Division.
Spotsylvania County Schools continues to maintain and improve instructional and support technology through the replacement of computers, servers, cables, blade servers, controllers, laptop computers, switches and disk
expansion, and other equipment. An updated technology infrastructure allows staff and parents to access more resources and communicate more effectively utilizing the latest applications.
Property Acquisition Contruction/Implementation
N.A. FY 2018-2022
$17,826,798
18

Technology Capital Project Details
2018-2022
Units Type Cost (Each) Description Amount440 EA 650$ Replacement Computer (Desktops + Laptops) 286,000$ 17 EA 15,000$ Replacement Instructional Tablet ES 255,000$ 25 EA 1,900$ Multi-function Printers (centralized printing) 47,500$ 1 EA 45,000$ Replacement Blade Server Enclosure 45,000$ 7 EA 10,000$ Replacement Blade Servers 70,000$ 1 EA 2,750,000$ Safety and Security 2,750,000$ 1 EA 706,000$ Multimedia Instructional Solution 706,000$ 3 EA 15,000$ Backup Solution Media Servers 45,000$
19 EA 12,000$ School File Servers 228,000$ Annual Total 4,432,500$
Units Type Cost (Each) Description Amount800 EA 650$ Replacement Computer (Desktops + Laptops) 520,000$ 18 EA 12,000$ School File Server Part II 216,000$ 2 EA $ 85,000 Replacement Wireless Controllers 170,000$ 2 EA 129,902$ Replacement Internet Firewalls 259,804$ 1 EA 120,000$ Replacement F5 Load Balancer 120,000$ 1 EA 125,000$ Replacement Internet Router 125,000$ 1 EA 1,000,000$ Safety and Security 1,000,000$ 3 EA $ 49,000 Replacement Blade Enclosures 147,000$ 1 EA $ 545,000 Multimedia Instructional Solution 545,000$ 3 EA $ 100,000 RTI Instructional Intervention Solution 300,000$ 21 EA $ 10,000 Replacement Blade Servers 210,000$
Annual Total 3,612,804$
Units Type Cost (Each) Description Amount
1975 EA 650$ Replacement Computer (Desktops + Laptops, Chromebooks) 1,283,750$
48 EA $ 18,000 Replacement MDF Network Switch 864,000$ 2 EA 240,000$ Replacement Data Domain 480,000$ 1 EA 350,000$ Replacement 3Par SAN #1 350,000$ 4 EA 80,000$ Replacement SAN Core Switches 320,000$ 8 EA 24,000$ Replacement SAN Switches in Enclosures 192,000$ 1 EA 36,000$ Hardware refresh 36,000$
Annual Total 3,525,750$
FY 2020
FY 2019
FY 2018
19

Technology Capital Project Details
2018-2022
Units Type Cost (Each) Description Amount
1624 EA 650$ Replacement Computer (Desktops + Laptops, Chromebooks) 1,055,600$
90 EA 1,400$ Replacement LAN Switches 126,000$ 100 EA $ 2,400 Replacement PoE LAN Switches part 2 240,000$ 70 EA 1,500$ Multi-Function Printer Refresh 105,000$ 1 EA 350,000$ Replacement 3Par SAN #2 350,000$ 1 EA 500,000$ Safety/Security Update 500,000$
31 EA 12,274$ Personalized Learning (upgrade and/or replacement) 380,494$ Annual Total 2,757,094$
Units Type Cost (Each) Description Amount
2921 EA 650$ Replacement Computer (Desktops + Laptops, Chromebooks) 1,898,650$
500 EA 1,400$ Replacement LAN Switches 700,000$ 1000 EA 900$ Access Points 1 of 2 900,000$
Annual Total 3,498,650$ Grand Total 17,826,798$
FY 2022
FY 2021
20

Maintenance Capital Project Requests
21

Capital Maintenance
DEPARTMENT: Spotsylvania County Public Schools
PROJECT NAME: CAPITAL MAINTENANCE PROJECTS Non-Construction
DESCRIPTION:
JUSTIFICATION:
TOTAL CAPITAL PROJECT COST:
Planning & Design
2006-2022PROJECT CIP
FY06/07/08/09 FY10 FY11 FY12 FY13 FY14 FY15 FY16 FY17 FY18 FY19 FY20 FY21 FY22 Totals Totals2017-2022
Financing/Funding Methods:Proffers $0 $0 $0 $0 $0 $377,608 $0 $0 $0 $0 $0 $0 $0 $0 $377,608 $0Va. Public School Authority $0 $0 $0 $0 $0 $0 $0 $0 $0 $0 $0 $0 $0 $0 $0 $0General Obligation Bond $9,926,700 $0 $2,581,293 $3,922,161 $0 $5,405,478 $4,913,067 $8,708,490 $10,512,500 $18,501,000 $31,405,000 $3,930,500 $5,218,000 $4,435,000 $109,459,189 $63,489,500State Aide $0 $0 $0 $0 $0 $0 $0 $0 $0 $0 $0 $0 $0 $0 $0 $0Lease Purchase $0 $0 $0 $0 $0 $0 $0 $0 $0 $0 $0 $0 $0 $0 $0 $0Federal Aid $0 $0 $0 $0 $0 $0 $0 $0 $0 $0 $0 $0 $0 $0 $0 $0Transfer from General Fund Local
Revenues $0 $0 $0 $0 $4,476,777 $0 $0 $0 $0 $0 $0 $0 $0 $0 $4,476,777 $0Service Charge $0 $0 $0 $0 $0 $0 $0 $0 $0 $0 $0 $0 $0 $0 $0 $0Other (Rollover + Interest) $805,500 $1,812,115 $0 $0 $0 $80,024 $0 $0 $0 $0 $0 $0 $0 $0 $2,697,639 $0Other (Redirected Use of Bonds) $0 $4,653,741 $0 $0 $0 $0 $0 $0 $0 $0 $0 $0 $0 $0 $4,653,741 $0
Total Funding $10,732,200 $6,465,856 $2,581,293 $3,922,161 $4,476,777 $5,863,110 $4,913,067 $8,708,490 $10,512,500 $18,501,000 $31,405,000 $3,930,500 $5,218,000 $4,435,000 $121,664,954 $63,489,500
Capital ExpendituresProfessional Services $0 $0 $0 $0 $0 $0 $0 $0 $0 $0 $0 $0 $0 $0 $0 $0Land $0 $0 $0 $0 $0 $0 $0 $0 $0 $0 $0 $0 $0 $0 $0 $0Construction $0 $0 $0 $0 $0 $0 $0 $0 $0 $0 $0 $0 $0 $0 $0 $0Other (Redirected Use of Bonds) $0 $4,653,741 $0 $0 $0 $0 $0 $0 $0 $0 $0 $0 $0 $0 $4,653,741 $0Vehicles & Equipment $0 $0 $0 $0 $175,159 $95,000 $308,000 $453,875 $292,500 $236,000 $90,000 $250,500 $230,000 $300,000 $2,431,034 $1,106,500Other (Capital Maintenance Projects) $6,563,239 $5,981,076 $2,581,293 $3,922,161 $4,301,618 $5,768,110 $4,605,067 $8,254,615 $10,220,000 $18,265,000 $31,315,000 $3,680,000 $4,988,000 $4,135,000 $114,580,179 $62,383,000
Total Capital Expenditures $6,563,239 $10,634,817 $2,581,293 $3,922,161 $4,476,777 $5,863,110 $4,913,067 $8,708,490 $10,512,500 $18,501,000 $31,405,000 $3,930,500 $5,218,000 $4,435,000 $121,664,954 $63,489,500
Capital Maintenance Projects are large-scale projects involving the major repair, replacement, renovation, and/or maintenance of school division facilities and infrastructures. This includes, but is not limited to, heating, air-
conditioning, roofs, floors, electrical systems, painting, etc.
The maintenance of school facilities is paramount to support the efforts of safety and instruction for students and staff. Proactive maintenance coupled with repairs and replacement of systems and structures will ensure the
longevity of the division's facilities.
Property Acquisition Contruction/Implementation
N.A. FY 2018-2022
$63,489,500
22

Maintenance
Capital Project Details 2018-2022
TOTAL COST PER YEAR 63,489,500$ 18,501,000$ 31,405,000$ 3,930,500$ 5,218,000$ 4,435,000$
SCHOOL/PROJECT DESCRIPTION EST. COST 2017-2018 2018-2019 2019-2020 2020-2021 2021-2022YEAR BUILT FY-18 FY-19 FY-20 FY-21 FY-22
Upgrade 7 air handler units and controls 800,000$ 800,000$ Interior lights retro-fit from fluorescent to LED 380,000$ 380,000$ Rebuild air cool chiller in new section 40,000$ 40,000$ Replace case work in old section 175,000$ 175,000$ BERKELEY ELEMENTARY - 1962Interior lights retro-fit from fluorescent to LED 300,000$ 300,000$ Repair/overlay parking lot and bus loop 250,000$ 250,000$ Replace 2 grease traps 20,000$ 20,000$ BROCK ROAD ELEMENTARY - 1994Add sight drainage for parking lot 100,000$ 100,000$ Replace rubber membrane roof 400,000$ 400,000$ Concrete repair 50,000$ 50,000$ Overlay bus loop and rear parking lot 250,000$ 250,000$ CEDAR FOREST ELEMENTARY - 2008Retrofit gym lights to LED 20,000$ 20,000$ CHANCELLOR ELEMENTARY - 1939Upgrade 4 bathrooms 160,000$ 160,000$
Upgrade front entrance access 450,000$ 450,000$ Retrofit gym lights 20,000$ 20,000$ COURTHOUSE ROAD ELEMENTARY - 1993Replace fire alarm panel 45,000$ 45,000$ Overlay bus loop 300,000$ 300,000$ Upgrade HVAC system 1,100,000$ 1,100,000$ Interior light retro-fit from fluorescent to LED 450,000$ 450,000$ Replace shingles 250,000$ 250,000$ COURTLAND ELEMENTARY - 1986Overlay front parking lot 260,000$ 260,000$ Concrete repair 25,000$ 25,000$ Re-tube boilers 28,000$ 28,000$ Replace 2 grease traps 20,000$ 20,000$
Replace PVI water heater 25,000$ 25,000$ Replace ground gutter 150,000$ 150,000$ Concrete repair 50,000$ 50,000$ Replace valves in Sprinkler system 50,000$ 50,000$ Overlay of bus loop and parking lot 350,000$ 350,000$ Replace gym lights to LED 20,000$ 20,000$ Carpet to tile replacement 120,000$ 40,000$ 80,000$
BATTLEFIELD ELEMENTARY - 1975
HARRISON ROAD ELEMENTARY - 2001
23

Maintenance Capital Project Details
2018-2022 LEE HILL ELEMENTARY - 1978 Total FY 2018 FY 2019 FY2020 FY 2021 FY 2022Upgrade batrooms classrooms old section 250,000$ 250,000$ Replace grease trap 20,000$ 20,000$ Interior light retro-fit from fluorescent to LED 425,000$ 425,000$ Rebuild air cool chiller for multi-purpose room 55,000$ 55,000$ LIVINGSTON ELEMENTARY - 1961Overlay bus loop and parking lot 250,000$ 250,000$ Interior light retro-fit from fluorescent to LED 425,000$ 425,000$ Replace RTU's on K building 70,000$ 70,000$ PARKSIDE ELEMENTARY - 1993Overlay front parking lot 150,000$ 150,000$ Rebuild air cool chiller 50,000$ 50,000$ Concrete repair to sidewalks 40,000$ 40,000$ Upgrade gym lights to LED 20,000$ 20,000$ Upgrade dry system 60,000$ 60,000$ Carpet to tile replacement 60,000$ 60,000$ RIVERVIEW ELEMENTARY - 1993Replace ballasted membrane roof 425,000$ 425,000$ Upgrade HVAC system 1,050,000$ 1,050,000$ Interior light retro-fit from fluorescent to LED 450,000$ 450,000$
Repair and upgrade sidewalks 100,000$ 100,000$
Concrete replacement / repair 50,000$ 50,000$ Replace tile in multipurpose 35,000$ 35,000$ Install and upgrade fencing 40,000$ 40,000$ Upgrade 4 bathrooms in addition 200,000$ 200,000$
Overlay bus loop 175,000$ 175,000$ Cafeteria and library roof replacement 400,000$ 400,000$ Rebuild air cooled chiller 55,000$ 55,000$ Replace grease traps 20,000$ 20,000$ Concrete repair / replacement 50,000$ 50,000$ Carpet to tile replacement 60,000$ 60,000$
Concrete repair to side walks 45,000$ 45,000$ Visitor access control office 375,000$ 375,000$ Resurface front parking lot 400,000$ 400,000$
ROBERT E. LEE ELEMENTARY - 1950
SALEM ELEMENTARY - 1978
SMITH STATION ELEMENTARY - 1991
24

Maintenance
Capital Project Details 2018-2022
SPOTSWOOD ELEMENTARY - 1965 Total FY 2018 FY 2019 FY 2020 FY 2021 FY 2022Replace fire alarm devices 90,000$ 90,000$ Concrete repairs 50,000$ 50,000$ Rebuild air cooled chiller 55,000$ 55,000$ Replace sewer mains and laterals 400,000$ 400,000$
Concrete repair to curb and gutter 50,000$ 50,000$ Replace valves in Sprinkler system 60,000$ 60,000$ Replace fire alarm panel 25,000$ 25,000$ Rebuild air cooled chiller 45,000$ 45,000$ Repair and overlay bus loop 245,000$ 245,000$ Carpet to tile replacement 80,000$ 40,000$ 40,000$
Interior light retro-fit from fluorescent to LED 480,000$ 480,000$ Pave roads to ball fields 80,000$ 80,000$ Replace grease trap 10,000$ 10,000$ Carpet to tile replacement 100,000$ 100,000$
Replace fire alarm panel devices 100,000$ 100,000$ Upgrade front entrance for access 250,000$ 250,000$ Overlay front parking lot 300,000$ 300,000$ Replace score board 20,000$ 20,000$ Interior light retro-fit from fluorescent to LED 500,000$ 500,000$ Replace bleachers in the gym 200,000$ 200,000$ Paint exterior 200,000$ 200,000$
Rebuild 2 water cooled chillers 120,000$ 120,000$ Overlay bus loop 250,000$ 250,000$ Upgrade gym lights to LED 20,000$ 20,000$ Replace carpet 80,000$ 40,000$ 40,000$ Upgrade road to ball fields 80,000$ 80,000$
Concrete replacement / repair 75,000$ 75,000$ Interior light retrofit from fluorescent to LED 475,000$ 475,000$ Overlay all asphalt 500,000$ 500,000$
Replace 2 boilers 50,000$ 50,000$
Rebuild 2 water cooled chillers 120,000$ 120,000$
WILDERNESS ELEMENTARY - 1998
BATTLEFIELD MIDDLE - 1978
CHANCELLOR MIDDLE - 1988
FREEDOM MIDDLE - 2003
NI RIVER MIDDLE - 1999
POST OAK MIDDLE - 2006
25

Maintenance
Capital Project Details 2018-2022
SPOTSYLVANIA MIDDLE - 1968 Total FY 2018 FY 2019 FY 2020 FY 2021 FY 2022
overlay parking lot and bus loop 450,000$ 450,000$ Add parent pick up and drop off area 350,000$ 350,000$
Rebuild water cool chiller 70,000$ 70,000$ Interior light retro-fit from fluorescent to LED 500,000$ 500,000$ Resurface track 135,000$ 135,000$ Replace cooling tower 105,000$ 105,000$ Concrete replacement / repair 50,000$ 50,000$ Retube boilers 35,000$ 35,000$ Change front entrance design for security 250,000$ 250,000$ CHANCELLOR HIGH - 1987Upgrade front entrance for security 250,000$ 250,000$ Replace dimmer rack 125,000$ 125,000$
Relocation of REACH program 135,000$ 135,000$
Overlay parking lot and bus loop 350,000$ 350,000$ Interior light retro-fit from fluorescent to LED 600,000$ 600,000$ Artificial turf for stadium 800,000$ 800,000$ Replace fire alarm 110,000$ 110,000$ Paint exterior 325,000$ 325,000$ Replace generator for Middle and High school 250,000$ 250,000$
Renovation of school 31,205,000$ 8,950,000$ 22,255,000$ Replace score board 25,000$ 25,000$ Artificial turf for stadium 800,000$ 800,000$
Rebuild water cool chiller 75,000$ 75,000$ Concrete to prevent water under slab 100,000$ 100,000$ Artificial turf for stadium 800,000$ 800,000$ Interior light retro-fit from fluorescent to LED 600,000$ 600,000$ Overlay all asphalt 600,000$ 600,000$ Replace PVI water heater 100,000$ 100,000$
Artificial turf for stadium 800,000$ 800,000$ Replace Baseball scoreboard 25,000$ 25,000$
Rebuild 2 water cooled chillers 120,000$ 120,000$
COURTLAND HIGH - 1980
MASSAPONAX HIGH - 1998
RIVERBEND HIGH - 2004
THORNBURG MIDDLE - 1994
26

Maintenance Capital Project Details
2018-2022
SPOTSYLVANIA HIGH - 1994 Total FY 2018 FY 2019 FY 2020 FY 2021 FY 2022Add and upgrade site/field lighting 300,000$ 300,000$ Sewer main for bathroom facility 165,000$ 165,000$ Interior light retro-fit from fluorescent to LED 600,000$ 600,000$ Add programs 300,000$ 300,000$ HVAC controls upgrade 435,000$ 435,000$ Replace PVI water heater 75,000$ 75,000$ Paint water tower 250,000$ 250,000$ Press box area field hockey 75,000$ 75,000$ Make repairs to water tower 100,000$ 100,000$ Finish new water system 50,000$ 50,000$ Replace score board 20,000$ 20,000$ Repair Replace press box football 100,000$ 100,000$ Artificial turf 800,000$ 800,000$
Carpet to tile replacement 40,000$ 40,000$ Replace roof on front section 450,000$ 450,000$ Replace fire doors 100,000$ 100,000$ Upgrade front entrance for security 40,000$ 40,000$ Replace switch gear 150,000$ 150,000$
Add new well and chemical feed system 500,000$ 500,000$
Replace one 3/4 ton service truck 300,000$ 50,000$ 100,000$ 50,000$ 100,000$ Replace one 3/4 ton service van 160,000$ 40,000$ 40,000$ 40,000$ 40,000$ Seal coat parking lot 80,000$ 80,000$ Replace one front mount 4x4 mower 240,000$ 40,000$ 40,000$ 40,000$ 80,000$ 40,000$ Replace large air comp 40,000$ 40,000$ Replace dump truck 120,000$ 120,000$ Replace John Deere loader 58,000$ 58,000$
Replace gator at High schools 50,000$ 10,000$ 10,000$ 10,000$ 20,000$ Replace one box truck with lift gates 80,500$ 80,500$ Replace two of the one man lifts 40,000$ 40,000$ Purchase two man scissor lift 38,000$ 38,000$ Replace bat wing mower 20,000$ 20,000$
236,000$ 90,000$ 250,500$ 230,000$ 300,000$ SCHOOL ADMINISTRATIVE BUILDING - 2004
Running Total 63,489,500$ 18,501,000$ 31,405,000$ 3,930,500$ 5,218,000$ 4,435,000$ By Year Total 63,489,500$ 18,501,000$ 31,405,000$ 3,930,500$ 5,218,000$ 4,435,000$ Revised Date 1-27-16
MAINTENANCE COMPLEX - 2009
CAREER & TECH CENTER - 1980
JOHN J. WRIGHT E & CC - 1950
ITT CENTER - 1986
Bolded Totals In The Maintenance Complex - 2009 Section Are Included In The Vehicles & Equipment Subtotal
Subtotal of Vehicles & Equipment (Only)
Head Start Building
27

Enrollment
28

INCREASE/ INCREASE/
ELEMENTARY SCHOOLS: Actual DECREASE PROJECTED DECREASE"Actual" vs. ENROLLMENT
CAPACITY 9/29/2006 10/01/2007 10/1/2008 10/1/2009 10/1/2010 10/1/2011 10/1/2012 10/1/2013 10/1/2014 10/1/2015 10/1/2016 "Previous" 10/1/2016 vs. "Actual"
BATTLEFIELD 833 700 679 676 674 678 648 639 644 658 645 618 -27 634 16BERKELEY 353 364 363 329 332 351 325 319 306 281 255 268 13 252 -16BROCK ROAD 907 785 820 774 804 764 769 729 753 720 693 656 -37 716 60CEDAR FOREST 936 664 736 765 732 716 771 757 727 746 19 712 -34CHANCELLOR 455 372 367 371 336 360 363 374 387 401 418 424 6 440 16COURTHOUSE ROAD 907 863 916 877 897 881 870 854 829 832 828 813 -15 786 -27COURTLAND 789 659 631 608 593 608 577 586 564 539 563 527 -36 555 28HARRISON ROAD 936 819 839 791 774 812 851 856 822 818 806 793 -13 772 -21LEE HILL 807 841 783 576 572 554 670 692 702 691 648 652 4 660 8LIVINGSTON 504 478 498 481 487 460 444 451 444 421 433 420 -13 429 9PARKSIDE 936 809 889 905 895 955 691 694 728 755 765 773 8 760 -13RIVERVIEW 907 795 789 623 650 614 623 653 712 717 696 685 -11 702 17R E LEE 585 487 527 511 493 478 507 516 502 506 519 515 -4 533 18SALEM 815 658 676 689 649 642 645 660 635 690 666 629 -37 645 16SMITH STATION 986 790 812 808 851 768 794 751 762 759 716 713 -3 699 -14SPOTSWOOD 641 619 639 403 418 410 537 564 537 556 528 512 -16 527 15WILDERNESS 936 826 793 772 746 752 757 763 763 761 736 746 10 746 0SUB-TOT ELEM 13233 10865 11021 10858 10907 10852 10803 10817 10861 10862 10642 10490 -152 10568 78 INCREASE 61 156 -163 49 -55 -49 14 44 1 -220 -152
0.56% 1.44% -1.48% 0.45% -0.50% -0.45% 0.13% 0.41% 0.01% -2.03% -1.43%
INCREASE/ INCREASE/
MIDDLE SCHOOLS: Actual DECREASE PROJECTED DECREASE
ENROLLMENT ENROLLMENT ENROLLMENT ENROLLMENT ENROLLMENT ENROLLMENT ENROLLMENT ENROLLMENT ENROLLMENT ENROLLMENT ENROLLMENT "Actual" vs. ENROLLMENT "Projected"
CAPACITY 9/29/2006 10/30/2007 10/1/2008 10/1/2009 10/1/2010 10/1/2011 9/30/2012 9/30/2013 10/1/2014 10/1/2015 10/1/2016 "Previous" 10/1/2016 vs. "Actual"
BATTLEFIELD 807 807 808 760 783 800 808 791 798 792 817 802 -15 808 6CHANCELLOR 857 851 853 852 837 814 844 819 858 813 825 849 24 827 -22FREEDOM 948 898 862 886 875 862 858 857 883 844 824 780 -44 833 53NI RIVER 774 784 700 737 728 719 683 687 715 749 745 764 19 749 -15POST OAK (*John J. Wright M.S.) 948 819 782 765 735 739 753 752 781 765 747 726 -21 750 24SPOTSYLVANIA 907 750 777 775 843 821 828 806 805 780 800 876 76 820 -56THORNBURG 790 735 707 715 659 646 672 690 691 693 708 739 31 710 -29SUB-TOT MID 6031 5644 5489 5490 5460 5401 5446 5402 5531 5436 5466 5536 70 5497 -39 INCREASE -30 -155 1 -30 -59 45 -44 129 -95 30 70
-0.53% -2.75% 0.02% -0.55% -1.08% 0.83% -0.81% 2.39% -1.72% 0.55% 1.28%
INCREASE/ INCREASE/
HIGH SCHOOLS: Actual DECREASE PROJECTED DECREASE
ENROLLMENT ENROLLMENT ENROLLMENT ENROLLMENT ENROLLMENT ENROLLMENT ENROLLMENT ENROLLMENT ENROLLMENT ENROLLMENT ENROLLMENT "Actual" vs. ENROLLMENT "Projected"
CAPACITY 9/29/2006 10/30/2007 10/1/2008 10/1/2009 10/1/2010 10/1/2011 9/30/2012 9/30/2013 10/1/2014 10/1/2015 10/1/2016 "Previous" 10/1/2016 vs. "Actual"
GATES PROGRAM 90 82 NA 73 86 60 48 33 31 25 33 23 -10 33 10CHANCELLOR 1427 1374 1383 1388 1357 1355 1380 1380 1342 1330 1304 1299 -5 1308 9COURTLAND 1265 1265 1316 1268 1274 1220 1192 1219 1190 1176 1173 1146 -27 1193 47MASSAPONAX 1830 1808 1949 1917 1974 1908 1870 1858 1829 1925 1964 2022 58 1961 -61RIVERBEND 1995 1909 2003 1950 1963 1941 1923 1913 1866 1942 1933 1919 -14 1950 31SPOTSYLVANIA 1611 1239 1229 1253 1192 1131 1113 1103 1123 1121 1163 1157 -6 1145 -12SUB-TOT SEC 8218 7677 7880 7849 7846 7615 7526 7506 7381 7519 7570 7566 -4 7590 24 INCREASE 344 203 -31 -3 -231 -89 -20 -125 138 51 -4
4.69% 2.64% -0.39% -0.04% -2.94% -1.17% -0.27% -1.67% 1.87% 0.68% -0.05% CUMULATIVE TOTAL 27482 24186 24390 24197 24213 23868 23775 23725 23773 23817 23678 23592 -86 23655 63
INCREASE P/YR 375 204 -193 16 -345 -93 -50 48 44 -139 -86 -162
PERCENT P/YR 1.57% 0.84% -0.79% 0.07% -1.42% -0.39% -0.21% 0.20% 0.19% -0.58% -0.36% -0.68%
SPOTSYLVANIA COUNTY PUBLIC SCHOOLS
HISTORICAL AND PROJECTED ENROLLMENT FOR OCTOBER 1ST
29

SpEd Speech "checkPre-K (no count) total"
Battlefield E. 616 111 105 90 114 97 99 2 618 618Berkeley E. 246 33 41 33 48 39 52 18 1 3 268 268Brock Rd. 647 93 103 108 120 108 115 9 656 9 665Cedar Forest 672 113 97 117 115 117 113 36 20 18 746 746Chancellor E. 413 65 59 65 78 72 74 8 3 424 424Courthouse Rd. 808 127 134 126 139 138 144 5 813 813Courtland E. 495 81 70 70 94 100 80 18 14 527 527Harrison Road 753 116 126 115 130 134 132 4 36 793 793Lee Hill 648 114 94 104 119 98 119 4 652 652Livingston 395 58 69 49 79 62 78 6 19 420 2 422Parkside 761 111 121 126 131 142 130 12 773 773Riverview 626 105 91 94 112 112 112 20 39 685 15 700R.E. Lee 492 85 75 87 84 90 71 14 5 4 515 515Salem 603 84 83 110 109 108 109 18 8 629 16 645Smith Station 701 107 107 98 122 139 128 12 713 713Spotswood 509 85 88 95 79 82 80 3 512 5 517Wilderness 705 98 116 115 119 133 124 18 5 18 746 746Subtotal 10090 1586 1579 1602 1792 1771 1760 122 138 140 10490 47 10537
Battlefield M. 802 268 280 254 802Chancellor M 849 281 299 269 849Freedom 780 249 263 268 780Ni River 764 236 244 284 764Post Oak 726 240 233 253 726Spotsy. M. 876 335 270 271 876Thornburg 739 241 239 259 739Subtotal 5536 1850 1828 1858 5536
Gates Program 23 0 3 6 14 23Chancellor H 1299 343 332 299 301 24 1299Courtland H 1146 316 303 271 255 1 1146Massaponax 2022 535 521 480 480 6 2022Riverbend 1919 493 480 489 444 13 1919Spotsy. Hi. 1157 327 289 279 260 2 1157Subtotal 7566 2014 1928 1824 1754 46 7566
TOTAL 23192 (ADM Total) 23592 (Enrollment Total)Note: HeadStart (HS), SPED Pre-K, and VPI Student counts do not factor into the ADM Total. They are only reflected in the Enrollment Total
VPI
Actual Enrollment for October 1, 2016Sub-Total TOTALKG 1 2 3 4 5 6 12 + HSSchool 7 8 9 10 11 12
30

SpEd VPI Speech "checkPre-K Pre-K (no count) total"
Battlefield E. 612 106 113 89 103 100 101 2 614 614Berkeley E. 235 32 34 33 43 40 53 18 1 3 257 257Brock Rd. 628 89 95 107 108 111 118 9 637 9 646Cedar Forest 678 108 115 116 104 120 115 36 20 18 752 752Chancellor E. 412 62 66 64 70 74 76 8 3 423 423Courthouse Rd. 792 122 129 125 126 143 147 5 797 797Courtland E. 500 78 83 69 85 103 82 18 14 532 532Harrison Road 734 111 118 115 117 138 135 4 36 774 774Lee Hill 659 109 116 103 108 101 122 4 663 663Livingston 379 56 59 49 71 64 80 6 19 404 2 406Parkside 741 106 113 125 118 146 133 12 753 753Riverview 631 101 107 93 101 115 114 20 39 690 15 705R.E. Lee 496 81 87 86 76 93 73 14 5 4 519 519Salem 597 81 86 109 99 111 111 18 8 623 16 639Smith Station 693 103 109 97 110 143 131 12 705 705Spotswood 499 81 87 94 71 84 82 3 502 5 507Wilderness 680 94 100 114 108 137 127 18 5 18 721 721Subtotal 9966 1520 1617 1588 1618 1823 1800 122 138 140 10366 47 10413
Battlefield M. 796 254 288 254 796
Chancellor M 845 268 307 270 845
Freedom 775 236 270 269 775
Ni River 760 224 251 285 760
Post Oak 720 228 239 253 720
Spotsy. M. 925 318 335 272 925
Thornburg 735 229 246 260 735
Subtotal 5556 1757 1936 1863 5556
Gates Program 23 0 3 6 14 23
Chancellor H 1308 360 310 303 335 1308
Courtland H 1153 310 304 275 264 1153
Massaponax 2036 544 504 487 501 2036Riverbend 1934 484 483 496 471 1934
Spotsy. High 1163 330 281 283 269 1163
Subtotal 7617 2028 1885 1850 1854 7617
TOTAL 23139 * ** 23539
* Total w/out Pre-K Speech, Headstart, VPI, or SpEd Pre-K ** Total w/out Pre-K Speech
HS TOTALSchool 8 9 10 11 12TT/P
G
Projected Enrollment for October 1, 2017
Sub-
Total KG 1 2 3 4 5 6 7
31
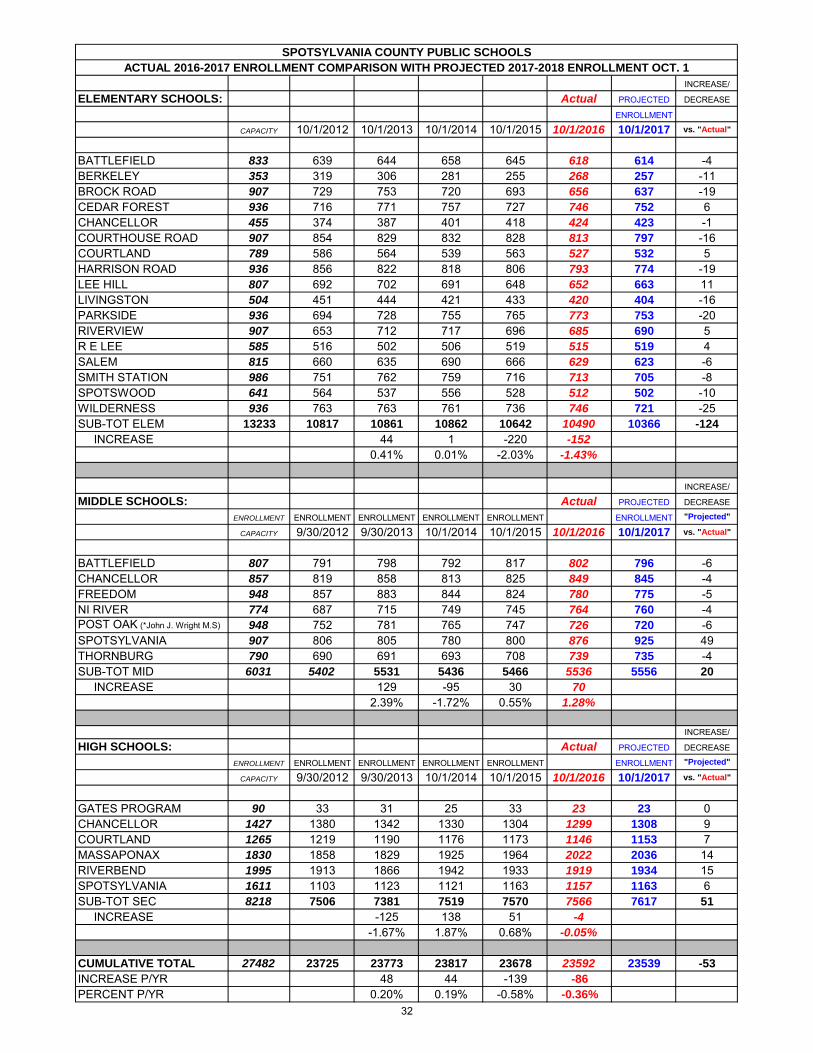
INCREASE/
ELEMENTARY SCHOOLS: Actual PROJECTED DECREASE
ENROLLMENT
CAPACITY 10/1/2012 10/1/2013 10/1/2014 10/1/2015 10/1/2016 10/1/2017 vs. "Actual"
BATTLEFIELD 833 639 644 658 645 618 614 -4BERKELEY 353 319 306 281 255 268 257 -11BROCK ROAD 907 729 753 720 693 656 637 -19CEDAR FOREST 936 716 771 757 727 746 752 6CHANCELLOR 455 374 387 401 418 424 423 -1COURTHOUSE ROAD 907 854 829 832 828 813 797 -16COURTLAND 789 586 564 539 563 527 532 5HARRISON ROAD 936 856 822 818 806 793 774 -19LEE HILL 807 692 702 691 648 652 663 11LIVINGSTON 504 451 444 421 433 420 404 -16PARKSIDE 936 694 728 755 765 773 753 -20RIVERVIEW 907 653 712 717 696 685 690 5R E LEE 585 516 502 506 519 515 519 4SALEM 815 660 635 690 666 629 623 -6SMITH STATION 986 751 762 759 716 713 705 -8SPOTSWOOD 641 564 537 556 528 512 502 -10WILDERNESS 936 763 763 761 736 746 721 -25SUB-TOT ELEM 13233 10817 10861 10862 10642 10490 10366 -124
INCREASE 44 1 -220 -152 0.41% 0.01% -2.03% -1.43%
INCREASE/
MIDDLE SCHOOLS: Actual PROJECTED DECREASE
ENROLLMENT ENROLLMENT ENROLLMENT ENROLLMENT ENROLLMENT ENROLLMENT "Projected"
CAPACITY 9/30/2012 9/30/2013 10/1/2014 10/1/2015 10/1/2016 10/1/2017 vs. "Actual"
BATTLEFIELD 807 791 798 792 817 802 796 -6CHANCELLOR 857 819 858 813 825 849 845 -4FREEDOM 948 857 883 844 824 780 775 -5NI RIVER 774 687 715 749 745 764 760 -4POST OAK (*John J. Wright M.S) 948 752 781 765 747 726 720 -6SPOTSYLVANIA 907 806 805 780 800 876 925 49THORNBURG 790 690 691 693 708 739 735 -4SUB-TOT MID 6031 5402 5531 5436 5466 5536 5556 20
INCREASE 129 -95 30 70 2.39% -1.72% 0.55% 1.28%
INCREASE/
HIGH SCHOOLS: Actual PROJECTED DECREASE
ENROLLMENT ENROLLMENT ENROLLMENT ENROLLMENT ENROLLMENT ENROLLMENT "Projected"
CAPACITY 9/30/2012 9/30/2013 10/1/2014 10/1/2015 10/1/2016 10/1/2017 vs. "Actual"
GATES PROGRAM 90 33 31 25 33 23 23 0CHANCELLOR 1427 1380 1342 1330 1304 1299 1308 9COURTLAND 1265 1219 1190 1176 1173 1146 1153 7MASSAPONAX 1830 1858 1829 1925 1964 2022 2036 14RIVERBEND 1995 1913 1866 1942 1933 1919 1934 15SPOTSYLVANIA 1611 1103 1123 1121 1163 1157 1163 6SUB-TOT SEC 8218 7506 7381 7519 7570 7566 7617 51
INCREASE -125 138 51 -4 -1.67% 1.87% 0.68% -0.05%
CUMULATIVE TOTAL 27482 23725 23773 23817 23678 23592 23539 -53
INCREASE P/YR 48 44 -139 -86
PERCENT P/YR 0.20% 0.19% -0.58% -0.36%
SPOTSYLVANIA COUNTY PUBLIC SCHOOLS
ACTUAL 2016-2017 ENROLLMENT COMPARISON WITH PROJECTED 2017-2018 ENROLLMENT OCT. 1
32

GRADE 06-07 07-08 08-09 09-10 10-11 11-12 12-13 13-14 14-15 15-16 16-17 17-18 18-19 19-20 20-21 21-22Historical Historical Historical Historical Historical Historical Historical Historical Historical Historical Actual (Projected) (Projected) (Projected) (Projected) (Projected)
PRE-SCHOOL* 318 313 280 301 331 324 331 327 356 360 400 400 400 400 400 400K 1708 1745 1686 1752 1686 1673 1705 1714 1588 1565 1586 1520 1550 1641 1641 16411 1827 1785 1815 1739 1750 1755 1696 1760 1774 1612 1579 1617 1589 1620 1715 17152 1743 1824 1714 1792 1726 1766 1772 1680 1798 1776 1602 1588 1667 1638 1670 17683 1803 1732 1818 1731 1781 1725 1774 1782 1713 1801 1792 1618 1644 1726 1696 17294 1746 1851 1716 1846 1754 1792 1745 1820 1791 1716 1771 1823 1685 1712 1797 17665 1720 1771 1829 1746 1824 1768 1794 1778 1842 1812 1760 1800 1899 1755 1783 1872
Sub-Total 10865 11021 10858 10907 10852 10803 10817 10861 10862 10642 10490 10366 10434 10492 10702 10891
Increase 61 156 -163 49 -55 -49 14 44 1 -220 -152 -124 68 58 210 189
Percent 0.56% 1.44% -1.48% 0.45% -0.50% -0.45% 0.13% 0.41% 0.01% -2.03% -1.43% -1.18% 0.66% 0.56% 2.00% 1.77%
6 1904 1744 1794 1842 1748 1811 1777 1801 1787 1785 1850 1757 1797 1873 1752 17807 1783 1916 1776 1803 1844 1756 1870 1829 1813 1814 1828 1936 1784 1824 1902 17798 1957 1829 1920 1818 1809 1879 1755 1901 1836 1867 1858 1863 1973 1818 1859 1939
Sub-Total 5644 5489 5490 5463 5401 5446 5402 5531 5436 5466 5536 5556 5554 5515 5513 5498
Increase -30 -155 1 -27 -62 45 -44 129 -95 30 70 20 -2 -39 -2 -15
Percent -0.53% -2.75% 0.02% -0.49% -1.13% 0.83% -0.81% 2.39% -1.72% 0.55% 1.28% 0.36% -0.04% -0.70% -0.04% -0.27%
9 2242 2234 2131 2212 2025 2012 2070 1976 2087 2017 2014 2028 2034 2154 1985 2029
10 1958 2094 2012 1904 1990 1864 1861 1892 1835 1928 1928 1885 1898 1904 2016 185811 1793 1771 1889 1820 1750 1864 1721 1732 1828 1773 1824 1850 1809 1930 1827 193412 1684 1781 1817 1886 1820 1783 1854 1781 1769 1852 1800 1854 1881 1839 1962 1857
Ungraded/TT/PG 24 30 3 0 0 0 0 0 0 0 0 0 0
Sub-Total 7677 7880 7849 7846 7615 7526 7506 7381 7519 7570 7566 7617 7622 7827 7790 7678
Increase 344 203 -31 -3 -231 -89 -20 -125 138 51 -4 51 5 205 -37 -112
Percent 4.69% 2.64% -0.39% -0.04% -2.94% -1.17% -0.27% -1.67% 1.87% 0.68% -0.05% 0.67% 0.07% 2.69% -0.47% -1.44%
TOTAL 24186 24390 24197 24216 23868 23775 23725 23773 23817 23678 23592 23539 23610 23834 24005 24067
INCREASE 375 204 -193 19 -348 -93 -50 48 44 -139 -86 -53 71 224 171 62
PERCENT 1.57% 0.84% -0.79% 0.08% -1.44% -0.39% -0.21% 0.20% 0.19% -0.58% -0.36% -0.22% 0.30% 0.95% 0.72% 0.26%
* Includes Head Start, Early Childhood Special Education & Pre-Kindergarten
Based on Actual Enrollment for October 1, 2015
Historical and Projected Enrollment 2018-2022
SPOTSYLVANIA COUNTY PUBLIC SCHOOLS
33

SCHOOL YEAR
2006-
2007
2007-
2008
2008-
2009
2009-
2010
2010-
2011
2011-
2012
2012-
2013
2013-
2014
2014-
2015
2015-
2016
2016-
2017
2017-
2018
2018-
2019
2019-
2020
2020-
2021
2021-
2022
Northern Elementary Zone 2177 2194 2156 2097 2132 2144 2155 2101 2166 2117 2040 2011 2026 2036 2077 2112Building Capacity 2372 2584 2584 2584 2584 2584 2584 2584 2584 2584 2584 2584 2584 2584 2584 2584Eastern Elementary Zone 2269 2311 2548 2621 2684 2630 2666 2738 2759 2668 2683 2670 2689 2708 2761 2814Building Capacity 1970 2384 3320 3320 3320 3320 3320 3320 3320 3320 3320 3320 3320 3320 3320 3320Southern Elementary Zone 1637 1650 1433 1469 1425 1392 1423 1462 1419 1384 1373 1351 1360 1366 1393 1415Building Capacity 1759 1764 1764 1764 1764 1764 1764 1764 1764 1764 1764 1764 1764 1764 1764 1764Western Elementary Zone 1983 1980 1917 1886 1876 1889 1866 1903 1882 1847 1826 1781 1796 1801 1839 1871Building Capacity 2266 2298 2298 2298 2298 2298 2298 2298 2298 2298 2298 2298 2298 2298 2298 2298Central Elementary Zone 2799 2886 2804 2834 2735 2748 2707 2657 2636 2626 2568 2553 2563 2581 2632 2679Building Capacity 3024 3267 3267 3267 3267 3267 3267 3268 3268 3268 3268 3268 3268 3268 3268 3268
School Enrollment (Total) 10865 11021 10858 10907 10852 10803 10817 10861 10862 10642 10490 10366 10434 10492 10702 10891Building Capacity (Total) 11391 12297 13233 13233 13233 13233 13233 13234 13234 13234 13234 13234 13234 13234 13234 13234Seats Available 526 1276 2375 2326 2381 2430 2416 2373 2372 2592 2744 2868 2800 2742 2532 2343
Total Elementary Enrollment and Capacity
34

School Year
2007-
2008
2008-
2009
2009-
2010
2010-
2011
2011-
2012
2012-
2013
2013-
2014
2014-
2015
2015-
2016
2016-
2017
2017-
2018
2018-
2019
2019-
2020
2020-
2021
2021-
2022
Battlefield Elementary 679 676 674 678 648 639 644 658 645 618 614 619 625 637 647Building Capacity 833 833 833 833 833 833 833 833 833 833 833 833 833 833 833Harrison Rd. Elementary 839 791 774 812 851 856 822 818 806 791 774 780 783 798 811Building Capacity 936 936 936 936 936 936 936 936 936 936 936 936 936 936 936Salem Elementary 676 689 649 642 645 660 635 690 666 629 623 627 628 642 654Building Capacity 815 815 815 815 815 815 815 815 815 815 815 815 815 815 815
School Enrollment (Total) 2194 2156 2097 2132 2144 2155 2101 2166 2117 2038 2011 2026 2036 2077 2112Building Capacity (Total) 2584 2584 2584 2584 2584 2584 2584 2584 2584 2584 2584 2584 2584 2584 2584Seats Available 390 428 487 452 440 429 483 418 467 546 573 558 548 507 472
Northern Region
35

SCHOOL YEAR
2007-
2008
2008-
2009
2009-
2010
2010-
2011
2011-
2012
2012-
2013
2013-
2014
2014-
2015
2015-
2016
2016-
2017
2017-
2018
2018-
2019
2019-
2020
2020-
2021
2021-
2022
Cedar Forest 664 736 765 732 716 771 757 727 746 752 758 764 777 791Building Capacity 936 936 936 936 936 936 936 936 936 936 936 936 936 936Lee Hill Elementary 783 576 572 554 670 692 702 691 648 652 663 667 672 686 700Building Capacity 807 807 807 807 807 807 807 807 807 807 807 807 807 807 807Parkside Elementary 889 905 895 955 691 694 728 755 765 773 753 758 762 778 792Building Capacity 936 936 936 936 936 936 936 936 936 936 936 936 936 936 936Spotswood Elementary 639 403 418 410 537 564 537 556 528 512 502 506 510 520 531Building Capacity 641 641 641 641 641 641 641 641 641 641 641 641 641 641 641
School Enrollment (Total) 2311 2548 2621 2684 2630 2666 2738 2759 2668 2683 2670 2689 2708 2761 2814Building Capacity (Total) 2384 3320 3320 3320 3320 3320 3320 3320 3320 3320 3320 3320 3320 3320 3320Seats Available 73 772 699 636 690 654 582 561 652 637 650 631 612 559 506
Eastern Region
36

SCHOOL YEAR
2007-
2008
2008-
2009
2009-
2010
2010-
2011
2011-
2012
2012-
2013
2013-
2014
2014-
2015
2015-
2016
2016-
2017
2017-
2018
2018-
2019
2019-
2020
2020-
2021
2021-
2022
Berkeley Elementary 363 329 332 351 325 319 306 281 255 268 257 258 260 264 268Building Capacity 353 353 353 353 353 353 353 353 353 353 353 353 353 353 353Livingston Elementary 498 481 487 460 444 451 444 421 433 420 404 406 407 416 423Building Capacity 504 504 504 504 504 504 504 504 504 504 504 504 504 504 504Riverview Elementary 789 623 650 614 623 653 712 717 696 685 690 696 699 713 724Building Capacity 907 907 907 907 907 907 907 907 907 907 907 907 907 907 907
School Enrollment (Total) 1650 1433 1469 1425 1392 1423 1462 1419 1384 1373 1351 1360 1366 1393 1415Building Capacity (Total) 1764 1764 1764 1764 1764 1764 1764 1764 1764 1764 1764 1764 1764 1764 1764Seats Available 114 331 295 339 372 341 302 345 380 391 413 404 398 371 349
Southern Region
37

SCHOOL YEAR
2007-
2008
2008-
2009
2009-
2010
2010-
2011
2011-
2012
2012-
2013
2013-
2014
2014-
2015
2015-
2016
2016-
2017
2017-
2018
2018-
2019
2019-
2020
2020-
2021
2021-
2022
Brock Road Elementary 820 774 804 764 769 729 753 720 693 656 637 643 645 659 671Building Capacity 907 907 907 907 907 907 907 907 907 907 907 907 907 907 907Chancellor Elementary 367 371 336 360 363 374 387 401 418 424 423 429 428 438 445Building Capacity 455 455 455 455 455 455 455 455 455 455 455 455 455 455 455Wilderness Elementary 793 772 746 752 757 763 763 761 736 744 721 724 728 742 755Building Capacity 936 936 936 936 936 936 936 936 936 936 936 936 936 936 936
School Enrollment (Total) 1980 1917 1886 1876 1889 1866 1903 1882 1847 1824 1781 1796 1801 1839 1871Building Capacity (Total) 2298 2298 2298 2298 2298 2298 2298 2298 2298 2298 2298 2298 2298 2298 2298Seats Available 318 381 412 422 409 432 395 416 451 474 517 502 497 459 427
Western Region
38

School Year
2007-
2008
2008-
2009
2009-
2010
2010-
2011
2011-
2012
2012-
2013
2013-
2014
2014-
2015
2015-
2016
2016-
2017
2017-
2018
2018-
2019
2019-
2020
2020-
2021
2021-
2022
Courthouse Road Elem. 916 877 897 881 870 854 829 832 828 813 797 802 806 822 837Building Capacity 907 907 907 907 907 907 907 907 907 907 907 907 907 907 907Courtland Elementary 631 608 593 608 577 586 564 539 563 526 532 532 538 547 556Building Capacity 789 789 789 789 789 789 789 789 789 789 789 789 789 789 789Robert E. Lee Elementary 527 511 493 478 507 516 502 506 519 514 519 521 526 536 546Building Capacity 585 585 585 585 585 585 586 586 586 586 586 586 586 586 586Smith Station Elementary 812 808 851 768 794 751 762 759 716 713 705 708 711 727 740Building Capacity 986 986 986 986 986 986 986 986 986 986 986 986 986 986 986
School Enrollment (Total) 2886 2804 2834 2735 2748 2707 2657 2636 2626 2566 2553 2563 2581 2632 2679Building Capacity (Total) 3267 3267 3267 3267 3267 3267 3268 3268 3268 3268 3268 3268 3268 3268 3268Seats Available 381 463 433 532 519 560 611 632 642 702 715 705 687 636 589
Central Region
39

School Year
2007-
2008
2008-
2009
2009-
2010
2010-
2011
2011-
2012
2012-
2013
2013-
2014
2014-
2015
2015-
2016
2016-
2017
2017-
2018
2018-
2019
2019-
2020
2020-
2021
2021-
2022
Battlefield Middle 808 760 783 800 808 791 798 792 817 802 796 802 799 799 795Building Capacity 807 807 807 807 807 807 807 807 807 807 807 807 807 807 807Chancellor Middle 853 852 837 814 844 819 858 813 825 849 845 851 846 846 842Building Capacity 857 857 857 857 857 857 857 857 857 857 857 857 857 857 857Freedom Middle 862 886 875 862 858 857 883 844 824 780 775 783 777 778 776Building Capacity 948 948 948 948 948 948 948 948 948 948 948 948 948 948 948Ni River Middle 700 737 728 719 683 687 715 749 745 764 760 769 761 763 761Building Capacity 774 774 774 774 774 774 774 774 774 774 774 774 774 774 774Post Oak Middle 782 765 735 739 753 752 781 765 747 726 720 729 723 722 722Building Capacity 948 948 948 948 948 948 948 948 948 948 948 948 948 948 948Spotsylvania Middle 777 775 843 821 828 806 805 780 800 876 925 877 874 869 867Building Capacity 907 907 907 907 907 907 907 907 907 907 907 907 907 907 907Thornburg Middle 707 715 659 646 672 690 691 693 708 739 735 743 735 736 735Building Capacity 790 790 790 790 790 790 790 790 790 790 790 790 790 790 790
School Enrollment (Total) 5489 5490 5460 5401 5446 5402 5531 5436 5466 5536 5556 5554 5515 5513 5498Building Capacity (Total) 6031 6031 6031 6031 6031 6031 6031 6031 6031 6031 6031 6031 6031 6031 6031Seats Available 542 541 571 630 585 629 500 595 565 495 475 477 516 518 533
Middle School
40

School Year
2007-
2008
2008-
2009
2009-
2010
2010-
2011
2011-
2012
2012-
2013
2013-
2014
2014-
2015
2015-
2016
2016-
2017
2017-
2018
2018-
2019
2019-
2020
2020-
2021
2021-
2022
GATES High School program 0 73 86 60 48 33 31 25 33 23 23 23 23 23 23Building Capacity 90 90 90 90 90 90 90 90 90 90 90 90 90 90 90Chancellor High 1383 1388 1357 1355 1380 1380 1342 1330 1304 1299 1308 1324 1358 1353 1332Building Capacity 1427 1427 1427 1427 1427 1427 1427 1427 1427 1427 1427 1427 1427 1427 1427Courtland High 1316 1268 1274 1220 1192 1219 1190 1176 1173 1146 1153 1145 1177 1171 1155Building Capacity 1265 1265 1265 1265 1265 1265 1265 1265 1265 1265 1265 1265 1265 1265 1265Massaponax High 1949 1917 1974 1908 1870 1858 1829 1925 1964 2022 2036 2043 2098 2088 2056Building Capacity 1830 1830 1830 1830 1830 1830 1830 1830 1830 1830 1830 1830 1830 1830 1830Riverbend High 2003 1950 1963 1941 1923 1913 1866 1942 1933 1919 1934 1920 1973 1965 1938Building Capacity 1995 1995 1995 1995 1995 1995 1995 1995 1995 1995 1995 1995 1995 1995 1995Spotsylvania High 1229 1253 1192 1131 1113 1103 1123 1121 1163 1157 1163 1167 1198 1190 1174Building Capacity 1611 1611 1611 1611 1611 1611 1611 1611 1611 1611 1611 1611 1611 1611 1611
School Enrollment (Total) 7880 7849 7846 7615 7526 7506 7381 7519 7570 7566 7617 7622 7827 7790 7678Building Capacity (Total) 8218 8218 8218 8218 8218 8218 8218 8218 8218 8218 8218 8218 8218 8218 8219Seats Available 338 369 372 603 692 712 837 699 648 652 601 596 391 428 541
High School
41