capital market assumptions - health | aon rest of the market has been a net seller in aggregate ......
TRANSCRIPT

Capital Market AssumptionsAs of September 30, 2014
Aon HewittConsulting | Investment Consulting Practice
Risk. Reinsurance. Human Resources.

2 Capital Market Assumptions
Buyback bonanza – short term gain for longer term pain? . . . . . . . . . . . 3
Inflation . . . . . . . . . . . . . . . . . . . . . . . . . . . . . . . . . . . . . . . . . . . . . . . . . . . 6
Government bonds . . . . . . . . . . . . . . . . . . . . . . . . . . . . . . . . . . . . . . . . . 7
Inflation-linked government bonds . . . . . . . . . . . . . . . . . . . . . . . . . . . . . 8
Investment grade corporate bonds . . . . . . . . . . . . . . . . . . . . . . . . . . . . . 9
US high yield debt and emerging market debt . . . . . . . . . . . . . . . . . . . 9
Equities . . . . . . . . . . . . . . . . . . . . . . . . . . . . . . . . . . . . . . . . . . . . . . . . . . 10
Private equity . . . . . . . . . . . . . . . . . . . . . . . . . . . . . . . . . . . . . . . . . . . . . 11
Real estate . . . . . . . . . . . . . . . . . . . . . . . . . . . . . . . . . . . . . . . . . . . . . . . 11
Hedge funds . . . . . . . . . . . . . . . . . . . . . . . . . . . . . . . . . . . . . . . . . . . . . 12
Volatility . . . . . . . . . . . . . . . . . . . . . . . . . . . . . . . . . . . . . . . . . . . . . . . . . 12
Correlations . . . . . . . . . . . . . . . . . . . . . . . . . . . . . . . . . . . . . . . . . . . . . . 13
Capital market assumptions methodology . . . . . . . . . . . . . . . . . . . . . . 14
Contacts . . . . . . . . . . . . . . . . . . . . . . . . . . . . . . . . . . . . . . . . . . . . . . . . . 15
Table of contents

Aon Hewitt 3
Buyback bonanza – short term gain for longer term pain?
Economic growth has been weak, corporate revenue
growth nowhere to be found and earnings per share
growth has ticked along gradually yet US equities have
shot the lights out in terms of returns. How to make
sense of it all? Well, one explanation lies in corporate
buybacks – the act of companies repurchasing their
own shares in the market. These have become a really
important feature of the equity market environment
with wide ranging implications for both the near
term and long term prospects for equity markets.
This article is an abbreviated version of a recent research
note written by Aon Hewitt’s Global Asset Allocation team
which has been adapted for the purposes of this quarter’s
Capital Market Assumptions publication. Attention here
is focused on the US equity market where buybacks
have always been more common than elsewhere. If
you would like a copy of the original longer research
note then please contact your Aon Hewitt consultant.
A historic perspective
Dividends have traditionally represented the method
used by companies to return cash to shareholders and,
on the face of it, companies appear to have become less
generous over time. So far this millennium, dividend
payout ratios (the proportion of earnings that are paid
out in dividends) have averaged only around 35%, well
below the 50% average of the previous three decades.
However, this is because dividends are no longer the
only game in town when it comes to cash distributions.
Companies have increasingly turned to share buybacks
as an alternative means of returning cash to shareholders.
According to Standard & Poors (‘S&P’), over 80% of S&P
500 companies bought back shares during the second
quarter of 2014 and buybacks have been significantly
outstripping dividends for most of the past 10 years.
Consequently, though dividend payout ratios
have been low, when buybacks are included,
payout ratios have, in fact, been much higher.
Companies have been using around 85% of their
earnings to pay dividends and buy back stock.
Source: S&P
Dollar value of dividends and buybacks: S&P 500 ($bn)
99 00 01 02 03 04 05 06 07 08 09 10 11 12 13 14
200
180
160
140
120
100
80
60
40
20
0
Dividends Buybacks
4 Capital Market Assumptions
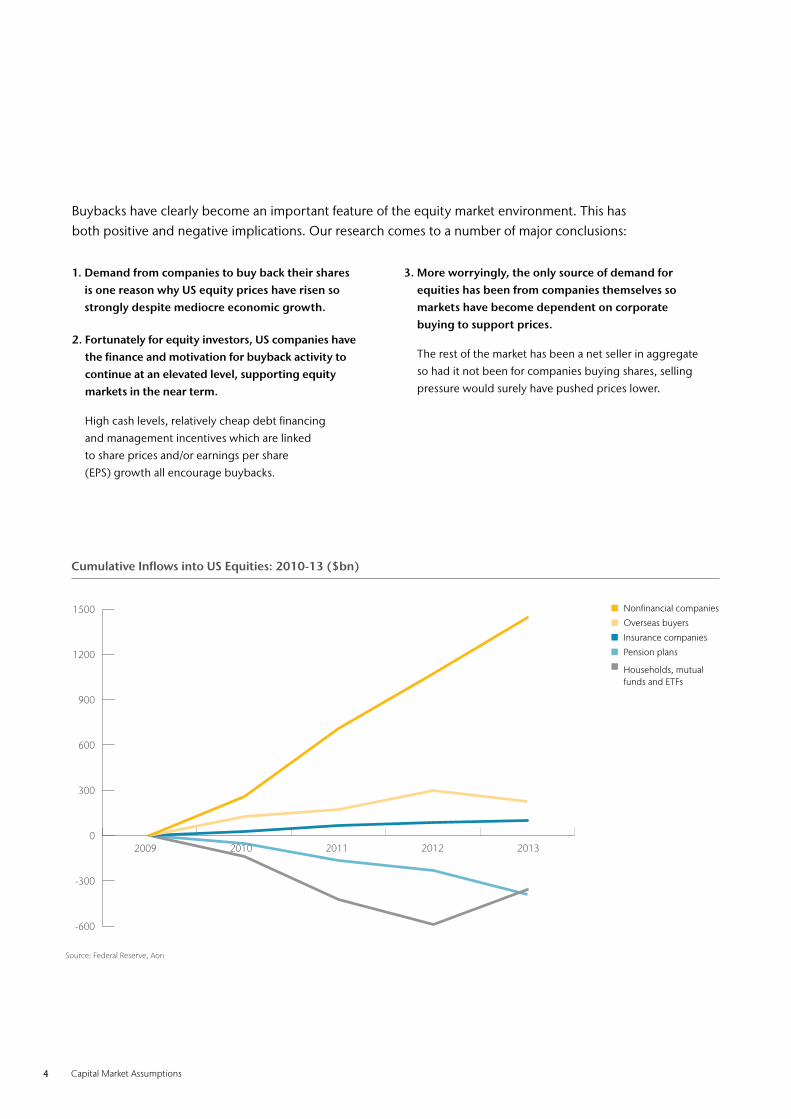
Buybacks have clearly become an important feature of the equity market environment. This has both positive and negative implications. Our research comes to a number of major conclusions:
1. Demand from companies to buy back their shares is one reason why US equity prices have risen so strongly despite mediocre economic growth.
2. Fortunately for equity investors, US companies have the finance and motivation for buyback activity to continue at an elevated level, supporting equity markets in the near term.
High cash levels, relatively cheap debt financing
and management incentives which are linked
to share prices and/or earnings per share
(EPS) growth all encourage buybacks.
3. More worryingly, the only source of demand for equities has been from companies themselves so markets have become dependent on corporate buying to support prices.
The rest of the market has been a net seller in aggregate
so had it not been for companies buying shares, selling
pressure would surely have pushed prices lower.
Source: Federal Reserve, Aon
Cumulative Inflows into US Equities: 2010-13 ($bn)
-600
-300
0
300
600
900
1200
1500
2009 2010 2011 2012 2013
Nonfinancial companies
Overseas buyers
Insurance companies
Pension plans
Households, mutual funds and ETFs

Aon Hewitt 5
4. Further buybacks may support share prices or even push them higher but buying back shares when valuations are expensive is value-destructive in the long run.
Buybacks are value-accretive for a company when they
are bought back for below their ‘fair value’. They are
effectively buying them back on the cheap. However,
the opposite is also true and buybacks can have a
negative long term impact if they take place when
shares are overvalued. Current equity markets remain
fully valued on most measures and expensive on others
so although high levels of buybacks should continue
to support prices in the near term, the longer term
impact of buying back shares at current levels will be
at best neutral, and at worst, value-destructive.
5. Headline EPS growth figures overstate underlying earnings growth due to the impact of buybacks. Buybacks which reduce the number of shares outstanding
will lead to EPS growth outpacing overall earnings growth.
Across the S&P 500 overall, Barclays estimate that, on
average, companies have benefitted from a 1-2% EPS
growth boost as a result of buyback activity but in some
cases the impact has been much larger. For example,
Apple’s Q2 earnings increased by around 12% but EPS
grew by almost 20%. This is not genuine growth but
instead has been manufactured by Apple’s buyback
program! Higher EPS figures can lead to higher share
prices as analysts often value companies based on their
EPS. By buying back shares, a company could potentially
inflate both its EPS and, as a consequence, its share price.
There is an argument that one reason for the popularity
of buybacks is that management remuneration packages
are often linked to EPS growth and this could help explain
the upsurge in buyback activity in the 2000s. Unless there
is a dramatic change to remuneration practices, which
there is no reason to expect without regulatory change,
management will continue to be incentivized to utilize
buybacks as a means of boosting their take-home pay.
6. If sustained, current levels of buybacks could do long term damage to the earnings capacity of listed companies, and with it, long term prospects for economic growth and equity market returns.
By choosing to pay out the vast majority of their profits
through a combination of buybacks and dividends,
companies are retaining only a small proportion of their
profits within the business to generate future growth.
If current profitability and payout ratios were to be
maintained then our calculations suggest that companies
would struggle to generate much more than 2% nominal
earnings growth on a sustainable basis. This would have
a disastrous impact on economic growth and longer term
equity market prospects. Current buyback policies may lead
to near term gains but at the expense of longer term pain.
Implications for our Capital Market Assumptions
Our expectation is that as the economic recovery
progresses and companies grow more confident regarding
the outlook, they will divert cash away from buybacks
and towards profitable investment opportunities.
Indeed, when looking through the long term lens of our
Capital Market Assumptions, we look past the current
high payout ratio and instead assume that in the long
run, companies pay out the proportion of their earnings
(through dividends and/or buybacks) that allows them to
maintain their growth at sustainable levels. This payout
ratio is significantly below current levels. Current high
payout ratios are unsustainable in the long run.
When setting our Capital Market Assumptions, we make the
simplifying assumption that long term sustainable payout
ratios are broadly comparable across the developed world.
However, we assume that emerging market companies pay out
a smaller proportion of their earnings as a greater proportion
must be retained in order to finance their faster growth rates.
EPS=Earnings
Number of shares oustanding

6 Capital Market Assumptions
Inflation
Realized inflation has been falling on a global basis but
despite the concern that has been raised over the
potential for very low inflation or deflation across many
countries, consensus expectations for longer term
inflation remain relatively well grounded. CPI inflation
expectations have been downgraded slightly but inflation
is expected to be relatively close to central banks’ 2%
target level over the next 10 years in the US, UK and
Canada. Nearer term expectations for European inflation
have fallen further but inflation is expected to pick up in
later years, raising the 10 year assumption to 1.7%.
The Japanese authorities have undertaken huge amounts
of monetary stimulus with an objective to generate growth
and break the hold deflation has had over the economy,
attaining a new higher inflation target of 2%. The consensus
has consequently been revising up inflation expectations
for Japan but remains unconvinced that the 2% inflation
target will be achieved on a sustainable basis. Japanese
inflation is expected to be around 1.6% per annum over the
next 10 years in Japan. Though below the 2% target, this is
significantly higher than the experience of the past decade.
USD GBP EUR CHF CAD JPY
CPI Inflation (10yr assumption) 2.2% 2.1% 1.7% 1.1% 1.9% 1.6%
RPI Inflation (10yr assumption) – 3.1% – – – –
Aon Hewitt 7
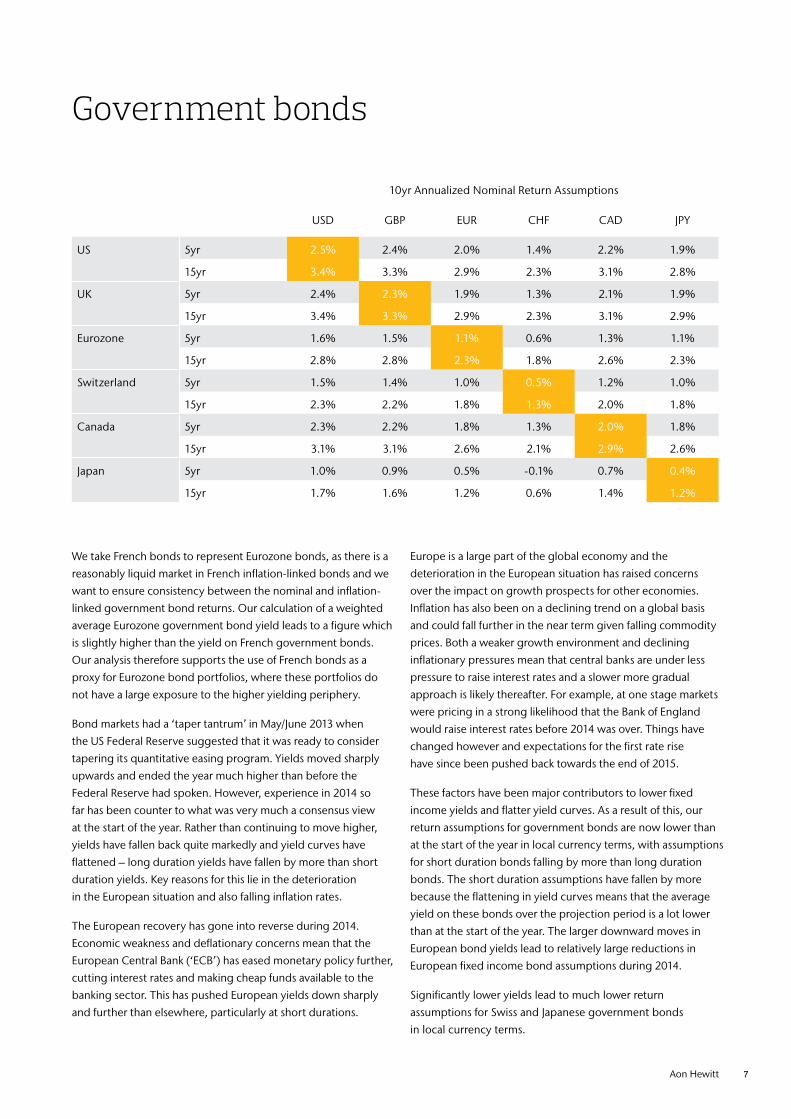
Government bonds
We take French bonds to represent Eurozone bonds, as there is a
reasonably liquid market in French inflation-linked bonds and we
want to ensure consistency between the nominal and inflation-
linked government bond returns. Our calculation of a weighted
average Eurozone government bond yield leads to a figure which
is slightly higher than the yield on French government bonds.
Our analysis therefore supports the use of French bonds as a
proxy for Eurozone bond portfolios, where these portfolios do
not have a large exposure to the higher yielding periphery.
Bond markets had a ‘taper tantrum’ in May/June 2013 when
the US Federal Reserve suggested that it was ready to consider
tapering its quantitative easing program. Yields moved sharply
upwards and ended the year much higher than before the
Federal Reserve had spoken. However, experience in 2014 so
far has been counter to what was very much a consensus view
at the start of the year. Rather than continuing to move higher,
yields have fallen back quite markedly and yield curves have
flattened – long duration yields have fallen by more than short
duration yields. Key reasons for this lie in the deterioration
in the European situation and also falling inflation rates.
The European recovery has gone into reverse during 2014.
Economic weakness and deflationary concerns mean that the
European Central Bank (‘ECB’) has eased monetary policy further,
cutting interest rates and making cheap funds available to the
banking sector. This has pushed European yields down sharply
and further than elsewhere, particularly at short durations.
Europe is a large part of the global economy and the
deterioration in the European situation has raised concerns
over the impact on growth prospects for other economies.
Inflation has also been on a declining trend on a global basis
and could fall further in the near term given falling commodity
prices. Both a weaker growth environment and declining
inflationary pressures mean that central banks are under less
pressure to raise interest rates and a slower more gradual
approach is likely thereafter. For example, at one stage markets
were pricing in a strong likelihood that the Bank of England
would raise interest rates before 2014 was over. Things have
changed however and expectations for the first rate rise
have since been pushed back towards the end of 2015.
These factors have been major contributors to lower fixed
income yields and flatter yield curves. As a result of this, our
return assumptions for government bonds are now lower than
at the start of the year in local currency terms, with assumptions
for short duration bonds falling by more than long duration
bonds. The short duration assumptions have fallen by more
because the flattening in yield curves means that the average
yield on these bonds over the projection period is a lot lower
than at the start of the year. The larger downward moves in
European bond yields lead to relatively large reductions in
European fixed income bond assumptions during 2014.
Significantly lower yields lead to much lower return
assumptions for Swiss and Japanese government bonds
in local currency terms.
USD GBP EUR CHF CAD JPY
US 5yr 2.5% 2.4% 2.0% 1.4% 2.2% 1.9%
15yr 3.4% 3.3% 2.9% 2.3% 3.1% 2.8%
UK 5yr 2.4% 2.3% 1.9% 1.3% 2.1% 1.9%
15yr 3.4% 3.3% 2.9% 2.3% 3.1% 2.9%
Eurozone 5yr 1.6% 1.5% 1.1% 0.6% 1.3% 1.1%
15yr 2.8% 2.8% 2.3% 1.8% 2.6% 2.3%
Switzerland 5yr 1.5% 1.4% 1.0% 0.5% 1.2% 1.0%
15yr 2.3% 2.2% 1.8% 1.3% 2.0% 1.8%
Canada 5yr 2.3% 2.2% 1.8% 1.3% 2.0% 1.8%
15yr 3.1% 3.1% 2.6% 2.1% 2.9% 2.6%
Japan 5yr 1.0% 0.9% 0.5% -0.1% 0.7% 0.4%
15yr 1.7% 1.6% 1.2% 0.6% 1.4% 1.2%
10yr Annualized Nominal Return Assumptions

8 Capital Market Assumptions
Inflation-linked government bonds
We have taken French bonds to represent Eurozone
bonds, partly because there is a reasonably liquid market
in French inflation-linked bonds. Our analysis of nominal
government bonds also suggests that French bonds are
a reasonable proxy for Eurozone government bonds so
we make the same assumption here for consistency. The
bonds represented are linked to Eurozone inflation.
We formulate return assumptions for 10 year US and
Eurozone inflation-linked government bonds rather than
15 year bonds. This is because we think that the absence
of inflation-linked bonds at the longest durations in these
markets can lead to misleading 15 year bond return
assumptions. We also no longer publish a 5 year duration
Canadian inflation-linked government bond assumption
due to the lack of short duration bonds in this market.
A similar story holds for inflation-linked as for nominal
government bonds when, after the large rises seen in
2013, real yields have fallen back in 2014. Short duration
real yields are in negative territory for all of the markets
covered in our Capital Market Assumptions and are even
negative at long durations in the UK and Europe. Low real
yields lead to low return assumptions for these bonds.
A second factor influencing inflation-linked bond return
assumptions is inflation expectations. In this respect, returns
from UK index-linked gilts benefit in relative terms compared
with the other markets by virtue of the fact that returns on
these bonds are linked to UK RPI inflation. This has an impact
because other regional inflation-linked bond returns are
linked to CPI inflation and this is assumed to be much lower
than UK RPI inflation. UK real yields remain well below the
level of the other markets so if it were not for the difference
between RPI and CPI inflation, the return assumption for
UK index-linked gilts would be much lower compared
with the other regions than shown in the table above.
USD GBP EUR CHF CAD JPY
US 5yr 2.9% 2.8% 2.4% 1.8% 2.6% 2.4%
10yr 2.9% 2.8% 2.4% 1.8% 2.6% 2.4%
UK 5yr 2.6% 2.6% 2.1% 1.6% 2.4% 2.1%
15yr 2.3% 2.2% 1.8% 1.2% 2.0% 1.7%
Eurozone 5yr 2.1% 2.0% 1.6% 1.0% 1.8% 1.5%
10 yr 2.0% 2.0% 1.5% 1.0% 1.8% 1.5%
Canada 5yr - - - - - -
15yr 2.4% 2.4% 1.9% 1.4% 2.2% 1.9%
10yr Annualized Nominal Return Assumptions

Aon Hewitt 9
Investment grade corporate bonds
Corporate bond returns depend on both a government yield
component and a credit spread component but also take account
of losses arising from defaults and bonds being downgraded.
As with all fixed income assets, the decline in government
yields during 2014 has put downward pressure on our
corporate bond assumptions. However, in addition, credit
spreads in many regions have declined and this means that
corporate bond return assumptions have generally fallen by
a larger amount than the government bond assumptions.
USD GBP EUR CHF CAD JPY
US 5yr 3.2% 3.1% 2.7% 2.1% 2.9% 2.6%
10yr 4.4% 4.4% 3.9% 3.4% 4.2% 3.9%
UK 5yr 3.2% 3.2% 2.7% 2.2% 3.0% 2.7%
10yr 3.8% 3.8% 3.3% 2.8% 3.6% 3.3%
Eurozone 5yr 1.9% 1.8% 1.4% 0.8% 1.6% 1.3%
10yr 2.6% 2.6% 2.1% 1.6% 2.4% 2.1%
Switzerland 5yr 1.8% 1.7% 1.3% 0.7% 1.5% 1.2%
10yr 2.2% 2.1% 1.7% 1.1% 1.9% 1.6%
Canada 5yr 3.3% 3.3% 2.8% 2.3% 3.1% 2.8%
10yr 4.2% 4.1% 3.7% 3.1% 3.9% 3.6%
Japan 5yr 1.1% 1.1% 0.6% 0.1% 0.9% 0.6%
10yr 1.3% 1.2% 0.8% 0.3% 1.0% 0.8%
After having fallen to very low level, the high yield debt credit
spread increased by a large 0.9% during the third quarter.
This benefits future return expectations for high yield debt
although low government yields continue to be a drag on
long term prospects. Taking these points together as well as
allowing for average default experience, US high yield debt is
now assumed to return 4.2% a year over the next 10 years.
When the US first mentioned that it may be ready to consider
tapering, emerging market assets were among the worst
affected, suffering very poor performance.
This raised the credit spread that could be earned on US
dollar denominated debt. This credit spread subsequently
declined but remains elevated relative to US high yield debt.
The differing movements in these credit spreads mean that a
credit return premium has opened up for emerging market
debt relative to high yield debt. As with high yield debt,
lower Treasury yields have put downward pressure on the
US dollar denominated emerging market debt assumption,
which stands at 4.7% a year as at 30 September.
US high yield debt and emerging market debt
10yr Annualized Nominal Return Assumptions

10 Capital Market Assumptions
Equities
Our equity return assumptions are driven by market valuations,
earnings growth expectations and assumed payouts to
investors. The price you pay is one of the single biggest
drivers of returns, even over the long term. Looking back over
recent experience, strong equity market performance has
been driven more by increasing valuations than increasing
profits. Therefore, as markets have become more expensive,
our equity return assumptions have consequently fallen.
UK equities have a higher return assumption than the other
developed markets. The main reason for this is that this equity
market is currently the ‘cheapest’ of the developed markets in
valuation terms. As at 30 September, UK equities were trading
on a multiple of around 14 times our 2014 earnings assumption.
In contrast, US equities were valued at over 17 times our 2014
earnings assumption. Investors in UK equities are therefore
paying less for expected future earnings, which raises the
return assumption for the UK market relative to elsewhere.
Emerging market equities have significantly underperformed
developed markets over the past few years for a variety of
reasons including a reduction in emerging market growth
prospects and more recently, concerns over the impact of
less accommodative US monetary policy. This cheapened
the relative valuation of emerging market equities and, even
after allowing for a reduction in emerging market growth
prospects, has led to an increased return premium opening
up for emerging market equities over developed markets.
The earnings growth component of our equity return
assumptions comprises both near term and longer
term elements. While our Capital Market Assumptions
process typically involves using consensus inputs, for
some time we have believed that the consensus of
analysts’ forecasts has been unrealistically optimistic
regarding near term earnings growth prospects.
Unlike analysts, against a backdrop of weak global growth we
do not expect company profit margins to increase from their
already elevated levels. For this reason, we have developed
our own in-house corporate earnings paths which have led
to lower growth assumptions than forecast by the consensus.
For the major developed markets, we assume low single digit
earnings growth over the next few years. Not being influenced
by short-term market sentiment, our near term earnings growth
assumptions have been relatively stable overall, in contrast
to consensus expectations which have varied far more.
In the long term, we assume that companies’ earnings growth
is related to GDP growth. Crucially, we do not assume a one-
to-one relationship between a country’s growth rate and the
long term earnings growth potential of companies listed on
the stock market within that country. We do this because many
companies are international in nature and derive earnings
from regions outside of where they have a stock market
listing. An implication is that European company earnings
have only about a 50% direct exposure to developments in
the Eurozone and similarly, investors in non-European equity
markets should not consider themselves insulated from events
there either. It is also notable that emerging markets are an
important driver of profits earned in the developed world.
USD GBP EUR CHF CAD JPY
US 6.7% 6.6% 6.1% 5.6% 6.4% 6.1%
UK 7.4% 7.4% 6.9% 6.3% 7.2% 6.9%
Europe ex UK 6.9% 6.8% 6.4% 5.8% 6.6% 6.3%
Switzerland 6.6% 6.6% 6.1% 5.5% 6.4% 6.1%
Canada 7.0% 6.9% 6.4% 5.9% 6.7% 6.4%
Japan 6.5% 6.4% 5.9% 5.4% 6.2% 5.9%
Emerging Markets 8.4% 8.3% 7.9% 7.3% 8.1% 7.8%
10yr Annualized Nominal Return Assumptions

Aon Hewitt 11
Private equity
Real estate
We assume that global private equity will return 9.0%
per annum over the next 10 years in US dollar terms. The
assumption represents a diversified private equity portfolio
with allocations to leveraged buyouts (LBOs), venture capital,
mezzanine and distressed investments. Return expectations
for these different strategies depend on different market
factors. For example, distressed investments are influenced
by the outlook for high yield debt. Similarly, LBO returns
are influenced by the outlook for equity markets as well as
the cost of the debt used to finance these LBOs. The current
low interest rate environment is therefore beneficial for LBO
investors. Notwithstanding this, whereas in the past leverage
has been a big driver of private equity returns, particularly for
LBOs, in future the ability of managers to add value through
operational improvements will become more important.
On our analysis, the median private equity fund manager has
historically performed in line with the median public equity
manager, but high performing private equity managers have
performed significantly better. Our assumption incorporates
the level of manager skill (‘alpha’) associated with such a high
performing manager. This contrasts with our other equity
return assumptions where no manager alpha is assumed.
The US currently offers the highest real estate return
assumption of all of the markets covered in our Capital
Market Assumptions. Although capital values have been
rising, this market continues to benefit from a healthy rental
yield and a relatively robust outlook for rental growth.
In Europe, signs of stabilization have provided some support
to real estate capital values and they have been rising in
parts of the region. This has put some downward pressure
on rental yields although they have been more stable
than in the other major markets. This region continues to
offer a weak rental growth outlook because, unlike equity
markets which benefit from their international exposure,
real estate is much more closely tied to the fortunes of
the region in question. A weak rental outlook acts as a
drag on the return prospects for European real estate.
Our assumptions here are in respect of a large fund
which is capable of investing directly in real estate. The
assumptions relate to the broad real estate market in each
region rather than any particular market segment. Our
analysis allows for the fact that real estate is an illiquid
asset class and revaluations can be infrequent, leading
to lags in valuations compared with trends in underlying
market values. While our real estate assumptions do not
include any allowance for active management alpha or
active management fees, there is an allowance for the
unavoidable costs associated with investing in a real estate
portfolio. These include real estate management costs,
trading costs and investment management expenses.
USD GBP EUR CHF CAD JPY
US 7.0% 6.9% 6.5% 5.9% 6.7% 6.4%
UK 6.7% 6.6% 6.1% 5.6% 6.4% 6.1%
Europe ex UK 6.4% 6.4% 5.9% 5.3% 6.2% 5.9%
Canadian 5.8% 5.7% 5.3% 4.7% 5.5% 5.2%
10yr Annualized Nominal Return Assumptions

12 Capital Market Assumptions
Hedge funds
Our fund of hedge funds return assumption is 5.0% a year in
US dollar terms. We formulate this by combining the return
assumptions for a number of representative hedge fund
strategies. As with private equity, this assumption includes
allowances for manager skill and related fees (including
the extra layer of fees at the fund of funds level), but unlike
private equity, this is for the average fund of funds in the
hedge fund universe rather than for a high performing
manager. Our analysis allows for the fact that hedge fund
managers have been unable to deliver the high levels of
‘alpha’ that they did in the more distant past and that alpha
generation is likely to remain challenging moving forwards.
The individual hedge fund strategies we model as
components of our fund of hedge funds’ assumption are
equity long/short, equity market neutral, fixed income
arbitrage, event driven, distressed debt, global macro and
managed futures. Our modelling of these strategies includes an
analysis of the underlying building blocks of these strategies.
For example, we take into account the fact that equity long/
short funds are sensitive to equity market movements. In
practice the sensitivity of equity long/short funds to equity
markets can vary substantially by fund with some behaving
almost like substitutes for long only equity managers, while
others retain a much lower exposure. Our assumptions are
based on our assessment of the average sensitivity across
the entire universe of equity long/short managers.
Given the nature of the asset class, our hedge fund return
assumptions are more stable than, for example, our US equity
return assumption. Nonetheless, the strategies are impacted
by changes to the other asset class assumptions. For example,
most hedge funds are ‘cash+’ type investments to a greater or
lesser extent so the rise in cash return expectations during 2013
raised the hedge fund assumptions and the decline during 2014
has lowered the hedge fund assumptions. Similarly, changes
to our equity and high yield return assumptions influence
assumptions for those strategies which are related to these
markets, such as equity long-short and distressed debt.
As set out in the lead article to our 30 June 2013 Capital
Market Assumptions publication, history, forward looking
indicators and our view on the economic cycle all enter our
volatility assumption setting process and the volatilities in
the table above are representative for each asset class over
the next 10 years overall. For illiquid asset classes, such as
real estate, de-smoothing techniques are employed. All
volatilities shown above are in local currency terms. For
emerging market equities, global private equity and global
fund of hedge funds the local currency is taken to be USD.
Volatility in asset markets has fallen to unusually low levels
given the uncertainties facing financial markets and the global
economy. To a large extent this has been driven by the backstop
that central banks have been providing to markets. One example
concerns the statement by the President of the European Central
Bank, Mario Draghi, that the central bank would do “whatever
it takes” to save the euro. This reassured markets and brought
about a period of relative calm when before there had been
stress. When the US Federal Reserve stated in May 2013 that it
may soon start to reduce some of the support that it has been
providing to markets, volatility was reignited before falling back
once again. Volatility again spiked more recently but only for a
short period. Throughout, our assumptions have looked through
this recent period of low volatility and instead have been and
continue to be at a somewhat elevated level relative to history.
Please note that due to the level of yields and shape of
the yield curve in Japan and Switzerland, lower volatility
assumptions apply to bond investments in these markets.
Volatility
15yr Inflation-Linked Government Bonds 9.0%
15yr Government bonds 11.0%
10yr Investment Grade Corporate Bonds 9.0%
Real Estate 14.5%
US High Yield 14.0%
Emerging Market Debt (USD denominated) 12.0%
UK Equities 20.0%
US Equities 19.0%
Europe ex UK Equities 20.0%
Japan Equities 20.0%
Canada Equities 20.0%
Switzerland Equities 20.0%
Emerging Market Equities 28.5%
Global Private Equity 26.0%
Global Fund of Hedge Funds 8.0%
Aon Hewitt 13
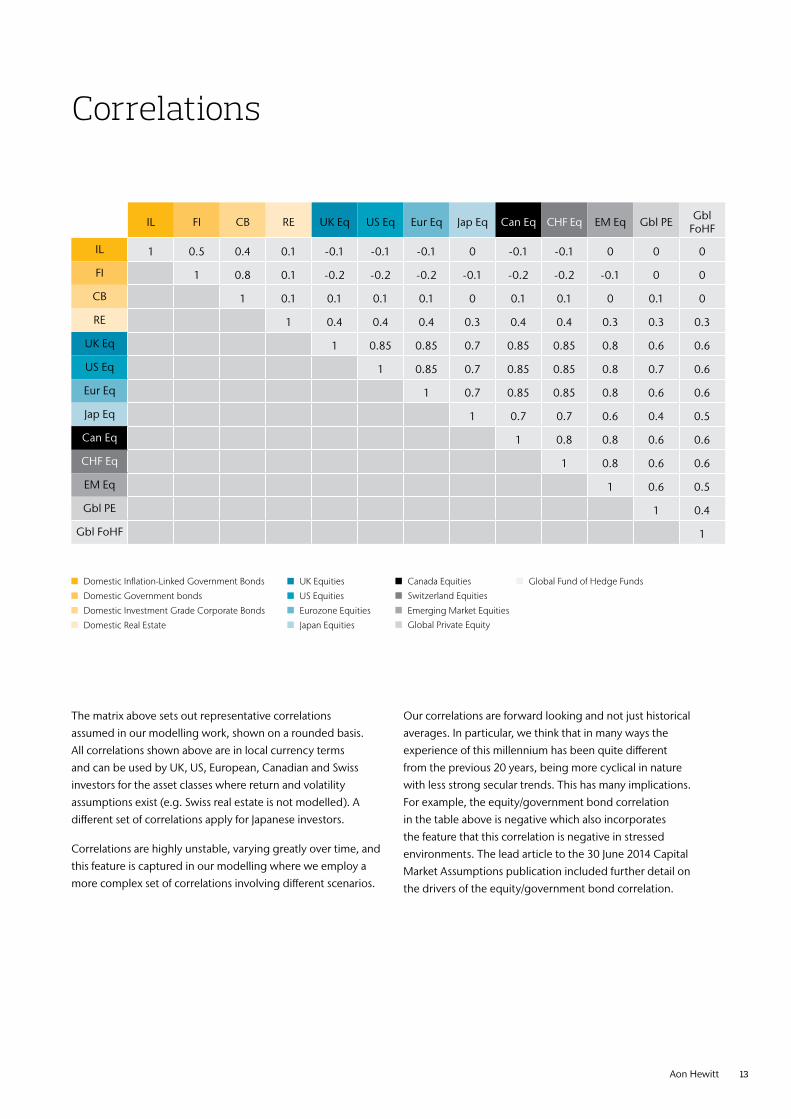
Correlations
IL FI CB RE UK Eq US Eq Eur Eq Jap Eq Can Eq CHF Eq EM Eq Gbl PE Gbl FoHF
IL 1 0.5 0.4 0.1 -0.1 -0.1 -0.1 0 -0.1 -0.1 0 0 0
FI 1 0.8 0.1 -0.2 -0.2 -0.2 -0.1 -0.2 -0.2 -0.1 0 0
CB 1 0.1 0.1 0.1 0.1 0 0.1 0.1 0 0.1 0
RE 1 0.4 0.4 0.4 0.3 0.4 0.4 0.3 0.3 0.3
UK Eq 1 0.85 0.85 0.7 0.85 0.85 0.8 0.6 0.6
US Eq 1 0.85 0.7 0.85 0.85 0.8 0.7 0.6
Eur Eq 1 0.7 0.85 0.85 0.8 0.6 0.6
Jap Eq 1 0.7 0.7 0.6 0.4 0.5
Can Eq 1 0.8 0.8 0.6 0.6
CHF Eq 1 0.8 0.6 0.6
EM Eq 1 0.6 0.5
Gbl PE 1 0.4
Gbl FoHF 1
Domestic Inflation-Linked Government Bonds
Eurozone Equities
Domestic Government bonds
Japan Equities
Domestic Investment Grade Corporate Bonds
Canada Equities Global Fund of Hedge Funds
US Equities
Global Private EquityDomestic Real Estate
Switzerland Equities
UK Equities
Emerging Market Equities
The matrix above sets out representative correlations
assumed in our modelling work, shown on a rounded basis.
All correlations shown above are in local currency terms
and can be used by UK, US, European, Canadian and Swiss
investors for the asset classes where return and volatility
assumptions exist (e.g. Swiss real estate is not modelled). A
different set of correlations apply for Japanese investors.
Correlations are highly unstable, varying greatly over time, and
this feature is captured in our modelling where we employ a
more complex set of correlations involving different scenarios.
Our correlations are forward looking and not just historical
averages. In particular, we think that in many ways the
experience of this millennium has been quite different
from the previous 20 years, being more cyclical in nature
with less strong secular trends. This has many implications.
For example, the equity/government bond correlation
in the table above is negative which also incorporates
the feature that this correlation is negative in stressed
environments. The lead article to the 30 June 2014 Capital
Market Assumptions publication included further detail on
the drivers of the equity/government bond correlation.

14 Capital Market Assumptions
Capital market assumptions methodology
Overview
Aon Hewitt’s Capital Market Assumptions are our asset class return, volatility and correlation assumptions. The return assumptions are ‘best estimates’ of annualized returns. By this we mean median annualized returns – that is, there is a 50/50 chance that actual returns will be above or below the assumptions. The assumptions are long term assumptions, based on a 10 year projection period and are updated on a quarterly basis.
Material uncertainty
Given that the future is uncertain, there is material uncertainty in all aspects of the Capital Market Assumptions and the use of judgment is required at all stages in both their formulation and application.
Allowance for active management
The asset class assumptions are assumptions for market returns, that is we make no allowance for managers outperforming the market. The exceptions to this are the private equity and hedge fund assumptions where, due to the nature of the asset classes, manager performance needs to be incorporated in our Capital Market Assumptions. In the case of hedge funds we assume average manager performance and for private equity we assume a high performing manager.
Inflation
When formulating assumptions for inflation, we consider consensus forecasts as well as the inflation risk premium implied by market break-even inflation rates.
Government bonds
The government bond assumptions are for portfolios of bonds which are annually rebalanced (to maintain constant duration). This is formulated by stochastic modelling of future yield curves.
Inflation-linked government bonds
We follow a similar process to that for nominal government bonds, but with projected real (after inflation) yields. We incorporate our inflation profiles to construct nominal returns for inflation-linked government bonds.
Corporate bonds
Corporate bonds are modelled in a similar manner to government bonds but with additional modelling of credit spreads and projected losses from defaults and downgrades.
Other fixed income
Emerging market debt and high yield debt are modelled in a similar fashion to corporate bonds by considering expected returns after allowing for losses from defaults and downgrades.
Equities
Equity return assumptions are built using a discounted cashflow analysis. Forecast real (after inflation) cashflows payable to investors are discounted and their aggregated value is equated to the current level of each equity market to give forecast real (after inflation) returns. These returns are then converted to nominal returns using our 10 year inflation assumptions.
Private equity
We model a diversified private equity portfolio with allocations to leveraged buyouts, venture capital, and mezzanine and distressed investments. Return assumptions are formulated for each strategy based on an analysis of the exposure of each strategy to various market factors with associated risk premia.
Real estate
Real estate returns are constructed using a discounted cashflow analysis similar to that used for equities, but allowing for the specific features of these investments such as rental growth.
Hedge funds
We construct assumptions for a range of hedge fund strategies (e.g. equity long/short, equity market neutral, fixed income arbitrage, event driven, distressed debt, global macro, managed futures) based on an analysis of the underlying building blocks of these strategies.
We use these individual strategies to formulate a fund of hedge funds’ assumption which is quoted in the Capital Market Assumptions.
Currency movements
Assumptions regarding currency movements are related to inflation differentials.
VolatilityAssumed volatilities are formulated with reference to implied volatilities priced into option contracts of various terms, historical volatility levels and expected volatility trends in future.
Correlations
Our correlation assumptions are forward looking and result from in-house research which looks at historical correlations over different time periods and during differing economic/investment conditions, including periods of market stress. Correlations are highly unstable, varying greatly over time. This feature is captured in our modelling.

ContactsDuncan Lamont T: +44 (0)20 7086 [email protected]
Disclaimer
This document has been produced by Global Investment Consulting of Aon Corporation. Nothing in this document should be treated as an authoritative statement of the law on any particular aspect or in any specific case. It should not be taken as financial advice and action should not be taken as a result of this document alone. Consultants will be pleased to answer questions on its contents but cannot give individual financial advice. Individuals are recommended to seek independent financial advice in respect of their own personal circumstances.
Aon Corporation 200 E. Randolph Street Chicago Illinois 60601, USA
Copyright © 2014 Aon Corporation

Risk. Reinsurance. Human Resources.
About Aon HewittAon Hewitt is the global leader in human resource
consulting and outsourcing solutions. The company
partners with organizations to solve their most
complex benefits, talent and related financial
challenges, and improve business performance.
Aon Hewitt designs, implements, communicates
and administers a wide range of human capital,
retirement, investment management, health
care, compensation and talent management
strategies. With more than 29,000 professionals in
90 countries, Aon Hewitt makes the world a better
place to work for clients and their employees.
For more information on Aon Hewitt,
please visit www.aonhewitt.com
© Aon plc 2014. All rights reserved.The information contained herein and the statements expressed
are of a general nature and are not intended to address the
circumstances of any particular individual or entity. Although we
endeavor to provide accurate and timely information and use
sources we consider reliable, there can be no guarantee that
such information is accurate as of the date it is received or that it
will continue to be accurate in the future. No one should act on
such information without appropriate professional advice after a
thorough examination of the particular situation.
Aon Hewitt Limited is authorised and regulated by the Financial
Conduct Authority. Registered in England & Wales.
Registered No: 4396810.