capital market development and economic growth in …
TRANSCRIPT

CAPITAL MARKET DEVELOPMENT AND ECONOMIC GROWTH IN
NIGERIA: AN EMPIRICAL ANALYSIS
Ologunwa, O. P. and O. V. Sadibo
Department of Economics,
The Federal University of Technology, Akure, Nigeria
[email protected]; [email protected]
Abstract
In the recent times, the literature appears to emphasize a sound capital market as an
important driver of economic growth due to its ability to provide liquid asset for investment.
The issue raised in this paper is about the effect of capital markets on economic growth. If a
strong capital market is a panacea to economic growth, why do least developed economies
not embrace it? To what extent can economic growth be affected by capital markets? These
issues were theoretically explained in the methodology and the data analysis was subjected
to empirical test. Using aggregate data for growth indicators and capital market indicators,
we adopted a structural dynamic model to investigate the issue. It was found that capital
market ratio and turnover ratio are both significant and positive drivers of economic growth
in Nigeria and that stock markets affect economic growth through savings mobilization. It is
asserted that large, liquid and efficient stocks markets can ease savings mobilization. The
paper recommends that stock market should be made attractive to foreign economies,
although it can also spell doom during a burst. However, if the funds had been carefully
utilized, , the economy may not be significantly affected during a burst..
Keywords: capital market, market capitalization, turnover ratio; economic growth
Doi: 1.1/fjmt.2016/v1n1p5
1. Introduction
Economic growth is perceived as continuous increase in the economic activities of a nation,
measured by its Gross Domestic Product (GDP). A growing economy is said to experience
development when factors that cause economic growth are recognized. One of such
economic factors is the availability of funds for private investment. Though the money
sector and, specifically commercial banks are expected to provide required funds for private
investors, they do so only for short tenures and investors need an institution that will provide
funds for longer periods, for which banks are not suited. The implication of this is that
private investment, an important component of GDP, will be hampered and this, in turn,
may reduce growth.
Capital market, according to the literature, always complements the effort of the banking
sector by mobilizing financial resources for long-term private investment. According to
Demirguc-Kunt and Levine (1996), many profitable investments require a long-term
commitment of capital, and investors are reluctant to relinquish control of their savings for
long periods. If economic growth partly and importantly rests on capital market activities,
then, capital market development should precede economic growth. In fact, Hicks (1969)
argues that innovation will be reflected in the economy when financial capital is made
accessible, that is, financial capital makes it easy to develop projects that require large
financial outlays for long periods before the projects ultimately yield profits. To this end,

FUTA Journal of Management and Technology Capital Market Development and Growth
Maiden Edition, 48-59, June 2016 Ologunwa, O. P and O. V. Sadibo 49
Bencivenga, et al (1996) argue that economic growth rests on the well behaved, well-
functioning financial market. However, the capital market does not, on its own,
automatically guarantee growth. Ahmed and ansari (1998) point out that capital markets
work well and hence contribute to economic growth when the government policy is directed
toward efficient allocation of financial resources. Inanga (1978)) had earlier suggested that
capital markets appear to be growth-enhancing if there exist well developed accounting,
auditing and financial disclosure standards, together with enforced legal and regulatory
framework for investor protection. In the process of meeting these conditions, Levine
(1991) concludes, the channels through which or extent to which capital market enhances
growth can be explained by how well that market functions. In 2003, Electronic Business
was commissioned in Nigeria so as to give investors access to the Central Securities
Clearing System (CSCS) database online for the purpose of monitoring movements in their
stock accounts. These reforms and others were put forward so as to continuously ensure an
environment conducive for the effective functioning of the capital market.
From the foregoing, it is clear that the capital market and its operations are not new in
Nigeria. Recently, the sector underwent series of reforms in order to strengthen its
performance. Given the fact that the capital market is capable of mobilizing investment fund
for the promotion of private enterprise, it must be the case that the inception of such market
will help Nigerian economy to grow. However, the existence of capital market may not
guarantee private investment and hence economic growth. In fact, it may be the case that
capital market works through private investment to impact on growth. If this is the case, then
the growth effect of capital market may be absorbed by investment. Therefore, it is
important to assess the extent to which capital market affects the growth performance of the
economy.
This paper focuses on the assessment of capital market development as it affects economic
growth, and specifically on the stock market segment. What informs this choice is that not
only are there available data for stock market performance (measured by its activities), all
other intermediaries participate in the stock market and therefore the stock market seems to
encompass other sectors.
The paper is made up of five sections. Section one is essentially an introduction, providing a
broad perspective of the paper as well as its motivation. The next section provides a survey
of existing literature on the channels of capital market for influencing economic growth. In
section three, issues regarding methodology and models for estimation are discussed.
Section four presents data, results and a discussion of their interpretations. The final section
of the paper provides a summary of findings, conclusions as well as policy implications
arising from the empirical findings.
2. Literature Review
2.1Theoretical Review
There are two lines of arguments in the analysis of the importance of financial system to
economic growth. One line of argument is that the financial system is not important for
economic growth; another line of argument stresses the importance of the financial system
in mobilizing savings, allocating capital, exerting corporate control and easing risk
management. More importantly, and in relation to this study, Levine and Zervos (1996)
indicated that some theories provided a conceptual basis for the belief that larger, more

FUTA Journal of Management and Technology Capital Market Development and Growth
Maiden Edition, 48-59, June 2016 Ologunwa, O. P and O. V. Sadibo 50
efficient stock markets boost economic growth. Bencivenga, Smith and Starr, (1996) and
Levine (1991) argue that stock market liquidity, i.e., the ability to trade equity easily, is
important for growth.
However, Conte and darrat (1988) argues that stock market liquidity, no matter how large, is
an unimportant source of corporate finance. Similarly, Spears (1991) says that stock market
liquidity will not enhance incentives for acquiring information about firms or exerting
corporate governance because of the agency problem involved between stockholders and
management of firms. In fact, in contrast to the position of Robison (1952), Devereux and
Smith (1994) emphasize that greater risk sharing through internationally integrated stock
market can actually reduce savings rates and slow economic growth. The suggestions that
stock market development can limit economic growth by making it easy and
counterproductive have also been asserted by researchers Levine Rose (1996).
The channels through which capital market development affects economic growth have been
classified into four. The first is through stock market liquidity. Levine (1991) and
Bencivenga, Smith and Starr (1996) argue that stock market may provide liquidity in the
economy because savers have liquid assets, while firms have permanent use of capital,
raised by issuing equities. Liquid stock markets reduce the downside risk and cost of
investing in projects that do not pay off for a long time. According to Levine and Zervos
(1996), a liquid stock market ensures that initial investors do not lose access to their savings
for the duration of the investment project because they can quickly, cheaply and
confidentially sell their stake in the company. They thus conclude that more liquid stock
markets facilitate investment in long-term, potentially more profitable projects, thereby
improving the allocation of capital and enhancing the prospect for long-term growth.
The second way by which stock markets affect economic growth is through risk
diversification, which the market provides through international integration. Galinger
George (1994), and spears (1991) show how stock markets provide a vehicle for
diversifying risks. Their models demonstrate that greater risk diversification can influence
growth by shifting investment into higher-return projects. However, other research suggests
that, in some circumstances, lower risk can slow growth. They particularly show that
reduced risk through international diversification can reduce saving rates, slow growth and
more importantly reduce economic welfare.
The third channel is in the area of information acquisition. Stock market, according to
spears (1991) and (1995) Kiviet, can spur economic growth through acquisition of
information. Larger and more liquid stock market will make it easier for investors who have
gotten information to trade at posted prices (Levine and Zervos, 1996). The investors are
able to make money before the information become widespread and prices change. This
ability to profit from information about firms will stimulate investors to research and
monitor firms. Jensen and Murphy (1988) show that efficient stock markets help mitigate
the principal-agent problem. It makes it easier to tie managerial compensation to stock
performance. In addition, takeover threats induce managers to maximize a firm’s equity
price.
The last channel through which the stock market affects economic growth is through savings
mobilization. It has been suggested that large, liquid and efficient stocks markets can cause
savings mobilization. By agglomeration of savings, stock markets enlarge the set of feasible
investment projects (Levine and Zervos, 1996). Since some worthy projects require large

FUTA Journal of Management and Technology Capital Market Development and Growth
Maiden Edition, 48-59, June 2016 Ologunwa, O. P and O. V. Sadibo 51
capital investment, and some enjoy economies of scale, stock markets facilitate resource
mobilization and can boost economic efficiency and accelerate long-run growth. From
another perspective, however, it has been argued that new equity issues account for very
small frontiers of corporate investment (Mayer, 1988). This casts doubt on the potency of
stock markets for amassing capital.
2.2Empirical Evidence
Levine and Zervos (1996), using a cross-country pooled time series regression to evaluate
the relationship between stock market development and economic growth for over forty one
countries over 1976-1993, found that stock market development is positively correlated with
measures of financial intermediary development. On the whole, the data suggests that stock
market development is positively associated with economic growth.
Moreover, they found that the instrumental variable procedures indicate a strong connection
between predetermined component of stock market development and long-run growth.
Levine and Zervos (1996) findings agree with Dermirgue-Kunt and Levine (1996) findings
that individual indicators of stock market development are positively correlated with
individual indicators of financial intermediary development for forty one countries. They
found that stock market size measured by market capitalization and liquidity measured by
total value traded/GDP ratio are positively correlated with all indicators of financial
intermediary development in these countries. The financial intermediary development
indicators used were the ratio of liquid liabilities to GDP and the ratio of credit to private
sector to GDP.
3.0 Research Methodology
The theoretical framework used for this paper is an endogenous growth model without
financial markets by the Dow and gary (1997) called structure of preferences. This creates
liquidity risk and also productivity shocks that create production risk. It is assumed that an
economy consists of an infinite sequence of three-period-lived; agents and a countable
infinity of agents are born each period. There is no population growth.
C (c1, c2, c3) = -[c2 + θc3]-γ/γ ........................................................1
Where γ > 0, -γ + 1 is the coefficient of relative risk aversion, and ci,,c2,c3are age 1,2 and 3
consumption. Since there is no utility from age one consumption, all income is saved. Thus,
the financial system and policy cannot alter the savings rate. Θ is an individual-specific
random variable realized at the beginning of age 2. There are two production opportunities.
The first is a liquid "storage" technology. Investment of one good at t yields n > 0 goods at t
+ 1 or t + 2, where t is the time indexed by t=0,1,2…..The second production technology
involves the risky and illiquid activity of forming and investing in "firms" that have a higher
expected return than the liquid technology. In a two-stage, two-period process, consumption
goods are produced using capital, labour, and human capital. Human capital is non-tradable
and represents the knowledge and skills embodied in individuals. In the first stage of firm
production, individuals augment human capital.
This takes period t + 1 and some of period t + 2, so that only age three agents have human
capital. Each individual's accumulation of human capital depends positively first, on his
interactions with others Rajan and Luigi (1998), then, the amount of resources invested by
the individual, and finally, on the average amount of capital invested and maintained in the

FUTA Journal of Management and Technology Capital Market Development and Growth
Maiden Edition, 48-59, June 2016 Ologunwa, O. P and O. V. Sadibo 52
firm for two periods. Letting q equal the fraction of age one income wt invested in the firm
by an agent born in t, his human capital H is
Ht+2 = HŴt+2(qwt)σ .............................................................................2
where H is a constant, qwt is the resources invested by the agent, and Ŵt+2 , so that type 0
agents prematurely withdrew capital from firms to the detriment of the firm’s remaining
members. With a "stock market", however, agents can conduct mutually and socially
beneficial transactions.
Equation 4 from 3 shows that stock markets increase firm efficiency. Even if the investment
decisions q are equal, the stock market economy will grow faster than the non-stock market
economy because stock markets eliminate the premature liquidation of firm capital. As
shown in the equations below, the higher the proportion of the economy's resources invested
in firms, the faster will be the steady state growth rate. If agents are sufficiently risk averse,
the proportion of resources devoted to firms is higher with a stock market. So in this case,
no firm resources are prematurely liquidated and all stored goods are consumed by initial
spending agents. Given this proposition, the agents will consume their stored goods plus the
stock value claims to period t+2 firm produced goods, i.e. the value of their firm stock.
Assuming that agents hold diversified portfolios, agents solve
..........................3
This equation says that no firm capital is liquidated. The two period’s equilibrium growth
then becomes
................................................4
These two equations demonstrate that the higher the proportion of the economy’s resources
invested in firms, the faster will be the steady state growth rate. If agents are sufficiently risk
averse, the proportion of resources devoted to firms is higher with a stock market (qs> q).
Following equation 4, the economic functional specification is given by the following
equation
GROWTH = aX + f(STOCK) + u ………………………………………………………..5
Where X is a set of control variables, a is a vector of coefficients on the variables in X, f is
the estimated coefficient on STOCK, and u is an error term.
One of the goals of this research work is to assess the independent partial correlation
between stock market development and economic growth. Therefore, the Augmented
Dickey Fuller (ADF) test was used to examine the stationary of variables. ADF test is a test
for unit root. However, this test is not reliable for small sample data set due to its size and
t
ss
tt
s
qwqWHPnwq
s 211
max
P
nwqwqWH t
s
t
ss
t
12
1HqHHg sbs
y

FUTA Journal of Management and Technology Capital Market Development and Growth
Maiden Edition, 48-59, June 2016 Ologunwa, O. P and O. V. Sadibo 53
power properties Harris, Richard (1997). Two new tests, i.e., Dicky-Fuller Generalized
Least Square could solve the problems of data size and power properties. The Augmented
ARDL (p, q1, q2, ……qk) is given by the following equation Granger (1969)
α(L,P)yt+ β1(L,q)xit + λ wt +εt
where α(L,P) = 1-α1L – α2L2 - …………… -αpLp
βt(L,q1) = βt0L + βt2L2 + ………….. + βtqtLqt )
ytis an independent variable, λ is the constant term, L is the lag operator such that Lyt= yt- 1,
wtis sX1 vector of deterministic variables such as intercept term, time trends, or exogenous
variables with fixed lags.
After the discussion of theoretical model regarding the ARDL technique, we investigates the
existence of a long-run relationship in the form of the unrestricted error correction model for
each variable as follows regarding our issues:
ΔGRGDP = α0 + α1t+ α2ΔGRGDPt-1 + α3ΔMCRt-1 + α4GRPCIt-1 + α5MCRt-2 + α6ΔFDIt-1
+α7FDIt-2+ α8ΔSEt-1 +α9SEt-2 + ηt…………………………………………………..….… 6
ΔGRGDP =β0 + β1t+ β2ΔGRGDPt-1 + β3GRPCIt-1+ β4ΔSTRt-1 + β5STRt-2 + β6ΔFDIt-1
+β7FDIt-2+β8ΔSEt-1+β9SEt-1μt……………………………………………………...…7
ΔGRGDP =β0 + β1t+ β2ΔGRGDPt-1 + β3GRPCIt-1+ β4ΔT0Rt-1 + β5T0Rt-2 + β6ΔFDIt-1
+β7FDIt-2+β8ΔSEt-1+β9SEt-1μt ……………………………………………………………8
Where GRGDP is the growth rate of real gross domestic product, GRPCI is the real growth
rate of GDP per capita, MCR is the market capitalization as share of GDP, STR is the share
of traded ration, TOR is the turnover ratio, FDI is the share of foreign direct investment in
GDP, SE is the secondary school enrolment used to proxy for human capital, t is time trend
variable, while η & µ are error terms in the models. The first part and the rest of the
equations with the parameters α2 α3, and β2 , β3, and so on, represent the short-run dynamics
of the models and the long-run phenomenon.
4.0 Results and Discussion
The paper presents the result of pair-wise correlation that shows the relationship between the variables: the essence
of presenting this is to achieve our objectives. Table 1 show that the growth rate of real gross domestic product
(RGDP) was around 4% while the average real growth rate of GDP per capita was 1%.
The real growth rate of foreign direct investment (GDFDI) declined at the rate the stock
market; turnover ratio appears to be the most performing indicator. The Table show that the
highest real growth rate of GDP in the period was 19 percent, while the lowest real growth
rate of GDP was -7% . In the same vein, the maximum real growth rate of GDP per capita
occurred in of 1% on average. Out of the three indicators of capital market performance,
only the turnover ratio (TOR) grew significantly (average growth rate was 3.2% per year),
while that of market capitalization ratio (MCR) and share of traded ratio (STR) grew at less
than 1 percent. The maximum growth rate of real foreign direct investment was around 58%
while the minimum growth rate was around -41%. In the case of the capital market
indicators, the maximum growth rate of market capitalization ratio was 0.06% and the
minimum was 0.01%. Also, the maximum growth rate of share of traded ratio was 5.21%

FUTA Journal of Management and Technology Capital Market Development and Growth
Maiden Edition, 48-59, June 2016 Ologunwa, O. P and O. V. Sadibo 54
while the minimum was 0.08%. Turnover ratio had the highest growth of approximately
10% while the minimum growth rate is 0.94%.
Table 1: Descriptive Statistics of the variables GRGDP GRPCI GRFDI MCR STR TOR
Mean 0.04 0.01 -0.02 0.01 0.83 3.22
Median 0.04 0.00 -0.05 0.01 0.47 2.10
Maximum 0.19 0.08 0.58 0.06 5.21 9.81
Minimum -0.07 -0.08 -0.41 0.01 0.08 0.94
Std. Dev. 0.05 0.04 0.23 0.01 1.07 2.68
Skewness 0.51 -0.22 0.67 2.92 2.79 1.26
Kurtosis 4.00 3.02 3.26 11.47 11.42 3.30
Jarque-Bera 2.30 0.21 2.11 118.98 114.96 7.22
Probability 0.32 0.90 0.35 0.00 0.00 0.03
Sum 1.17 0.15 -0.49 0.37 22.36 86.97
SumSq. Dev. 0.07 0.04 1.37 0.00 30.04 186.52
Observations 27 27 27 27 27 27
Authors’ Computation, 2015
This is an indication that the capital market development, appears to be improving, at least
in terms of performance.
The result of correlation exercise presented in Table 2, shows the correlation
coefficient of the variables. Two out of three indicators of capital market are positively
correlated with GDP growth rate. However, such association is very weak, due to the low
coefficient of the variables. In particular, turnover ratio (TOR) tends to be negatively
related to GDP while share traded ratio and market capitalization ratio relate with GDP
positively.
Table 2: Pair wise correlation matrix of the variables
GRFDI GRPCI MCR STR TOR GRGDP
GRFDI 1.00 -0.14 0.07 0.11 -0.14 -0.01
GRPCI -0.14 1.00 0.02 0.12 -0.05 0.65
MCR 0.07 0.02 1.00 0.87 -0.22 0.15
STR 0.11 0.12 0.87 1.00 -0.46 0.27
TOR -0.14 -0.05 -0.22 -0.46 1.00 -0.24
GRGDP -0.01 0.65 0.15 0.27 -0.24 1.00
Source: Authors Computation 2015
The Table shows a positive and strong relationship between GDP per capita
growth and real GDP growth rate. This type of association is consistent with what was
found in the literature and it is an indication that growth of GDP tends to improve the
welfare of the populace if GDP per capita were to be used for such a measure.
The variations explained by our repressors are not up to one percent in any of the three
models. It appears that the effect of capital market indicators on economic growth is not
immediate. That is, any shock in the capital market tends not to have an immediate effect on
economic growth. Perhaps the reason may be that some of the variables are likely to be
non-stationary and hence tend to have a unit root. The result of the unit root test shown in
table 3, suggests that out of seven variables, five were stationary at levels, two stationary at
first difference. It must be noted that the decision for I (0) or (1) was taken at 1% critical
value. The implication of this is that some variables are non-stationary and hence violated
the assumptions of OLS. That is, there appears to be a systematic association between a

FUTA Journal of Management and Technology Capital Market Development and Growth
Maiden Edition, 48-59, June 2016 Ologunwa, O. P and O. V. Sadibo 55
particular variable and its time trend. Thus long run information will be lost if we revert to
the use of OLS.
The next level is to examine whether the variables co-integrate, whether they have
long-run convergence. The result of co-integration test is presented in Tables 4, 5, and 6
respectively. There are four co-integrating equations in the model for market capitalization
ratio model (MCR), four co-integrating equations in the model for share of traded ratio
(STR) and four co-integrating equations in the model for turnover ratio (TOR).
Table 3: Augmented Dikey-Fuller Unit Root Test LEVELS FIRST DIFFERENCE REMARK
VARIABLES ADF
1%
CRITICAL
5%
CRITICAL
10%
CRITICAL ADF
1%
CRITICAL
5%
CRITICAL
10%
CRITICAL
ECMMCR -5.65 -3.72 -2.99 -2.63 I(0)
ECMTOR -6.00 -3.72 -2.99 -2.63 I(0)
ECMSTR -5.74 -3.72 -2.99 -2.63 I(0)
GRFDI -7.47 -3.71 -2.98 -2.63 I(0)
GRGDP -3.18 -3.71 -2.98 -2.63 -6.55 -3.72 -2.99 -2.63 I(1)
MCR 2.43 -3.79 -3.01 -2.65 2.09 -3.81 -3.02 -2.65 I(1)
GRPCI -4.01 -3.71 -2.98 -2.63 I(0)
STR 0.45 -3.77 -3.00 -2.64 1.30 -3.77 -3.00 -2.64 I(1)
TOR -1.97 -3.71 -2.98 -2.63 -4.25 -3.72 -2.99 -2.63 I(1)
Source: Authors Computation 2015
Table 4: Johansen Co integration Test result for Market Capitalization Ratio
Hypothesized Trace 5 Percent 1 Percent
No. of CE(s) Eigenvalue Statistic Critical Value Critical Value
None ** 0.66571 63.33537 47.21 54.46
At most 1 ** 0.514643 35.94171 29.68 35.65
At most 2 * 0.387855 17.86993 15.41 20.04
At most 3 * 0.200694 5.600274 3.76 6.65
*(**) denotes rejection of the hypothesis at the 5%(1%) level
Source: Authors Computation 2015
Table 5: Johansen cointegration Test result for Share of Traded Ratio
Hypothesized Trace 5 Percent 1 Percent
No. of CE(s) Eigenvalue Statistic Critical Value Critical Value
None ** 0.630265 59.88285 47.21 54.46
At most 1 * 0.5463 35.00864 29.68 35.65
At most 2 0.41845 15.25067 15.41 20.04
At most 3 0.065711 1.699226 3.76 6.65
*(**) denotes rejection of the hypothesis at the 5%(1%) level
Source: Authors Computation 2015
Table 6: Johansen Co integration Test result for Turnover Ratio
Hypothesized Trace 5 Percent 1 Percent
No. of CE(s) Eigenvalue Statistic Critical Value Critical Value
None ** 0.647152 62.77608 47.21 54.46
At most 1 ** 0.51337 36.73315 29.68 35.65
At most 2 * 0.413862 18.72689 15.41 20.04
At most 3 * 0.193358 5.371895 3.76 6.65
*(**) denotes rejection of the hypothesis at the 5%(1%) level
Source: Authors Computation 2015
FUTA Journal of Management and Technology Capital Market Development and Growth
Maiden Edition, 48-59, June 2016 Ologunwa, O. P and O. V. Sadibo 56
Table 7 Error Correction Model
Independent Variables 1 2 3
C
GRGDP(-1) 1.18 1.13
- [0.28] [0.30]
GRGDP(-2) 0.23 - -
[0.15] - -
GRGDP(-3) -0.36 - -0.24
[0.01] - [0.19]
GRFDI 0.025 0.02 0.019
[0.00] [0.01] [0.01]
GRFDI(-1) 0.02 0.02 0.01
[0.01] [0.01] [0.01]
GRFDI(-2) -0.02 -0.01 -0.02
[0.01] [0.01] [0.01]
GRPCI 0.21 1.08 1.22
[0.08] [0.28] [0.32]
GRPCI(-1) 1.82 -1.11 -0.97
[0.36] [0.32] [0.35]
GRPCI(-2) - - -
- - -
GRPCI(-3) 0.14 - 0.25
[0.23] - [0.25]
MCR - - -
MCR(-1) - - -
MCR(-2) 3.12 - -
[0.84] - -
TOR - - 0.09
- - [0.04]
TOR(-1) - - -0.04
- - [0.01]
TOR(-2) -
- - [6.39]
STR - - -
STR(-1) - -0.01 -
- [0.00] -
STR(-2) - -
ECMMCR(-1) -0.47 [0.11] -
ECMTOR(-1) - - -1.50 [0.35]
ECMSTR(-1) - -1.35 [0.40]
R-SQRD .72 0.62 0.72
F-STATISTIC
DW 1.66 1.63 1.75
Source: Authors Computation 2015
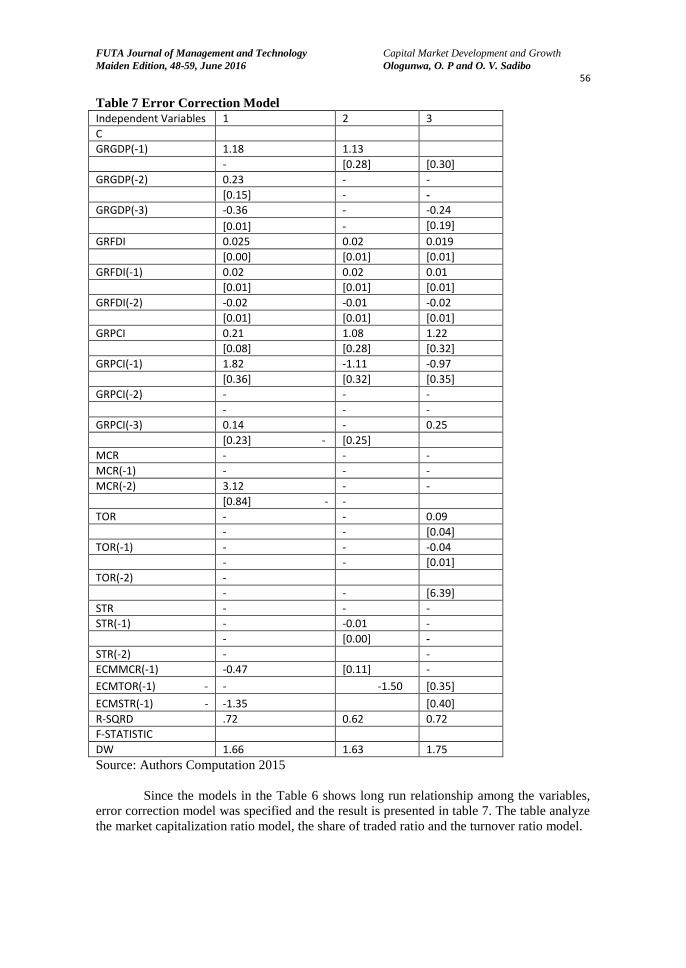
Since the models in the Table 6 shows long run relationship among the variables,
error correction model was specified and the result is presented in table 7. The table analyze
the market capitalization ratio model, the share of traded ratio and the turnover ratio model.

FUTA Journal of Management and Technology Capital Market Development and Growth
Maiden Edition, 48-59, June 2016 Ologunwa, O. P and O. V. Sadibo 57
The value in the parenthesis is the standard error of the coefficient while the one
above the parenthesis is the coefficient value. Our findings indicate that not all capital
market indicators are significant for economic growth, although they are all necessary.The
structural dynamic version of our model implies that market capitalization ratio that is the
share of market capitalization in GDP is very important to economic growth. Continuous
increase in the share of market capitalization in GDP implies availability of fund for
investment and as investment increases, GDP rises considerably. This result is consistent
with the proposition of Levine (1991) where it was individually established that increase in
market capitalization leads to easy access to fund for investment and hence increase in
economic growth. . Meanwhile, it must be noted that an increase in market capitalization
does not immediately result in economic growth. Rather, lagged market capitalization leads
to economic growth. What this implies is that there appears to be a delay of one or two
years before market capitalization can effect on economic growth. Perhaps the reason for
this is that the immediate effect could be reflected in the level of output (GDP) and this
positive effect on output level could then lead to economic growth.
In the same vein, our findings show that turnover ratio, the share of market capitalization in
value traded, positively affect economic growth. As is the case of market capitalization
ratio, lagged value of turnover ratio significantly affect economic growth. Levine (1991)
and Bencivenga et al (1996) argue that if the share of market capitalization in the value of
stock traded continues to increase, more liquidity will be supplied to the economy savers
will have liquid assets, while firms will have permanent use of capital raised by issuing
equities. Liquid stock markets reduce the downside risk and cost of investing in projects that
do not pay off for a long time. According to Levine and Zervos (1996), a liquid stock
market ensures that initial investors do not lose access to their savings for the duration of the
investment project because they can quickly, cheaply and confidentially sell their stake in
the company. They thus conclude that more liquid stock markets ease investment in long-
term, potentially more profitable projects, thereby improving the allocation of capital and
enhancing the prospect for long-term growth.
5.0 Conclusion
In the recent time, the literature appears to emphasize sound capital market as an important
driver of economic growth due to its ability to provide liquid asset for investment. This
implies that what hinders the economic growth of some economies, particularly countries in
the developing world, is low financial development. This research work assessed how the
Nigerian stock market has since its inception in the 1960s, been effective in driving
economic activities. The issue raised in this paper is about the potency of capital market in
generating economic growth. To what extent can economic growth be affected by capital
markets? These issues were theoretically explained in the methodology and the data
analysis was subjected to empirical test.
Using aggregate data for growth indicators and capital market indicators, we adopted
structural dynamic model to investigate the issue. It was found that capital market ratio and
turnover ratio are both significant and positive drivers of economic growth in Nigeria. If the
market capitalization ratio increases by 10 percent, the economy will grow by 31 percent, if
it is reduced by 10 per cent, the economy will shrink by 31 per cent. According to Spears
(1991), capital market spurs economic growth through acquisition of information.
Also, the stock market affects economic growth through savings mobilization. It is asserted
that large, liquid and efficient stocks markets can ease savings mobilization. By

FUTA Journal of Management and Technology Capital Market Development and Growth
Maiden Edition, 48-59, June 2016 Ologunwa, O. P and O. V. Sadibo 58
agglomeration of savings, stock markets enlarge the set of feasible investment projects
(Levine and Zervos, 1996). Since some worthy projects require large capital investment,
and some enjoy economies of scale, stock markets that ease resources mobilization can
boost economic efficiency and accelerate long-run growth. Our results support these
propositions and so, we conclude that capital market development positively affects the
growth of the economy. This serves as contribution to the existing literature. As has been
found in some developing economies like Columbia (Levine, 1996); Chile and Indonesia
(Dermurgue-Kunt and Levine (1996) Nigeria is also an economy where the capital market
plays an important role.
Many recommendations have been made for the improvement of the economy. Thus the set
of recommendations submitted here will be an addition to the existing recommendations.
Government still needs to do more, particularly in the area of investment in uncertainty with
its concomitant corruption. The authorities in the stock market should extend company
listing and dealings to some medium scale enterprises. Awareness about how the stock
market operates in Nigeria is very low. Another important thing to focus on is to make the
stock market attractive to the foreign economies. Although, it might be argued that external
attraction can also spell doom during burst, if the funds are carefully utilized during the
boom, when it bursts, the economy may not likely be significantly affected.
Biographical note. Messrs Ologunwa, O. P. and O. V. Sadibo are lecturers in the
Department of Economics in the Federal University of Technology, Akure, Nigeria.
References
Ahmed, S. N. and M. I. Ansari. (1998). “Financial Sector Development and Economic Growth: The
South-Asian Experience,” Journal of Asian Economics. 9: 503-17.
Bencivenga, V. , B. Smith, and R. Starr. (1996). “Equity Markets, Transaction Costs, and Capital
Accumulation: An Illustration.” World Bank Economic Review. 10(2): 241-265.
Conte, Michael, and Ali Darrat. (1988). “Economic Growth and the Expanding Public Sector: A Re-
examination,” Review of Economics and Statistics. 70(2): 322-30.
Darrat, Ali, and F. Lopez. (1989). “Has Inflation Uncertainty Hampered Economic Growth in Latin
America?” International Economic Journal. 3(2): 1-15.
Dermurgue-kunt and Levine (1996) “Stock Market Development and the Financing Choices of Firms,”
World Bank Economic Review. 10: 341-369.
Dow, James and Gary Gorton. (1997). “Stock Market Efficiency and Economic Efficiency: Is There a
Connection?” Journal of Finance. 52: 1087-129.
Gallinger, George. (1994). “Causality Tests of the Real Stock Return-Real Activity Hypothesis,” The
Journal of Financial Research. 17: 271-288
Granger, C. J. (1969). “Investigating Causal Relationships by Econometrics Models and Cross Spectral
Methods,” Econometrica. 37: 425-35.
Harris, Richard. (1997). “Stock Markets and Development: A Re-assessment,” European Economic
Review. 41: 139-46.
Hicks, John. (1969). A Theory of Economic History. Oxford, U.K.: Clarendon Press.

FUTA Journal of Management and Technology Capital Market Development and Growth
Maiden Edition, 48-59, June 2016 Ologunwa, O. P and O. V. Sadibo 59
Kiviet, Jan F. (1995). “On Bias, Inconsistency, and Efficiency of Various Estimators in Dynamic Panel
Data Models,” Journal of Econometrics. 68: 53-78.
Levine, Ross, and Sara Zervos. (1996). “Stock Market Development and Long-run Growth,” World
Bank Economic Review. 10(2): 323-339.
Rajan, Raghuram and Luigi Zingales. (1998). “Financial Dependence and Growth,” American
Economic Review. 88: 559-586.
Robinson, Joan. (1952). The Rate of Interest, and Other Essays. London: Macmillan.
Spears, Annie. (1991). “Financial Development and Economic Growth Causality Tests,” Atlantic
Economic Journal. 19: 66.
Thornton, John. (1995). “Financial Deepening and Economic Growth in Developing Countries,”
Economia Internazionale. 48(3): 423-30.
World Bank. (1999). World Development Report 1998/99: Knowledge for Development. Washington,
D.C.: Oxford University Press.