capital markets watch 2018 - pwc...frameworks for islamic finance, we expect to see an increase in...
TRANSCRIPT

Africa Capital Markets Watch 2019March 2020
www.pwc.co.za/capitalmarketswatch

Snapshot
2010-2019
9IPOs in 2019
215IPOs
$1.2bn
IPO proceeds raised in 2019
$16.9bnIPO proceeds raised
59FOs in 2019
712FOs
$3.5bn
FO proceeds raised in 2019
$71.1bnFO proceeds raised
$4.3bn
Non-local currency corporate debt proceeds raised in 2019
$54.8bn
Non-local currency corporate debt proceeds raised
2019
2019 Africa Capital Markets Watch | 2

Overview of African stock exchanges at 31 December 2019
About Africa Capital Markets Watch 2019For the purposes of our analysis, equity capital markets (ECM) transactions included comprise capital raising activities (excluding listings with no capital raised), whether initial public offerings (IPOs) or further offers (FOs), by African companies on exchanges worldwide and those by non-African companies on African exchanges. Debt capital markets (DCM) transactions analysed include non-local currency debt funding raised by African companies in international markets, whether high-yield or investment grade. It should be noted that the classification of high-yield and investment grade is based on foreign currency credit rating assessments. This report does not analyse domestic local currency debt activity in detail.
The study covers activity up to 31 December 2019 and captures deals based on their pricing date. All market data was sourced from Dealogic, Bloomberg, Thomson Reuters and the stock market themselves, unless otherwise stated, and has not been independently verified by PwC.
2019 Africa Capital Markets Watch | 3

ContentsForeword 52019 trends in African capital markets 7Trends in global equity markets, 2010-2019 9African equity markets 12African debt markets 31Glossary 36Contacts 37Acknowledgements 38
2019 Africa Capital Markets Watch | 4

Foreword Overall ECM activity declined sharply from 2018, with 2019 posting the lowest proceeds raised in ten years, while DCM activity in 2019 remained on a relative par with prior years. The general slowdown in equity markets was driven by a series of macroeconomic factors, including a broader ECM deceleration in global markets, caution in the period leading up to key local elections, which took place in both Nigeria and South Africa in 2019, and more specifically in South Africa, growing political gridlock and economic malaise. Precursors to the drivers of this year’s decrease were also noted in 2018, as volatility spread across African financial markets due to a combination of local and global political uncertainty and weakening local fundamentals.
With a busy political agenda scheduled for 2020, both in Africa and around the globe and the economic impact of emerging public health concerns, we expect the low level of capital markets activity to continue, even as some of the key drivers of global uncertainty over the past few years, such as risks associated with Brexit and the US-China trade war seem to have become, at least for the moment, slightly less uncertain. Overall, according to IMF data, the 2020 economic outlook for Africa is stable, with moderate improvements from 2019 expected; growth in sub-Saharan Africa is projected to rise to 3.5% in 2020-21 from the expected 3.3% of 2019.
Other indicators such as the introduction of innovative products, the rising trend of sponsor-backed IPOs, and the continued push for the
introduction of state-owned enterprises into the capital markets suggest cause for a more positive outlook. Innovative products such as green, blue, and other sustainable development bonds and de-risking instruments such as derivatives, have been introduced in several markets, driving further market depth. The Nigerian Stock Exchange (NSE), for instance, announced plans to introduce a derivatives trading platform and is planning to launch equity index futures in 2020.
The introduction of green bond frameworks in Nigeria and Kenya has led to the issuance of the first local currency bonds with specified ecological targets in both countries in 2019. Across Africa, governments continue with initiatives to privatise large state-owned enterprises to decrease sovereign debt burdens and fund short term budget deficits, and private equity players are driving some of the largest IPOs in the region.
Despite the continued global political and economic volatility noted above, investors appear to have an increased appetite for African equity markets, as reflected in the positive performance of the MSCI Emerging Frontier Markets Africa index, an index capturing the performance of large and mid-cap companies listed in 15 African countries, which was up 11.4% (17.3% excluding South Africa) during 2019; this trend reverses last year’s 23.3% (12.6% excluding South Africa) decline.
2019 Africa Capital Markets Watch | 5

In terms of debt markets, corporate issuers raised $4.3 billion of non-local currency debt in 2019, a decrease of 28% in terms of value, though a 22% increase in volume, from 2018. Already high leverage coupled with volatility in exchange rates between local currencies and common offshore funding currencies may have contributed to a more cautious approach to non-local currency issues by African issuers over the past year, despite the low interest rate environment in more developed markets and healthy investor appetite for African issuances.
OutlookA state of uncertainty seems to have become the new normal, and we expect some degree of volatility and caution to continue to affect Africa’s capital markets activity in 2020. This sentiment is also reflected in PwC’s 2019 CEO Survey, in which African CEOs interviewed noted their expectations for a slowdown in economic growth as well as their top concerns, which included political risk, over-regulation, and the ability to fill the skills gap in the workforce.
Consistent with prior years, we expect governments across Africa to continue to implement strategies towards building robust capital markets; for example, Ethiopia’s plan to launch a local stock market by 2020, Angola’s roadmap to privatise its state-owned companies by 2022 (11 of these through a stock exchange auction, and 7 through an IPO), and other announced privatisations through listings in Malawi and Ghana.
As stated above, growth in sub-Saharan Africa is projected to rise to 3.5% in 2020. However, the overall average growth rate masks the disparity in growth between non-resource intensive and resource-intensive countries. The first group, comprising 24 economies, is expected to grow at an average rate of 6%, while the latter, a group of 21 countries including Africa’s largest economies, Nigeria and South Africa, is expected to grow at a rate of 2.5%, lower than the 3.5% overall sub-Saharan Africa 2020-21 forecast. Governments in these lower-growth economies will need to work even harder in the coming years on structural reforms to restore confidence in their markets, without hindering the ability of companies to do business.
2019 Africa Capital Markets Watch | 6

2019 trends in African capital markets
Sustainable and Islamic finance: an opportunity for the African capital markets
Social, green and blue bondsFollowing the introduction of green bond frameworks in Nigeria and Kenya, and the launch of a market development programme by Kenya’s Capital Markets Authority in 2018, corporate green bonds (the proceeds of which are used to finance eligible projects aimed at reducing companies’ environmental footprint) have since been issued in both countries in 2019.
In Nigeria, Access Bank issued the first certified corporate green bond, raising NGN15 billion ($41 million), while North-South Power Company listed a NGN8.5 billion ($23.6 million) green infrastructure bond on the NSE. Kenya’s first corporate green bond, issued by Acorn Holdings in 2019, raised KES4.6 billion ($41.3 million), which was subsequently cross-listed on the London Stock Exchange (LSE).
Consistent with global trends, the continent is witnessing growth in these sustainable finance initiatives. South Africa continues to lead in the green bond field with the Johannesburg Stock Exchange (JSE) currently hosting five listed green bonds with a combined market cap of ZAR6.8 billion ($453.7 million). Late in 2018, the Republic of Seychelles introduced the world’s first sovereign blue bond, raising $15 million.
Supported by the World Bank, the blue bond provides financing for sustainable marine and ocean related activities and fisheries projects. Blue bonds, similar to green bonds, aim to mobilise capital towards environmental issues and the achievement of the United Nations Sustainable Development Goals.
Further to these environmentally focused financing initiatives, in May 2019, Mauritius-based Bayport Management Limited issued a $260.0 million ‘social bond’, the first of its kind in Africa. The bond was listed on the Nasdaq Stockholm Sustainable Bond list and its proceeds aim to finance projects that will deliver a wider social impact, including job creation and financial inclusion.
2019 Africa Capital Markets Watch | 7

Developing Islamic finance across AfricaAccording to Moody’s, sub-Saharan Africa has experienced significant growth in Islamic finance. In 2018, assets grew 18.2%, to $18.8 billion compared to the previous year, overtaking Europe, the Americas, and Australia. It is estimated that assets have grown by a further 10% in 2019.
Following Morocco’s successful 2018 sovereign sukuk (shariah compliant bonds) issuance, Nigeria issued a NGN100 billion sukuk in 2019 ($327 million), which was listed on the NSE, while in South Africa, Al Baraka Bank announced in November its intention to raise ZAR400 million ($27 million) for a second sukuk issuance.
Islamic finance has widened the financing options available to African issuers, particularly in addressing the infrastructure gap estimated at between $68 billion and $108 billion a year, according to the African Development Bank. As countries continue to implement the necessary legal and regulatory frameworks for Islamic finance, we expect to see an increase in Africa’s share of the global Islamic finance market, currently valued at over $2 trillion.
In June and July 2019, Morocco sold an additional 8% stake in Maroc Telecom, raising $923.9 million through a further offer, as part of the government’s plan to reduce the country’s budget deficit and to boost growth. Similarly, Ethiopia is in the process of privatising key state enterprises to reduce national debt and is planning to launch its own local stock exchange by 2020; privatisation plans include the privatisation of Ethio Telecom and of assets owned by Ethiopian Sugar Corporation. Angola has launched its own privatisation programme (PROPRIV) aimed at spinning off a number of state companies by 2022, including the national airline, TAAG, telecoms firm Angola Telecom, and credit provider Banco Angolano de Investimientos, among others.
Elsewhere on the continent, Malawi-based FDH Bank has announced its planned listing on the Malawi Stock Exchange by mid-2020, as part of an agreement entered into between FDH Bank and the government of Malawi when it acquired 80% of the state-owned Malawi Savings Bank in 2016. Ghana is also set for the listing of its power distributor, the Electricity Company of Ghana, following the government’s announcement in its 2020 budget.
As these and other programmes progress, we expect privatisations to continue to play a key role in building the depth of capital markets across the continent.
Enhancements in regulatory landscapeIn an attempt to reposition several markets to enhance transparency and competitiveness, changes to the regulatory landscape are being implemented across different African countries.
In response to a series of recent high-profile corporate scandals by its local issuers, the JSE proposed amendments to its Listing Requirements in April 2019 to tighten rules and build a stronger regulatory environment. The proposed amendments cover a range of issues including new independence requirements for sponsors,
the extension of the notice period for trading of new stocks, and an expansion in the level of disclosure required to be made by company directors, notably relating to certifications around internal controls over financial reporting.
In a move to improve the Ghanaian investment landscape, the Securities and Exchange Commission (SEC) in Ghana has tightened monitoring over fund management companies, 53 of which recently had their fund management licences revoked, as they failed to comply with the Securities Act and, in some cases, misappropriated investor funds. In October 2019, the SEC announced a six month moratorium on the issuance of new fund manager licences.
As mentioned, Ethiopia is undergoing a series of economic reforms, including the creation of its own local stock exchange and the development of a regulatory framework that will support the private sector in accessing the capital markets. Steps taken include the recent establishment of an Accounting and Auditing Board with the aim of driving local companies to adopt International Financial Reporting Standards (IFRS) to provide consistent reporting for its companies on the global stage.
Finally, the national stock exchange of Seychelles, the MERJ Exchange, made significant strides in the adoption of emerging technologies, with the September 2019 launch of an IPO of its own tokenised equity securities, offering about 16% of its share capital to investors. The IPO will trade using the Ethereum public blockchain and is expected to close in March 2020.
Continued efforts at privatisation of state-owned enterprises (SOEs) through the capital markets Privatisation of state-owned enterprises (SOEs) in Africa has occurred at different stages from as early as the 1970s. According to the World Bank, a slowdown in privatisation across Africa was recorded after the 2008 financial crisis, a trend that is now reversing as governments turn to reducing their ownership stakes in SOEs. They are particularly turning to domestic capital markets to achieve this goal, gaining an alternative source of funding to balance budgets and as a way to deepen the liquidity of and increase investor participation in local markets.
2019 Africa Capital Markets Watch | 8
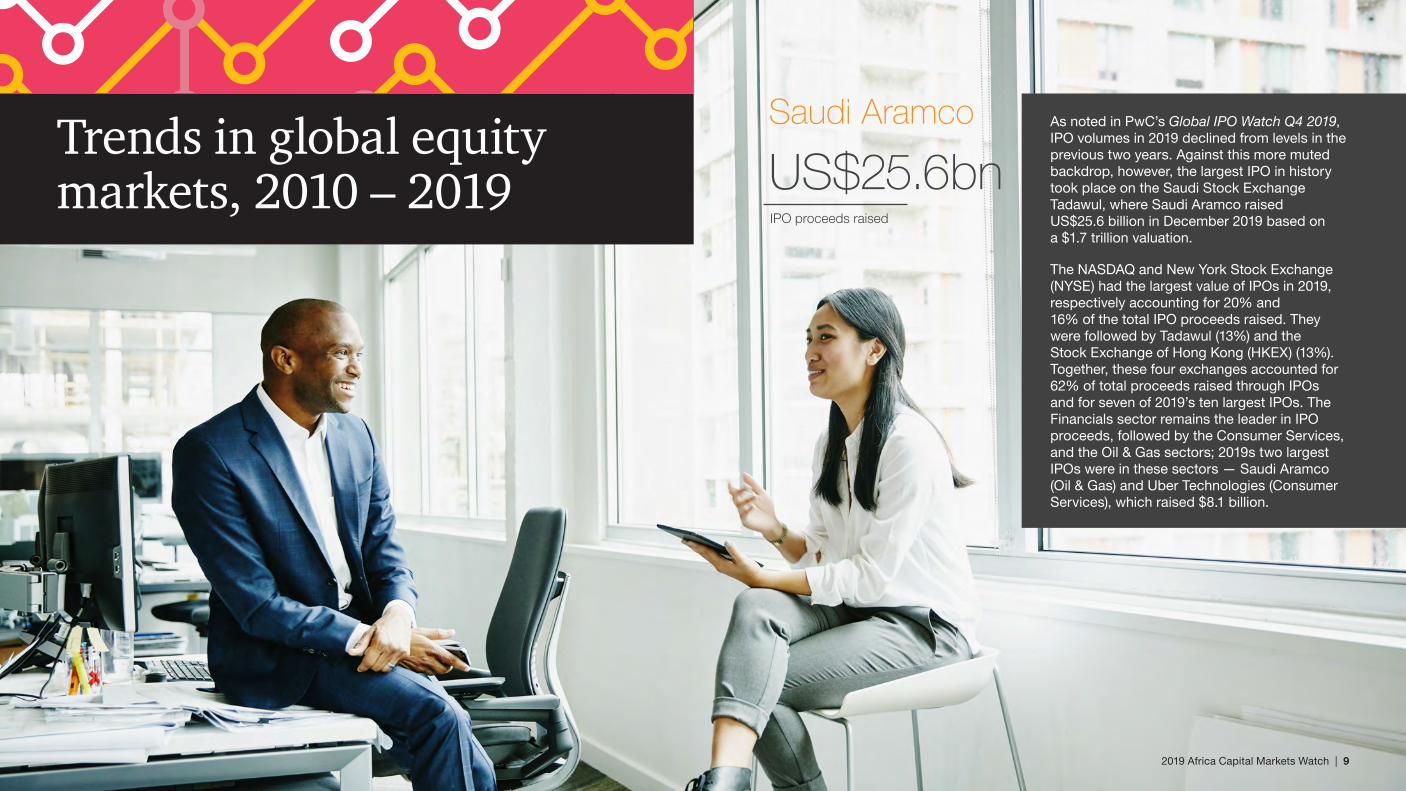
Trends in global equity markets, 2010 – 2019 US$25.6bn
IPO proceeds raised
Saudi Aramco As noted in PwC’s Global IPO Watch Q4 2019, IPO volumes in 2019 declined from levels in the previous two years. Against this more muted backdrop, however, the largest IPO in history took place on the Saudi Stock Exchange Tadawul, where Saudi Aramco raised US$25.6 billion in December 2019 based on a $1.7 trillion valuation.
The NASDAQ and New York Stock Exchange (NYSE) had the largest value of IPOs in 2019, respectively accounting for 20% and 16% of the total IPO proceeds raised. They were followed by Tadawul (13%) and the Stock Exchange of Hong Kong (HKEX) (13%). Together, these four exchanges accounted for 62% of total proceeds raised through IPOs and for seven of 2019’s ten largest IPOs. The Financials sector remains the leader in IPO proceeds, followed by the Consumer Services, and the Oil & Gas sectors; 2019s two largest IPOs were in these sectors — Saudi Aramco (Oil & Gas) and Uber Technologies (Consumer Services), which raised $8.1 billion.
2019 Africa Capital Markets Watch | 9

Figure 1: Global proceeds raised via IPOs and FOs, 2010 – 2019
Source: Dealogic, PwC’s Q4 2019 Global IPO Watch
United States
United States
Hong Kong
United Kingdom
United Kingdom
Australia
Saudi Arabia
Hong Kong
China
China
Other
Other
2010 2011 2012 2014 2015 2016 2017 2018 20192013
$299.1bn
1 258
1 041
728865
1 167 1 185
1 013
1 523
1 1981 040
$178.8bn$142.5bn
$195.6bn$274.3bn
$206.9bn$142.5bn
$209.0bn $223.6bn $199.2bn
2010 2011 2012 2014 2015 2016 2017 2018 20192013
$642.0bn
3 562
2 902
2 508
3 046 3 178 3 323 3 1863 571
2 839 2 783
$479.9bn $509.3bn$588.2bn $613.5bn $685.8bn
$551.1bn $620.8bn$462.6bn $457.8bn
%
IPO proceeds raised and # of deals Top countries, 2019 IPOs
FO proceeds raised and # of dealsTop countries, 2019 FOs
34%
13%
13%
12%
4%
25%
40%
7%7%
6%
6%
37%
2019 Africa Capital Markets Watch | 10

FTSE 100 Hang Seng S&P 500 FTSE/JSE Africa All Share S&P Pan Africa
Global indices 2019Indices in Figure 2 display an overall positive year, with a particularly strong performance by the S&P 500 (up 28.9%) relative to the other indices. The FTSE 100 grew at a relatively stable pace, 12.1% up from 2018. The Hang Seng and the S&P Pan Africa1 appear to have experienced greater volatility compared to their peers across 2019. Among other events, this volatility can likely be attributed to the escalation of the US-China trade war during 2019, and a renewed pessimism about South Africa’s economy. Despite these factors, all indices captured in Figure 2 ended the year positively, including the Hang Seng (up 9.1%), the S&P Pan Africa (up 8.1%), and the FTSE/JSE Africa All-Share Index2 (up 8.2%).
1 The S&P Pan Africa Index is a comprehensive benchmark that includes stocks from 12 emerging and frontier markets in Africa: Botswana, Côte d’Ivoire, Egypt, Ghana, Kenya, Mauritius, Morocco, Namibia, Nigeria, South Africa, Tunisia and Zambia. The index is weighted by float-adjusted market capitalisation and reflects in US dollar values.
2 The FTSE/JSE Africa All-Share Index is a market capitalisation-weighted index calculated in South African rand. Companies included in this index comprise the top 99% of the total pre-free float market capitalisation of all listed companies on the JSE.
Figure 2: Global indices, 2019
Source: Thomson Reuters
Elections held in Nigeria and Senegal.
US president Trump increases tariffs on Chinese goods.
Hang Seng falls by 9.4% in May.
Surprise escalation in the US-China trade war leads to a sharp decline in global indices.
S&P revises South Africa’s outlook from stable to negative due to low GDP growth, fiscal deficits, and growing debt levels. Announcement of
‘phase one’ deal between US and China to resolve trade issues.
Drone strike on Saudi oilfields, impacting oil prices, African currencies, and brief investor risk appetite.
90
100
110
120
130
Jan 19 Feb 19 Mar 19 Apr 19 May 19 Jun 19 Jul 19 Aug 19 Sep 19 Oct 19 Nov 19 Dec 19
2019 Africa Capital Markets Watch | 11

African equity markets
There were also other landmark capital market transactions across African exchanges in 2019 that did not involve a capital raise, including the direct listing of Multichoice Group Limited on the JSE following the unbundling by Naspers Limited, the South African-based internet and media group. In listing Multichoice, Naspers distributed nearly 439 million shares to its shareholders, the value of which was estimated at $3.0 billion, making Multichoice one of the JSE’s top 40 listed companies on its debut.
Similarly, the shares of Nigeria’s telecommunications giant, MTN Nigeria, were admitted for trading on the NSE in May 2019 with a valuation of $5.0 billion, making it the NSE’s second largest company by market capitalisation. As no new funds were raised by these companies, this data is not captured as part of ECM activity in this report.
In total, there were nine IPOs across Africa in 2019, with total proceeds of $1.2 billion. This represents a decline of 44% and 47% in value and volume, respectively, compared to IPOs recorded in 2018. Similarly, FO activity declined by 44% and 25% in value and volume respectively; $3.5 billion was raised from 59 FO transactions in 2019 compared to $6.2 billion raised from 79 FO transactions in 2018.
Due to the potential individual significance of transactions to a year’s ECM results, as demonstrated above, we analyse trends both on an annual basis and for the first time, over the past ten years, 2010 to 2019, as an indication of longer-term trends:
• Between 2010 and 2019, there were 927 African ECM transactions, raising a total of $88 billion. The highest volume of transactions was recorded in 2015 and 2017 with 125 deals each, while 2012 recorded the lowest volume of transaction with 65 deals.
• 2017 accounted for the largest ECM transactions in terms of value, with a total of $13.8 billion. The lowest ECM proceeds raised over the past ten years was $4.7 billion in 2019.
African ECM activity continued on a downward trajectory as major economies on the continent are faced with fiscal sustainability challenges due to growing debt levels and slow economic growth. ECM value in 2019 was the lowest seen over the past decade, while the volume of ECM deals was only lower in 2012.
Locally, the slow pace of economic reforms in major African economies such as South Africa with a revised GDP growth rate of 0.8%, according to the IMF, the tight monetary policy maintained in Nigeria, and the banking crisis in Ghana were some of the factors that restricted capital markets activity. Beyond market-specific issues, however, this limited activity mirrors global trends driven by global economic uncertainties, such as the prolonged trade war between the United States and China.
Overall ECM activity in 2019 declined in value and volume by 44% and 29% respectively, compared to 2018. The decline was mainly related to activity in South Africa, where total ECM activity dropped by 69% in terms of value and 46% in terms of volume compared to 2018, and where Africa’s largest bourse saw no capital raised via IPOs in 2019.
Aside from the decreased levels of activity in 2019, there were some events of note in specific markets. IPO activity resumed in Nigeria after four years, with large listings such as Airtel Africa plc’s dual-listing on the NSE and LSE, raising $687 million. The Airtel Africa IPO was the NSEs second dual-listing and the third largest IPO in Africa in the last decade, in terms of proceeds raised.
Mozambique also recorded its first IPO since 2013 with the listing of Hidroeléctrica de Cahora Bassa (HCB), the state-run operator of the largest hydroelectric power plant in Southern Africa. The IPO, which ultimately saw 4% of the company’s shares offered to the Mozambican public and diaspora, is part of the government’s effort to reduce its ownership in HCB. Malawi also welcomed its first IPO in a decade with the listing of Icon Properties plc, a property development and management firm, raising $20 million.
2019 Africa Capital Markets Watch | 12

Figure 3: ECM activity, 2010 – 2019
Valu
e ($
mill
ion)
Volu
me
Value of FOs Value of IPOs # FO transactions# IPO transactions
0
3 000
6 000
9 000
12 000
15 000
2019201820172016201520142013201220112010
7 824
2 5631 101
4 477 5 4555 096
9 475
11 052
7 415
10 709
6 155
3 476
1 2472 2393 083
2 027 1 588401 902 1 7220
20
40
60
80
100
7165
52 50
75
93
73
95
79
59
2317
13
2327
32
2430
17
9
Source: Dealogic
Note: Some adjustments were made to the Dealogic dataset subsequent to the release of our 2018 publication. Data presented in our 2018 report has therefore been adjusted for two additional FOs on the Ghana Stock Exchange; this adjustment had an $80 million impact on 2018’s total FO value. Further marginal changes in deal value were noted for six FOs, with an impact of ($2 million), $3 million and ($1 million) in 2017, 2016 and 2014, respectively.
2019 Africa Capital Markets Watch | 13

Figure 4: IPO activity, 2010 – 2019
Valu
e ($
mill
ion)
Volu
me
Value # Volume
0
500
1 000
1 500
2 000
2 500
3 000
3 500
20192018201720162015201420132012201120100
5
10
15
20
25
30
35
23
17
13
23
27
32
24
30
17
9
2 563
1 101
401902
1 7222 027
1 588
3 083
2 239
1 247
Source: Dealogic
African IPO trends
Over the past ten years, there have been 215 IPOs by African companies on both African and international exchanges, raising $16.9 billion.
The lowest volume in IPO activity over the past ten years was in 2019, recording a decline of 47% compared to 2018 activity. Over the ten years under review, the highest number of IPOs was recorded in 2015, with 32 IPOs, while the largest IPO proceeds were raised in 2017 at $3.1 billion.
EGX led in IPO volume in 2019 with three IPOs raising $209 million, while the NSE led in terms of proceeds raised, with two IPOs raising $690 million.
As noted previously, there was no capital raised via IPOs on the JSE in 2019. However, South Africa still dominated the top ten IPOs over the ten years under review with seven IPOs, and accounted for the two largest IPOs by value; the $1.2 billion Steinhoff Africa (STAR) IPO in 2017 and the $819 million dual-listing of Vivo Energy in 2018 on the LSE and JSE.
African IPO market
2019 Africa Capital Markets Watch | 14

African IPO data by exchange
Between 2010 and 2019, total IPO proceeds of $15.9 billion were raised on exchanges in Africa in 202 IPOs. Sub-Saharan African exchanges accounted for 133 IPOs (66%), raising $12.3 billion (77%). The remainder was raised on exchanges across North Africa.
Of the amount raised on sub-Saharan African exchanges, the JSE accounted for $8.7 billion (71%), while the NSE accounted for $1.5 billion (13%). The dual listings of Airtel Africa plc in 2019 and Seplat in 2014, both on the LSE and NSE constituted 79% of the total IPO proceeds raised on the NSE in the past decade.
In terms of IPO volume, the JSE and the Botswana Stock Exchange recorded 64 IPOs and 10 IPOs, respectively, while the Ghana Stock Exchange, BRVM, and the Dar es Salaam Stock Exchange each had 9 IPOs.
The Egyptian Exchange (EGX) accounted for the largest proportion (60%) of the IPO proceeds raised on North African exchanges, with $2.2 billion raised from 23 IPOs. This was followed by the Casablanca Stock Exchange (CSE) (23%) with $839 million raised from 13 IPOs and the Bourse de Tunis (17%) with $598 million raised from 30 IPOs.
55%Total IPO proceeds raised over the past decade on African exchanges.
South Africa accounted for
2019 Africa Capital Markets Watch | 15

Figure 5: IPOs by African exchange, 2010 – 20191
2010 2011 2012 2013 2014 2015 2016 2017 2018 2019 Total
Exchange country
Nu
mb
er
of
IPO
s
Cap
ital
ra
ised
($
m)
Nu
mb
er
of
IPO
s
Cap
ital
ra
ised
($
m)
Nu
mb
er
of
IPO
s
Cap
ital
ra
ised
($
m)
Nu
mb
er
of
IPO
s
Cap
ital
ra
ised
($
m)
Nu
mb
er
of
IPO
s
Cap
ital
ra
ised
($
m)
Nu
mb
er
of
IPO
s
Cap
ital
ra
ised
($
m)
Nu
mb
er
of
IPO
s
Cap
ital
ra
ised
($
m)
Nu
mb
er
of
IPO
s
Cap
ital
ra
ised
($
m)
Nu
mb
er
of
IPO
s
Cap
ital
ra
ised
($
m)
Nu
mb
er
of
IPO
s
Cap
ital
ra
ised
($
m)
Nu
mb
er
of
IPO
s
Cap
ital
ra
ised
($
m)
Sub-Saharan excluding South Africa
Nigeria 1 90 0 0 0 0 1 190 2 548 1 23 0 0 0 0 0 0 2 690 7 1 541
BRVM2 0 0 0 0 0 0 0 0 2 18 1 14 3 126 2 143 1 99 0 0 9 400
Ghana 0 0 0 0 0 0 0 0 1 2 4 5 2 102 0 0 2 240 0 0 9 349
Mauritius 0 0 1 10 0 0 0 0 1 29 0 0 1 95 3 167 0 0 0 0 6 301
Botswana 2 45 2 68 1 47 0 0 0 0 1 9 1 42 2 45 1 28 0 0 10 284
Tanzania 0 0 1 7 0 0 1 3 2 6 1 15 3 7 1 212 0 0 0 0 9 250
Kenya 0 0 2 76 2 75 0 0 1 7 1 35 0 0 0 0 0 0 0 0 6 193
Rwanda 0 0 2 91 0 0 0 0 0 0 1 39 0 0 1 11 0 0 0 0 4 141
Uganda 1 3 0 0 1 66 0 0 0 0 0 0 0 0 0 0 1 45 0 0 3 114
Namibia 0 0 0 0 0 0 0 0 0 0 0 0 0 0 2 21 0 0 1 49 3 70
BVMAC3 0 0 0 0 0 0 1 66 0 0 0 0 0 0 0 0 0 0 0 0 1 66
Mozambique 0 0 0 0 0 0 1 11 0 0 0 0 0 0 0 0 0 0 1 53 2 64
Malawi 0 0 0 0 0 0 0 0 0 0 0 0 0 0 0 0 0 0 1 20 1 20
Zambia 0 0 0 0 0 0 0 0 1 9 0 0 0 0 0 0 0 0 0 0 1 9
Zimbabwe 0 0 0 0 0 0 0 0 0 0 0 0 1 1 0 0 0 0 0 0 1 1
South Africa 7 1 504 5 790 5 258 4 261 9 742 12 658 7 823 12 2 289 3 1 383 0 0 64 8 708
Johannesburg 6 1 503 5 790 3 247 4 261 8 734 9 640 4 706 9 2 276 3 1 383 0 0 51 8 540
Johannesburg AltX 1 1 0 0 2 11 0 0 1 8 3 18 3 117 3 13 0 0 0 0 13 168
North Africa
Egypt 3 380 0 0 0 0 0 0 1 109 4 752 4 214 4 179 4 315 3 209 23 2 158
Morocco 2 167 3 50 1 3 1 122 1 127 2 91 1 195 0 0 2 84 0 0 13 839
Tunisia 3 182 1 9 2 8 12 191 6 125 2 43 1 21 2 11 1 8 0 0 30 598
Algeria 1 20 0 0 0 0 1 11 0 0 0 0 1 58 0 0 1 1 0 0 4 90
1 Data includes IPOs listed on African exchanges and therefore excludes purely outbound IPOs. Companies listed on two exchanges or more are accounted for on each exchange.2 The BRVM serves Benin, Burkina Faso, Guinea-Bissau, Côte d’Ivoire, Mali, Niger, Senegal and Togo3 The BVMAC serves the Central African Republic, Chad, Congo, Equatorial Guinea and Gabon.
Source: Dealogic
2019 Africa Capital Markets Watch | 16

Figure 6: Top five African IPOs by value, 2010 – 2019
Name Money raised
$m
Year of
IPOSector
Country of
operationStock Exchange
Steinhoff Africa Retail Ltd 1 247 2017 Consumer Services South Africa Johannesburg Stock Exchange
Vivo Energy plc 819 2018 Consumer Services United Kingdom
Johannesburg Stock Exchange London Stock Exchange
Airtel Africa plc 687 2019 Telecommunications United Kingdom
London Stock Exchange Nigerian Stock Exchange
Life Healthcare Group Holdings Ltd 681 2010 Healthcare South
Africa Johannesburg Stock Exchange
SEPLAT Petroleum Development Co Ltd 538 2014 Oil & Gas Nigeria London Stock Exchange
Nigerian Stock Exchange
Source: Dealogic
2019 Africa Capital Markets Watch | 17

Figure 7: Top five African IPOs by value, 2019
Name Money raised ($m) Sector Country of
operation Stock Exchange
Airtel Africa plc 687 Telecommunications United Kingdom
London Stock Exchange Nigerian Stock Exchange
Jumia Technologies AG 225 Consumer Services Nigeria New York Stock Exchange
Tenth of Ramadan for Pharmaceutical Industries and Diagnostic Reagents (Rameda) S.A.E.
109 Health Care Egypt Egyptian Exchange
Fawry for Banks Technology & Electronic Payments S.A.E. 99 Technology Egypt Egyptian Exchange
Hidroeléctrica de Cahora Bassa 53 Utilities Mozambique Mozambique Stock Exchange
Source: Dealogic
Top five African IPOs by value, 2019
Egypt led the top five IPOs in terms of volume this year, with two IPOs recorded on the EGX by Fawry for Banks Technology & Electronic Payments S.A.E. and Tenth of Ramadan Company for Pharmaceuticals Industries and Diagnostic Reagents (Rameda) S.A.E.
In terms of the share price performance of the top five IPOs in 2019, Hidroeléctrica de Cahora Bassa recorded the highest positive performance, with its share price trading at 55% higher on 31 December 2019. Fawry for Banks Technology & Electronic Payments S.A.E. also showed positive returns, with its share price up 24% at year end. Airtel Africa plc and Tenth of Ramadan Company for Pharmaceuticals Industries and Diagnostic Reagents (Rameda) S.A.E. prices remained in a close range to their listing prices, with +5% and -1% movements, respectively, while Jumia Technologies AG was the worst performer of this cohort, posting negative performance of 54% after challenging earnings releases and concerns around governance at the company.
Egypt dominated the top 5 IPOs in terms of volume
2019 Africa Capital Markets Watch | 18

Figure 8: Share price performance of 2019 top five African IPOs at 31 December 2019
-60 -50 -40 -30 -20 -10
0 10
20 30 40 50 60
Jumia Technologies AG
Tenth of Ramadan for Pharmaceutical
Industries and Diagnostic Reagents
(Rameda) S.A.E.
Airtel Africa plc
Fawry for Banks Technology & Electronic
Payments S.A.E.
Hidroeléctrica de Cahora Bassa
Change % in offer price currency Change % in USD equivalent
24%
21%
5%
55%
53%
0%
-1%
-1%
-54%
-54%
Source: Thomson Reuters
2019 Africa Capital Markets Watch | 19

Figure 9: IPOs value and volume by sector, 2019
IPO volumeby sector
Telecommunications
Consumerservices
Healthcare
Technology
Financials
Utilities
55%
23%
22%
22%
11% 11%
18%
9%
8%
4%
6%
IPO value by sector
11%
Source: Dealogic
African IPOs breakdown by sector in 2019
IPO volume in 2019 was fairly distributed across various sectors, while IPO value was dominated by the Telecommunications sector, largely driven by the IPO of Airtel Africa plc.
2019 Africa Capital Markets Watch | 20

African FO trends
Similar to IPO activity, 2019 FO activity declined significantly in terms of transaction volume and value, by 25% and 44% respectively over the prior year. Low levels of activity in South Africa mainly drove the decline, with the volume of FOs on the JSE decreasing by 42% from 38 deals recorded in 2018 to 22 deals in 2019, and the value decreasing by 58% from $3.8 billion in 2018 to $1.6 billion in 2019.
While corporate South Africa seems to have taken a collective pause in its public fundraising, implementation of privatisation initiatives continued to play an important role in driving FO activity elsewhere on the continent in 2019. The Moroccan government was again active in this space, this year selling down its 30% stake in Maroc Telecommunications; in June 2019, it offered a collective 8% to institutional and domestic investors, raising a total sum of $923.9 million in two FO deals on the CSE.
Other FO activity during the year followed trends seen in previous years, with various companies seeking to raise funds to restructure their debt. Steinhoff International sold its remaining 26% stake in KAP Industries Holdings on the JSE, raising $327.1 million, as part of efforts to reposition the company following the 2017 accounting scandal, which saw Steinhoff International’s market value decline by over 90%.
Lafarge Africa, the Nigerian-based cement manufacturer, also accessed the market in March 2019 raising $248.0 million on the NSE, used to reduce its foreign currency loan exposure. Omnia Holdings, a South African-based diversified chemical company, also raised $132.9 million through a fully underwritten rights offer on the JSE, used in part to refinance debt incurred during the implementation of its strategic growth initiatives over the past three years.
Over the past ten years, a total of 712 FO deals were recorded on African exchanges and by African companies on international exchanges with a total of $71.1 billion raised. The $2.9 billion Barclays Africa Group FO deal in 2017 was the largest FO deal recorded over the period, followed by Naspers Limited’s $2.5 billion FO in 2015.
African FO market
2019 Africa Capital Markets Watch | 21

Figure 10: FO activity, 2010 – 2019
Valu
e ($
mill
ion)
Volu
me
Value # Volume
0
2 000
4 000
6 000
8 000
10 000
12 000
2019201820172016201520142013201220112010
7 824
4 477 5 4555 096
9 475
11 052
7 415
10 709
6 155
3 476
0
20
40
60
80
100
7165
52 50
75
93
73
95
79
59
Source: Dealogic
African FO data by exchange
The lowest FO proceeds raised on African exchanges in the past decade was in 2019 with $3.5 billion raised from 59 FO deals. Sub-Saharan African exchanges accounted for 53% and 59% of FO volume and value in 2019, respectively, with South Africa constituting 71% and 79% of FO deals and proceeds recorded on sub-Saharan African exchanges, respectively.
In terms of volume, the EGX topped in terms of FO activity among North African exchanges in 2019, accounting for 50% of deals recorded, while the Bourse de Tunis and the CSE constituted 22% and 28%, respectively. The CSE led the region in terms of FO value with 78% of the proceeds raised, while the EGX and Bourse de Tunis each accounted for 12% and 10%, respectively.
Overall, South Africa accounted for 45% of FO deals and 46% of FO proceeds raised on African exchanges in 2019. In terms of FO proceeds, the CSE came second with 32%, followed by the NSE with 8%. In terms of FO volume, Egypt accounted for 18% of deals recorded while the NSE and the CSE constituted 10% each.
Over the past ten years, a significant proportion of FO activity took place in South Africa, with the JSE accounting for 58% and 79% of total FO volume and value, respectively. Egypt accounted for the next-largest amount of FO volume and value at 10% and 6%, respectively, followed by Nigeria with 4% of both FO volume and value.
2019 Africa Capital Markets Watch | 22

Figure 11: FOs by African exchange, 2010 – 20191
2010 2011 2012 2013 2014 2015 2016 2017 2018 2019 Total
Exchange country
Nu
mb
er
of
FOs
Cap
ital
ra
ised
($m
)
Nu
mb
er
of
FOs
Cap
ital
ra
ised
($m
)
Nu
mb
er
of
FOs
Cap
ital
ra
ised
($m
)
Nu
mb
er
of
FOs
Cap
ital
ra
ised
($m
)
Nu
mb
er
of
FOs
Cap
ital
ra
ised
($m
)
Nu
mb
er
of
FOs
Cap
ital
ra
ised
($m
)
Nu
mb
er o
f FO
s
Cap
ital
ra
ised
($m
)
Nu
mb
er
of
FOs
Cap
ital
ra
ised
($m
)
Nu
mb
er
of
FOs
Cap
ital
ra
ised
($m
)
Nu
mb
er
of
FOs
Cap
ital
ra
ised
($m
)
Nu
mb
er
of
FOs
Cap
ital
ra
ised
($m
)
Sub-Saharan excluding South Africa
Nigeria 3 284 0 0 2 224 2 424 2 359 4 512 0 0 6 418 5 525 5 269 29 3 015
Mauritius 0 0 3 14 1 13 0 0 1 7 3 87 3 442 5 636 0 0 1 78 17 1 277
Kenya 3 202 1 117 3 239 0 0 2 46 0 0 3 272 0 0 1 68 0 0 13 944
Ghana 0 0 2 115 0 0 0 0 0 0 0 0 3 100 0 0 5 195 1 28 11 438
Tanzania 0 0 1 73 0 0 0 0 0 0 1 74 0 0 0 0 0 0 0 0 2 147
Zambia 0 0 2 73 0 0 0 0 1 62 0 0 0 0 0 0 0 0 0 0 3 135
Uganda 0 0 0 0 0 0 0 0 1 98 0 0 1 32 0 0 0 0 0 0 2 130
Mozambique 0 0 0 0 0 0 0 0 0 0 0 0 0 0 0 0 0 0 1 128 1 128
Zimbabwe 2 14 1 10 0 0 0 0 0 0 0 0 0 0 2 76 0 0 1 1 6 101
Rwanda 0 0 0 0 0 0 0 0 0 0 0 0 0 0 0 0 1 68 0 0 1 68
Malawi 0 0 0 0 0 0 0 0 0 0 0 0 1 10 1 16 0 0 1 12 3 38
BRVM 0 0 0 0 0 0 0 0 0 0 0 0 1 16 0 0 0 0 0 0 1 16
Namibia 0 0 0 0 0 0 0 0 0 0 0 0 0 0 0 0 1 8 0 0 1 8
South Africa 35 5 310 30 2 992 37 4 828 35 4 458 52 8 155 71 9 749 46 6 214 47 9 108 38 3 806 22 1 602 413 56 222
Johannesburg 35 5 310 30 2 992 34 4 800 34 4 458 48 8 085 66 9 602 43 5 906 42 8 676 35 3 762 20 1 513 387 55 104
Johannesburg AltX 0 0 0 0 3 28 1 <1 4 70 5 147 3 308 5 432 3 44 2 89 26 1 118
North Africa
Egypt 10 1 595 7 346 1 3 1 88 1 522 3 199 6 73 14 276 18 1 320 9 172 70 4 594
Morocco 1 345 4 555 0 0 1 47 1 71 2 196 0 0 2 145 0 0 5 1 100 16 2 459
Tunisia 0 0 1 1 0 0 3 60 1 12 2 391 2 12 6 24 1 42 4 144 20 686
1 – Data includes FOs listed on African exchanges and excludes purely outbound FOs. Companies listed on two exchanges or more are accounted for on each exchange.
Source: Dealogic
2019 Africa Capital Markets Watch | 23

Figure 12: Top five African FOs by value, 2010 – 2019
NameMoney raised
($m)
Year of FO Sector Country of
operation Stock Exchange
Barclays Africa Group Ltd 2 885 2017 Financials South Africa Johannesburg Stock Exchange
Naspers Ltd 2 492 2015 Consumer Services South Africa Johannesburg Stock Exchange
Anglo Platinum Ltd 1 683 2010 Basic Materials South Africa Johannesburg Stock Exchange
Vodacom Group Ltd 1 148 2017 Telecommunications South Africa Johannesburg Stock Exchange
Sibanye-Stillwater Ltd 1 042 2017 Basic Materials South Africa Johannesburg Stock Exchange
Maroc Telcom 694 2019 Telecommunications Morocco Casablanca Stock Exchange
Source: Dealogic
Note: As the top five FOs by proceeds during the period 2010–2019 do not include any current year activity, the largest 2019 FO has been included in this table as a point of reference.
2019 Africa Capital Markets Watch | 24

Top five African FOs by value, 2019
The Moroccan government’s divestment of an 8% stake in Maroc Telecoms on the CSE accounted for the largest FO value in 2019 with proceeds of $923.9 million raised.
Figure 13: Top five African FOs by proceeds, 2019
NameMoney raised
($m)Sector Country of
operation Stock Exchange
Maroc Telecom 694 Telecommunications Morocco Casablanca Stock Exchange
KAP Industrial Holdings Ltd 327 Industrials South Africa Johannesburg Stock Exchange
Lafarge Africa plc 248 Basic Materials Nigeria Nigerian Stock Exchange
Maroc Telecom 230 Telecommunications Morocco Casablanca Stock Exchange
Omnia Holdings Ltd 133 Financials South Africa Johannesburg Stock Exchange
Source: Dealogic
African FOs by sector in 2019
The Financials sector constituted a significant proportion of FO activity in 2019, accounting for 30% of FO proceeds. This was followed by the Telecommunications sector with 27% of FO value, driven mainly by the Maroc Telecom FOs on the CSE. Other transactions in the Financials sector in North Africa included the Banque Nationale Agricole SA FO of $118.3 million in Tunisia, and the BMCE Bank FO of $103.9 million. The Morocco-based bank tapped markets this year in August to finance its medium-term strategic growth plan and to strengthen its balance sheet, having earlier in the year attracted a $200 million investment from the UK’s development finance institution, CDC, as part of its fundraising efforts.
Meanwhile, despite South Africa’s weak economic outlook, its property funds remained active in 2019, with a greater focus on acquisitions and expansion into other markets. Echo Polska Property N.V. (EPP NV), a REIT based in Poland and listed on both the JSE and Luxembourg Stock Exchange, raised $100.9 million on the JSE in an over-subscribed equity offering to fund the acquisition of properties in Europe.
Similarly, Vukile Property Fund, a South African-based REIT, raised $49.5 million on the JSE in April 2019 to fund its real estate investment acquisitions in Spain. Equites Property Fund, a real estate company with significant property investments in South Africa and the UK, completed two FOs on the JSE in 2019, raising an aggregate $104.1 million to restructure its balance sheet and fund various logistics property development projects.
The Industrials and Basic Materials sectors accounted for 13% and 14% of FO values in 2019, respectively with the Lafarge Africa, KAP Industrial Holdings and Omnia Holdings’ FO deals accounting for a significant proportion of proceeds raised within these sectors.
2019 Africa Capital Markets Watch | 25

Figure 14: FOs value and volume by sector, 2019
Source: Dealogic
IPO volumeby sector
Financials
Telecommunications
Basic Materials
Industrials
Healthcare
Consumer Goods
29%
44%
3%
9%
8%
5% 2%
14%
13%
9%
<1%
1%
27%
7%
IPO value by sector
19%
10%
Consumer Services
Oil & Gas
2019 Africa Capital Markets Watch | 26

African IPOs and FOs: Inbound, outbound, domestic and cross-border activity, 2010 – 2019
We continue to analyse ECM activity in four categories:
African IPOs and FOs
Domestic: African entities listing on their local exchange exclusively (dual listings involving a local and foreign exchange are classified as outbound and cross-border transactions as defined hereunder).
Cross-border: African companies listing on any African exchange, which may also include a dual listing on their domestic exchange.
Outbound: African companies listing on an exchange outside of Africa.
Inbound: Non-African entities listing on an African exchange.
African ECM activity in 2019, similar to prior years, was led by domestic deals, comprising 71% of both ECM volume and value. Over the past decade, domestic activity accounted for 72% and 78% of ECM volume and value, respectively.
Two cross-border ECM deals took place in 2019, the $4.1 million rights offer by Mauritius-based investment holding company, Brainworks Limited, and the $80 million rights offer by Lighthouse Capital Ltd, both on the JSE.
2019 Africa Capital Markets Watch | 27

Figure 15: Volume and value of cross-border, domestic, outbound and inbound IPOs and FOs, 2010 – 2019
Source: Dealogic
EC
M v
olum
e
Cross-border Domestic Inbound Outbound
0
30
60
90
120
150
2019201820172016201520142013201220112010
3
60
5
26
60
6
16
3
41
9
12
1
52
1010
1
72
12
17
6
93
12
14
6
68
13
10
7
94
10
14
1
78
611
2
48
711
0
EC
M v
alue
($m
)
Cross-border Domestic Inbound Outbound
0
3 000
6 000
9 000
12 000
15 000
2019201820172016201520142013201220112010
264 0
7 890
814
1 419
4 875
345
358
88
3 772
1 779
216
344
4 246
996
411
7
8 293
1 894
1 003
606
10 527
1 163782
538
6 913
866685
590
11 818
1 306
78
68
6 832
1 269
225
82
3 347
1 048
245
Over the ten years under review, there were 30 cross-border ECM transactions raising a total of $2.6 billion. This cross-border activity within Africa remains persistently low, constituting just 3% of African ECM activity within this period.
Outbound ECM saw a marginal increase in value of transactions between 2018 and 2019, with 11 transactions raising $225.4 million in 2018 versus 11 transactions valued at $244.9 in 2019. The second-largest IPO recorded in the year, Jumia Technologies’ $225.1 million IPO on the NYSE, was an outbound transaction and constituted 92% of total outbound activity. Of the 11 outbound transactions recorded in 2019, eight took place in London—either on the LSE’s AIM or on NEX—two on the Australian Securities Exchange, and one on the NYSE. There were 141 outbound ECM transactions over the past decade, with London the preferred destination for African issuers; 101 or 72% of outbound ECM transactions involved listings on the LSE, raising $3.2 billion.
Inbound ECM activity included the largest IPO recorded in 2019, the dual listing of Airtel Africa. The JSE dominated in terms of inbound volume, accounting for six of the seven inbound transactions recorded in 2019, with ECM funding raised largely by global companies with either South African operations or historical ties. Of the 90 inbound transactions over the past ten years, which raised total proceeds of $11.5 billion, the JSE accounted for 80% of volume and 89% of value.
2019 Africa Capital Markets Watch | 28

Figure 16: Top five cross-border, outbound and inbound IPOs and FOs, 2010 – 2019
IPOs
Cross-border within Africa
2010
2011
2012
2013
2014
2015
2016
2017
2018
2019 Issuer’s name Country Sector Stock exchange Money raised
($m)
African Export-Import Bank Egypt Financials Stock Exchange of Mauritius 166
Universal Partners Ltd Mauritius Financials JSE Alternative Exchange, Stock Exchange of Mauritius 95
Ennakl Tunisia Consumer Goods Casablanca Stock Exchange, Tunis Stock Exchange 87
Umeme Ltd Uganda Utilities Nairobi Securities Exchange, Uganda Securities Exchange 66
Wilderness Holdings Ltd Botswana Consumer Services Botswana Stock Exchange, Johannesburg Stock Exchange 37
Four out of the top five cross-border IPOs, with total value of $284 million, relate to dual listings on two African exchanges
Outbound
2010
2011
2012
2013
2014
2015
2016
2017
2018
2019 Issuer’s name Country Sector Stock exchange Money raised
($m)
SEPLAT Petroleum Development Co Ltd Nigeria Oil & Gas London Stock Exchange, Nigerian Stock Exchange 538
Integrated Diagnostics Holdings plc Egypt Health Care London Stock Exchange 334
Edita Food Industries SAE Egypt Consumer Goods Egyptian Exchange, London Stock Exchange 267
Jumia Technologies AG Nigeria Consumer Services New York Stock Exchange 225
Zanaga Iron Ore Co Ltd DR Congo Basic Materials London Stock Exchange (AIM) 99
Inbound
2010
2011
2012
2013
2014
2015
2016
2017
2018
2019 Issuer’s name Country Sector Stock exchange Money raised
($m)
Vivo Energy plc United Kingdom Oil & Gas Johannesburg Stock Exchange, London Stock Exchange 819
Airtel Africa plc United Kingdom Telecommunications London Stock Exchange, Nigerian Stock Exchange 687
Quilter plc United Kingdom Financials Johannesburg Stock Exchange, London Stock Exchange 323
Orascom Construction Ltd United Arab Emirates Industrials Egyptian Exchange, NASDAQ Dubai 185
Schroder European Real Estate Investment Trust plc United Kingdom Real Estate Johannesburg Stock Exchange, London Stock Exchange 162
2019 Africa Capital Markets Watch | 29

FOs
Cross-border within Africa
2010
2011
2012
2013
2014
2015
2016
2017
2018
2019 Issuer’s name Country Sector Stock exchange Money raised
($m)
Oando plc Nigeria Oil & Gas Johannesburg Stock Exchange, Nigerian Stock Exchange 344
Greenbay Properties Ltd Mauritius Financials JSE Alternative Exchange, Stock Exchange of Mauritius 256
Oando plc Nigeria Oil & Gas Johannesburg Stock Exchange, Nigerian Stock Exchange 243
Rockcastle Global Real Estate Co Ltd Mauritius Financials Johannesburg Stock Exchange 162
Greenbay Properties Ltd Mauritius Financials Johannesburg Stock Exchange, Stock Exchange of Mauritius 161
Outbound
2010
2011
2012
2013
2014
2015
2016
2017
2018
2019 Issuer’s name Country Sector Stock exchange Money raised
($m)
AngloGold Ashanti Ltd South Africa Basic Materials Johannesburg Stock Exchange, New York Stock Exchange 789
Steinhoff International Holdings NV South Africa Consumer Goods Frankfurt Stock Exchange 625
Aquarius Platinum Ltd South Africa Basic Materials Australian Stock Exchange, Johannesburg Stock Exchange, London Stock Exchange 235
Grit Real Estate Income Group Ltd Mauritius Financials London Stock Exchange 132
MiX Telematics Ltd South Africa Industrials New York Stock Exchange 116
Inbound
2010
2011
2012
2013
2014
2015
2016
2017
2018
2019 Issuer’s name Country Sector Stock exchange Money raised
($m)
Intu Properties plc United Kingdom Financials Johannesburg Stock Exchange, London Stock Exchange 846
Lonmin United Kingdom Basic Materials Johannesburg Stock Exchange, London Stock Exchange 845
Intu Properties plc United Kingdom Financials Johannesburg Stock Exchange, London Stock Exchange 424
Lonmin United Kingdom Basic Materials Johannesburg Stock Exchange, London Stock Exchange 407
NEPI Rockcastle plc Romania Financials Johannesburg Stock Exchange 384
Source: Dealogic
2019 Africa Capital Markets Watch | 30

Our analysis of African debt markets focuses on both foreign currency-denominated (also referred to as non-local currency) high-yield and investment grade corporate debt issued internationally, as well as sovereign and supranational issues, which play an increasingly important role in the broader macroeconomic context in African countries.
African issuers have raised $245.9 billion of non-local currency debt from 759 issues over the past ten years, with almost 50% of that value raised in the past three years. This may reflect an increased appetite for African issues in recent years as well as give a sense of the longer-term view on credit risk in the region, though it may be appropriate to temper the excitement for available liquidity with the realities of the impact of countries’ growing debt burdens, and concerns about how the capital raised will be put to use. South Africa’s debt to GDP ratio, for instance, has risen from approximately 35% in 2010 to 60% in 2019, raising concerns by many, including the IMF, as to the sustainability of its rising debt levels.
Egypt was the largest sovereign issuer over the past decade, raising $28.5 billion in non-local currency debt, while the supranational African Development Bank raised almost double that value, or $53.1 billion, during the same period to finance projects across the continent. South Africa’s beleaguered energy utility, Eskom, accounted for the largest cumulative non-local currency debt value raised by a corporate issuer, raising $5.5 billion over the past ten years, the magnitude of which has created its own issues for the entity’s ability to operate and maintain its infrastructure. In terms of geographic breakdown, companies in Nigeria and South Africa, the continent’s two largest economies, accounted for 16% and 52% of the total non-local currency corporate debt issues, respectively, during the last ten years.
African debt markets
2019 Africa Capital Markets Watch | 31

Figure 17: DCM non-local currency activity, 2010 – 2019
Source: Dealogic
Note: Some adjustments were made to the Dealogic dataset subsequent to the release of our 2018 publication. Data presented in our 2018 report has been adjusted for proceeds raised, increasing 2018 supranational proceeds by $600 million.
Volumes included refer to individual issuance tranches.
As with trends over the past decade, Egypt was the largest sovereign issuer of non-local currency debt in 2019, raising a total of $8.2 billion. Despite this sizable issuance, the country’s debt-to-GDP ratio has declined in recent years as part of a three-year IMF-agreed economic reform programme, from its highest level of 103% in 2017, to 90.5% in 2019.
South Africa was the second largest sovereign issuer in 2019, raising $5.0 billion in September in its largest ever eurobond issuance, as the country seeks liquidity to address budget deficits and broad systemic issues stifling economic growth.
Other sovereigns tapped the debt markets in 2019, with Angola and Ghana each raising $3.0 billion and Benin raising $567 million in its inaugural eurobond offer. Both the Angola and Benin issues were more than twice oversubscribed, again reflecting the level of investor appetite for African debt.
Consistent with its objective of mobilising and allocating resources for investment in its regional member countries, the African Development Bank continued to dominate supranational non-local currency debt issues in 2019, accounting for 61% of the $9.4 billion non-local currency supranational issues. Other supranationals, including Africa Finance Corporation, the West African Development Bank (BOAD), Burundi’s Trade and Development Bank and the African Export-Import Bank accounted for the remaining $3.7 billion raised in 2019, the bulk of which was raised in the second half of the year.
The single largest non-local currency corporate debt issuance of 2019 came from IHS Netherlands Holdco BV, part of the IHS Towers group, a telecommunications tower group operating in Nigeria, Côte d’Ivoire, Rwanda, Cameroon, and Zambia, which raised $1.3 billion in two tranches. Other significant 2019 issues include Gold Fields Orogen Holding (BVI) Ltd’s $1.0 billion issue, and $506 million raised by multinational pulp and paper producer, Sappi. Proceeds from both the Gold Fields and Sappi issues were used to refinance existing debt.
Sovereign debt value ($m)
Sovereign transactions#
Corporate debt value ($m)
Corporate transactions#
2010 2011 2012 2014 2015 2016 2017 2018 20192013
7 1532 215
6 00411 727 11 000 9 153
6 209
19 603
26 24225 637
22
24
5
4
8
1514
96
19
Supranational debt value ($m)
Supranational transactions#
2010 2011 2012 2014 2015 2016 2017 2018 201920132 508 3 900 3 120
6 741 4 765 4 440
11 554 11 4378 341 9 409
9897
23
1619
3028
22
50
92
2010 2011 2012 2014 2015 2016 2017 2018 20192013
119
8
19
2321
27
13
8
19
3 435 6 532 6 079 6 869 5 984 5 397 3 687 6 533 5 969 4 283
2019 Africa Capital Markets Watch | 32

Figure 18: Breakdown of non-local currency corporate, sovereign and supranational debt by value, 2019
Sovereign and local authority
Supranational
Corporate
24%
65%
11%
Source: Dealogic
Figure 19: Breakdown of non-local currency corporate, sovereign and supranational debt by value, 2010 – 2019
Sovereign and local authority
Supranational
Corporate
27%
51%
22%
Source: Dealogic
2019 Africa Capital Markets Watch | 33

African non-local currency debt market
Corporate debt highlights 2010 – 2019
Corporate issuers raised $54.8 billion in non-local currency debt in 158 transactions from 2010 to 2019. Of that debt value, 82% was US-dollar denominated and 65% was issued under Rule 144A; for 2019, these metrics were 83% and 77%, respectively.
South African corporate issuers accounted for 52% of non-local currency corporate debt issued between 2010 and 2019. South Africa’s state-owned power utility, Eskom, accounted for the largest cumulative non-local currency debt value raised, with $5.5 billion issued over the past ten years, largely intended to fund the company’s capital expansion programmes, such as the construction of its coal-powered Medupi and Kusile power plants.
The value of Eskom’s issues were followed closely by those of Naspers which, through its subsidiary, Myriad International Holdings BV, raised a total of $3.9 billion in non-local currency debt between 2010 and 2019, to be used for general corporate purposes and the refinancing of a revolving credit facility. Naspers, a multinational internet and media group, has seen significant international growth over the past ten years.
Outside of South Africa, corporate issuers raised 48% of the non-local currency debt value issued between 2010 and 2019. Nigerian issuers accounted for 16% of the total value of corporate non-local currency debt issues from 2010 to 2019. This included a total of $2.1 billion raised by IHS in 2016 and 2019, Zenith Bank’s issues totalling $994.7 million, and Guaranty Trust Bank’s issues totalling $892.8 million.
Financial services firm Bayport raised $799.4 million in non-local currency debt over the past decade, including its 2019 $260 million social bond, aimed at promoting development of small- and medium-sized enterprises, which became the first US-dollar denominated social bond issued by an African corporate issuer.
2019 Africa Capital Markets Watch | 34

African non-local currency debt by industry, 2019
The Basic Materials sector accounted for 35% of non-local currency corporate debt value issued in 2019, the largest proportion by value across all sectors. This was driven by Gold Fields’s $1.0 billion issue in March 2019, and Sappi’s May 2019 $506 million issue.
The Telecommunications sector accounted for the next largest proportion, at 30% of non-local currency corporate debt value issued in 2019, primarily driven by IHS’ $1.3 billion issuance. This is in contrast to 2018, when there were no issuances in the sector.
In the Financials sector, which accounted for the third largest proportion, at 29.7%, the majority was issued by Togo-based Ecobank and South Africa’s Standard Bank, which issued a total of $498.1 million and $400.0 million of non-local currency corporate debt respectively. Ecobank’s issuance was 4.6 times oversubscribed, pointing not only to strong demand, but also to confidence in the regions across Africa in which the bank operates.
2019 Africa Capital Markets Watch | 35
AIM London Alternative Investment MarketAltX JSE Alternative ExchangeBRVM Bourse Régionale des Valeurs MobilièresBVMAC Bourse des Valeurs Mobilières de I’Afrique CentraleCSE Casablanca Stock ExchangeDCM Debt capital marketsECM Equity capital marketsEGX Egyptian ExchangeFO Further offerHKEX Stock Exchange of Hong KongIMF International Monetary FundIPO Initial public offeringJSE Johannesburg Stock ExchangeLSE London Stock ExchangeNSE Nigerian Stock ExchangeNYSE New York Stock ExchangePE Private equityREIT Real estate investment trustSEC Securities and Exchange CommissionSSA Sub-Saharan Africa
Glossary
2019 Africa Capital Markets Watch | 36

For a deeper discussion about our capital market offerings in Africa, please contact one of our practice leaders.
East Africa
Anthony [email protected] +254 20 285 5347
Francophone sub-Saharan Africa
Douty [email protected] +225 20 31 54 00
Geoffroy [email protected] +237 2 33 43 24 43
Egypt
Muhammad [email protected] +971 4 304 3443
Francophone North Africa
Mehdi [email protected] +212 522 999 830
Ahmed [email protected] +216 71 160 056
West Africa
Omobolanle [email protected] +234 1 271 1700 ext 39024
Alice [email protected] +234 1 271 1700 ext 39051
Southern Africa
Andrew Del [email protected] +27 11 287 0827
Peter [email protected] +27 11 797 5275
Global IPO Centre
Ross [email protected] +44 7802 918 885
Contacts
2019 Africa Capital Markets Watch | 37

The information contained in this publication by PwC is provided for discussion purposes only and is intended to provide the reader or their entity with general information of interest. The information is supplied on an ‘as is’ basis and has not been compiled to meet the reader’s or their entity’s individual requirements. It is the reader’s responsibility to satisfy themselves that the content meets the individual’s or their entity’s requirements. The information should not be regarded as professional or legal advice or the official opinion of PwC. No action should be taken on the strength of the information without obtaining professional advice. Although PwC takes all reasonable steps to ensure the quality and accuracy of the information, accuracy is not guaranteed. PwC shall not be liable for any damage, loss or liability of any nature incurred directly or indirectly by whomever and resulting from any cause in connection with the information contained herein.
© 2020 PricewaterhouseCoopers (PwC), the South African firm. All rights reserved. In this document, ‘PwC’ refers to PricewaterhouseCoopers in South Africa, which is a member firm of PricewaterhouseCoopers International Limited (PwCIL), each member firm of which is a separate legal entity and does not act as an agent of PwCIL. Please see www.pwc.co.za for further details.
(20-25169)
We extend our thanks to everyone who contributed to PwC’s Capital Markets Practice Africa Capital Markets Watch 2019.
This is the fifth year in the life of the Africa Capital Markets Watch series, and our sixth look at equity capital markets in Africa. In particular, we would like to thank Adebayo Araoye, Alberto Cuomo, Alice Tomdio, Anthony Bolger, Byron Paschke, Nosakhare Agbonlahor and Wayne Moodaley for their important contributions.
Acknowledgments