capital one southcoast energy conference...
TRANSCRIPT

Capital One SouthcoastEnergy Conference 2006
December 4, 2006

1
Forward-looking Statements
This presentation will contain "forward-looking statements" within the meaning of Section 27A of the Securities Act of 1933, as amended, and Section 21E of the Securities Exchange Act of 1934, as amended. These statements, which include any statement that does not relate strictly to historical facts, use terms such as “anticipate,” “assume,” “believe,” “estimate,” “expect,” “forecast,” “intend,”“plan,” “position,” “predict,” “project,” or “strategy” or the negative connotation or other variations of such terms or other similar terminology. In particular, statements, express or implied, regarding future results of operations or ability to generate revenues, income or cash flow or to make acquisitions are forward-looking statements. These forward-looking statements are based on management’s current plans, expectations, estimates, assumptions and beliefs concerning future events impacting Hercules Offshore, Inc. (“Hercules”) and therefore involve a number of risks and uncertainties, many of which are beyond management’s control. These risks and uncertainties are further described in Hercules’ annual report on Form 10-K and its most recent periodic reports and other documents filed with the Securities and Exchange Commission which are available free of charge at the SEC’s website at www.sec.gov or the company’s website at www.herculesoffshore.com.
The forward-looking statements involve risks and uncertainties that affect Hercules’ operations and financial performance. All forward-looking statements attributable to Hercules’ representatives are expressly qualified in their entirety by this cautionary statement.

2
Management Representatives
Participants
• Randall Stilley Chief Executive Officer and President
• Steven Manz Chief Financial Officer
• John Rynd President, Hercules Drilling Company
• Stephen Butz Vice President and Treasurer

Company Overview

4
Hercules Offshore Overview
• Unique business mix within the oil services industry – Industry leading liftboat business – currently 64 liftboats, including 47 in the U.S.
Gulf of Mexico (“GOM”) and 17 in West Africa– Expanding contract drilling business - nine jackup rigs, six operating in the GOM
and three focused internationally• Market capitalization of approximately $1 billion
Note: See Explanatory Information slide. Division Adjusted EBITDA does not include corporate G&A and other income/expenses.
Quarterly Revenue Quarterly Adjusted EBITDA($ in millions)
$7.7 $9.2 $10.8 $13.9$24.0 $29.1 $33.7 $42.9
$15.6$24.9 $26.3 $28.2
$24.0$27.0
$42.6
$54.3
Liftboats Drilling
4Q 04 1Q 05 2Q 05 3Q 05 4Q 05 1Q 06 2Q 06 3Q 06$3.0 $4.2 $4.6 $5.8
$11.7 $16.8 $20.7$26.7
$6.1$12.5 $12.6 $13.8
$11.3$14.1
$26.8
$33.7
Liftboats Drilling
4Q 04 1Q 05 2Q 05 3Q 05 4Q 05 1Q 06 2Q 06 3Q 06
($ in millions)

5
Investment Highlights
• Consolidator of shallow water assets through prudent acquisitionstrategy
• Conservative capital structure and strong liquidity provide foundation for further growth
• Proven track record of maximizing return on capital and profitability
• Strong industry fundamentals
• Experienced management team

6
• Completed 12 asset acquisitions in last two years
• Opportunistic acquisition strategy– Non-core assets from larger organizations– Consolidate fragmented market segments
• Focus on return on capital employed
Successful Acquisition Execution Track Record
February2006
Acquired Rig 26 from Aries Offshore
Partners Ltd.
November 2005
Acquired seven liftboats from
Danos & Curole
September2005
Acquired Rig 31 from Hydrocarbon
Capital II LLC
(1) Received insurance proceeds of $48.8 million as the rig was severely damaged in Hurricane Katrina. The rig has since been retired.(2) Includes one shallow water liftboat which was subsequently sold and one that was retired.
June2006
Acquired six liftboats from
Laborde Marine Lifts
November2006
Acquired eight liftboats and
assumed rights to operate five
additional liftboats from Halliburton
August2004
Acquired five jackup rigs from Parker Drilling
January2005
Acquired Rig 25 (1)
from Parker Drilling and Rig 30 from
Porterhouse Offshore, L.P.
August2005
Acquired the Whale Sharkliftboat from CS Liftboats
June2005
Acquired Rig 16 from Transoceanand 17 liftboats from Superior
Energy(2)
October2004
Acquired 22 liftboats from
Global Industries

7
Halliburton Liftboat Acquisition
• On November 7, 2006 Hercules acquired Halliburton’s West African liftboat fleet for $50 million, plus amounts payable under an earn-out agreement(1)
• The fleet consists of eight wholly-owned liftboats and rights to operate five non-owned liftboats subject to bareboat charters
(1) The Company agrees to make additional payments over a three-year period up to an aggregate amount of $10 million, based on achieving certain financial targets.
Fleet Summary
Vessel ClassLowell Granstaff 215Malcolm Kinnaird 150F.J. Leleux* 150James Choat* 120Durwood Speed* 120Charlie Cobb* 120Zoal Albrecht* 120Leon Grigsby 120Glenn Craig 120A.B. Crutchfield 105C.C. Whittington 105Jack Huffman 105Mene-Afejuku (A. Brady) 105
* Owned by Meridien Maritime and Offshore Services Limited and previously operated by Halliburton.
Lowell GranstaffClass 215 Liftboat
• The liftboats range from 105’ to 215’ class size and are currently operating in the coastal waters of Nigeria and Cameroon
• The fleet adds significant economies of scale to Hercules operations, making it the largest and most diversified fleet in West Africa

8
Additional Opportunities for Consolidation Still Exist
Aries 14
HERO 47
Seven remaining owners 25
SPN 27
• The top ten jackup owners control 67% of the current global fleet
• The remaining 33%, or 130 jackups, are controlled by 50 different companies
• With the exception of Hercules and Superior Energy Services, the other liftboat operators in the GOM are private companies
• There are 62 jackups on order by 30 industry participants, including 13 new players(1)
• There are 13 liftboats on order by 4 industry participants, including 2 new players(1)
DO 13 ESV 43
GSF 45
NBR 16
NE 40PDE 27RDC 20THE 24
RIG 25
COSL 11Fifty
remaining owners 130
(1) As of November 1, 2006.(2) Source: Company estimates based on publicly available disclosure made by listed companies and Company-developed information. (3) Source: ODS-Petrodata as November 27, 2006.
GOM Liftboat Ownership (113)(2) Total Jackups Worldwide (394)(3)

9
Increasing Geographic Diversity
India
Rig 31 contracted with Cairn for 7 wells at
$110,000 escalating to $140,000
Middle East
Rig 16contracted with Occidental for two years at
$69,500
West Africa
17 liftboats in operation. Recently
acquired eight liftboats and
assumed rights to operate five
additional liftboats from Halliburton
Other International Opportunities
Rig 26 - exclusively being marketed internationally
Liftboats - actively marketing several liftboats in West Africa, Middle East and North Sea
Marine Services Segment Overview

11
Hercules: Marine Services Segment Overview
• 64 vessels worldwide– Hercules operates the largest liftboat
fleet in the GOM with 47 vessels– Largest liftboat fleet in West Africa with
17 vessels
• Recently closed acquisition of Halliburton’s West African liftboat fleet consisting of eight wholly-owned liftboats and rights to operate five additional liftboats
• Liftboats are self-propelled, self-elevating vessels with large open deck space from which to perform maintenance and construction activities
• Liftboat utilization and dayrates tend to be more stable than that of jackups given their use throughout the life of a well
Swordfish Class 200 Liftboat
Marlin Class 105 Liftboat

12
0 5 10 15 20 25 30 35 40 45 50
CS Liftboats
Seahorse
OMC
AMC
Laredo
OL
Montco
Aries
Superior
Hercules
105 - 130' 131 - 190' 190'+
Largest Liftboat Operator in the U.S. Gulf of Mexico
Source: Company estimates based on publicly available disclosure made by listed companies and Company-developed information.Note: Excludes Hercules’ 17 liftboats operating in West Africa.
• We believe there are 13 newbuilds on order or under construction that may be operated in the U.S. GOM.
Liftboat Class (ft.):
47
14
6
6
4
3
3
2
1
27

13
West African Competitive Landscape
Source: Company estimates based on publicly available disclosure made by listed companies and Company-developed information.Note: Hercules’ fleet includes five non-owned liftboats subject to bareboat charters.*The three vessels owned by Zumax are currently cold-stacked and the two vessels owned by Zukus have been abandoned.
0 5 10 15 20
Shoreline
NV De Brandt
Zukus
Zumax
100-130' 131-190' 190'+Liftboat Class (ft.):
1
1
3*
17
2*
14
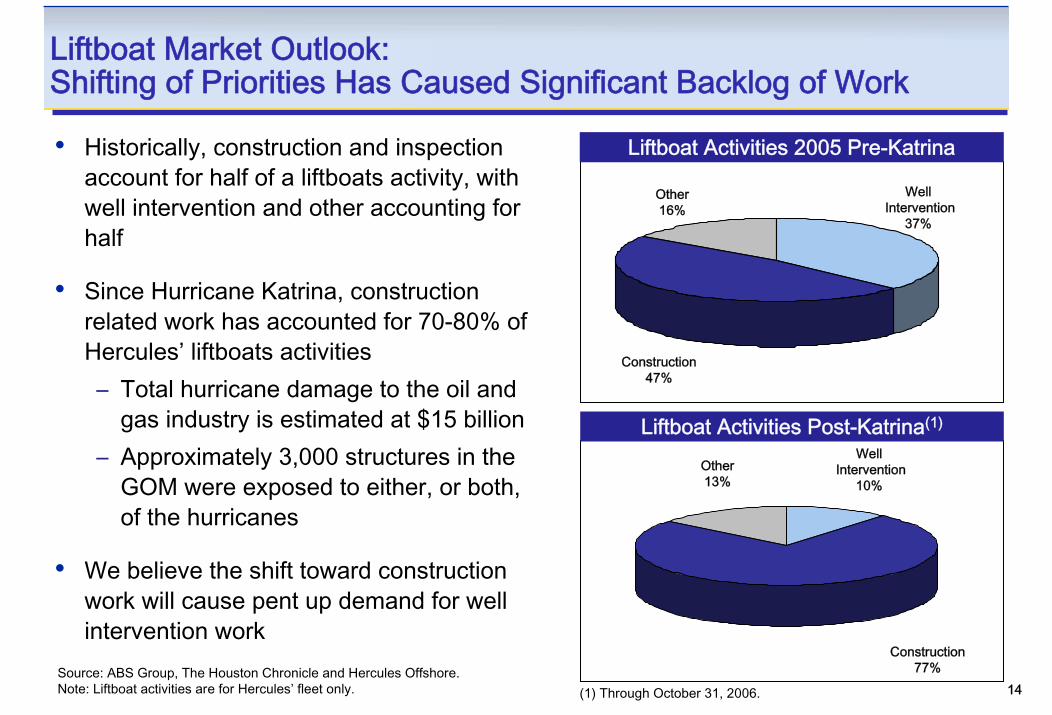
Liftboat Market Outlook:Shifting of Priorities Has Caused Significant Backlog of Work
• Historically, construction and inspection account for half of a liftboats activity, with well intervention and other accounting for half
• Since Hurricane Katrina, construction related work has accounted for 70-80% of Hercules’ liftboats activities– Total hurricane damage to the oil and
gas industry is estimated at $15 billion – Approximately 3,000 structures in the
GOM were exposed to either, or both, of the hurricanes
• We believe the shift toward construction work will cause pent up demand for well intervention work
Source: ABS Group, The Houston Chronicle and Hercules Offshore. Note: Liftboat activities are for Hercules’ fleet only. (1) Through October 31, 2006.
Construction77%
Construction47%
WellIntervention
37%
WellIntervention
10%
Other16%
Other13%
Liftboat Activities 2005 Pre-Katrina
Liftboat Activities Post-Katrina(1)

15
Hercules’ Liftboat Fleet
StarfishClass 140’ Liftboat
SwordfishClass 200’ Liftboat
(1) Within the liftboat industry, the terms leg-length and liftboat class are used interchangeably.(2) Leg-length, dayrate and utilization amounts are based on the four liftboats Hercules owned in West Africa as of October 31, 2006.Note: Utilization is defined as the total number of operating days in the period as a percentage of the total number of calendar days in the period our
liftboats were actively marketed. YTD is as of October 31, 2006. Dayrates include reimbursements from customers under relevant contracts.
79%
Leg - Length /Liftboat Class(1) Number of Oct-05 Oct-06 Y-o-Y YTD 2006
(Feet) Vessels Dayrate Dayrate % Change UtilizationGulf of Mexico260' 1 NA $33,611 NA 97% 0230' 3 $13,842 27,224 97% 77% 0190-215' 6 14,385 22,221 54% 76% 0170' 2 NA 16,090 NA 94% 0140-150' 6 8,289 9,953 20% 68% 0120-130' 14 6,448 8,491 32% 86% 0105' 15 4,146 7,178 73% 72% 0
Domestic Total 47 $6,557 $12,086 84% 78%West Africa130-170' 17 NA $13,085 NA 87%(2)(2)(2)

Contract Drilling Segment Overview

17
Hercules: Contract Drilling Segment Overview
• Hercules owns a fleet of nine jackup rigs
– Six currently operating in U.S. GOM
– One operating in Qatar
– One operating in India
– One currently in a shipyard being upgraded to a 250’IC for international operations
• Specialized design features of three of Hercules’ rigs contribute to high utilization of the Company’s fleet
Source: ODS-Petrodata as of 11/27/06.(1) Excludes cold-stacked rigs, rigs that have announced mobilization
out of the GOM, and rigs expected to be permanently out of service due to recent Hurricanes.
Rig 22GOM Market Share: Jackups <= 250’(1)
1312
76
54
2 21
0
2
4
6
8
10
12
14
THE PDE ESV HERO NBR DO Blake RDC GSF

18
Hercules Drilling Fleet Status
Upgrading to 250’IC
FY 2006 FY 2007Q1 Q2 Q3 Q4 Q1 Q2 Q3 Q4
Location
GOM Rig 11 $61,914 $64,871 $65,976
GOM Rig 15 $52,692 $78,540 $95,487
GOM Rig 20 $73,499 $84,886 $100,781
GOM Rig 21 $79,925 $82,443
GOM Rig 22 $67,826 $83,899 $82,497
GOM Rig 30 $69,162 $67,933 $71,443
International Rig 16
International Rig 26
International Rig 31
Average Dayrate $69,534 $76,129 $81,283
Note: Q1, Q2 and Q3 2006 dayrates are based on actual results. Subsequent quarters represent estimates based on current backlog.
Contracted Dayrate TBD Available Shipyard
$64-66,000
$94-96,000
$114K-116K
$79-81,000
$84-86,000
$79-81,000
Through May 2008 @ $69-70,000
$84-86,000
$79-81,000
$79-81,000
$114K-116K
$89-91,000
$110-140K $140,000 $140,000
$69,860

19
0
50
100
150
200
250
300
350
400
450
500
Feb-
99
Nov
-99
Aug
-00
May
-01
Feb-
02
Nov
-02
Aug
-03
May
-04
Feb-
05
Nov
-05
Aug
-06
$-
$25
$50
$75
$100
$125
$150
$175
$200
0
50
100
150
200
250
300
Feb-
99
Nov
-99
Aug
-00
May
-01
Feb-
02
Nov
-02
Aug
-03
May
-04
Feb-
05
Nov
-05
Aug
-06
$-
$25
$50
$75
$100
$125
Source: ODS-Petrodata. West Africa dayrates are used to approximate average market rates for worldwide jackup rigs.
Increasing Backlog of Work
Business visibility has increased substantially over the past six years, both internationally and in the U.S. Gulf of Mexico.
Current Worldwide Jackup Backlog Current GOM Jackup Backlog
West Africa 300’ IC
Jan 1999187 Days
200’ MC Jackups in GOM
Jan 200432 Days
Oct 2006457 Days
Oct 2006245 Days
Aver
age
Rig
Day
s / M
arke
ted
Rig
Dayrate (in thousands)
Dayrate (in thousands)
Aver
age
Rig
Day
s / M
arke
ted
Rig

20
GOM Jackup Market Update
• A mixed bag – Since May 2006, there has been no clear trend in the U.S. GOM jackup market with a mix of increasing, flat and declining fixtures
• Departing rigs are creating contract gaps – 9 high-specification jackups in the GOM have announced contracts in other markets, leaving short-term work windows
• High-specification rigs competing for standard shelf work – Many of the rigs with reduced dayrates have been independent leg cantilevered jackups suggesting much of the pricing pressure is coming from higher specification rigs
• Move to the shallower water – the number of jackups drilling in 200’ or greater in the GOM declined from 16 in August 2005 to only 5 in November 2006
Source: ODS-Petrodata.
21
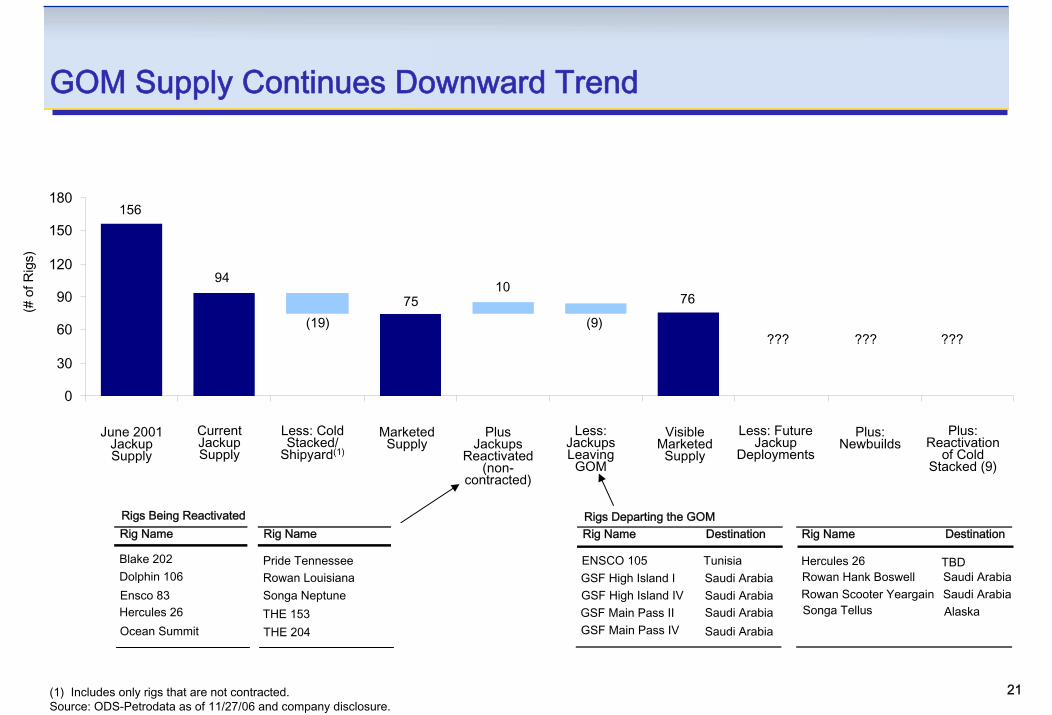
0
30
60
90
120
150
180
(# o
f Rig
s)
??? ??? ???
June 2001 Jackup Supply
Less: Cold Stacked/
Shipyard(1)
Marketed Supply
Less: Jackups Leaving
GOM
Plus Jackups
Reactivated (non-
contracted)
Visible Marketed
Supply
Less: Future Jackup
DeploymentsPlus:
NewbuildsPlus:
Reactivation of Cold
Stacked (9)
(19)
156
94
7510
(9)
76
Current Jackup Supply
GOM Supply Continues Downward Trend
Rigs Being Reactivated Rig Name
Blake 202Rowan LouisianaDolphin 106
Ocean SummitTHE 153Songa Neptune
Pride Tennessee
Hercules 26THE 204
Rig Name
Ensco 83
Rigs Departing the GOMRig Name Destination Rig Name Destination
ENSCO 105 TunisiaGSF High Island I Saudi ArabiaGSF High Island IV
Saudi ArabiaGSF Main Pass IISaudi Arabia
Rowan Hank Boswell Saudi Arabia
GSF Main Pass IV Saudi Arabia
Hercules 26 TBD
Rowan Scooter Yeargain Saudi ArabiaSonga Tellus Alaska
(1) Includes only rigs that are not contracted.Source: ODS-Petrodata as of 11/27/06 and company disclosure.
22
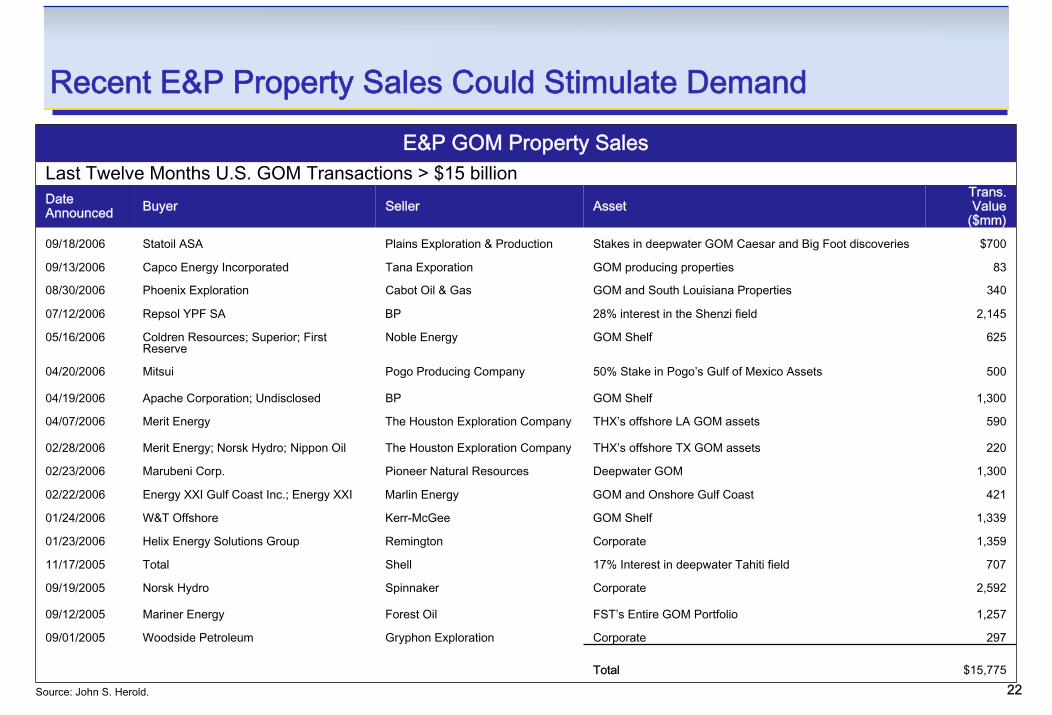
Recent E&P Property Sales Could Stimulate Demand
E&P GOM Property SalesLast Twelve Months U.S. GOM Transactions > $15 billionDateAnnounced Buyer Seller Asset
Trans.Value
($mm)09/18/2006 Statoil ASA Plains Exploration & Production Stakes in deepwater GOM Caesar and Big Foot discoveries $700
09/13/2006
08/30/2006
Capco Energy Incorporated
Phoenix Exploration
Tana Exporation
Cabot Oil & Gas
GOM producing properties
GOM and South Louisiana Properties
83
340
07/12/2006 Repsol YPF SA BP 28% interest in the Shenzi field 2,145
05/16/2006 Coldren Resources; Superior; First Reserve
Noble Energy GOM Shelf 625
04/20/2006 Mitsui Pogo Producing Company 50% Stake in Pogo’s Gulf of Mexico Assets 500
04/19/2006 Apache Corporation; Undisclosed BP GOM Shelf 1,300
04/07/2006 Merit Energy The Houston Exploration Company THX’s offshore LA GOM assets 590
02/28/2006 Merit Energy; Norsk Hydro; Nippon Oil The Houston Exploration Company THX’s offshore TX GOM assets 220
02/23/2006 Marubeni Corp. Pioneer Natural Resources Deepwater GOM 1,300
02/22/2006 Energy XXI Gulf Coast Inc.; Energy XXI Marlin Energy GOM and Onshore Gulf Coast 421
01/24/2006 W&T Offshore Kerr-McGee GOM Shelf 1,339
01/23/2006 Helix Energy Solutions Group Remington Corporate 1,359
11/17/2005 Total Shell 17% Interest in deepwater Tahiti field 707
09/19/2005 Norsk Hydro Spinnaker Corporate 2,592
09/12/2005 Mariner Energy Forest Oil FST’s Entire GOM Portfolio 1,257
09/01/2005 Woodside Petroleum Gryphon Exploration Corporate 297
Total $15,775
Source: John S. Herold.

Financial Overview
24
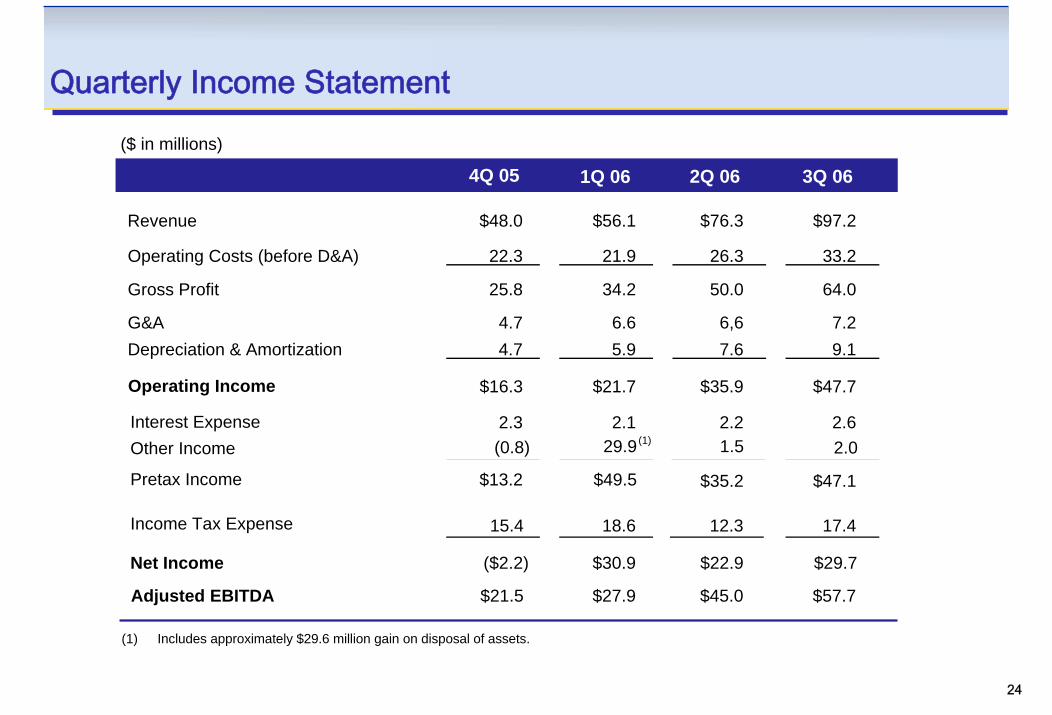
Quarterly Income Statement
(1) Includes approximately $29.6 million gain on disposal of assets.
(1)
4Q 05 2Q 061Q 06 3Q 06
($ in millions)
Revenue $48.0 $56.1 $76.3 $97.2
Operating Costs (before D&A) 22.3 21.9 26.3 33.2
Gross Profit 25.8 34.2 50.0 64.0
G&ADepreciation & Amortization
4.74.7
6.65.9
6,67.6
7.29.1
Interest Expense 2.3 2.1 2.2 2.6
Operating Income $16.3 $21.7 $35.9 $47.7
Other Income
Pretax Income
Income Tax Expense
Net Income
(0.8)
$13.2
15.4
($2.2)
29.9 1.5 2.0
$49.5 $35.2 $47.1
18.6 12.3 17.4
$30.9 $22.9 $29.7
Adjusted EBITDA $21.5 $27.9 $45.0 $57.7

25
Drivers of Financial Performance
Quarter Ending,12/31/05 3/31/06 6/30/06 9/30/06
Domestic Contract Drilling Services Segment:Operating Days 409 382 494 548# of Rigs (as of end of period) 9 6 6 6Average Dayrate $58,611 $70,673 $77,513 $84,776Average Utilization 88.9% 84.9% 94.3% 99.3%
International Contract Drilling Services Segment:Operating Days -- -- 33 100# of Rigs (as of end of period) -- 3 3 3Average Dayrate -- -- $129,577 $78,825Average Utilization -- -- 89.2% 100.0%
Domestic Marine Services Segment:Operating Days 2,999 2,850 2,802 3,171# of Liftboats (as of end of period) 46 42 47 47Average Dayrate $8,010 $8,981 $10,765 $12,641Average Utilization 83.5% 82.4% 75.8% 77.0%
International Marine Services Segment:Operating Days -- 357 355 235# of Liftboats (as of end of period) -- 4 4 4Average Dayrate -- $9,913 $10,047 $12,050Average Utilization -- 99.0% 98.0% 63.9%
26
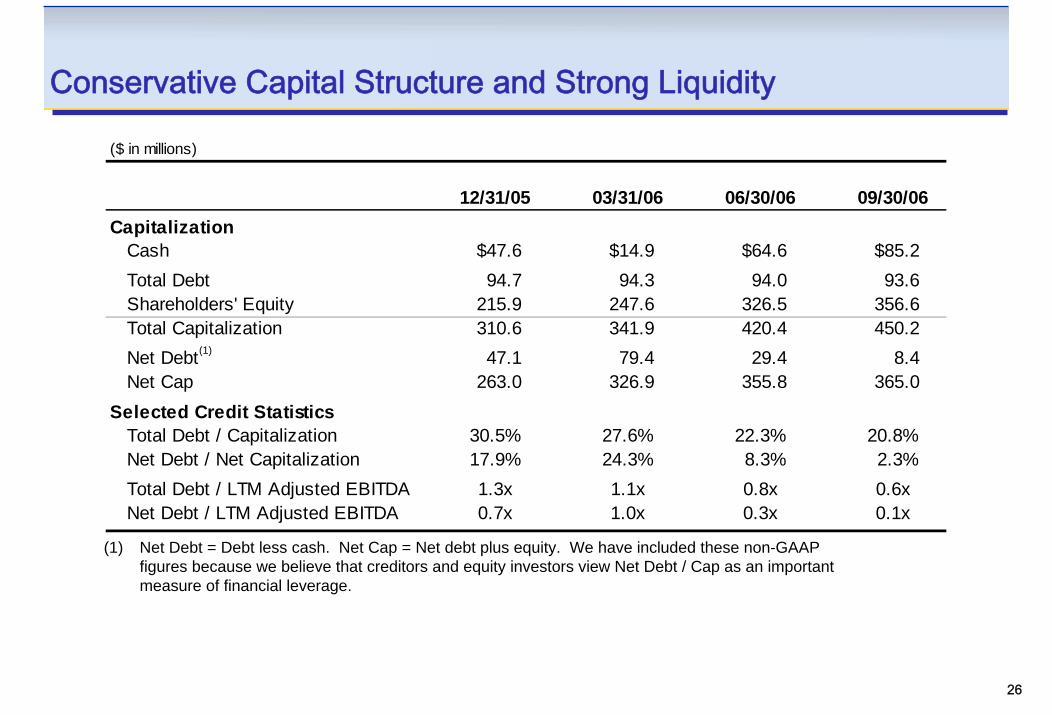
Conservative Capital Structure and Strong Liquidity
(1) Net Debt = Debt less cash. Net Cap = Net debt plus equity. We have included these non-GAAP figures because we believe that creditors and equity investors view Net Debt / Cap as an important measure of financial leverage.
($ in millions)
12/31/05 03/31/06 06/30/06 09/30/06Capitalization
Cash $47.6 $14.9 $64.6 $85.2Total Debt 94.7 94.3 94.0 93.6Shareholders' Equity 215.9 247.6 326.5 356.6Total Capitalization 310.6 341.9 420.4 450.2Net Debt 47.1 79.4 29.4 8.4Net Cap 263.0 326.9 355.8 365.0
Selected Credit StatisticsTotal Debt / Capitalization 30.5% 27.6% 22.3% 20.8%Net Debt / Net Capitalization 17.9% 24.3% 8.3% 2.3%Total Debt / LTM Adjusted EBITDA 1.3x 1.1x 0.8x 0.6xNet Debt / LTM Adjusted EBITDA 0.7x 1.0x 0.3x 0.1x
(1)

27
Gross Margin vs. PeersHigher Profitability Despite Lower Specification Assets
32%
39%
40%
41%
42%
44%
45%
45%
49%
52%
57%
0% 10% 20% 30% 40% 50% 60%
PDE
RDC
THE
RIG
ATW
GSF
DO
NE
SPN
HERO
ESV
Note: For purposes of this presentation, gross margin has been calculated by subtracting operating costs (excluding SG&A and depreciation and amortization) from revenues, and dividing by revenues, in each case as publicly reported by the listed companies. Analysis on GSF excludes its drilling management business as management believes this business is significantly less capital intensive than the drilling and other oilfield services businesses. ATW reflects nine months ended June 30, 2006, as September 30, 2006 numbers have not been published (as of November 29, 2006).
37%
41%
42%
43%
47%
49%
54%
57%
58%
65%
68%
0% 10% 20% 30% 40% 50% 60% 70%
PDE
RIG
THE
RDC
ATW
GSF
SPN
DO
NE
HERO
ESV
9 Months Ending 9/30/2006Year-end 2005

28
First Year Anniversary as a Public Company – Report CardGrow the Company
– Grew revenue and assets by 103% and 109%, respectively, during the 12 months ended September 30, 2006
Maintain Financial Discipline
– Generated a 33.9% ROCE(1) for the 12 months ended September 30, 2006
– Reduced total debt to cap from 57.1% at September 30, 2005 to 20.8% at September 30, 2006
Diversify Geographically
– At time of IPO, 100% of revenue was derived in GOM
– Today, 3 of our 9 jackups and 17 of our 64 liftboats are focused internationally
Generate Attractive Returns for Our Shareholders
– As of November 24th, the Company’s share price has appreciated by 44.7% since the IPO versus 24.4% for the OSX
(1) ROCE (Return on Capital Employed) – Defined as Adjusted EBIT divided by average total assets less average current liabilities.

29
Explanatory Information
Adjusted EBITDA is calculated as net income before interest expense, taxes, depreciation and amortization, gain on disposal of assets and loss on early retirement of debt. Adjusted EBITDA is included in this presentation because our management considers it an important supplemental measure of our performance and believes that it is frequently used by securities analysts, investors and other interested parties in the evaluation of companies in our industry, some of which present EBITDA and Adjusted EBITDA when reporting their results. We regularly evaluate our performance as compared to other companies in our industry that have different financing and capital structures and/or tax rates by using Adjusted EBITDA. In addition, we utilize Adjusted EBITDA in evaluating acquisition targets. Management also believes that Adjusted EBITDA is a useful tool for measuring our ability to meet our future debt service, capital expenditures and working capital requirements, and Adjusted EBITDA is commonly used by us and our investors to measure our ability to service indebtedness. Adjusted EBITDA is not a substitute for the GAAP measures of earnings or of cash flow and is not necessarily a measure of our ability to fund our cash needs. In addition, it should be noted that companies calculate EBITDA and Adjusted EBITDA differently and, therefore, Adjusted EBITDA as presented for us may not be comparable to EBITDA and Adjusted EBITDA reported by other companies. Adjusted EBITDA has material limitations as a performance measure because it excludes interest expense, taxes, depreciation and amortization, gain on disposal of assets and loss on early retirement of debt. The following tables reconcile Adjusted EBITDA with net income.
EBITDA Reconciliation($ in millions)
Drilling Liftboats1Q 05 2Q 05 Q3 05 4Q 05 1Q 06 2Q 06 3Q 06 1Q 05 2Q 05 Q3 05 4Q 05 1Q 06 2Q 06 3Q 06
Net Income $9.5 $7.6 $10.5 $0.5 $25.6 $15.6 $19.1 $2.5 $1.5 $2.5 ($1.6) $7.5 $9.3 $12.6Plus: Interest Expense 1.8 1.8 1.9 1.5 1.3 1.4 1.7 0.5 0.6 0.9 0.8 0.7 0.8 0.9Plus: Income Tax Expense – – – 6.9 15.1 7.5 10.5 – – – 8.9 4.4 5.5 7.6Plus: Depreciation and Amortization 1.3 1.3 1.4 1.5 1.7 2.3 3.5 1.2 1.5 2.3 3.2 4.3 5.2 5.6Plus: Loss on Early Retirement of Debt – 1.8 – 0.8 – – – – 0.9 – 0.5 – – –Less: Gain on Disposal of Assets – – – – 29.6 – 1.1 – – – – – – –
Adjusted EBITDA $12.5 $12.6 $13.8 $11.3 $14.1 $26.8 $33.7 $4.2 $4.6 $5.8 $11.7 $16.8 $20.7 $26.7
Company EBITDA Reconciliation($ in millions)
Company1Q 05 2Q 05 Q3 05 4Q 05 1Q 06 2Q 06 3Q 06
Net Income $11.4 $8.2 $10.1 ($2.2) $30.9 $22.9 $29.7Plus: Interest Expense 2.3 2.5 2.7 2.3 2.1 2.2 2.6Plus: Income Tax Expense – – – 15.4 18.6 12.3 17.4Plus: Loss on Early Retirement of Debt – 2.8 – 1.3 – – –Less: Gain on Disposal of Assets – – – – 29.6 – 1.1
Adjusted EBIT $13.7 $13.5 $12.8 $16.8 $22.0 $37.4 $48.6Plus: Depreciation and Amortization 2.5 2.9 3.8 4.7 5.9 7.6 9.1
Adjusted EDITDA $16.2 $16.3 $16.6 $21.5 $27.9 $45.0 $57.7
Note: Reconciliations for Drilling and Liftboats do not include corporate adjustments.