capital structure under different macroeconomic conditions
TRANSCRIPT

I
Capital structure under different macroeconomic conditions: Evidence from South Africa
Research by: Moeketsi Mokuoane (767677)
Supervisor: James Britten
A research report submitted to the School of Economics and
Business Science, Faculty of Commerce, Law and
Management, University of the Witwatersrand, in partial
fulfilment (50%) of the requirements for degree of Master of
Commerce in Finance
Johannesburg, South Africa
May 2016

II
DECLARATION
I, the undersigned, Moeketsi M. Mokuoane, hereby declare that this
research is my own, unaided work. It is being submitted in partial
fulfilment of the requirements for the degree of Masters in Finance at the
University of the Witwatersrand, Johannesburg. It has not been submitted
before for any degree or examination in this or any other university.
I further declare that:
I am aware that plagiarism (the use of someone else’s work without their
permission and/or without acknowledging the original source) is wrong.
I have followed the required conventions in referencing the thoughts and
ideas of others. I understand that the University of the Witwatersrand
may take disciplinary action against me if there is a belief that this is not
my own unaided work or that I have failed to acknowledge the source of
the ideas or in writing.
SIGNED AT _________________________ ON THIS _______ DAY OF ___________ 2016
______________________________________
Signature

III
ACKNOWLEDGEMENTS
I would like to thank the following people for their immense support:
James Britten, my supervisor
Teboho Tsotetsi for his assistance with the VBA code and MATLAB
programme

IV
Definition of Terms and Abbreviations
Balance sheet channel: a theory, which states that the size of the external finance premium
should be inversely related to the borrower’s net worth.
Bank lending channel: a theory which states that changes in monetary policy will shift the
supply of intermediated credit, especially credit through commercial banks.
Basel I, II and III: a set of standards and practises created to ensure that international banks
maintain adequate capital to sustain themselves during periods of economic strain.
BESA: Bond Exchange of South Africa is the South African Bond exchange based in
Johannesburg and the entity is responsible for operating and regulating the debt securities
and interest rate derivatives markets in South Africa.
Consumer Price Index or CPI: a measure which examines the weighted average price of a
basket of consumer goods and services, such a transportation, food and medical care. The
Consumer Price Index is calculated by taking price changes for each item in the predetermined
basket of goods and averaging them; the goods are weighted according to their importance.
Credit Channel Mechanism of Monetary Policy: a theory that explains how the central bank's
policy changes affect the amount of credit that banks issue to firms and consumers for
purchases, which in turn affects the real economy.
EBITDA: earnings before interest, taxation, depreciation and amortisation.
EBIT: earnings before interest and taxation.
Gross Domestic Product or Real Gross Domestic Product: is a macroeconomic measure of
the value of economic output adjusted for price changes (i.e. inflation or deflation). This
adjustment transforms the money value measure, nominal GDP, into an index for quantity of
total output.
JIBAR: Johannesburg Interbank Agreed Rate is the money market rate that is used in South
Africa. It is calculated as the average interest rate at which banks buy and sell money.
Net Present Value: the sum of the future values of incoming and outgoing cash flows over a
period of time which are discounted using a specified rate of return.
Risk-based Capital Credit Crunch Hypothesis: a theory which explores whether during a
credit crunch, risky banks, constrained by low capital ratios, tend to reduce lending more than
others, during a credit crunch.
IPO: Initial Public Offering.
SARB: South African Reserve Bank.
Weighted Average Costs of Capital: is the rate that a corporate is expected to pay on average
to all its security holders to finance its assets.

V
Tobin’s Q: the sum of the market value of equity and the book value of debt, divided by the
book value of assets, at the end of the event quarter should be greater than one.

VI
Capital structure under different macroeconomic conditions:
Evidence from South Africa
ABSTRACT
The empirical literature provides conflicting assessments about how firms choose their capital
structure and how macroeconomic variables influence capital structure decision making.
There has been a minimal research of the impact of macroeconomic conditions on the
adjustment of capital structure towards target, specifically in the context of South Africa. This
study employs a sample of South African companies listed on JSE Limited stock exchange from
2000 - 2014 to investigate: (1) the relationship between corporate leverage and firm
characteristics as well as macroeconomic variables; (2) the impact of extreme capital market
frictions on capital structure decisions; and (3) the relation between macroeconomic
conditions and capital structure adjustment speed using an integrated partial adjustment
dynamic capital structure model. The research results find evidence that certain firm
characteristics and macroeconomic factors have pronounced influence on the capital
structure of the sample of listed companies. The empirical results are compared to previous
international evidence from developed markets and are in line with the international
evidence. Results show that profitability, size and tangibility are significant determinants of
firms’ capital structure in the pre- extreme capital market friction periods. The rand crisis of
2001 – 2002 and the global financial crisis period of 2007 – 2009 are considered extreme
capital market friction periods. The findings highlights that profitability and size have a
different relation to leverage during these extreme capital market friction periods. The
extreme capital market friction dummy is significant which means that capital supply
conditions are also amongst important factors that need to be considered while determining
the financing mix during periods where the supply of capital is disrupted. The findings
highlight that demand-side and supply-side factors need to be considered in firms’ financial
decision making processes, especially during periods where there is extreme capital markets
friction. The research also finds evidence supporting the prediction of theoretical framework
that firms adjust to target leverage slower in good states than in bad states, where states are
defined by real GDP growth rate and inflation rate.

VII
Table of contents 1. Introduction .................................................................................................................................... 1
1.1. Background to the study ............................................................................................................. 1
1.2. Contribution of the study ............................................................................................................ 5
1.3. Dissertation outline ..................................................................................................................... 6
2. Literature review ............................................................................................................................. 7
2.1. The progression of capital structure debate............................................................................... 7
2.2. Capital structure theories ......................................................................................................... 10
2.2.1. Modigliani and Miller Theorem ............................................................................................ 10
2.2.2. Agency costs theory .............................................................................................................. 11
2.2.3. Trade – off theory ................................................................................................................. 15
2.2.4. Pecking order theory ............................................................................................................. 17
2.2.5. Market timing ....................................................................................................................... 18
2.3. Review of empirical studies of capital structure ....................................................................... 22
2.3.1. Empirical definitions of leverage .......................................................................................... 22
2.3.2. Firm characteristics and basic capital structure ................................................................... 23
2.3.3. Macroeconomic variables and basic capital structure ......................................................... 26
2.3.4. Capital markets friction and basic capital structure ............................................................. 30
2.3.4.1. Characteristics of capital markets friction ........................................................................ 39
2.3.4.1.1. Credit spreads ................................................................................................................... 39
2.3.4.1.2. Sudden decline in debt issuance ....................................................................................... 39
2.3.4.1.3. Currency volatility ............................................................................................................. 41
2.3.5. Macroeconomic conditions and capital structure adjustment speed .................................. 42
3. Description of variables ................................................................................................................ 45
3.1. Firm-specific variables............................................................................................................... 45
3.1.1. Tangibility .............................................................................................................................. 46
3.1.2. Size ........................................................................................................................................ 47
3.1.3. Profitability ............................................................................................................................ 47
3.2. Macroeconomic variables ......................................................................................................... 47
3.2.1. Economic growth .................................................................................................................. 48
3.2.2. Inflation rate ......................................................................................................................... 49
3.2.3. Interest rates ......................................................................................................................... 52
3.2.4. Summary of the three key economic indicators ................................................................... 53
4. Data ............................................................................................................................................... 54

VIII
5. Model specification ....................................................................................................................... 55
5.1. The model specification – macroeconomic variables ............................................................... 55
5.2. The model specification – capital markets friction ................................................................... 56
5.3. The model specification - integrated dynamic partial adjustment capital structure model .... 58
5.3.1. Defining good and bad states of macroeconomic conditions .............................................. 59
6. Empirical analysis .......................................................................................................................... 60
6.1. Summary statistics .................................................................................................................... 60
6.2. Results and discussion .............................................................................................................. 64
6.2.1. Regression results ................................................................................................................. 64
6.2.2. Discussion .............................................................................................................................. 65
6.2.2.1. GDP growth ....................................................................................................................... 65
6.2.2.2. Prime rate ......................................................................................................................... 66
6.2.2.3. CPI ..................................................................................................................................... 67
6.2.2.4. Tangibility .......................................................................................................................... 68
6.2.2.5. Size .................................................................................................................................... 69
6.2.2.6. Profitability ........................................................................................................................ 69
6.2.3. Capital markets friction and leverage ratios ......................................................................... 70
6.2.4. Macroeconomic condition and capital structure speed adjustment.................................... 71
6.2.4.1. Regression results for adjustment speed estimates ......................................................... 73
7. Summary and conclusion .............................................................................................................. 76
7.1. Contributions ............................................................................................................................ 78
7.2. Limitations................................................................................................................................. 79
7.3. Recommendations .................................................................................................................... 79

IX
List of figures
Figure 1 - South African Total Listed Debt Issuance (2005 - 2015) ......................................................... 3
Figure 2 - Debt cost - benefit balance ................................................................................................... 16
Figure 3 - Total loans and advances: South African corporates (1995 - 2014) ..................................... 32
Figure 4 - Historical credit spreads (2003 – 2014) ................................................................................ 39
Figure 5 – South African corporate historical debt issuance (2005 – 2015) ......................................... 40
Figure 6 - USDZAR exchange rate (1995 – 2014) .................................................................................. 41
Figure 7 - Real GDP growth rate (1970 – 2014) .................................................................................... 49
Figure 8 - Consumer Price Index (1970 - 2014) ..................................................................................... 51
Figure 9 - South African Prime rate (1970 – 2014) ............................................................................... 53
Figure 10 - Summary of the three selected economic indicators (1999 – 2014) ................................. 54
Figure 11 - Market value leverage vs. book value leverage .................................................................. 61
Figure 12 - Relative proportion of different categories of leveraged firms - market value basis ........ 62
Figure 13 - Relative proportion of different categories of leveraged firms - book value basis ............ 63

X
List of tables
Table 1 - Summary of agency models ................................................................................................... 14
Table 2 - Summary of Mokhova and Zinecker (2014) results ............................................................... 28
Table 3 - Relationship between firm-specific characteristics and corporate leverage ......................... 45
Table 4 - Definition of good and bad states .......................................................................................... 60
Table 5 - Annual mean, median and standard deviation of leverage ................................................... 61
Table 6 - Sample statistics ..................................................................................................................... 62
Table 7 - Correlation matrix: Book value leverage ................................................................................ 63
Table 8 - Correlation matrix: Market value leverage ............................................................................ 64
Table 9 - Regression results .................................................................................................................. 65
Table 10 - Effects of extreme capital markets' frictions and leverage ratio ......................................... 71
Table 11 - Summary statistics of leverage across states ....................................................................... 72
Table 12 - Good vs. Bad states when states are determined by inflation rate ..................................... 74
Table 13 - Good vs. Bad states when states are determined by real GDP growth rate ....................... 75

1
1. Introduction
1.1. Background to the study
The relevance of the composition of the corporate capital structure has been the subject of
debate since the publication of the seminal paper by Modigiliani and Miller (1958) that argued
that a firm’s value is independent of the relative proportions of debt or equity in its “capital
stack”. It is almost five decades since the publication of the aforementioned paper, and the
debate around the relevance of a firm’s capital structure wages on. A number of theories have
been developed, some of a polemic nature, and others in support of Modigliani and Miller
(1958). Considerable empirical research and analysis has also been conducted to support or
refute the Modigliani and Miller (1958) position.
The decision-making process concerning the financing choice of a company is an important
matter as far as financial stability and going concern matters are concern. It is therefore
important that one develops a better understanding of the determinants of firms’ preferred
leverage (the demand side) and the variables that measure the constraints on a firm’s ability
to increase its leverage (the supply side), if one is to develop improved levels of understanding
funding patterns and their adjustment through economic cycles. The capital structure and its
adjustment to achieve a specific target can be influenced by both the demand and supply side
factors, collectively the so-called determinants of capital structure (Mokhova and Zinecker,
2014).
Corporate executives typically have a degree of control over demand-side factors
(traditionally known as internal determinants); however external factors such as
macroeconomic conditions and the ability of banks and/or other financial institutions (i.e.
asset management companies, life offices and bilateral institutions) to make credit available
cannot be controlled by these executives. Developing an understanding of how the demand-
side and supply-side factors influence a corporate capital structure and the speed of
adjustment towards target is therefore vitally important in assisting corporate executives to
make appropriate decisions about their firms’ capital structures.
There are a number of capital structure theories (Modigliani and Miller, 1958; Kraus and
Litzenberger, 1973; Donaldson, 1961; Myers and Majluf, 1984) that have attempted to explain
a firm’s preferences and behaviour according to the financing choice of that firm. Kraus and
Litzenberger (1973) suggested that the selection of a firm’s capital structure reflects some
trade-off between the tax benefits and the expected costs of bankruptcy. This trade-off
theory argues that corporate executives find the optimal capital structure by taking into
account the relative tax benefits, bankruptcy costs and agency costs of debt versus equity. An
alternative, known as the pecking order theory, was espoused by Myers and Majluf (1984),
and is premised on the information asymmetry between a company’s corporate executives
and its external investors (i.e. debt or equity investors). Put differently, pecking order theory
postulates that the costs of financing increases with asymmetric information. Therefore,

2
pecking order theory assumes a certain sequence in funding: internal financing through
profits first, then debt and lastly raising equity as a “last resort”.
Empirical studies have tried to shed light on the determinants of a firm’s capital structure and
to provide support for the existing capital structure theories. A literature review reveals that
there are some key internal factors that have a significant effect on the financing choices
made by a company, including: profitability, asset tangibility, growth opportunities and tax
shields (Mokhova and Zinecker, 2014). Marsh (1982) was one of the pioneers in conducting
exploratory studies that looked at the determinants of corporates’ target debt levels. He
concluded that the results were consistent with other empirical studies by Martin and Scott
(1977) that found that a firm’s targeted debt levels were a function of the company’s size,
bankruptcy risk, and asset portfolio composition. These key determinants in some instances
corroborate various capital structure theories (i.e. pecking order theory; trade-off theory and
agency costs theory, etc.).
Other empirical studies of corporate capital structures have also attempted to show how
financing choices by firms are influenced by macroeconomic factors and the state of the
economy. For example, Bokpin (2009) investigated the effect of macroeconomic factors on
the capital structure decisions of emerging market firms. Another study by Korajczyk and Levy
(2003) investigated the role of macroeconomic conditions and financial constraints in
determining a firm’s capital structure choice. Levy and Hennessy (2007) developed a
computable general equilibrium model explaining financing over the business cycle.
Intuitively, positive gross domestic product (‘GDP’) growth rates might be expected to offer
growth opportunities for firms and hence impact on their financial performance. Growth
opportunities need to be funded either from internal or external sources of funding, and
corporate executives need to make important elections in this regard. For example, if a firm’s
fortune depends on current macroeconomic conditions, it would be prudent for corporate
executives to adjust their firms’ funding policies based on the macroeconomic conditions
prevailing from time to time (Hackbarth, Miao and Morellec, 2006). In other empirical studies,
inflation rate has been found to have a significant effect on firms’ choice of external financing;
whilst GDP growth rates have been found to have a negative correlation with a firm’s capital
structure choice (Bokpin, 2009; Mokhova and Zinecker, 2014).
The foregoing discussion on leverage implicitly assumes that capital availability depends
solely on firm characteristics and the performance of macroeconomic variables. However,
capital market frictions that make capital structure relevant may be associated with a firm’s
source of capital (Faulkender and Petersen, 2006). Following the global financial crisis, banks
and other financial institutions tightened their lending criteria after suffering losses, and
curtailed lending to the corporate sector (Ivashina and Scharfstein, 2009; Puri, Rocholl and
Steffen, 2011). The historic magnitude of the financial crisis emphasizes the importance of
understanding how shocks to the supply of external capital affect the real economy and
capital structure of firms (Duchin, Ozbas and Sensoy, 2010).

3
Leary (2009) asked the question: Are capital markets supply frictions relevant for corporate
capital structure decisions? Based on assumptions made by Modigliani and Miller (1958), the
supply of different forms of capital is infinitely elastic; the theoretical answer to the question
should therefore be a simple “no”. However, recent research literature, which has looked at
the supply of credit and the relevance of capital market frictions on capital structure
decisions, seems to agree that capital markets are relevant to the determination of capital
structures and funding policy formulations.
The “credit supply” or “supply-side” literature suggests that market frictions can impact
capital supply to corporates depending on the credit quality of borrowers and the extent of
information asymmetry e.g. investment grade vs. non-investment and large firms vs small
firms. Whether the credit supply impacts a firm’s financing decisions is still debatable. An
examination of the findings of the academic literature on the subject, shows that majority of
these studies provide mixed or inconclusive results (Leary, 2009; Duchin et al., 2010; Lemmon
and Roberts, 2010), highlighting the need for more research in this area.
Figure 1 shows the total listed debt loan issuance on JSE Bond Exchange in South Africa during
the period 2005 to 2014.
Figure 1 - South African Total Listed Debt Issuance (2005 - 2015)
Source: BESA (2015)
The onset of the global financial crisis led to tighter domestic debt capital markets. Tighter
liquidity in these capital markets led to a rapid decline in private sector access to credit. Debt
issuance in South Africa slowed from 2007 when debt issuance increased by 4.9% year-on-
year, compared to 47.5% year-on-year increase in 2006. In 2008, the following year, debt
issuance was severely impacted declining by 47.9% year-on-year, marking the beginning of a
tight credit cycle. Corporate (i.e. non-banking and non-financial corporates) debt issuance
declined by 9%, 69% and 54% during 2007, 2008 and 2009 respectively.
47,3
69,874,5
38,2
80,8
94,8 91,6
121,7
108,1 109,4
0,0
20,0
40,0
60,0
80,0
100,0
120,0
140,0
2005 2006 2007 2008 2009 2010 2011 2012 2013 2014
SA Total Debt issuance volume R'billion
Total

4
There has also been a number of studies completed of the basic determinants of capital
structure and the impact thereof on a firm’s adjustment speed (Harris and Raviv, 1991; Rajan
and Zingales 1995; Deesomsak, Paudyal and Pescetto, 2004; Banerjee, Heshmati and
Wihlborg, 2000; Drobetz and Wanzenried, 2006). Some studies have suggested that a firm’s
financing decisions and the adjustment of its capital structure towards a target leverage, may
not depend entirely on firm-specific characteristics but also on macroeconomic conditions,
economic development and business cycles (Drobetz and Wanzenried, 2006; Cook and Tang,
2010; Camara, 2012; Chipeta and Mbululu, 2013).
Although there are corporate capital structure theories aimed at explaining firms’ financing
decisions, little is known about how macroeconomic conditions affect the adjustment speed
of capital structure towards target leverage (Cook and Tang, 2010). The primary existing
theories of corporate capital structure that attempt to explain firms’ financing decisions can
be categorised as the trade-off theory, pecking order theory, and market timing theory (all
discussed more fully in Section 2.2 hereof). These theories provide some insight on how firms
adjust their leverage by looking at the cost and the benefits of each strategy. In the absence
of any adjustment costs, firms would continuously offset deviations from target (Cook and
Tang, 2010). The magnitude of the cost related to any adjustment will determine how quickly
firms adjust to their target levels.
The studies on firm-specific determinants of capital structure and the impact of
macroeconomic variables on capital structures have not being conclusive. Different
researchers have reached different conclusions whilst investigating the same factors. This is
probably because these variables explain only one side of the equation, the demand side.
Gaud, Hoesli and Bender (2007) concluded that, after 40 years of research on capital structure
theories, there is no single theory that can fully explain how corporate managers formulate
their borrowing policies. All these disagreements provides scope for further research on
whether capital structure decisions are impacted only by demand side factors or by
combination of both demand side and supply side factors. The supply side mainly focuses on
identification of exogenous variations in the supply of credit and how this affects capital
structure decisions.
Against the backdrop of the aforementioned academic studies, this research investigates both
firm-specific factors’ and macroeconomic factors’ impact on corporate capital structures in
South Africa. In addition, this study investigates the financing behaviour of corporates during
the time of rand crisis (2001 – 2002) and global financial crisis (2007 - 2009) in response to
shocks to the supply of credit in South Africa. This research also reviews how a sample of
South African corporates have adjusted their leverage targets given prevailing
macroeconomic conditions reflected in the South African inflation rate and in its GDP growth
rate.

5
1.2. Contribution of the study
The debate regarding basic capital structure determinants (i.e. both demand-side and supply-
side) and the adjustment speed towards achieving the optimal capital structure has been
primarily focused on firms operating in developed economies. Very little has been written on
this subject in the context of firms domiciled in developing countries, especially in Africa.
There have been a few studies of capital structure choices in some African countries
(Gwatidzo and Ojah, 2009; Bokpin, 2009; Doku, Adjasi and Sarpong-Kumanjuma, 2011; Moyo,
Wolmarans and Brümmer, 2013), although these have not focused specifically on the impact
of prevailing macroeconomic conditions. Also, the emerging literature of supply-side
determinants of capital structure choices presents an opportunity in contributing to the
capital structure choice debate and research.
The studies conducted in an African context have also produced results, which are
inconsistent with the empirical findings of studies conducted of firms in developed
economies. For instance, Gwatidzo and Ojah (2009) found that tangibility of assets in most
sampled African countries in their study were negatively correlated to leverage. This was
however attributed to the apparent lack of contract-enforceability within sample countries,
and the inability to provide accurate asset valuations.
The aim of this research is to take into consideration the aforementioned studies and test
these theoretical formulations on Africa’s largest capital market. Due to the volatility in capital
markets over the last 10 years, the South African capital markets present an attractive testing
ground.
The ongoing debate and the lack of consensus within the capital structure decision theories
also provide an opportunity for further research, specifically in a developing markets context
and to further understand both supply and demand side factors. In addition, an interesting
area of research is the investigation on how quickly do corporates adjust their capital
structure given the macroeconomic conditions.
In this regard, this research hopes to contribute to the understanding of capital structures in
several ways. Firstly, starting with a selected list of firm-specific factors and macroeconomic
factors from prior literature the research examines which factors are reliably signed, and
reliably important, for predicting leverage. Secondly, there is a good reason to surmise that
the factors influencing corporate financing decisions may have changed significantly over the
past few decades. During the 1980s many firms took-on more leverage apparently due to
pressure from the market for corporate control. During the late 1980s and 1990s, many
smaller firms made use of publicly traded equity (Frank and Goyal; 2009). Other factors may
also have changed and it is important to examine the effects of these changes on firms’ capital
structures over time.
Thirdly, as far as the supply-side effects on capital structure are concerned, this research also
attempts to make a contribution in the South African context. To the best of the author’s
knowledge and belief it may be the first of its kind.

6
Finally, studies on the adjustment speed of capital structure derived from analysing
traditional capital structure theories as well as studies on the role of macroeconomic factors
in capital structure choice have largely ignored the impact of macroeconomic conditions on
the adjustment speed of capital structure towards targets. This research also tests the
relationship between macroeconomic conditions and capital structure adjustment speed
using an integrated partial adjustment dynamic capital structure model during good and bad
economic conditions as defined using the parameters set by this research and guided by
previous literature studies (Cook and Tang, 2010).
With regard to the aforementioned, the aims of this research are:
To determine the influence of macroeconomic factors on the capital structures of selected
companies listed on Johannesburg Stock Exchange.
To explore the relevance of extreme capital market frictions on corporate capital structure
decisions.
To analyse the impact that macroeconomic factors have on the speed of adjustment to
attempt to achieve the optimal capital structure (i.e. the targeted capital structure) and to
explore how quickly firms adjust their capital structure during both good and bad times.
1.3. Dissertation outline
The research is made up of seven related sections. Section 1 introduces the research by giving
an overview of the three related topics of capital structure, objectivesc and the significance
of the research. Section 2 looks at the theoretical and empirical determinants of capital
structure. It explores the different firm-specific characteristics and macroeconomic variables
and their impact on capital structure decision making. The theories of capital structure, from
Modigliani and Miller’s (1958 and 1963) propositions to the more recent trade –off theories
like Kraus and Litzenberger (1973) and agency theory of Jensen and Meckling (1976) are
reviewed. These theories argue that firms’ characteristics impact how capital structure
decisions are made. Section 2 also discusses empirical studies relating to capital markets’
frictions and their impact on capital structure choices. In addition, the empirical studies
relating to the relationship between macroeconomic conditions and the capital structure
adjustment speed are reviewed.
Section 3 discusses the selected firm-specific and macroeconomic variables and evidence
from international studies. Section 4 and Section 5 discusses data and three models
specification respectively. Section 6 provides the empirical analysis and a comparison of the
results to international evidence is also included. Section 7 concludes.

7
2. Literature review
This section begins with the review of how the capital structure debates have evolved during
the 20th and 21st century. Thereafter the capital structure theories (with specific focus on
Modigliani and Miller Theorem, Agency costs theory, Trade-off theory, Pecking order theory
and Market timing theory) are analyzed and reviewed. An extensive analysis of empirical
studies supporting and refuting these theories is reviewed. The empirical studies relating to
a new strand of corporate finance literature that demonstrates that the supply of capital,
particular debt capital has an impact on corporate leverage is reviewed. Finally, the
examination of empirical studies investigating macroeconomic conditions and capital
structure adjustment speed are reviewed.
2.1. The progression of capital structure debate
Making the correct capital structure decisions is a crucial task for the financial wellbeing of
any firm. Failure to make the right decisions could ultimately result in financial distress,
bankruptcy and liquidation in certain circumstances. Corporate executives need to decide
which form of capital they require given the firm’s financial circumstances, long term funding
strategies and value creation strategies for its stakeholders.
From an empirical study perspective, two questions have to be addressed in order to tackle
the capital structure decisions: How do firms fund their capital structure to finance their
operations and how does the choice of capital structure affect the value of the firm (Haron,
2014). Modigliani and Miller (1958) were the first to attempt to address these questions from
a theoretical perspective.
Despite the extensive research done in the area of capital structure since Modigliani and
Miller (1958) and notwithstanding Myers’ (1977) research papers on the determinants of
corporate borrowings, the understanding of the determinants of corporate borrowings
remains inconclusive (Haron, 2014). According to Titman and Wessels (1988), empirical work
in the area of capital structure decisions has lagged behind the theoretical research, perhaps
because the relevant firm attributes are expressed in terms of fairly abstract concepts that
are not directly observable. Al-Najjar and Taylor (2008) also point out that theoretical
explanation is still lacking and empirical results are not yet sufficiently consistent to resolve
the capital structure issues on how firms choose between the different methods of financing
available to them.
Corporate financing decisions are the end-result of a complex process and existing theories
can at best explain only certain facets of the diversity and complexity of financing choices
(Haron, 2014). Myers (2001) suggests that there is no universal theory of debt-equity choice,
and no reason to expect one. Myers (2001) however suggests that there are several useful
conditional theories. For example, the trade-off theory says that firms seek debt levels that
balance the tax advantages of additional debt against the costs of possible financial distress
that come with raising capital in this form. The trade-off theory predicts moderate borrowings
by tax-paying firms. The pecking order theory argues that the firm will borrow, rather than

8
issue equity, when internal cash flow is not sufficient to fund capital expenditure. Thus the
amount debt raised will reflect the firm’s cumulative need for external funds. The free cash
flow theory postulates that dangerously high debt levels will increase value, despite the threat
of financial distress, when a firm’s operating cash flow significantly exceeds its profitable
investment opportunities. The free cash flow theory is more applicable to mature firms that
are prone to over-invest.
When corporations decide on the use of debt finance, they are reallocating some expected
future cash flows away from equity claimants in exchange for cash up front. Also, when
corporations decide to use equity in funding growth opportunities, equity capital providers
require higher return compared to debt capital providers. The factors that drive decisions on
whether to raise debt or equity capital remain elusive despite a vast body of theoretical
literature and decades of empirical testing (Frank and Goyal, 2009; Titman and Wessels,
1988). For Frank and Goyal (2009) the inclusive results stems in part from the fact that many
of the empirical studies are aimed at providing support for a particular theory. Due to the
different time periods being investigated, different definitions of leverage and the variation
of determinants of capital structure it is often all too easy to provide some empirical support
for almost any idea. Most references about the contrasting nature of the capital structure
research are made to the survey by Harris and Raviv (1991) or to the empirical study by Titman
and Wessels (1988). These two classic papers (Harris and Raviv, 1991; Titman and Wessels,
1988) illustrate a serious empirical problem, and disagree over basic facts (Frank and Goyal,
2009).
The Titman and Wessels (1988) paper analyses the explanatory power of some theories of
the optimal capital structure. Titman and Wessels (1988) study uses a factor-analytic
technique that mitigates the measurement problems encountered when working with proxy
variables. Although Titman and Wessels (1988) model results suggests that firms with unique
or specialised products have low debt ratios, they find no evidence to support theoretical
work that predicts that debt ratios are related to a firm’s expected growth, non-debt tax
shields, volatility, or collateral value of its assets. These findings are in sharp contrast with
those of Harris and Raviv (1991). In this regard, advocates of particular theories are offered a
choice of diametrically opposing well-known summaries of “what we all know” from the
previous literature (Frank and Goyal, 2009). This contradiction provides scope and
opportunity for further research.
The Harris and Raviv (1991) paper surveys capital structure theories based on agency costs,
asymmetric information, product/input market interactions, and corporate control
considerations (but excluding tax-based theories). According to Harris and Raviv (1991)
research, studies generally agree that leverage increases with fixed assets, non-debt tax
shields, growth opportunities, firm size; and leverage decreases with volatility, advertising
expenditures, research and development expenditure, bankruptcy probability, profitability
and uniqueness of the product.

9
Other researchers (Gertler and Gilchrist, 1993; Korajczyk and Levy, 2003; Levy and Hennessy,
2007; Bokpin, 2009) also try to investigate how macroeconomic conditions influence
corporate capital structure decision-making. Gertler and Gilchrist (1993) show that
subsequent to recessions induced by monetary contractions, aggregate debt issues increase
for large firms but remain stable for small firms. During expansions, stock prices go up,
expected bankruptcy costs go down, taxable income goes up, and cash increases. Thus, firms
borrow more during expansions. Collateral values are likely to be pro-cyclical too. If firms
borrow against collateral, leverage should again be procyclical (Frank and Goyal, 2009).
However, agency problems are likely to be more severe during downturns as managers’
wealth is reduced relative to that of shareholders. If debt aligns managers’ incentives with
those of shareholders, leverage should be counter-cyclical (Frank and Goyal, 2009).
Frank and Goyal (2003) found that approximately 30% of differences in the capital structure
of publicly traded North American firms over the 1971 to 1998 period could be explained by
firm-specific characteristics. According to Bokpin (2009), this finding shows that there are
other factors that are affecting capital structure decisions, which are not accounted for by
internal determinants. If firms’ cash flow patterns are sensitive to movements in the
economy, the firms will either have to issue less debt overall (reduce interest payments) or
add special features to the issue of the debt probably by way of variable interest rate (Bokpin,
2009). The credit channel literature has given considerable attention to the link between
firms’ access to capital and macroeconomic development. This literature principally focuses
on firms’ reliance on debt financing and the related agency in assessing external financing
(Bokpin, 2009).
Korajczyk and Levy (2003) provide evidence of how macroeconomic conditions affect capital
structure choices. According to Korajczyk and Levy (2003) capital structure choice varies over
time and across firms. For example, aggregate equity issues vary pro-cyclically and aggregate
debt issues vary counter-cyclically for firms that have access to public financial markets. In
addition, firms are more likely to issue equity following an abnormal increase in their own
price of equity (Korajczyk, Lucas, and McDonald, 1992). Such observations suggest that both
macroeconomic conditions and firm-specific factors drive variations in financing choices and
that these variations differ with the degree of financial markets access available to each firm.
Hackbarth et al. (2006) argue that macroeconomic conditions should have a large impact not
only on credit risk but also on firms’ financing decisions. Indeed, if one determines optimal
leverage by balancing the tax benefit of debt and bankruptcy, then both the benefit and the
costs of debt should depend on macroeconomic conditions. The tax benefit of debt obviously
depends on the level of cash flows, which in turn should depend on whether the economy is
in an expansion or in a contraction (Hackbarth et al., 2006). In addition, Hackbarth et al. (2006)
argue that, bankruptcy costs depends on the probability of default and the loss given default,
both of which should depend on the current state of the economy. As a result, variations in
macroeconomic conditions should induce variations in optimal structure.

10
Levy and Hennessy (2007) found that firms that exhibit low degrees of financial constraints
have pronounced counter-cyclical leverage, with much of the variation attributed to changes
in macroeconomic conditions. Levy and Hennessy (2007) also found that firms that exhibit
higher degrees of financial constraints do not exhibit these highly pronounced counter-
cyclical leverage or debt issuance patterns. This presupposes that financing choices vary
systematically with macroeconomic conditions (Bokpin, 2009).
Research on capital structure decisions is complicated when it is conducted in an international
context, particularly in developing countries where markets are characterised by regulatory
controls and institutional constraints (Haron, 2014). Most of the well-developed literature has
tended to concentrate on capital structure decisions in developed economies, and has
provided varying conclusions. Empirical literature on capital structure decisions in emerging
market economics is scant (Bokpin, 2009).
It is important to examine firm characteristics and macroeconomic factors impact on
corporate leverage in emerging market economies given the differences in the levels of
economic development. This study seeks to ascertain whether evidence from an emerging
market economy will confirm or contradict existing literature from developed economies.
Hopefully this will contribute to existing literature on the impact of macroeconomic factors
and firm-specific variables on the capital structure decisions of firms. In addition, the research
also contributes in understanding whether there is capital rationing in the capital markets in
South Africa.
2.2. Capital structure theories
2.2.1. Modigliani and Miller Theorem
Modigliani and Miller’s (1958) seminal paper forms the foundation of modern capital
structure theories and studies. Before their paper was published in 1958, there was no
generally accepted capital structure theory or a theory that at least provided some basis for
a discussion on how firms make decisions concerning their capital structure. At the core of
the theory, is the view that funding decisions shouldn’t affect the value of the firm and its
future performance, the so-called “irrelevance of capital structure theory”. Based on the
assumption of perfect markets, Modigliani and Miller (1958) postulated two propositions.
According to their first proposition (“Proposition 1”), the market value of a firm is
independent of how it’s funded (i.e. the mix of debt and equity in the capital structure is
irrelevant). Under this proposition, the corporate executives of a firm need not worry about
the composition of the firm’s capital structure, as this doesn’t affect the value of the firm. In
addition, bonds and stocks are assumed to trade in a perfect market, which means that they
should be regarded as a complete substitute of one another and yield the same return.
Perfect markets also assume frictionless capital markets where there are no transaction costs,
etc. Through the use of arbitrage theory, Modigliani and Miller (1958) show that investors can
keep the value of the firm independent of its debt-equity structure.

11
Their second proposition (“Proposition 2”) postulates that the expected return on equity
changes linearly with the firm’s leverage ratio (i.e. measured by its debt-to-equity ratio). The
expected return on equity is equal to the expected return on the equity of an unlevered firm
plus a premium related to the financial risk (which premium is equal to the debt-equity ratio
times the spread between return on equity of an unlevered firm). This proposition suggests
that any substitution of debt with equity or the other way around should not affect the firm’s
cost of capital. The introduction of more debt in the capital structure to reduce the overall
weighted average cost of capital (“WACC”) should increase the risk of financial distress and/or
default risk. Therefore, the increased financial distress will lead to equity capital providers
demanding a premium for their capital and hence there is no real reduction in the firm’s
WACC as a consequence of it raising more (cheaper) debt. In essence, the use of leverage has
no effect on the firm’s WACC and an investment decision can be isolated from the firm’s
financing decision.
The foregoing propositions have been widely criticised and have also been shown not to be
valid under certain circumstances. The irrelevance theorem is valid if the perfect market
assumptions underlying the analysis are true. The real world is however characterised by
various imperfections and frictions. For instance, the introduction of the deductibility of
interest for income tax purposes, the impact of transaction costs, and the notion of non-
frictionless markets (i.e. the friction that arises from asymmetric information in financial
markets) makes the ability to test these propositions complicated and the proofs are far from
tidy.
The contribution of Modigliani and Miller (1958) has nonetheless provided the basis for
further debate, which has resulted in other theories emerging and advancing this very
important discussion. Today the Modigliani and Miller (1958) propositions are no longer
controversial as a matter of theory and the economic intuition is simple; it is equivalent to
asserting that in a so-called “perfect-market supermarket” the value of a pizza does not
depend on how it is sliced (Myers, 2001).
2.2.2. Agency costs theory
A significant portion of the research conducted in the 1980s was devoted to models in which
capital structure is determined by agency costs, i.e. costs due to conflicts of interest (Harris
and Raviv, 1991). The theoretical debate in this regard was initiated by Jensen and Meckling
(1976), based on the work that was done earlier by Fama and Miller (1972). Jensen and
Meckling (1976) identified two types of conflicts. Firstly, the conflict between shareholders
and managers that arise because managers hold less than 100% of the residual claim.
Secondly, the conflicts between debt investors and equity investors that arise because the
debt contract gives equity investors an incentive to invest sub-optimally.
The first conflict has the consequence that managers do not capture the entire gain from their
profit enhancement activities, but they do bear the entire costs of these activities. For
example, managers can invest less effort in managing firm resources and may be able to

12
transfer firm resources for their own, personal benefit, e.g., by consuming “perquisites” such
as corporate jets, plush offices, exorbitant team building initiatives, etc. (Harris and Raviv,
1991). The managers bear the entire costs of refraining from these activities but capture only
a fraction of the gain. As a result, managers overindulge in these pursuits relative to the level
that would maximise firm value. A mechanism to curb this type of conflict is to ensure that
managers have some “skin in the game” by having them hold some of the firm’s equity as
well.
According to the Jensen and Meckling (1976) model, holding constant the manager’s absolute
investment in the firm, increases in the fraction of the firm financing through debt increases
the manager’s share of the equity and mitigate the loss from the conflict between the
manager and shareholders. Moreover, as pointed out by Jensen (1986), since debt commits
the firm to pay out cash, it reduces the amount of free cash available to managers. Debt
creation, without retention of the proceeds of the issue, enables managers effectively to bond
their promise to pay out future cash flows (Jensen, 1986). By issuing debt in exchange for
equity, managers bond their promise to pay out future cash flows in a way that a simple
dividend increase does not. In doing so, they give debt providers the right to take the firm
into bankruptcy court in the event of default of debt repayment. Thus, debt reduces the
agency costs of free cash flow by reducing the cash flow available for spending at the
discretion of the managers (Jensen, 1986). Jensen (1986) asserts that these control effects of
debt are a potential determinant of capital structure.
The second conflict materialises because debt contracts provide that if an investment yields
large returns, significantly in excess of the costs of debt, the equity investors capture the full
value of most of the gain. If however, the investment fails, because of limited liability, the
debt investors will bear the full brunt of the consequences. Although Jensen and Meckling
(1976) do not discuss this in their paper, the full consequences will depend on loss given
default, the probability of default and the exposure at default. According to Jensen (1986),
equity holders may benefit from the bankruptcy resulting from investing in very risky projects,
even if they are not value-enhancing. Risky projects can reduce the value of the debt when
the actual cash flows from the projects are significantly lower than the forecast cash flows at
the outset. Debt investors prefer the primary source of the debt repayments to come from
internally generated cash as compared to debt repayments being funded by the perfection of
security and/or refinancing arrangements.
Following from the above, the loss in value of the equity from the poor investment can be
more than offset by the gain in the equity value captured at the expense of debt holders.
Equity investors bear this cost to debt investors, however, if the debt investors correctly
anticipate equity investors’ future behaviour when the debt is issued (Jensen and Meckling,
1976; Harris and Raviv, 1991). In this case, the equity investors receive less for the debt than
they otherwise would. Thus, the cost of the incentive to invest in value-decreasing projects
funded by debt is borne by the equity investors in the firm which issues the debt. This effect
is generally called the “asset substitution effect”, and is an agency cost of debt financing

13
(Harris and Raviv, 1991). Obviously, conflicts between security holders do not arise if each
investor holds all securities in proportion to their values, i.e., if each investor holds a “strip”.
Jensen and Meckling (1976) argue that an optimal capital structure can be obtained by trading
off the agency cost of debt against the benefit of debt. A number of implications follow. First,
one would expect bond contracts to include features that attempt to prevent asset
substitution, such as interest coverage requirements, prohibitions against investments in new
unrelated lines of business, prohibitions of certain types of distribution and governed gearing
going forward (Harris and Raviv, 1991). Second, industries in which the opportunities for asset
substitution are more limited will have higher debt levels, ceteris paribus. Thus, for example,
the theory predicts that regulated public utilities, banks and firms in mature industries with
few growth opportunities, will be more highly levered (Harris and Raviv, 1991). Thirdly, firms
for which slow or even negative growth is optimal and that have large cash inflows from
operations, should carry more debt.
Jensen (1986) asserts that conflicts of interest between shareholders and managers over
dividend payout policies are especially severe when the organisation generates substantial
free cash flow. The problem is how to motivate managers to disgorge the cash rather than
investing it at below the cost of capital or wasting it on organisation inefficiencies. Jensen
(1986) develops a theory that explains: (1) the benefits of debt in reducing costs of free cash
flows; and (2) how debt can substitute for dividends. According to Jensen (1986), the benefit
of debt in motivating managers and their organisations to be efficient has been ignored. He
calls these effects the “control hypothesis” for debt creation.
The previous paragraphs have already pointed out the positive effects of introducing debt to
curtail agency costs and hence the capital structure. Issuing large amounts of debt to buy back
stock also sets up the required organisational incentives to motivate managers and to help
them overcome normal organisational resistance to retrenchment, which the pay-out of free
cash flow requires (Jensen, 1986). The threat caused by failure to make debt service payments
serves as an effective motivating force to make such organisations more efficient.
Stock repurchases using debt or cash also has tax advantages. Interest payments are tax
deductible to the corporation, and that part of the repurchase proceeds equal to the firm’s
tax basis in the stock is not taxed at all. Jenson (1986) recognises that increases in leverage
also have costs. As leverage increases, the usual agency costs of debt rise, including
bankruptcy costs. The optimal debt-equity ratio is the point at which firm value is maximised,
the point where the marginal costs of debt just offset the marginal benefits.
The control hypothesis does not imply that debt issues will always have positive control
effects (Jensen, 1986). For example, these effects will not be as important for rapidly growing
organisations with large and highly profitable investment projects but no free cash flow. Such
organisations will have to go regularly to the financial markets to raise capital. At these times
the capital markets participants have an opportunity to evaluate the company, its
management, and its proposed projects. The control function of debt is more important in

14
organisations that generate large cash flows but have low growth prospects, and even more
important in organisations that must shrink. In these organisations the pressures to waste
cash flows by investing them in uneconomic projects is most serious (Jensen, 1986).
Harris and Raviv (1990a) provide a theory of capital structure based on the impact on
investors’ information about the firm and on their ability to oversee management. The
authors postulate that managers are reluctant to relinquish control and unwilling to provide
information that could result in such an outcome. According to Harris and Raviv (1990a) debt
can become a disciplining device because default allows creditors the option to force the firm
into liquidation and generates information useful to investors. Harris and Raviv (1990a) argue
that informational consequences of debt are twofold: (1) the mere ability of the firm to make
its contractual payments to debt holders provides information; and (2) in default,
management must placate creditors to avoid liquidation, either through informal
negotiations or through formal bankruptcy proceedings. This process, although costly,
disseminates considerable information to investors (Harris and Raviv, 1990a). Due to the
information that becomes available through the above process, management can change
operating polices and funding model.
Stulz (1990) argues that financing policy matters because it reduces the agency costs of
managerial discretion. According to Stulz (1990), these costs exist when management values
investment more than shareholders do and has information that shareholders do not have.
Stulz (1990) argues that managerial discretion has two costs: an overinvestment cost that
arises because management invests too much in some circumstances and an
underinvestment caused by management’s lack of credibility when it claims it cannot fund
positive net present value projects with internal resources. A debt issue that requires
management to pay out funds when cash flows accrue reduces the overinvestment costs but
exacerbates the underinvestment cost (Stulz, 1990). Also, when resources under
management’s control increases due to equity capital rising, the risk of overinvestment
increases vs. the decline in underinvestment.
Table 1 provides a summary of the comparison of agency models based on manager-
shareholders conflicts.
Table 1 - Summary of agency models
Model Conflict Benefit of Debt Cost of Debt
Jensen and Meckling ( 1976)
Managerial perquisites
Increase managerial ownership
Asset substitution
Jensen (1986) Overinvestment Reduce free cash Unspecified
Harris and Raviv (1990a)
Failure to liquidate Allows investors option to liquidate
Investigation costs
Stulz (1990) Overinvestment Reduce free cash Underinvestment
Source: Harris and Raviv (1991)

15
2.2.3. Trade – off theory
The trade-off theory developed as a consequence of the recognition that taxation of
corporate profits and the existence of bankruptcy penalties are market imperfections that are
central to a positive theory of the effect of capital structure on firm valuation (Kraus and
Litzenberger, 1973). This theory recognizes that an introduction of debt within the company
capital structure enhances the firm’s after-tax earnings (where interest is deductible in
calculating the corporation’s taxable income); however, this advantage is also offset by the
company’s actual ability to generate profits and cash to service its debt obligation, since a
failure to service the debt obligation will result in a default.
Kraus and Litzenberger (1973) investigated how the deductibility of interest in calculating the
income tax liability, and the potential for firm bankruptcy, influence the value of a firm. Their
paper formally introduced the tax advantage of debt and bankruptcy penalties into a state
preference framework. The market value of a levered firm is shown to be equal to the
unlevered market value, plus the corporate tax rate times the market value of the firm's debt,
less the complement of the corporate tax rate times the present value of bankruptcy costs
(Kraus and Litzenberger, 1973). The value of the firm enhanced by the introduction of debt
into the capital structure was earlier introduced by Modigliani and Miller (1963), when they
made a correction to their paper published in 1958. However, this theory’s shortcomings
were that it assumed that companies could be financed by 100% debt. It failed to recognise
that debt providers would always want some equity cushion (i.e. the “credit enhancement”
afforded by a so-called “equity buffer”) to rank behind their debt exposures.
Modigliani and Miller (1966) investigated the relative importance of factors contributing to
the market value of a typical firm in the utility industry and found that tax subsidy was ranked
second amongst the factors they investigated. Graham (1996) found that the deduction of
interest payments from a firm’s taxable income does in fact contribute to the decision to raise
capital in debt form. The results were consistent with the trade-off theory and earlier studies
(Mackie – Mason, 1990). Whilst trade-off theory appears plausible in theory, there are some
notable exceptions, which occur in practise. If the theory is right, a value-maximizing firm that
is mature and significantly profitable should never pass up interest tax shields when the
probability of financial distress is remotely low (Myers, 2001). There are nonetheless a
number of large of companies that are profitable with very strong growth fundamentals that
have very low levels leverage.

16
Figure 2 - Debt cost - benefit balance
Source: Shyam-Sunder and Myers (1999).
The trade-off theory of optimal capital structure assumes that firm’s balance marginal present
values of interest tax shields against the costs of financial distress. Graham (1996) investigates
whether the incremental use of debt is positively correlated to simulated firm-specific
marginal tax rates that account for net operating losses, investment tax credits, and the
alternative minimum tax. The simulated marginal tax rates exhibited substantial variation due
to the dynamics of the tax code, tax regime shifts, business cycle effects, and the progressive
nature of the statutory tax schedule. Using annual data from more than 10,000 firms for the
years 1980-1992, he provides evidence which indicates that high-tax-rate firms issue more
debt than their low-tax-rate counterparts. All else equal, Graham (1996) postulates that a
hypothetical firm with a tax rate of 46% would annually issue 1.52% more debt, measured as
a percent of capital structure, than an identical firm with a tax rate of 24.0%.
In contrast to the aforementioned studies, Graham (2000) found that firms that use debt
conservatively are large, profitable, liquid, in stable industries, and face low ex ante costs of
distress; however, these firms also had growth options and relatively few tangible assets. It is
also reasonable to infer that firms with fewer tangible assets might serve as deterrent for
debt capital market investors to lend aggressively to the companies in his sample. Companies
that cannot provide tangible security usually have their debt securities priced much higher
than those that do, or they may be forced to issue equity to raise funding instead of debt
(Scott, 1977). Graham (2000) concluded that the companies in his sample were not taking full
advantage of the benefits of debt in order to maximise the value of the firm. Graham (2000)
investigated an equilibrium point of tax benefit and bankruptcy costs, and found that a typical
firm in his study could add 15.7% to the firm’s value if it increased its leverage to the
equilibrium point. Andrade and Kaplan’s (1998) study of thirty one highly leveraged
transactions that ultimately became financially distressed, estimated the financial distress
costs to be between 10% to 20% of a firm’s value.
Market value of Firm
PV Interesttax shields
PV Costs of Financial distress
Optimum Debt
Firm value under all- equity financing

17
The above studies (Modigliani and Miller, 1966; Graham, 1996; Andrade and Kaplan, 1998;
Graham, 2000) all showed that there is a certain balance between the benefit derived from
the deductibility of interest expense and the potential bankruptcy costs; and that these
factors need to be weighed against each other in order to manage the company’s capital
structure and ultimately enhance the value of the firm. The trade-off theory has very high
practical appeal to it. It rationalises moderate debt ratios and is consistent with certain
obvious facts, for example, that companies with relatively safe, tangible assets tend to borrow
more than companies with more risky, intangible assets (Myers, 2001).
2.2.4. Pecking order theory
Another theory was developed by Donaldson (1961), who argued that companies follow a
certain preferential order when it comes to funding i.e. internally generated funds are
preferred to debt as the first call for funding; debt is preferred over equity; and companies
utilise equity funding as their last option. Donaldson’s (1961) work was augmented by Myers
and Majluf (1984), when they argued that firms should issue debt when raising external
capital, and the issue of equity capital should only be resorted to in very rare circumstances
or as a last option. It would be reasonable to infer that, in the world of the pecking order
theory, the optimal capital structure doesn’t exist, as the capital structure is merely
determined by the sequence followed by the firm in fulfilling its capital needs.
Myers and Majluf (1984) assert that equity investors naturally discount the equity value of a
company when it issues equity instead of debt due to information asymmetry and accordingly
corporate executives will only issue equity as a last resort in order to avoid incurring these
costs. Equity is subject to a serious adverse selection while debt has only minor adverse
selection (Frank and Goyal, 2003). According to this view, equity investors always have a view
that the corporate executives have more information about the true value of the firm’s equity
or potential new opportunities available to the company. The possibility that corporate
executives may have more information compared to outside investors is possible due to the
limitation that corporate management teams place on the information they disclose (as some
information may be regarded as providing the company with a competitive edge). Also,
regulatory disclosure limitations/requirements in respect of price sensitive information have
an impact of how much information gets disclosed during a capital raising process.
Myers and Majlufs’ (1984) model assumes that the capital markets are perfect except that
investors do not have all the information that managers have about the value of the stock
and the new investment opportunity being considered by the firm’s managers. The perceived
disparity about the true value of the firm equity leads to investors discounting the price of
the equity issuance. Asquith and Mullins’ (1986) study related to equity issuance and its effect
on share prices, found that 80% of issuances reviewed in their sample were associated with
excess negative announcement day returns. The average negative announcement day return
for all industries was 2.7% and statistically significant. The 2.7% is also significant in monetary
terms as it represents about 38% of the proceeds from the issuance. Therefore, it is

18
understandable that if an optimal capital structure exists, the cost of deviating from it is
insignificant in comparison to the cost of raising external finance.
Frank and Goyal (2003) tested the pecking order theory of corporate leverage on a broad
cross-section of publicly traded firms for 1971 to 1998. In contrast to what is often suggested,
internal financing was found on average, not to be sufficient to cover investment spending
requirements. According to Frank and Goyal (2003) findings, external financing is widely used
with debt financing not dominating equity financing to a significant extent. This is largely
contrary to the pecking order theory prediction. Frank and Goyal (2003) found that net equity
issuances track the financing deficit quite closely, while net debt did not do so.
However, when Frank and Goyal (2003) considered a narrower sample of firms, the greatest
support for the pecking order theory was found among large firms during the earlier years in
the survey data. Over time, support for the pecking order theory declines because more small
firms were publicly traded during the 1980s and 1990s than during the 1970s; and since small
firms do not follow the pecking order theory, the overall average moves further from that
predicted by the pecking order theory. However, the time period effect is not entirely
attributable to more small firms being publicly traded during the 1990s; even when the data
is restricted to the largest quartile firms, support for the pecking order theory declines over
time, and equity funding becomes more important (Frank and Goyal, 2003).
Since the pecking order theory is based on a difference of information between corporate
insiders and the market, its driving force is adverse selection. The evidence from Frank and
Goyal (2003) shows that firm size is critical. There is a monotonic improvement of the
performance of the pecking order predictions as the firm size increases. Overall, Frank and
Goyal (2003) results show that the smallest firms do not follow the pecking order, but the
largest firms do, and the medium-size categories are somewhat pecking order-like over the
same time period. There is strong evidence that at least some aspects of firms’ financing
patterns have changed over time (Frank and Goyal, 2003).
2.2.5. Market timing
The trade-off theory and the pecking order theory discussed above implicitly assume semi-
strong form market efficiency. However, there is a large volume of literature that suggests
market inefficiency at the firm level (Loughran and Ritter, 1995; Ikenberry, Lakonishok and
Vermaelen, 1995; Loughran and Vijh, 1997). Moreover, there are studies that suggest market
inefficiency at both an industry and market level (Loughran, Ritter and Rydqvist, 1994;
Pagano, Panette and Zingales, 1998; Baker and Wurgler, 2000; Lowry, 2003). The market
timing theory does not depend on the postulation of semi-strong form market place
effectiveness (Jahanzeb, Rehman, Bajuri, Karami and Ahmadimousaabad, 2014). Market
timing theory assumes that market inefficiency and company leverage reflect an executive
management team’s ability to time markets. In terms of this theory, managers implement
capital raising strategies when markets are most receptive to them after weighing the relative
costs.

19
In corporate finance, “equity market timing” refers to the practise of issuing shares at high
prices and repurchasing at low prices (Baker and Wurgler, 2002). According to Baker and
Wulger (2002), the intention is to exploit temporary fluctuations in the cost of equity relative
to the costs of other forms of capital. This can be contrasted to the Modigliani and Miller
(1958) theory, where funding instruments have the required return and there is no benefit
from substituting debt with equity or vice versa. The market timing theory recognises that
capital markets are inefficient and are not strong-form efficient in the sense of Fama (1970),
and consequently a firm’s managers can time the issue of debt or equity depending on the
different pricing of the different instruments.
Earlier studies (Taggart, 1977; Marsh, 1982; Jalilvand and Harris, 1984; Asquith and Mullins,
1986) used past stock returns to detect equity market timing. More recent studies such as
Rajan and Zingales (1995), Graham and Harvey (2001), Hovakimian, Opler and Titman (2001)
and Baker and Wurgler (2002) have used market to book values to detected market timing.
Some empirical evidence supports market timing theory in the sense that managers wait for
general market conditions to improve before they execute a new issuance. The reality is, the
studies in this area still lack theoretical models. Consequently, different opinions have been
explained by different authors while interpreting market timing (Johanzeb et al., 2014). For
instance Hovakimian, Hovakimian and Tehranian (2004), Alti (2006) and Kayhan and Titman
(2007) have confirmed the existence of market timing for securities issuance, though they
disagree with Baker and Wurgler (2002) on the persistence of the effect of market timing on
capital structure.
The earliest studies on equity market timing use debt-equity ratios as an indicator of long-
term debt capacity, and find that firms base their stock and bond issuance decisions on the
need for permanent capital and on their long-term debt capacity. The market timing theory
has in the past been investigated on the basis that firms tend to issue equity when their
market valuations are high relative to book values or past market values. However, proper
interpretation of the findings is made difficult by the confounding effects of other
determinants of financing decisions (Alti, 2006).
Taggart (1977) uses debt-equity ratios as a determinant of long-term debt capacity, and uses
an estimation technique that explicitly accounts for balance sheet interrelationships. Taggart
(1977) finds that firms base their equity and bond issuance decisions on the need for
permanent capital and on their long-term debt capacity. Firms can rely on permanent capital
increases to the extent that they can retain earnings, while any shortfall may be made up
through bond and equity issues. Firms also watch their debt capacity however, and if bond
issues lead to excessive debt levels, equity issues will be stimulated as a countermeasure.
Since the rebalancing to the permanent capital targets are shown to be relatively slow, liquid
assets and short-term debt play an important role in absorbing short-run fluctuations in the
external financing deficit. Taggart (1977) found some evidence that timing strategies may
speed up or postpone firms’ adjustments to their targeted capital structure.

20
Baker and Wurgler (2002) investigated how equity market timing affects the capital structure.
Baker and Wurgler (2002) attempt to capture market timing by focusing on the historical
market-to-book time series. The idea is to identify as market timers those firms that raise
most of their capital at high market valuations. Their main sample is the COMPUSTAT firms
that they can determine an IPO date for during the period between 1968 and 1998. Baker and
Wurgler (2002) found that the net effect of high market-to-book value is to lower leverage.
At IPO + 3 (i.e. IPO +1 denotes the change in leverage from the end of the IPO year to the end
of the IPO + 1 year), a one standard deviation increase in market-to-book was associated with
a 1.14 percentage point decrease in leverage.
In addition, Baker and Wurgler (2002) determined whether market-to-book affects leverage
through net equity issues, as market timing implies. By dividing changes in leverage ratio into
equity issues, retained earnings and the residual change in leverage, and regressing these
three components of changes in leverage on the mark-to-market ratio and other independent
variables (i.e. tangible assets, profitability and size) their results indicate that the effect of
market-to-book on changes in leverage does indeed come through net equity issues. These
results are consistent with Marsh (1982) that found that higher market-to-book is associated
with higher net equity issues. Baker and Wurgler (2002) found that low-leverage firms tend
to be those that raised funds when their valuations were high, and conversely high-leverage
firms tend to be those that raised funds when their valuations were low.
Also, another question of interest for Baker and Wurgler (2002) was whether market timing
has a short-run or a long-run impact. The question is relevant because market timing could
be just an opportunistic phenomenon whose effect is quickly rebalanced away. Baker and
Wurgler (2002) found that fluctuations in market valuations have large effects on capital
structure that persist for at least a decade. Baker and Wurgler (2002) document this
persistence in three separate ways. First, they use the leverage regressions that control for
the current market-to-book. This leaves the weighted average to pick up only the within-firm
time series variation. The variation helps to explain capital structure outcomes and this
implies that temporary fluctuations in market valuations. A second test for persistence is in
regressions that control for initial capital structure level and look at how subsequent
fluctuations in market valuations move capital structure away from this initial level. A third
test for persistence is to look at the power of lagged values of the weighted average market-
to-book variable.
Baker and Wurgler (2002) found that the impact of past market values turns out to have a
half-life of well over 10 years. For example, capital structure as for the year 2000 depends
strongly upon variation in the market-to-book ratio from 1990 and before, even controlling
for the 1999 value of market-to-book. These results are hard to understand within traditional
theories of capital structure. According to Baker and Wurgler (2002) the most realistic
explanation for the results is that capital structure is largely the cumulative outcome of past
attempts to time the equity market. In this theory, there is no optimal capital structure, so
market timing financing decisions just accumulate over time into the capital structure

21
outcome. Baker and Wurgler (2002) argue that this simple market timing theory of capital
structure appears to have substantial explanatory power, challenging both the static trade-
off and pecking order theories.
Baker and Wurlgler (2002) measure is subject to the same criticism that applies to previous
studies. A history of concurrent increases in external funding needs and the market-to-book
value ratio is likely to proxy for underlying firm characteristics, most notably the long-term
growth traits that dictate low optimal leverage ratios (Alti, 2006). To the extent that
contemporaneous control variables are noisy proxies for these characteristics, a spurious
relation between history and capital structure may obtain. Therefore, Alti (2006) argues that
there is need to isolate market timing when analysing its long term effects on leverage and
hence he proposes to measure market timing during a single financing event window by
focusing on initial public offering in order to attempt to capture market timing and its impact
on capital structure in the long term.
Kayhan and Titman (2007) have also been sceptical whether the significance of the historical
market-to-book in leverage regressions may just be as result of the noise market-to-book
ratio. Kayhan and Titman (2007) decompose the external finance weighted average market-
to-book ratio into the mean market-to-book ratio and the covariance between the market-
to-book ratio and the refinancing deficit. They show that the persistence result of Baker and
Wurgler (2002) is mainly driven by the persistence of the average market-to-book ratio rather
than the covariance between the market-to-book ratio and the financing deficit.
In contrast to Kayhan and Titman (2007), Hennessy and Whited (2005) question the
interpretation, rather than the robustness of history effects on capital structure. Hennessy
and Whited (2005) show that a dynamic trade-off model with no market timing opportunities
is able to replicate the empirically observed link between the historical market-to-book series
and current leverage (Alti, 2006). In their model, a high market-to-book firm finances growth
with equity to avoid financial distress. Once profitable, such a firm finds a leverage increase
unattractive for personal tax reasons, as issuing debt necessitates increasing payout to equity
holders (Alti, 2006).
Alti (2006) paper examines the capital structure implications of market timing. Alti (2006)
isolate timing attempts in a single major financing event, the initial public offering, by
identifying market timers as firms that go public in hot issue markets. According to Alti (2006)
hot issue markets are characterized by high IPO volume in terms of the number of issuers and
cold issue market is characterised by low IPO volume. The paper finds that hot-market IPO
firms issue substantially more equity, and lower their leverage ratios by more, than cold-
market firms. The Alti (2006) sample consists of all IPOs between 01 January 1971 and 31
December 1999, reported by Securities Depository Company (“SDC”).
Alti (2006) found that hot-market IPO firms issue substantially more equity, and lower their
leverage ratios by more, than cold-market firms do. The average cold-market firm’s IPO
proceeds amount to 54% of its pre-IPO asset value. According to Alti (2006), the same ratio
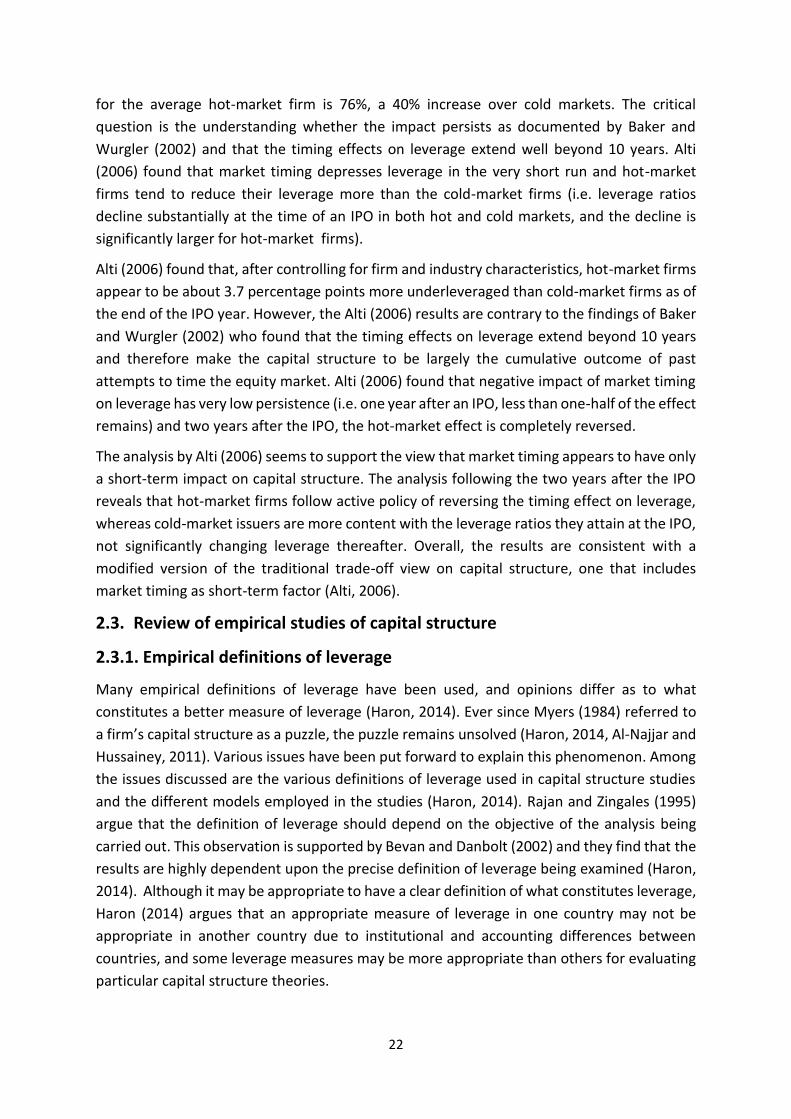
22
for the average hot-market firm is 76%, a 40% increase over cold markets. The critical
question is the understanding whether the impact persists as documented by Baker and
Wurgler (2002) and that the timing effects on leverage extend well beyond 10 years. Alti
(2006) found that market timing depresses leverage in the very short run and hot-market
firms tend to reduce their leverage more than the cold-market firms (i.e. leverage ratios
decline substantially at the time of an IPO in both hot and cold markets, and the decline is
significantly larger for hot-market firms).
Alti (2006) found that, after controlling for firm and industry characteristics, hot-market firms
appear to be about 3.7 percentage points more underleveraged than cold-market firms as of
the end of the IPO year. However, the Alti (2006) results are contrary to the findings of Baker
and Wurgler (2002) who found that the timing effects on leverage extend beyond 10 years
and therefore make the capital structure to be largely the cumulative outcome of past
attempts to time the equity market. Alti (2006) found that negative impact of market timing
on leverage has very low persistence (i.e. one year after an IPO, less than one-half of the effect
remains) and two years after the IPO, the hot-market effect is completely reversed.
The analysis by Alti (2006) seems to support the view that market timing appears to have only
a short-term impact on capital structure. The analysis following the two years after the IPO
reveals that hot-market firms follow active policy of reversing the timing effect on leverage,
whereas cold-market issuers are more content with the leverage ratios they attain at the IPO,
not significantly changing leverage thereafter. Overall, the results are consistent with a
modified version of the traditional trade-off view on capital structure, one that includes
market timing as short-term factor (Alti, 2006).
2.3. Review of empirical studies of capital structure
2.3.1. Empirical definitions of leverage
Many empirical definitions of leverage have been used, and opinions differ as to what
constitutes a better measure of leverage (Haron, 2014). Ever since Myers (1984) referred to
a firm’s capital structure as a puzzle, the puzzle remains unsolved (Haron, 2014, Al-Najjar and
Hussainey, 2011). Various issues have been put forward to explain this phenomenon. Among
the issues discussed are the various definitions of leverage used in capital structure studies
and the different models employed in the studies (Haron, 2014). Rajan and Zingales (1995)
argue that the definition of leverage should depend on the objective of the analysis being
carried out. This observation is supported by Bevan and Danbolt (2002) and they find that the
results are highly dependent upon the precise definition of leverage being examined (Haron,
2014). Although it may be appropriate to have a clear definition of what constitutes leverage,
Haron (2014) argues that an appropriate measure of leverage in one country may not be
appropriate in another country due to institutional and accounting differences between
countries, and some leverage measures may be more appropriate than others for evaluating
particular capital structure theories.

23
Rajan and Zingales (1995) argue that the debt relative to firm value would be the relevant
measure of leverage for studies on agency theory relating to conflicts based on how a firm
has been previously financed. Studies related to the agency problem would use the debt to
firm value definition of leverage, and studies on leverage and financial distress would prefer
the interest-coverage ratio as a proxy for leverage (Haron, 2014). Other definitions of leverage
include total liabilities-to-total assets, debt-to-total assets, debt-to-net assets and debt-to-
market capitalisation. This research does not investigate which definition is the best measure
directly; however, it has taken the leverage measure that has been used in similar studies
globally.
Depending on what is being defined as leverage, studies tend to produce different results.
There is no consensus on whether book or market value debt ratios should be used in capital
structure studies (Cook and Tang, 2010). Some argue that leverage should be computed using
the book value of capital because book ratios are independent of factors that are not under
the direct control of firms (Fama and French, 2002; Thies and Klock, 1992; Cook and Tang,
2010). Other empirical studies prefer market debt ratios. For example, Welch (2004) provides
evidence that market leverage better reflects the agency problems between creditors and
equity holders and can serve as indispensable input into WACC computations (Cook and Tang,
2010).
Book value and market value of leverage have their own proponents. Being unaffected by
volatility of market prices, book-value leverage offers a better reflection of management debt
ratio (Haron, 2014). Market-value leverage, on the other hand, is unable to reflect the
underlying alterations initiated by a firm’s decision makers because it is dependent on several
factors, which are not in the firm's direct control (Haron, 2014). Book-value leverage is
referred to as a “plug number” (Frank and Goyal, 2009) by those who are in favour of market
value leverage because it is used to balance the left hand and right had sides of the balance
sheet rather than a managerially relevant number. Welch (2004) also argues that book-value
leverage can take negative values. It is backward looking and it measures what has already
taken place (Haron, 2014). Market-value leverage, on the other hand is forward looking.
Realising the different nature of these two concepts (book value leverage and market value
leverage), Frank and Goyal (2009) feel that there is no reason for these two concepts to match
thus these differences make it more infeasible to solve the puzzle. Since it is highly possible
that some firms have book value rather than market value targets and vice versa, this research
uses both book and market leverage measures. The definition of book value leverage and
market value leverage used in this research is discussed in Section 6.
2.3.2. Firm characteristics and basic capital structure
Moving away from the theoretical base and despite decades of intensive research, there is a
surprising lack of consensus even about many of basic empirical facts. Over the years some
direction in consensus has been developed that an increase in a firm’s leverage ratio is
positively correlated with the firm’s fixed assets, non-debt tax shield, investment

24
opportunities and firm size, whilst a decrease in a firm’s leverage ratio is negatively correlated
with volatility, profitability, advertising expenses, bankruptcy risk and uniqueness of the
product (Harris and Raviv, 1991).
Bradley, Jarrell and Kim (1984) took a more direct approach, looking at firm-specific data in
testing for the existence of an optimal capital structure. Bradley et al. (1984) found the
existence of certain idiosyncratic factors such as the industry in which the company operates
in and its expenditure on research and development (amongst others) all had a significant
impact on a firm’s capital structure choices. Titman and Wessels (1988) conducted a more
comprehensive study, extending the range of theoretical determinants of capital structure by
analysing the importance of the value of a firm’s tangible assets, the existence of non-debt
tax shields, growth prospects, business uniqueness, industry classification, size, volatility and
profitability as key determinants of corporate capital structure choices. Although Titman and
Wessels’ (1988) results were not conclusive, they served to document empirical regularities
that are consistent with existing theory. In particular, they found that debt levels are
negatively correlated to the “uniqueness” of a firm’s line of business.
Signh and Hamid (1992) conducted the first large scale research on this subject for firms in
developing countries, and it yielded quite unexpected results. The authors found that
corporations in developing countries in general rely very heavily on: (1) external funds and (2)
new issues of shares, to finance growth of their net assets. Signh and Hamid’s (1992) empirical
research results were in contrast with the pecking order theory. They suggested almost the
reverse of the “pecking order” pattern of finance found in developed countries economies
(where firms mostly use retained profits first to finance their investment needs); if more
finance is required, they have recourse to bank loans or long term debt issued in debt capital
markets, and only as a last resort, will they go to the equity markets.
Rajan and Zingales (1995) decided to test some factors across the G-7 countries as the
previous studies had been focused mainly on the United States. In their empirical study, the
authors focused mainly on four factors i.e. tangibility of assets (the ratio of non-current assets
to total assets), the market-to-book ratio, firm size, and profitability. Rajan and Zingales
(1995) zoomed in on these factors as they had provided consistent results in other studies
(Bradly et al., 1984; Harris and Ravin, 1991). Rajan and Zingales’ (1995) research was the
earliest study of cross-country capital structures. Since their research, a number of cross-
country studies have been conducted (Singh, 1995; Deesomsak et al., 2004; Bokpin, 2009;
Gwatidzo and Ojah, 2009; Lemma and Negash, 2013).
Rajan and Zingales (1995) found that firm leverage was more similar across the G-7 countries
than had been previously thought. The factors that were previously identified as related to
the firm leverage in the US were found to be the same across the G -7 countries. However,
the authors also concluded that the potential underpin of the observed correlation remains
unresolved due to the institutional environmental differences between the US and other G-7
member countries. More specifically, the authors were concerned about the institutional
environment role in capital structure determinants and the observed correlation with firm

25
leverage, as they believed that institutional differences have some explanatory power in
explaining the difference in the aggregate capital structure. The institutional environmental
differences investigated by Rajan and Zingales (1995) were: (1) taxation regimes, (2)
bankruptcy law, (3) market based economies vs bank based economies; and (4) ownership
and control structures.
This cross-country empirical work was a significant contribution to empirical studies, as it
moved away from the previous single-country studies. Other studies have also encouraged
contributions on cross-country empirical work of the basic determinants of capital structure
and the role that local country institutions (i.e. regulatory and financial institution) have on
leverage. Deesomsak et al.’s (2004) empirical study in the Asia-Pacific region involving four
countries (i.e. Thailand, Malaysia, Singapore and Australia), found that capital structure
choices were also influenced by the nationality of a country that the sample firms operated
in, as well as firm-specific characteristics in line with the prior empirical studies conducted in
developed countries.
Booth, Aivazian, Demirguc-Kunt and Maksimovi (2001) conducted the cross-country empirical
work focusing on developing countries. They analysed capital structure choices in 10
developing countries, as previous empirical studies (Bradley et al., 1984; Harris and Raviv,
1991; Rajan and Zingales, 1995) had focused mainly on developed economies, which have
similar institutional environments. Booth et al. (2001) found that the same factors that
affected the capital structure decision in developed economies (i.e. United States and
European countries) were also prevalent in the developing countries (India, Pakistan,
Thailand, Malaysia, Turkey, Zimbabwe, Mexico, Brazil, Jordan, and Korea) despite the
profound differences in institutional factors across these developing countries. According to
Booth et al. (2001), knowing these factors helps predict the financial structure of a firm better
than knowing its nationality.
A consistent result that was found by Booth et al. (2001) in both the country and pooled data
results is that the more profitable the firm, the lower the debt ratio, regardless of how the
debt ratio is defined. This particular finding by Booth et al. (2001) is consistent with the
pecking order theory. This also supports the existence of the significant information
asymmetries. This result suggests that external financing is costly and therefore avoided by
firms. However, a more direct explanation is that profitable firms have less demand for
external financing as discussed by Donaldson (1963) and Higgins (1977).
Frank and Goyal (2009) examine the relative importance of many factors in capital structure
decisions of publicly traded American firms from 1950 to 2003. Starting from a large set of
factors that have been used in previous studies, Frank and Goyal (2009) found that a set of
six factors provide a solid basic account of the patterns in their data. According to Frank and
Goyal (2009), the most reliable factors for explaining market leverage are: median industry
leverage (positive relationship), market-to-book assets ratio (negative relationship),
tangibility (positive relationship), profits (negative relationship), log of assets (positive
relationship), and expected inflation (positive relationship). In addition to these six factors,
26
Frank and Goyal (2009) find that an indicator variable indicating whether the firm pays a
dividend is also reliably associated with leverage. Firms that pay dividends have less leverage
than non-payers.
Moyo et al. (2013) use a sample of 49 manufacturing, 24 mining and 23 retail firms listed on
the JSE Limited exchange during the period 2005 – 2010 to investigate the relationship
between leverage and the firm’s key financial performance variables. The Moyo et al. (2013)
study documents that the most significant firm-specific determinants of firm leverage are
liquidity, capital expenditure, ordinary share price and financial distress. Leverage is directly
proportional to cash flow. This is consistent with both the trade-off and agency theories.
Capital expenditure is positively correlated to leverage, while asset tangibility and retention
rate are negatively correlated to leverage. These findings confirm the validity of the pecking
order theory. Liquidity and financial distress are negatively correlated to corporate leverage.
Consistent with the trade-off theory, corporate leverage increases with profitability. Share
price is positively correlated to corporate leverage and this finding validates the market timing
theory.
2.3.3. Macroeconomic variables and basic capital structure
Studies of the relationship between economic conditions and capital structure decisions have
also produced some interesting research. The firm that is well positioned in a growing
economy is expected to grow and generate profits. As profits grow and are converted into
cash, the firm will be expected to fund itself from internally generated cash rather than raising
external capital. This assumption supports the pecking order theory. Understanding of the
impact of macroeconomic conditions on the firm’s basic capital structure decisions and
analysing the impact of macroeconomic factors on the speed of adjustment to the firm’s
targeted capital structure is an important area of empirical study, as companies are not
isolated from the macroeconomic conditions that they operate in.
Macroeconomic factors have been found to have a significant influence on the basic decision
of how to layer a firm’s capital structure and the speed with which that structure can be
adjusted towards achieving a target capital structure. Some researchers have found that firms
issue equity during times when they believe their equity is overvalued. In the study conducted
by Korajczyk et al. (1992) they found the clustering of equity issuances in certain periods of
the economic cycle. According to the study, firms often issue equity in good times, as their
own price of equity has enjoyed an abnormal increase, and this leads to equity recapitalisation
that reduces leverage in the firms. In another related study, Choe, Masulis and Nanda (1993)
provide evidence that firms’ issuance of equity follows business cycles. Choe et al. (1993)
found that firms issue more equity during the growth phase of the business cycle. Similarly,
Korajcyk and Levy (2003) also show that firms issue a type of security when the pricing is
favourable. Firms issue equity when the equity markets have experienced large up-runs and
the economic prospects are viewed as favourable.

27
Korajczyk and Levy (2003) investigated the influence of macroeconomic conditions on
financially constrained and unconstrained firms during the period between 1984 and 1998.
The authors modelled firms’ target capital structure as a function of macroeconomic
conditions and firm-specific variables. Their sample was split based on a measure of financial
constraints. Theoretically, firms are defined as financially constrained if they do not have
sufficient cash to undertake investment opportunities and face severe agency costs when
accessing financial markets. For Korajczyk and Levy (2003), the specific criteria for a firm-
event window to be labelled financially constrained was: (1) the firm does not have a net
repurchase of debt or equity and does not pay dividends within the event window, and (2)
the firms Tobin’s Q, defined as the sum of the market value of equity and the book value of
debt, divided by the book value of assets, at the end of the event quarter should be greater
than one. Firms were labelled unconstrained if they didn’t meet these two criteria.
Mokhova and Zinecker (2014) investigated the influence of macroeconomic factors on
corporate capital structures in different European countries. Their sample consisted of
corporates from seven European countries as Czech Republic, Slovakia, Poland, Hungary,
France, Germany and Greece. Their sample is of interest as it includes both emerging and
developed markets firms. The authors analyse the influence of external determinants on the
corporate capital structure of non-financial manufacturing companies based on their mixed
sample for the period 2006 – 2010, in order to compare the level of the impact on the capital
structure according to the countries’ specifics. For the authors, managers make their financial
decisions according to the source of financing and capital structure based on the company’s
advantages and disadvantages, i.e. its internal characteristics, and doubtless on the
macroeconomic conditions and country specifics, i.e. external factors.
The results obtained by Mokhova and Zinecker (2014) vary across countries and depend on
corporate debt structure. Thus, in Czech Republic there is a negative significant relation
between inflation and total debt ratio and short-term debt ratio. The GDP growth has non-
significant weak relation with all proxies of capital structure in all investigated countries,
except Greece, where it has significant positive influence on short-term debt ratio. In Slovakia
the inflation rate has weak non-significant relation with corporate capital structure, as well as
in other countries except France, where relations are significant but depends on debt
structure, and Hungary, where its influence negative but non-significant (Mokhova and
Zinecker, 2014).
Mokhova and Zinecker (2014) found Poland, Hungary and Greece have a weak relation
between long-term interest rate and capital structure; furthermore, its direction depends on
corporate debt structure. At the same time in Germany and France both the long-term and
short-term interest rates have positive significant influence on total leverage (Mokhova and
Zinecker, 2014)
Summary of Mokhova and Zinecker (2014) results are shown in table 2 and illustrates the
direction, strength and significance of investigated relations. The variables of monetary policy
are long-term interest rate (LTIR), short-term-interest rate (STIR), inflation rate as GDP

28
deflator (IR) and money and quasi money (M2) as percentage of GDP, which indicate
monetary conditions in general. Fiscal policy is represented by proxies such as central
government debt to GDP (CGD), tax revenue as a percentage of GDP (TR) and income taxes
as a percentage of revenue (IT). The variables unemployment rate (UR) and GDP growth
(GDPg) feature macroeconomic development and stability.
Table 2 - Summary of Mokhova and Zinecker (2014) results
Total leverage LTIR STIR IR CGD TR IT M2 UR GDP
Czech Republic * *
Slovakia ** * *
Poland
Hungary *
Germany ** * ** *
France * * ** * *
Greece
Arrow meaning and significance level of table 2 results.
Indicates a positive correlation
Indicates a negative correlation
* Correlation is significant at the 0.05 level
** Correlation is significant at the 0.01 level
Korajczyk and Levy (2003) found that target leverage is counter cyclical (i.e. there is a negative
relationship between macroeconomic factors and the target capital structure) depending on
the type of sample (i.e. constrained firms vs. unconstrained firms). Leveraged firms in the
financially unconstrained sample vary counter-cyclically with macroeconomic conditions.
Moreover, macroeconomic conditions account for 12% to 51% of the time-series variation in
these firms’ leverage. Also, Korajczyk and Levy (2003) found that firms in the financially
constrained sample have pro-cyclical leverage with macroeconomic conditions accounting for
4% to 41% of the time series variation. This is consistent with balance sheet credit channel
models in which constrained firms borrow more when collateral values are highest, that is,
following high returns in the equity market or high corporate profits corporates turned to be
more attractive to lenders and hence they can take advantage of this window opportunity for
borrowing more (Kiyotaki and More, 1997; Suarez and Sussman, 1999).

29
Korajczyk and Levy (2003) findings support both the pecking order and trade-off theories
discussed in section 2.2.3 and section 2.2.4 respectively. The deviations from target leverage
explain issue choice is consistent with the trade-off theory while the negative relation
between profitability and target leverage is consistent with the pecking order theory.
According to Korajczyk and Levy (2003) indicate that constrained firms fit the pecking order
theory less well than do unconstrained firms: (1) deviations from target leverage explain a
larger fraction of the issue choice for constrained firms; (2) constrained firms have pro-cyclical
leverage, but unconstrained firms have countercyclical leverage; and (3) macroeconomic
conditions play a smaller role in both target leverage and issue choice for constrained firms
than for unconstrained firms.
Muthama, Mbaluka and Kalunda (2013) analysed the influence of macroeconomic factors on
the capital structure of selected Nairobi Stock Exchange (“NSE”) companies. Their research
was aimed at determining the magnitude and direction of the relationship between
macroeconomic variables on corporate capital structures of listed companies in Kenya. The
macroeconomic variables of interest in their study were GDP growth rate, inflation and
interest rates. The study revealed that macro-economic factors have a pronounced influence
on the capital structure of listed entities. The Muthama et al. (2013) sample size consisted of
39 firms in the industrial and allied, agricultural, commercial and allied as well as service
sectors. The sample was comprised of firms that have a clear capital structure consisting of
both debt and equity that were listed on the NSE for the period 2004 to 2008.
Muthama et al. (2013) found 51.2% of the assets in these corporates are funded through debt.
The study further found that when interest rates and inflation are held constant, an increase
in annual GDP growth rate would lead to a 0.1% decrease in debt ratio/leverage. This is
consisted with Gajurel (2006) findings that the GDP growth rate is negatively correlated to
total debt ratio for Nepalese firms. The study also found that with the GDP growth rate and
inflation held constant, a unit increase in interest rates will lead to a 0.6% increase in total
debt ratio while the inflation rate does not influence the total debt ratio. The value of R2 was
0.932, which means there was a strong positive correlation between the observed and
predicted values of the dependent variable. Moreover, the regression model explained
c.87.2% of the variations in the dependent variable.
In the African context, studies have mainly focused on firm-specific characteristics in
understanding the determinants of capital structure decisions (Ramjee and Gwatidzo, 2012;
Moyo et al., 2013). The inclusion of macroeconomic factors in the dynamic capital structure
setting have only recently gained some attention (Bokpin, 2009; Chipeta and Mbululu, 2013;
Muthama et al., 2013). It is important to examine macroeconomic factors and capital
structure decisions from the perspective of emerging market economies given the differences
in the levels of economic development. This study seeks to ascertain whether evidence from
emerging markets economies will confirm or contradict existing literature from the developed
economies. This study also aims to make a contribution by including three macroeconomic
variables in the regression model.

30
2.3.4. Capital markets friction and basic capital structure
“When the music stops, in terms of liquidity, things will be complicated. But as long as the
music is playing, you have got to get up and dance. We’re still dancing”
- Chuck Price, the former CEO of Citigroup (Financial Times, 9 July 2007).
The finance literature shows that, extreme market frictions and the types of capital available
influence a firm’s choices regarding its capital structure. This impact comes through the firm’s
ability to access capital and/or the ability of banks to continue supplying capital during capital
markets’ disruptions. The financial crisis of 2007 – 2009 provided strong anecdotal evidence
that capital supply constraints and the stability of capital markets matter to firms. Recent
empirical findings in Duchin et al., (2010) and Almeida, Campello, Laranjeira and Weisbenner
(2012) support this view. There is also a significant literature that shows that the regulation
of banks and the adoption of capital requirements in the banking sector have had an impact
on credit supply, which has in turn indirectly impacted on the leverage available to corporates
(Peek and Rosengren, 1995; Lown and Peristiani, 1995; Brinkmann and Horvitz, 1995;
Faulkender and Petersen, 2006; Leary 2009).
There is an emergence of capital structure literature that recognises the relevance of credit
supply (Faulkender and Petersen, 2006; Leary, 2009; Duchin et al., 2010) and the financial
friction in capital markets in explaining the leverage levels of corporates. Leary’s (2009)
research explores the relevance of capital supply frictions for corporate capital structure
decisions. Leary (2009) found that, following an expansion (contraction) in the availability of
bank loans; leverage ratios of bank-dependent firms significantly increase (decrease) relative
to firms with bond market access. The research provides some direction regarding the role
played by the supply-side or the role of credit supply in capital structure policy formulation
by corporate managers. Korajczyk and Levy (2003), Kiyotaki and Moore (1997) and Suarez and
Sussman (1999) have provided evidence that companies do face the challenges of financial
constraints. In addition, Faulkender and Petersen (2006) and Leary (2009) recognised the
importance of financial constraints and incorporated the availability of credit into their
research.
The South African corporate debt capital market is relatively new in the context of the history
of global debt capital markets. The long-term debt capital market reforms in South Africa
lasted nearly two decades starting in the early 1980s. The reforms started with the repealing
of the Prescribed Asset Act in 1989, which prescribed that pension funds should invest 53%
of their “book value” assets in either public sector or cash, and long-term insurers had to
invest the equivalent of 33% of their liabilities, at an actuarial valuation, into government
debt. This resulted in corporate bond issuance being “crowded out” of the domestic debt
capital market, and it was only when this law was repealed that there was an increase in the
supply of debt capital available for corporates through this channel. The first corporate bond
issue in South Africa was by South African Breweries in 1992.

31
Given the short history of the debt capital market and the limited suppliers of capital, it is
insightful to understand whether there is a measure of debt rationing in the South African
debt capital market, and the South African rand crisis of 2001 – 2002 as well as the 2007 –
2009 global financial crisis provides an opportunity for research.
The end of apartheid also enabled South Africa to become part of the global economy and
the global banking system. As consequence, South African Banks were expected to be
compliant with the minimum 8% capital adequacy ratio proposed by Basel I by 1995. Further,
the implementation of Basel II in South Africa from January 2008 imposed an additional 1.5%
on banks’ capital adequacy ratio compared to that imposed by Basel Committee of Banking
Supervision on international banks and/or the G20 member country banks. The introduction
of Basel I and Basel II led to the so called “risk-based capital crunch hypothesis” which argued
that commercial lending slowed down because banks invested in governments bonds in order
to diversify away from 100% risk-weighted assets to 0% risk-weighted assets.
The risk-based capital crunch hypothesis is based on the argument that as banks faced
challenges to raise Common Equity Tier 1 (“CET 1”) and Tier 2, they cut back on their corporate
lending in order to comply with the regulatory requirements under Basel II. Studies (Peek and
Rosengren, 1995; Brinkmann and Horvitz, 1995; Lown and Peristiani, 1995; Thakor, 1996)
based on the capital crunch hypothesis have found evidence that undercapitalised banks tend
slow down lending during the period in which they are trying to build capital to meet
regulatory capital requirements. Thakor (1996) found evidence that a small increase in capital
requirements could make it harder for potential borrowers to access loans, and documented
declining risk appetite amongst banks during the credit crunch, and a rush to stock up on
lower yielding and less risky government bonds. The risk-based capital crunch theory supports
external factor impact, although not investigated specifically in this study.
The global financial crisis of 2007-2009 also provided strong anecdotal evidence that the
supply of capital can be disrupted and this should matter to firms as they always look to
capital markets and the banking sector for the supply of capital. The study conducted by
Fosberg (2012) shows that global equity issuance declined from $ 876 billion in 2007 to $ 471
billion in 2008 (a 46.2% decline). Moreover, debt issuance declined from $ 6.6 billion in 2007
to $4.1 billion in 2008 (a 36.0% decline). The research done by Duchin et al. (2010) support
the view that negative shocks to the supply of capital impacts how firms fund themselves.
Specifically, firms that have greater costs of raising external finance or have the greater need
to do so (i.e. firms that are financially constrained or dependent on external financing)
consider the state of capital markets before embarking on capital raising, and are therefore
affected by shocks to capital markets.
An understanding of the effect of capital supply on firms is relevant for three reasons. Firstly,
variations in the supply of credit may affect the financial and investment behaviour of firms
in a manner that is independent of shifts in monitory policy (Leary, 2009; Rehman, Akbar and
Ormand, 2013). Secondly, there are differences in views about whether the firm’s financing
decision tends to be governed by users’ demand for capital or preferences of the suppliers of

32
capital or driven by outside factors (Rehman et al., 2013). Finally, and interestingly, surveys
of corporate managers and financial intermediaries suggest a dichotomy in the way in which
academics and practitioners view corporate financing decisions: the former perceive
corporate financing decisions to be governed by the demands of the users of capital, whilst
the latter perceive decisions to be governed by the preferences of the suppliers of capital
(Graham and Harvey, 2001; Lemmon and Roberts, 2010).
Figure 3 - Total loans and advances: South African corporates (1995 - 2014)
Source: SARB (2015)
Figure 3 shows the phenomenal growth in corporate loans in South Africa from January 1995
to December 2014. As can be seen from the graph above, corporate lending declined
subsequent to the sub-prime crisis. From November 2008 – April 2010, the corporate lending
rate decline by 8%, which whilst probably not that significant in the global context (especially
at that time), was nonetheless a significant shock to credit supply in South Africa.
In his paper, Graham (2000) argues that firms appear to be significantly under levered and
not maximising value that can be derived from the tax shield stemming from interest
deductibility. This interpretation assumes that firms have the opportunity to increase their
leverage and are choosing to leave money on the table (Faulkender and Petersen, 2006).
However, this view doesn’t take into account the role of financial intermediaries (banks and
financial institutions) that evaluate the credit quality of corporates and provide the debt
capital. The literature has often described banks or lenders as being particularly good at
investigating opaque firms and deciding which creditworthy borrowers are. This suggests that
the source of capital may be intimately related to a firm’s ability to access debt markets
(Faulkender and Petersen, 2006).
Faulkender and Petersen (2006) argue that the same market frictions that make capital
structure choices relevant (information asymmetry and investment distortions) also imply
that firms are sometimes rationed by suppliers of debt capital. This implies that debt levels
-
0,2
0,4
0,6
0,8
1,0
1,2
1,4
Jan-95 Sep-96 May-98 Jan-00 Sep-01 May-03 Jan-05 Sep-06 May-08 Jan-10 Sep-11 May-13
R t
rilli
on
Total loans and advances: South African Corporates

33
within corporates cannot be dependent on the firm characteristics alone. Faulkender and
Petersen (2006) investigated whether, firms that have access to the public bond markets, as
measured by having an independent credit rating, have significantly different leverage ratios
compared to those firms that don’t have access to the public bond markets. The intuition is
that firms that do not have access to the public debt capital markets are constrained in the
amount of debt capital they may raise, and the manifestation of this should be reflected in
lower debt levels on their balance sheets.
Faulkender and Petersen (2006) found that firms which have access to debt capital markets,
determined by their independent credit ratings, have market debt leverage ratios (i.e.
leverage calculated as debt to market value of assets) which are more than fifty percent
higher than firms that do not have access to these debt capital markets (28.4% versus
17.9%(p-value,0.01)). Also, when investigating leverage based on book values, the authors
found that the difference is slightly larger: 37.2% versus 23.5% (p-value<0.01). At first glance,
this difference can possibly be attributed to demand or supply side considerations.
In order to determine whether the differences are driven by the underlying firm
fundamentals, Faulkender and Petersen (2006) included firm characteristics to determine
whether the observed leverage differences between firms with and without independent
credit ratings arose solely due to their demand for leverage. Although the firm characteristics
explain a significant fraction of the variability in debt ratios across firms, Faulkender and
Petersen (2006) found that, even after the inclusion of the firm characteristics, firms with an
independent credit rating are significantly more levered (p<0.01) with debt levels equivalent
to between 7.8% and 8.3% of the market value of the firm higher than firms without access
to public debt capital markets.
According to Flanner (1986) firms issue short-term debt if they expect their credit rating to
improve. Graham and Harvey (2001) found that firms are very concerned about their credit
rating when determining their capital structure. Approximately, 57.1% of the CFO’s surveyed
by Graham and Harvey (2001) said that credit ratings were important in how they formulated
their leverage policies and deciding upon the amount of leverage to assume in the capital
structure of their firms. Credit ratings provide a certain level of comfort around a borrower’s
ability to fulfil their financial commitments (i.e. ratings can act as a signal of a firm’s credit
quality) and also provide the borrower with a wider access to debt capital markets compared
to unrated entities. Kisgen (2006) argues that corporate managers’ concern around credit
ratings are due to the discrete costs (benefits) associated with different ratings levels.
For instance, Kisgen (2006) states that several regulations on bond investments are based
directly on credit ratings i.e. credit ratings levels affect whether particular investor groups
such as banks, life insurance companies or pension funds are allowed to invest in a firm’s
bonds and to what extent such regulated entities (i.e. banks and life insurers) incur capital
cost reserving requirements for investments in such bonds. A change in credit rating implies
a change in credit risk, which usually filters through the pricing of credit instruments issued

34
by a particular corporate. Since credit ratings can either go up or down, this can result in
discrete benefits or costs.
Credit rating can also impact the willingness of asset managers, banks and life insurers to
invest in credit instrument issued by the issuing entities and hence the supply side of credit
matters in the formulation of capital structure decision making. For instance, RMB Global
Markets Research (2015) found that, during the 2014 calendar year, investors in the South
African bond market opted for high quality names (i.e. AA – or better), although buyers could
be found for lower-rated credits provided investors were comfortable with the names. This
indicates that higher rated companies are more likely to be favoured compared to lower rated
companies by the providers of debt capital. Also, there is a broader universe of investors
willing to invest in investment grade than there is willing to invest in high yield credit.
Another research paper that provides evidence of the impact of the supply of credit on a
firm’s financing choices, is the research work done by Choi, Getmansky, Henderson & Tookes
(2010). Choi et al. (2010) investigated the role of convertible bond arbitrageurs as suppliers
of capital1. The aim was to estimate the impact of changes in the amount of capital available
to convertible bond arbitrageurs on observed convertible bond issuance, therefore
establishing whether arbitrageurs determine the amount of convertible debt capital that
corporates can obtain in the presence of market frictions. Choi et al. (2010) regressed
convertible bond issuance on three proxies for the supply of capital: fund flows, returns and
use of leverage, as well as lagged issuance and underpricing. Choi et al. (2010) found strong
evidence that issuance is sensitive to the supply of capital, with positive, significant
coefficients on all lagged supply measures. The authors found that, ceteris paribus, a one-
standard deviation increase in fund flows resulted in a 16.8% increase in issuance. In support
of the supply side view, Choi et al. (2010) provide evidence that the supply of capital is not
frictionless. This is in contrast to the earlier assertions by Modigiliani and Miller (1958).
Another theoretical explanation for the supply side factors is what is called the bank lending
channel, which was practically illustrated by the major credit slowdown in the 1990s,
particularly in the United States following the fall of Dow Jones index in the late 80s. The bank
lending channel theorises that change in monetary policy will shift the supply of
intermediated credit, especially credit extended through commercial banks. In the traditional
“bank lending channel”, a monetary tightening policy may impact on bank lending if the drop
in deposits cannot be completely offset by issuing non-reservable liabilities (or liquidating
some assets). Since the market for bank debt is not frictionless and non-receivable banks’
liabilities are typically not insured, a “lemon’s premium” has to be paid to investors. In this
case, bank capital can affect banks’ external ratings, providing investors with a signal
regarding their creditworthiness (Gambacorta and Marques-Ibanez, 2011).
1 A convertible bond is a bond that may, at the option of the holder, be converted into stock at a specified price for a given time period. Convertible bond arbitragers aim to exploit mispricing in convertible bonds, typically by buying an undervalued convertible bond and hedging equity price risk by taking simultaneously a short position in the equity (Choi et al. 2010)

35
In general, bank capital has an effect on lending if two conditions hold: (1) the first is where
breaking the minimum capital requirement is costly and as a result banks want to limit the
risk of future capital inadequacy (Van den Heuvel, 2002). As capital requirements are linked
to the amount of credit outstanding, the latter would determine an immediate adjustment in
lending. By contrast, if banks have an excess of capital, the drop in capital could easily be
absorbed without any consequence for the lending portfolio. As equity is relatively costly in
comparison to other forms of funding (deposits, senior unsecured debt and subordinated
debt) banks tend to economise units of capital and usually aim to minimise the amount of
capital in excess of what regulators (or the markets) require (Gambacorta and Marques-
Ibanez, 2011); and (2) the second condition is an imperfect market for bank equity: banks
cannot easily issue new equity, particularly in periods of crisis, because of the presence of tax
disadvantages, adverse selection problems and agency costs.
The collapse of the Dow Jones on 19 October 1987, usually referred to as Black Monday, was
a major systemic shock. Not only did the prices of many financial assets tumble, but market
functioning was severely impaired. After this window-event, there was financial chaos around
savings and loans as economic growth dropped off its recovery in the late 1980s to slump into
a period of recession in the early 90s. A key component of this slowdown was the extremely
week level of bank lending around the world. The decline in loan demand during a recession
is not counter intuitive, as banks face challenges of credit quality and there are potentially
less borrowers during the slow expansion environment. But the unusually slow recovery of
credit led to a debate on whether these demand-side explanations were adequate or whether
supply-side problems were driving the credit-crunch.
Sceptics of the credit crunch argue that weak loan growth merely reflects the normal
procyclical pattern of both loan demand and the creditworthiness of borrowers. Thus, the
view that a downward shift in credit supply precipitated, or at least worsened during the 1990
– 91 recession remains a subject with no firm consensus. Because of the difficulty in
determining whether the observed slow credit growth is a demand or supply phenomenon,
convincing evidence of the practical importance of credit crunches remains elusive (Peek and
Rosengren, 1995)
The introduction of Base I emerged as a potential explanation for the weak recovery in credit
supply. There are number of hypothesis that were developed around the Basel I
implementation in order to explain the weaker credit recovery. Berger and Udell (1994)
identify the three different working hypotheses for the credit slowdown. Berger and Udell
(1994) firstly identify the loan examination hypothesis, in terms of which the proponents
argue that increased regulatory scrutiny triggered greater caution amongst commercial
banks. Secondly, Berger and Udell (1994) identify the leverage credit crunch hypothesis,
which argues that risk weighting encouraged banks to substitute risky commercial loans for
safer government bonds, and hence bank lending activities slumped. Lastly, Berger and Udell
(1994) identified the risk-based capital credit crunch hypothesis, which argued that lending

36
slowed down because banks struggled to raise well-priced equity, and hence cut back on their
loan portfolio to meet Basel capital requirements.
The capital crunch model tries to explain recent problems with credit availability by
emphasizing the importance of capital regulation. Banks suffering large losses of capital are
required by regulators to quickly restore their capital ratios (Peek and Rosengren, 1992). With
earnings reduced and investors resistant to purchasing new equity from a capital-depleted
institution, banks satisfy capital-asset ratios by shrinking their assets. This shrinkage
frequently requires the calling-up of loans and/or refusals to either extend credit or renew
limits on existing lines of credit as agreements mature (Peek and Rosengren, 1992).
Peek and Rosengren (1995) looked specifically at New England banks during the crisis period
of 1990 and 1991, and controlled for the impact of weak loan demand in the region, by
comparing loan growth for local banks with different levels of capital. Peek and Rosengren
(1995) found that two conditions necessary for a capital crunch were present: (1) widespread
losses in the bank capital structure; and (2) the stringent application of capital regulation. The
New England real estate bust led to large and widespread declines in bank capital just when
capital requirements took on greater significance, as bank regulators began to enforce both
risk-based capital ratios, adopted to satisfy the international Basel Accord, and the leverage
ratio, adopted domestically (Peek and Rosengren, 1995). The capital crunch impaired the
ability of banks to satisfy the credit demands of the economy during the economic recovery,
limiting the access to credit of legitimate borrowers who happen to be bank-dependent. Peek
and Rosengren (1995) found evidence that banks with lower capital ratios shrank loan supply
or grew credit more slowly than better-capitalised banks, attributing this to an inability to
raise capital in a depressed market.
Brinkmann and Horvitz (1995) support the more general idea that low-capital holding could
have driven the capital crunch. They divide a sample of all US banks between 1987 and 1991
into three categories: (1) undercapitalised, (2) margin surpluses, and (3) large surpluses (when
a surplus is the amount of capital above regulatory minimum). 1987 was the year immediately
prior to the announcement of the risk-based requirements and the establishment of the
timetable for the implementation of those requirements. According to Brinkmann and Horvitz
(1995), after the announcement of the risk-based capital standards in 1988, many banks had
capital that exceed the new requirements by more than it exceed the previously existing
requirements. On the other hand, a fair number of (mostly) large banks failed the new
standards, and a large number met the new standards, but with smaller surpluses than they
had before.
Brinkmann and Horvitz (1995) argue that, if the change in capital requirements did not affect
bank lending, then loan growth at these three groups of banks should not have been
significantly different. However, Brinkmann and Horvitz (1995) found that banks with larger
surpluses under the new standards grew at a faster rate than those with smaller surpluses or
which failed the new standards, even after size and location differences are accounted for.
Secondly, new capital brought into the banking system was used to grow loans at different

37
rates depending on the change in a bank’s excess capital. Larger surplus banks used their new
capital to grow loans at twice the rate that banks with smaller surpluses did. If the slow rate
of loan growth in the early 90s was solely due to a decrease in demand, one would expect
little difference in the growth rates of larger surplus and smaller surplus banks.
Brinkmann and Horvitz (1995) agree that, whether these differences in loan growth actually
left loan demand unmet and created a “credit crunch” cannot be determined unequivocally
without clear knowledge of the loan demand schedule. It is possible that loan demand was
satisfied by growth shown by the larger-surplus banks. However, because the capital
shortages were greatest among the larger banks, it is highly unlikely that the smaller banks
were able to meet fully the credit needs of the larger bank customers. Finally, although not
relevant for this research, Brinkmann and Horvitz (1995) argue that, whether one believes
that the shock to the supply of bank credit caused by the 1988 risk-based capital standards
was sufficient to cause the recession, exacerbate it, or delay the recovery from it, depends on
one’s view of the importance of the credit channel for the transmission of monetary policy.
It is important to note however, that the differences among the three groups of banks
investigated by Brinkmann and Horvitz (1995) are not only statistically significant, they also
involve very large dollar amounts. For example, if all banks had loans increases at a rate equal
to that of the banks with larger surplus (46.2 percent), total bank loans would have grown by
USD 581 billion from 1987 to 1991 instead of USD 370 billion. Despite the artificiality of this
calculation, it does demonstrate that the impact of the regulatory changes in capital
requirements was large enough to have had an impact on supply and a macroeconomic effect.
Lown and Peristiani (1995) also find evidence of capital requirements playing a role in the
credit slowdown, but not through explicit loan rationing. Their sample of US banks between
1988 and 1992 rather indicates that banks raised interest rates, in an effort to pass on costs
and discourage margin borrowers. Thokor (1996) examines the impact of “risk-based” capital
requirements – namely those that link mandatory capital-to-asset ratios for bank to their
loans - on aggregate bank lending. The rules initially required banks to maintain capital equal
to 7.25 percent of business and most consumer loans, with the requirement increasing to 8
percent by the end of 1992. Thokor (1996) explored the impact of risk-based capital-
requirements on credit rationing with multiple competing banks, emphasizing the role of the
banks as a pre-lending screening agent and a post lending monitor. The analysis permits
Thokor (1996) to distinguish between credit rationing by an individual bank and that by the
entire banking system, and focus on the link between the announcement effects associated
with a borrower acquiring a promise of credit and the lender’s capital constraint.
Thokor (1996) main results are as follows. Every borrower approaches multiple banks for
credit and stands a chance of being rationed by the entire banking system. Increases in risk-
based capital requirements and regulatory subsidies stochastically reduce aggregate bank
lending, and banking systems with higher costs of capital lend less and are more affected by
increases in risk-based capital requirements. Also, two important testable predictions of the
model are that the stock price of a borrower should experience an abnormal increase when

38
it is announced that a bank has agreed to lend to it, and this increase should be greater the
more capital-constrained the bank. These predictions were confronted with data on 161 loan
commitments. The empirical results support these predictions. Overall, Thakor (1996) found
evidence that a small increase in capital requirements could make it harder for potential
borrowers to access loans, and also documented a shift in risk appetite amongst banks during
the credit crunch, and a rush to stock up on government bonds.
The method used in this research to examine how shocks to the supply of credit impact firm
financing decisions is the same followed in the work done by Rehman et al. (2013). The study
examined how shocks to the supply of credit during the financial crisis of 2007 – 2009 affected
the financing and investment policies of private companies in the United Kingdom. Rehman
et al. (2013) adopted a fixed effect model with dummy variable equal to one for the period
2007 – 2009 and 0 otherwise (2004 – 2006). Rehman et al. (2013) results highlighted that the
financial crisis adversely affected the leverage ratio of the private firms in the sample. The
effect was most significant on the short term financing channels such as short-term debt and
trade credit. As a consequence, private firms held cash and issued equity to hedge the
negative effect of credit contradictions.
For Rehman et al. (2013), the main variable of interest is the crisis dummy (i.e. its sign and
significance). Their model highlighted that the coefficient on the crisis dummy is negative and
significant at the level of 1% or better. The interpretation of the results is that, the financial
crisis had a negative impact on firm’s total debt ratio. This suggests that supply of credit is an
important determinant of firm financing decisions (Rehman et al., 2013). The results show
that the disruption of credit supply has an impact on the financing of firms and hence their
capital structure.

39
2.3.4.1. Characteristics of capital markets friction
2.3.4.1.1. Credit spreads
Figure 4 - Historical credit spreads (2003 – 2014)
Source: Standard Bank Financial Markets Research (2015)
One notable recurring characteristics of extreme capital supply friction in the debt capital
markets is the phenomenon of large credit spreads. For certain, disruption to the financial
markets in South Africa has been at the epicentre of the Global Financial Crisis (2007 – 2009)
and the Rand crisis (2001 – 2002). The South African credit spreads increased significantly
during the global financial crises. The increase was more severe for corporates and domestic
banks that issue their debt instrument on BESA.
Quantifying the real effects of credit frictions requires identification of exogenous shifts in
credit supply, which reflect financial stress, separately from shifts in credit demand, which
can reflect other factors. Finding an appropriate variable that isolates shifts in credit supply –
particularly for South Africa, is difficult. Credit spreads on corporate bonds have been
identified in the literature as a reasonable proxy of the external finance premium and hence
credit frictions (Bernanke and Gertler, 1995). However, the corporate bond market in South
Africa has deepened only in the late 90s and remains highly dominated by highly rated
institutions such as banks and few blue chip corporates. According to the credit channel
theory, the external finance premium is the difference in cost between funds raised externally
(by issuing equity or debt) and funds generated internally (by retaining earnings).
2.3.4.1.2. Sudden decline in debt issuance
The South African listed debt capital market is fairly new in the global context and it is still
growing. In addition, the debt market is liquid and well developed in terms of the number of

40
participants and their daily activity. Since the first corporate bond issuance in 1992, the JSE
Debt Board has had more than 1500 corporate debt instruments listing. Although data is very
difficult to source for the period before 2005, the research below provides an analysis of debt
market issuance post 2005 and the trend during the 2007 – 2009 periods. Figure 5 shows the
South African corporate debt issuance on an annual basis for the calendar year 2005 to 2014.
2015 debt issuance is for the 3 months ended 31 March 2015.
Figure 5 – South African corporate historical debt issuance (2005 – 2015)
Source: BESA (2015)
Corporate debt issuance declined by 9% year-on-year in the calendar year 2007 from the
credit boom experienced in 2006 when debt issuance amounted to R 11.6 billion. The decline
was more severe in 2009 when the market issuance was only R 1.5 billion and fell by 87.02%
relative to the peak of R 11.6 billion during the 2005 – 2009 periods. Given that the vast
majority of listed debt securities on JSE Debt Board are rated, and that some literature
(Kisgen, 2006) argues that an independent credit rating gives firms better access to debt
capital markets compared to firms that are not rated, the empirical question is what caused
the decline in issuance. From a theoretical perspective, it’s possible to argue that although
companies with credit ratings can access capital from these markets there may be some other
factors that caused the decline in corporate debt issuance at this time.
This research argues that there is a supply side effect in the market and that exogenous shocks
on the supply of capital have varying impacts on capital structure selection regardless of the
firm’s abilities to raise capital (i.e. investment-grade vs. non-investment or large vs. small
firms). These views are related to a new strand of corporate finance literature, that
demonstrate that the supply of debt capital, whether in the form of bonds or loans, as well
as factors from the demand side, determine corporate capital structure, due to market
5,87
11,60 10,51
3,241,51
16,3313,83
29,0825,92
22,49
5,51
0,00
5,00
10,00
15,00
20,00
25,00
30,00
35,00
2005 2006 2007 2008 2009 2010 2011 2012 2013 2014 2015YTD
South African corporate historial debt issuance - R'billion
Corporates

41
segmentation or friction in substituting multiple sources of capital. Kahle and Stulz (2013)
explore the impacts of supply (lending or credit) shock and demand shock on corporate
policies during the 2007 credit crisis. The supply shock channels indicate that firms that rely
on bank loans or credit would have had to reduce debt issuance and capital expenditure
during the 2007 – 2009 credit crisis because this period resulted in a severe credit contraction
and tighter lending criteria.
2.3.4.1.3. Currency volatility
Historically, capital flow bonanzas have often fuelled sharp credit expansion in advanced and
emerging market economics alike. Focusing primarily on emerging markets, Magud, Reinhart
and Vesperoni’s (2014) study analyses the impact of exchange rate flexibility on credit
markets during periods of large capital inflows. Magud et al. (2014) show that banking credit
accelerates during capital inflow booms, and the real growth rate of credit peaks a couple of
years before capital flows reverse. During the reversal stage of the cycle, however, real credit
growth markedly slows down. Magud et al. (2014) also note that real growth in banking credit
to the private sector collapses during inflow reversals. In addition, real credit growth stabilises
at a rate substantially lower than that of the boom phase after the capital flows reversal
episodes. Figure 6 shows the monthly USDZAR exchange rate movement from 31 December
1995 to 31 December 2014.
Figure 6 - USDZAR exchange rate (1995 – 2014)
Source: Bloomberg (2015)
South Africa is no stranger to currency crashes. Figure 6 has about 3 or 4 crashes in the
USDZAR exchange rate. In 1998, the rand depreciated by 28%, the SARB raised interest rates
by a panicked 700 basis points and it lost billions of dollars trying to prop up the rand. The
result: the economy went into recession and share prices declined sharply. In 2001, the rand
lost yet another 26% against the dollar on the back of South African’s policies and some ill-
0
2
4
6
8
10
12
14
16
Dec-95 Dec-97 Dec-99 Dec-01 Dec-03 Dec-05 Dec-07 Dec-09 Dec-11 Dec-13
USDZAR Exchange rate

42
considered technical changes in the implementation of exchange controls, than with external
factors.
2.3.5. Macroeconomic conditions and capital structure adjustment speed
Although there are corporate capital structure theories aimed at explaining firms’ financing
decisions, little is known about how macroeconomic conditions affect the adjustment speed
of capital structure towards target leverage (Cook and Tang, 2010). The primary existing
theories of corporate capital structure attempt to explain firms’ financing decisions and
provide an insight on how firms adjust their leverage by looking at the cost and the benefits
of each strategy.
Gertler and Gilchrist (1994) studied five periods of contractionary monetary policy (i.e. 1968,
1974, 1978, 1979, and 1988) to determine the effect of contractionary monetary stance on
firms’ financing decisions. The empirical results of their study indicate that during periods of
monetary policy tightening, short-term borrowings deteriorate for smaller firms and
commercial paper (i.e. short-term funding) financing rises for larger firms. Hence a period of
contractionary monetary policy suggests good macroeconomic state, an increase in discount
rate or a decrease in money supply directly affect long-term debt financing, which may
influence firms’ financing decisions and capital structure adjustment process (Camara, 2012).
Boyd and Smith (1996) argue that, in a developing economy, firms will finance with more
equity due to higher efficiency in the financial intermediation of capital markets. This implies
that the debt ratio of firms is negatively related to economic development due to the greater
proportion of equity capital used in the course of the development of that economy. Despite
the proliferation in capital structure literature, little attention has been paid to the effects of
macroeconomic conditions on credit risk, capital structure choices and the adjustment to the
target leverage (Hackbarth et al., 2006). This is relatively surprising since economic intuition
suggests that the economy’s business cycle phase should be an important determinant of
default risk, and thus, of financing decisions and the adjustment of these financing decisions.
It is submitted that it is important to try and understand how corporates adjust their leverage
given certain macroeconomic conditions.
Banerjee et al. (2000) (the pioneers of capital structure studies in this domain) stated the
following: (1) the observed leverage in empirical studies need not necessarily be the optimal
leverage; and (2) the empirical studies which are non-dynamic in nature are not able to
provide information about the dynamic nature of capital structure adjustment by firms.
Banerjee et al. (2000) found that firms with better growth prospects adjust their optimal
structure much more slowly, whilst larger ex growth companies make these adjustments
much faster.
Earlier studies on how macroeconomic conditions impact capital structure (Choe et al., 1993;
Korajczyk and Levy, 2003) found that macroeconomic states are non-trivial factors for firm’s
financing decisions. Since macroeconomic conditions vary over time (i.e. the economy
experiences the natural business cycles of expansion and contraction), capital structure

43
decisions including the capital structure adjustment process also vary over time and across
firms as macroeconomic conditions change (Camara, 2012). Hackbarth et al. (2006) study also
shows that macroeconomic conditions have a significant effect on target capital structure;
which also implies an effect of macroeconomic dynamics on the capital structure adjustment
process, in the event of deviation from target.
Using two dynamic partial adjustment capital structure models, Cook and Tang (2010)
estimated the impact of several macroeconomic factors on the speed of capital structure
adjustment toward target leverage; they found evidence that firms adjust their leverage
toward target faster in good macroeconomic conditions than they do in bad macroeconomic
conditions. Cook and Tang’s (2010) evidence holds whether or not firms are subject to
financial constraints. These empirical findings of Cook and Tang (2010) support the findings
of Hackbarth et al. (2006) that firms adjust to their target leverage faster in good
macroeconomic conditions relative to how they do so under bad macroeconomics conditions.
Drobetz and Wanzenried (2006) stated that macroeconomic conditions affect a firm’s
adjustment speed in its capital structure. They found that firms adjust their capital structure
faster in favourable macroeconomic conditions. However, Rubio and Sogorb (2011) have
found that when they define either good or bad macroeconomic conditions as an additional
explanatory variable in the model, then Spanish firms adjust their capital structure back to
target leverage faster in a bad macroeconomic conditions than in good macroeconomic
conditions. Rubio and Sogorb (2011) results contradict the previous international evidence
(Tzang, Wnag and Rahim, 2013).
Related to agency problems, Levy and Hennessy (2007) find evidence of a tactical managerial
activism, in which financial managers’, actively substitute equity for debt during economic
expansion, and debt for equity during economic contractions. Such tactical rebalancing of
debt and equity in different macroeconomic conditions serves a signalling function, in terms
of which managers during economic contraction deliberately increase their share of total
equity holding, sending a confidence signal to market participants (Camara, 2012). This
tactical managerial activism influences the adjustment of capital structure based on
macroeconomic conditions effectively.
According to Camara (2012), one of the underlying economic and financial implications for
faster adjustment in a good macroeconomic conditions relative to bad macroeconomic
conditions is that equity investors (i.e. the true owners of the firm) that are holding 2 in 1 real
options; they can either exercise their holdings in a good macroeconomic conditions or hold
on for even better future returns as long as the firm moves closer to its target leverage level
which optimises its weighted average cost of capital. However, caution is needed, because
firms in a good macroeconomic conditions will likely move further away from the target due
to a rise in market equity prices, in which case, firms may need to rebalance their capital
structure accordingly. Nevertheless, as long as firms adjust faster in good macroeconomic
states relative to bad macroeconomic conditions, the 2 in 1 real option assumption may be
theoretically satisfied.

44
Cook and Tang (2010) employed both a two-stage and an integrated dynamic partial-
adjustment structure model to test the relationship between macroeconomic conditions and
capital structure adjustment speed. Their study defines good and bad states of
macroeconomic conditions based on the term spread, gross domestic product (GDP) growth,
default spread and dividend yield. Using data from 1977 to 2006, the authors conclude that
U.S. firms adjust their debt ratios towards target faster in good macroeconomic states than
in bad states. Cook & Tang’s (2010) results also support the pecking order theory in that
under-leveraged firms adjust their leverage towards target faster than firms that are over-
leveraged. The authors also find evidence favouring the market timing theory implication that
under-leveraged firms have less incentive to adjust towards target leverage when stock
market performance is good, as measured by dividend yield on the market and price-output
ratio.
Hackbarth et al. (2006) earlier conducted a similar study to Cook & Tang (2010) and developed
a contingent model for analysing the impact of macroeconomic conditions on dynamic capital
structure choices. The Hackbarth et al. (2006) model predicts that firms should adjust their
capital structure faster in the rapid growth phase of the economic cycle compared to the
recession phases of the cycle (i.e. macroeconomic conditions influence the pace and the size
of capital structure adjustment). Cook and Tang’s (2010) findings are in support of the work
by Hackbarth et al. (2006) as they found that firms adjust faster in good states compared to
bad states.
Drobetz and Wanzenried (2006) analysed the impact of firm-specific characteristics as well as
macroeconomic factors on the speed of adjustment of firms to their target debt ratio.
Drobertz and Wanzenried (2006) found that faster growing firms and those that are further
away from their target capital structure adjust more readily. In line with Hackbarth et al.
(2006), they also found that macroeconomic conditions influence the speed of adjustment
and that firms adjust much faster when economic prospects are good. In addition, when the
term spreads are higher, firms tend to adjust their speed much faster. In contrast to Koracyk
and Levy (2003), Drobetz and Wanzenried’s (2006) study could not identify the differences in
the speed of adjustment between financially constrained and unconstrained firms.
Camara (2012) also examined the effect of macroeconomic factors on the capital structure of
US-based multinationals (hereafter, MNCs) relative to domestic firms (hereafter, DCs) and
impact of macroeconomic conditions on capital structure adjustment speed of MNCs relative
to DCs during the period between 1991 and 2009. The results showed that both
macroeconomic factors and macroeconomic conditions have a significant effect on capital
structure dynamics (i.e. capital structure decisions and capital structure speed of adjustment).
The results also show that over-leveraged firms adjust faster in good macroeconomic
conditions than under-leveraged firms do. Camara’s (2012) study also finds support for
market timing theory regarding the speed of adjustment.
Tzang et al. (2013) investigate the impact of macroeconomic conditions on the speed of
adjustment of capital structure for non-financial firms listed on the Indonesian Stock

45
Exchange from 1992 to 2010. In addition, firms are divided into under- and over-leveraged
firms and are researched to find the degree to which the firms’ leverage affects the speed of
adjustment and the relationship between leveraged firms and macroeconomic conditions.
Based on a two-stage OLS and integrated partial adjustment approach, Tzang et al. (2013)
found that Indonesian firms adjust their leverage faster in bad economic conditions and that
the adjustment speed of over-leveraged firms is higher than the under-leveraged firms.
Tzang et al. (2013) results show that when the macroeconomic condition is defined by the
inflation rate, the Indonesian firms adjust their capital structure faster in bad states when
leverage is defined by book value. When the macroeconomic condition is defined by GDP
growth rate, the adjustment speed is greater when leverage is defined by book value. Tzang
et al. (2013) found that Indonesian firms adjust faster in bad states when leverage ratio is
defined by either book value or market value; these results are similar to Rubio and Sogorb
(2011).
According Tzang et al. (2013) results, when firms are grouped by over – and under-leveraged
firm, the over-leverage firms adjust faster when leverage ratio is defined by either book or
market value. However, Tzang et al. (2013) found that the relationship between
macroeconomic conditions and over- and under-leverage firms is insignificant.
3. Description of variables
3.1. Firm-specific variables
Firm-specific variables in this research focus on the characteristics of the company that
basically reflect the company's condition. The most reliable factors for explaining corporate
leverage are: median industry leverage (positive effect on leverage), market-to-book assets
ratio (negative effect on leverage), tangibility (positive effect on leverage), profits (negative
effect on leverage), and log of assets (positive effect on leverage) (Frank and Goyal, 2009). In
this research the characteristics of the company can also be regarded as internal
determinants of capital structure that could affect capital structure decisions and adjustment
towards the targeted capital structure. This research considers three main firm-specific
characteristics, namely: (1) tangibility, (2) size and (3) profitability.
Table 3 shows the theories and expected relation between corporate factors chosen and firms
leverage.
Table 3 - Relationship between firm-specific characteristics and corporate leverage
Variables Expected theoretical relation
Mostly reported in the empirical literature
Theories
Tangibility + + Agency theory: agency cost of debt. Trade-off theory: financial distress/business risk.

46
Variables Expected theoretical relation
Mostly reported in the empirical literature
Theories
Profitability - - Pecking order theory. Trade –off theory: bankruptcy costs. Other. theory: dilution of ownership structure.
+ Trade-off theory: tax. Free cash flow theory. Signalling theory.
Firm size + + Trade-off theory: bankruptcy costs/tax. Agency theory: agency cost of debt. Other theories: access to the market, economy of scale. Other theory: information asymmetry.
Source: Deesomsak et al., (2004)
3.1.1. Tangibility
Tangibility infers higher liquidation value and lower incentive for asset substitution.
Therefore, there is potential for a firm with more tangible assets to employ more debt since
the assets can be used as collateral to reduce default risk (Wahab and Ramli, 2014). South
African banks typically look to encumbering pools of tangible assets when making loans to
corporate clients in order to increase their recovery rate and reduce their loss given default.
Jensen and Meckling (1976) suggested that in order to mitigate the agency cost of debt,
tangible assets can be provided as security and this is more relevant when the tangible assets’
value is high.
Tangible assets form an important element of any corporate financing decision for both
corporate executives and the providers of debt capital. Corporate executives can encumber
the firm’s tangible assets as security for its debt borrowings, and providers of capital can
accept these types of assets as collateral since: (1) they are easier to value when compared
to intangible assets, and (2) they are more likely to hold their value during times of financial
distress. Most previous studies have found that tangibility has a significant positive
relationship with the leverage ratio (Frank and Goyal, 2009; Wahab and Ramli, 2014;
Deesomsak et al., 2004). Accordingly, the trade-off theory predicts a positive relationship
between measures of leverage and the proportion of tangible assets (Drobetz and
Wanzenried, 2006).
In this study, tangibility is defined as tangible assets (tangible assets include both fixed assets,
such as machinery, buildings and land, and current assets, such as inventory) ̀ divided by total
assets in line with prior studies (De Jong, Kabir and Nguyen, 2008).

47
3.1.2. Size
The firm size generally influences the firm’s ability to access funding from the banking sector
and the debt capital markets in general. Large firms are likely to be diversified and less prone
to bankruptcy since they have greater flexibility in designing their capital structure (Rajan and
Zingales, 1995; Titman and Wessels, 1988; Ngugi, 2008). In addition, large firms have lower
agency costs of debt, relatively smaller monitoring costs, less volatile cash flows, easier access
to credit markets, and require more debt to fully benefit from the tax shield (Deesomsak et
al., 2004). Accordingly, the trade-off theory predicts an inverse relationship between size and
the probability of bankruptcy, i.e., a positive relationship between size and leverage (Drobetz
and Wanzenried, 2006).
Looking at the asymmetric information, the information asymmetry level in the market will
be much lower for larger firms since more information is expected to be available for these
firms (Haron, 2014). Thus, larger firms have better access to credit markets, as the
information asymmetry is perceived to be low due to their superior qualitative and
quantitative information availability in the market place. Larger firms turned to list on local
equity exchanges and report financial results frequently.
In contrast to aforementioned, Suhaila and Wan Mahmood (2008) found that there is an
inverse relationship between firm size and leverage. The results suggest that large firms have
less demand for leverage than small firms (Wahab and Ramli, 2014). This study uses natural
logarithm of total assets to represent firm size in line with prior studies (Haron, 2014;
Deesomsak, Paudyal and Pescetto, 2009).
3.1.3. Profitability
There are no consistent theoretical predictions on the effects of profitability on leverage.
Therefore, theoretically, the relationship between size and leverage is unclear. Based on the
trade-off theory, it’s possible to hypothesise that more profitable companies should have
higher leverage because they have more income to shield taxes and have a lower probability
of bankruptcy. However, from the point of view of the pecking order theory, firms prefer
internal financing to external financing. Consistent with pecking order perspective, market
timing implied a negative relationship between return-on-assets and leverage. So more
profitable companies have a lower need for external financing and therefore should have
lower leverage (Bauer, 2004). In this research, return on assets is used as a proxy for
profitability and is defined as earnings before interest and taxes divided by total assets. This
proxy is in line prior studies (Rajan and Zingales, 1995; Wahab and Ramli, 2014).
3.2. Macroeconomic variables
Macroeconomics is the movement and trends in the economy as a whole in any given country
or region. The fiscal policy and monetary policy of a country are major macroeconomic
determinants. Macroeconomic indicators are factors that are external to the company, but
they significantly influence a company’s performance either directly or indirectly. Due to this

48
direct or indirect influence, corporate executives consider macroeconomic conditions in
making their financing choices for their firm (Choe et al., 1993; Korajcyk and Levy, 2003).
Korajcyk and Levy (2003) argue that, at the issue-choice stage, firms consider how far they
are from their target leverage as well as the marginal costs associated with issuing one
security over another. In their study, they found that deviations from the target account for
about 15% to 21% of their time-series variation in issue choice, and macroeconomic
conditions account for approximately 38% to 48% of their time-series variation in issue choice.
The macroeconomic factors discussed below have all been found to influence a firm’s
financing decisions and this study will endeavour to investigate these factors in the South
African context.
3.2.1. Economic growth
Real GDP growth (hereafter referred to as GDP) is one of the primary indicators used to gauge
the health of a country's economy and one of the most used external determinants in
analysing capital structure decisions and capital structure adjustment speed towards target
levels (Korajcyk and Levy, 2003; Drobetz and Wanzenried, 2006; Camara, 2012; Chipeta and
Mbululu, 2013; Muthama et al., 2013). These studies have found that there is a negative
correlation between cooperate leverage and the GDP growth rate.
Gajurel (2006) found that there is a negative correlation between GDP growth rate and both
the total debt and short-term debt ratios. However, he found that the GDP growth rate had
a positive impact on long-term debt ratios. Filips in economic performance and consequently
in GDP growth typically lead to increases in companies’ profits. According to the pecking order
theory, companies prefer internal sources (such as retained earnings) to external debt (as
sources of capital) as they become more profitable (Mokhova and Zinecker, 2014).
During expansions, stock prices go up, expected bankruptcy costs go down, taxable income
goes up, and cash reserves increase. Thus, firms are expected to borrow more during
expansion periods (Frank and Goyal, 2009). Also, prices of assets that can serve as security
are likely to fare better during expansion periods and become more illiquid (and less valuable)
during the periods of economic contraction. Since banks require company assets to be
encumbered as collateral for the loans that they advance, leverage should be procyclical.
Gertler and Gilchrist (1993) found that subsequent to recessions, aggregate net debt issues
for large firms increase but remain stable for small firms.
De Jong et al. (2008) suggested that higher economic growth would be a sign that a country
has favourable economic conditions and good prospects of economic development.
Therefore, they believe that firms would tend to employ more debt during times when a
country enjoys a higher economic growth rate. This research considers GDP growth rate as
the measure of economic growth rate as it captures some elements of an economic activity.

49
Figure 7 illustrates the South African annual GDP growth rate for the period 1970 – 2014
measured on a quarterly basis (i.e. March, June, September and December). The graph below
depicts a very “noisy” growth path over the period, with negative growth in certain periods.
Figure 7 - Real GDP growth rate (1970 – 2014)
Source: SARB, I-NET Bridge (2015)
3.2.2. Inflation rate
In economics, inflation is a rise in the general level of prices of goods and services in an
economy over a period of time. Each level of inflation has an effect on the general health of
the economy and the companies that operate in that economy. For example, low or medium
levels of inflation in a country can have a positive effect on the business sector, in that it can
act as an incentive for increases in production. High levels of inflation however, can harm
companies’ profitability by affecting the cost of inputs as well as reducing final demand for
their outputs (Muthama et al., 2013). The inflation rate is usually considered as a proxy for a
government’s ability to manage the economy and it provides information about the stability
of the currency in long-term contracting.
In addition, inflation’s impact on a firm’s capital structure is more prevalent in developing
countries due to the significantly greater reliance on short-term debt as a form of funding by
companies operating in those economies (Booth et al., 2001). South Africa is classified as a
developing country and the capital allocation in the country takes place through the demand
and supply mechanism. The debt providers demand interest returns (i.e. typically, prime plus
a margin or a JIBAR return plus a margin) for the capital they provide. Equity investors expect
dividends or capital gains for their equity investments. Since real returns matter to the
providers of capital, it’s reasonable to infer that inflation is taken into account in their
decision-making and hence impacts on a firm’s capital structure.
-6,0%
-4,0%
-2,0%
0,0%
2,0%
4,0%
6,0%
8,0%
10,0%
Dec-70 Jan-75 Feb-79 Mar-83 Apr-87 May-91 Jun-95 Jul-99 Aug-03 Sep-07 Oct-11
Rear GDP growth rate
GDP

50
There are number of theoretical models relating to inflation rate and capital structure: (1) the
Miller Effect, (2) the Schall Effect and (3) DeAngelo-Masulis Effect. These models attempt to
explain the effects of inflation on capital structure and makes the connection by investigating
how inflation affects the yield on listed equities and bonds, and hence its impact on the
demand and supply of corporate debt. Miller (1977) finds a positive relationship between the
corporate debt level and the yield spread between corporate and municipal bonds. Given an
income tax structure, an increase in the yield spread implies a higher marginal investor’s
income tax rate, which, in turn implies that additional investors are enticed to purchase
corporate bonds. Consequently, the aggregate debt ratio will increase.
The relationship between the aggregate corporate debt level and the yield spread between
corporate bonds and equities was shown to be positive by Schall (1984). Schall (1984) argued
that a decrease in the net return on equity would induce investors to shift from equities to
bonds. This is the substitution effect of corporate bonds for equities as the yield on bonds
become relatively higher.
DeAngelo and Masulis (1980) explain that inflation leads to more debt capital raising, since
inflation lowers the real cost debt, the demand for corporate credit increases during
inflationary periods. On the other hand, if corporate bond returns increase relative to stock
returns as inflation decreases, the aggregate demand of corporate credit will increase.
However, there is also another view that higher inflation may lead investors to prefer
investing in equities, as equities provide much better protection against inflation compared
fixed income bonds during higher inflationary environment (Coates and Woolley, 1975).
Since a large number of corporate tax deductions are based on historical costs, such as
depreciation, wear and tear allowances, and cost of goods sold, ceteris paribus, DeAngelo and
Masulis (1980) argue that increases in inflation which increase nominal revenues, will
decrease the real value of investment tax shields inducing firms to replace this tax shield loss
by increasing their use of debt. During the period of this study, South African inflation
remained low in comparison to the late 70s, the 80s and early 90s. However, South African
inflation is high compared to developed markets. Over the last 15 years, South African
inflation averaged 5.889% per annum, with 4 years in which the inflation significantly deviated
from the target range of 3% - 6% set by the SARB. During the calendar years 2002, 2003, 2007
and 2008, inflation was 12.3%, 0.3%, 8.9% and 10.2% respectively.
Market timing theory suggests that a firm issues the debt when the interest on the debt is
low as compared to the past and future expected interest rates. Frank and Goyal (2009) found
that when firms expect that the inflation rate will be higher in the future or realising that the
current inflation rate is low, they will raise more debt. However, future inflation trends
depend on the local country economic performance as well as external factors (i.e. so-called
imported inflation). If corporate executives expect more inflation in the future, they will issue
more debt in order take advantage of the lower real cost of debt. However, this argument
assumes that companies are raising fixed rate funding from banks or issuing bonds in the bond
market, since variable interest rates tend to move around as macro fundamentals changes.

51
Based on Taggart (1985), the real value of tax deductions on debt is higher when inflation is
expected to be high. Thus, the trade-off theory predicts leverage to be positively correlated
to inflation (Frank and Goyal, 2009). In contrast, Schall (1984) stated that during periods of
high inflation, the after-tax returns on shares are relatively higher than the returns on bonds.
In periods of high inflation, investors will therefore tend to favour investments in equities
compared to bonds, thus reducing the availability of debt funding. The effect of inflation on
capital structures will persist through the reduction of debt financing.
Based on the literature mentioned above, this research investigates the impact of inflation on
capital structure decisions. This research considers the general consumer price index (annual
change) as the best measure of inflation. The SARB has set a CPI target band of 3% to 6%, and
uses the repo rate to try and ensure that inflation stays within its targeted band. South Africa
formally introduced inflation targeting in February 2000, after announcing the intention to
adopt the framework in August 1999. The inflation variable has exogenous factors affecting
it outside of the classic economics supply and demand eco-system.
In this research, CPI is the proxy for inflation; this has a conflicting financial implication for
debt issuers relative to debt holders. Periods of rising inflation are considered to be good for
borrowers’ existing debt obligations but detrimental to existing debt holders (Camara, 2012).
The opposite is true for new debt issuances made during periods of rising inflation. Similarly,
inflation has an adverse effect on the overall wealth of equity holders through capital gains.
Figure 8 illustrates the South African annual CPI for the period 1970 – 2014 measured on a
quarterly basis (i.e. March, June, September and December). The South African inflation rate
started declining from the late 80s as South Africa started the liberalisation of its economy
towards the end of apartheid.
Figure 8 - Consumer Price Index (1970 - 2014)
Source: I-NET Bridge (2015)
0,0%
5,0%
10,0%
15,0%
20,0%
25,0%
Dec-70 Jan-75 Feb-79 Mar-83 Apr-87 May-91 Jun-95 Jul-99 Aug-03 Sep-07 Oct-11
CPI
CPI

52
3.2.3. Interest rates
According to Modigliani and Miller’s (1958) paper, changes in interest rates should not affect
management financing decisions, since the value of a firm is independent of its capital
structure. However, several theories have developed since then to argue against their theory.
Corporate executives should be concerned with the levels of interest rates as these directly
affect their firms’ borrowing costs and overall weighted average cost of capital. Studies in
developed and developing economies show that interest rates affect capital structure
decisions and the speed of adjustment towards target capital structure (Jalilvand and Harris,
1984; Mokhova and Zinecker, 2014).
According to trade-off theory, firms’ capital structure decisions are made on the basis of the
tax benefit and the costs (financial distress and bankruptcy) associated with such borrowings.
An increase in interest rates will result in corporates paying much higher funding costs in the
absence of hedging. This higher interest will result in corporates both accelerating the
repayment and borrowing less. This implies a decline in leverage when interest rates go up
and an increase when interest rates go down. The trade-off theory, therefore, suggest that
there is a negative relationship between interest rates and leverage. There are number of
studies that suggest a negative relationship between interest rates and leverage (Brigham and
Houston, 1998; Henderson, Jegadeesh and Weisbach, 2006; Frank and Goyal, 2003).
Market timing also theory predicts a negative relationship between interest rates and
leverage. According to market timing theory, corporate executives assess both equity and
debt market conditions and use the capital market segment that’s most favourable to raise
capital; in at the time. Henderson et al. (2006) analyses whether firms’ propensity to issue
debt in a low interest rate environment allows them to time the market and raise more long-
term debt prior to increases in interest rates. Using the Security Data Corporations new
issuances for G7 countries, they found that firms issue more long-term debt when interest
rates are lower, and prior to increases in interest rates.
In contrast to these aforementioned studies (Brigham and Houston, 1998; Henderson et al.,
2006; Frank and Goyal, 2003), Mokhova and Zinecker (2014) found a positive (and significant)
influence on long term, short-term and total leverage in Germany and France. Bokpin’s (2009)
study also found interest rates to be positively (and significantly) correlated to capital
structure.
Based on the study of firms listed on the Nairobi stock exchange for the period 1999 and 2008,
Muthama et al. (2013) concludes that interest rates (as measured by yield on treasury bills as
a proxy) have a positive influence on firms’ long term debt ratios and total debt ratios, and a
negative influence on their short debt ratios. Ooi’s (1999) study involving 83 property
companies listed in the UK found the relationship between prevailing market interest rates
and the debt ratio is significantly negative. In contrast, the De Jong et al. (2008) study indicates
that the relationship between leverage ratios and interest rates is not significant. In this
research, the prime rate is used as a proxy for interest rates in understanding the correlation

53
between interest rates and capital structure decisions. South African banks tend to use it as
the basis for pricing loans to their corporate clients.
Figure 9 illustrates the prime interest rate (a proxy for interest rates generally) in South Africa
for the period 1970 – 2014 at the end of each quarter (i.e. March, June, September and
December). The prime interest rate experienced many fluctuations from 1970 – 2014.
Figure 9 - South African Prime rate (1970 – 2014)
Source: SARB (2015)
3.2.4. Summary of the three key economic indicators
Figure 10 plots the course of three key economic indicators for the period 1999 – 2014:
Interest rates – measured by the South African prime interest rate;
Inflation – measured by South African CPI; and
Economic growth – measured by the South African gross domestic product (GDP) growth
rate.
The graph provides a good graphic illustration of the performance of the South African
economy over the last 15 years.
0,0%
5,0%
10,0%
15,0%
20,0%
25,0%
30,0%
Dec-70 Jan-75 Feb-79 Mar-83 Apr-87 May-91 Jun-95 Jul-99 Aug-03 Sep-07 Oct-11
South African Prime rate
Prime rate

54
Figure 10 - Summary of the three selected economic indicators (1999 – 2014)
4. Data
This research is based on the sample of companies listed on the main board of the JSE Limited.
The JSE All Share Index comprises c. 99% of companies listed on JSE (by market capitalisation)
and includes a great number of financial institutions. Since banks and insurance companies
are subject to industry-specific rules and regulations (i.e. bank regulations stemming from the
Basel 2, and now moving to Basel 3 in 2016 and Solvency 2 insurance regulations embodied
in the Solvency Assessment and Management Act), their leverage is severely affected by
exogenous factors. Therefore, all firms that fall under the financial sector have been excluded
from the sample, and this research has focused on non-financial firms only. The number of
companies in the All Share Index is 167; and the exclusion of financial companies reduces the
number of companies in the sample to 130.
Companies with less than three years data were excluded. Also, property stocks were
excluded, as banks look at loan-to-value when assessing leverage capacity for property
companies. This research uses a different definition of leverage and the loan-to-value
principle wouldn’t capture fully leverage impact with the different leverage principle.
S&P Capital IQ and FactSet databases were used to source historical income statements,
balance sheets and to calculate financial ratios for the chosen period. Financial ratios were
calculated on the last twelve months (LTM) basis based on the S&P Capital IQ algorithms.
Macroeconomic data variables were obtained from the I-Net Bridge database and the SARB.
The sample period covered is between 01 January 2000 to 31 December 2014.
-5,0%
0,0%
5,0%
10,0%
15,0%
20,0%
Dec-99 Apr-01 Aug-02 Dec-03 Apr-05 Aug-06 Dec-07 Apr-09 Aug-10 Dec-11 Apr-13 Aug-14
Three selected economic indicators
GDP Prime rate CPI

55
5. Model specification
5.1. The model specification – macroeconomic variables
In this research, the models and variables used were based on the theoretical foundations
suggested by capital structure theories as well as other related studies. The models discussed
below are used in the analysis. This sub-section discusses the models used in order to
investigate demand factors (tangibility, size and profitability) and macroeconomic factors
(GDP growth, inflation rate and interest rates) and their impact on capital structure.
Firstly, in line with other empirical analysis of this nature, a panel data regression model was
used to test the effects of firm-specific factors and macroeconomic factors on the capital
structure of the sample firms. The foundation of the model followed a similar model as
Korajczyk and Levy (2003), Camara (2012) and Muthama et al. (2013) and is stated as follows:
LV𝑖𝑡 = 𝛼𝑖𝑡 + 𝛾Macro𝑖,𝑡−1 + 𝛽𝑋𝑖,𝑡−1 + 𝜇𝑖𝑡 (1)
Where LV𝑖𝑡 is the leverage for firm i at time t, 𝛼 is the unobservable firm specific effect, and
Macro𝑖,𝑡−1 and 𝑋𝑖,𝑡−1 are a vector of lagged macroeconomic variables (i.e. inflation rate, real
GDP growth and prime rate) and a vector of lagged characteristics (i.e. tangibility, size and
profitability) of firm i. The model specification is based on the following leverage definition
(Camara, 2012):
LV𝑖𝑡 =D𝑖𝑡
(D𝑖𝑡 + E𝑖𝑡) (2)
Where (D = Long-term debt interest bearing borrowings + short-term interest bearing (i.e.
this include drawn overdraft facilities); E = share price at close at time t * number shares in
issue). This definition of leverage is based on market value leverage ratio. However, there is
no consensus on whether book or market value leverage ratios should be used in capital
structure studies. Some studies argue that leverage should be computed using the book value
of capital because book ratios are independent of factors that are under the direct control of
firms (Cook and Tang, 2010; Fama and French, 2002).
Other empirical studies prefer market leverage ratios, and argue that it is relevant to look at
leverage using both book value and market leverage definitions (Cook and Tang, 2010). Welch
(2004) found evidence that market leverage better reflects the agency problems between
creditors and equity capital providers and serves as an indispensable input into WACC
computations. Since it highly possible that some firms have book value rather than market
value targets and vice versa, this research followed Cook and Tang (2010) and tested the
regression model using both book and market value measures. This research defines the book
value leverage ratio as follows:
BLV𝑖𝑡 =D𝑖𝑡
(D𝑖𝑡 + BE𝑖𝑡) (3)

56
Where D𝑖𝑡 is the sum of firm i’s short-term and long term value of interest-bearing debt at
time t, and BE𝑖𝑡 denotes the equity book value as recorded in the firm’s balance sheet as at
31 December for the calendar period being considered in this research.
The research also defines the market value leverage ratio as follows:
MLV𝑖𝑡 =D𝑖𝑡
(D𝑖𝑡 + ME𝑖𝑡) (4)
Where D𝑖𝑡 is the sum of firm i’s short-term and long term value of interest-bearing debt at
time t, and ME𝑖𝑡 denotes the product of the number of ordinary shares issued and
outstanding and the stock price per share at time t, which equals the market value of firm i’s
equity.
In order to arrive at an equation to investigate the impact of macroeconomic factors and firm-
specific characteristics on book value leverage, equation 2 is replaced by equation 3 and
corporate leverage is modelled as follows
BLV𝑖,𝑡 = 𝛼𝑖𝑡 + 𝛾Macro𝑖,𝑡−1 + 𝛽𝑋𝑖,𝑡−1 + 𝜇𝑖𝑡 (5)
To arrive at market value leverage, the same procedure as above is followed and equation 2
is replaced by equation 4 in equation 1. For market value leverage, the following equation is
followed:
MLVi,t = 𝛼𝑖𝑡 + 𝛾Macro𝑖,𝑡−1 + 𝛽𝑋𝑖,𝑡−1 + 𝜇𝑖𝑡 (6)
Although previous studies obtain the fitted value of equation (5) and equation (6) as the proxy
for target leverage using linear regression models, Papke and Wooldridge (1996) and Cook
and Tang (2010) point out that there are methodological problems using linear models for
fractional data. To manage such problems, Papke and Wooldridge (1996) developed a quasi-
likelihood method with a fractional dependent variable. Thus, this research follows Papke
and Wooldridge (1996) and Cook and Tang (2010) use of the quasi maximum likelihood
estimation method (“QMLE”) to estimate the fitted value of equation (5) and equation (6) as
the proxy for target leverage.
5.2. The model specification – capital markets friction
Section 5.1 models investigate the demand side conditions and some exogenous variables
and their impact on a firm’s capital structure. The models implicitly assume that the supply of
capital is frictionless in line with Modigliani and Miller (1958) assumptions. Recent literature
on capital structure shows that the demand side factors do not fully explain the variations in
leverage ratios and financing policies of corporates. Hence, if the supply of capital is uncertain
then firm financing decisions will depend on both demand and supply side factors. In order
to investigate the supply-side impact on capital structure choices, Rehman et al. (2013)
modelled the firm financing and investment decisions as a function of both demand and
supply side frictions as follows:
𝑌 = 𝛽0 + 𝛽1𝜃 + 𝛽2𝛿 + 𝜇 (7)

57
Where, 𝜃 represents demand shocks and 𝛿 represents supply shocks. Equation 7 models firm
financing decisions as a function of both demand and supply. In order to understand better
the effects of extreme capital market frictions on firm financing decisions, and equation 7 can
also be expressed as follows in a general form:
𝑌 = 𝛽0 + 𝛽1𝑓(𝑑𝑒𝑚𝑎𝑛𝑑 𝑠ℎ𝑜𝑐𝑘𝑠)𝑖𝑡 + 𝛽2𝑓(𝑠𝑢𝑝𝑝𝑙𝑦 𝑠ℎ𝑜𝑐𝑘𝑠)𝑖𝑡 + 𝜇𝑖𝑡 (8)
The co-efficient of interest in equation 8 is 𝛽2 which measurers the effect of supply shocks on
variable of interest. The challenge in investigating the capital supply shocks and their impact
on corporate leverage comes from the identification problem with regard to the policies
adopted by corporate executives vis-á-vis the supply side effects on the financing choices.
In order address this challenge, the identification strategy is similar to that followed by the
previous literature (Leary, 2009; Duchin et al., 2010; Rehman et al., 2013). This research
identifies the exogenous variations in the supply of credit. The recent credit crisis 2007 – 2009
which led to the global recession from 2008 to 2012 provides an opportunity to study the
potential impact of these events. Since the recent financial crisis originated from the events
in the US subprime market, it is reasonably exogenous to corporate credit demand and hence
this exogenous shock makes it possible to identify the effect of credit supply shocks on
corporate capital structure (Rehman et al., 2013). The rand crisis of 2001 and 2002 also
presents a definable event on which to test the effects of exogenous effects on capital supply.
As this study identifies the supply channel, the fixed effect model can be regarded as the most
appropriate for this investigation. This is because it allows identifying the supply effect by
controlling for the unobserved firm specific effect (Rehman et al., 2013). Fixed effect model
allows the ability to control for time-invariant company/sector specific factors that may
impact or bias leverage. For example, business practices and regulations may influence
leverage, however, these practices and regulations are different across companies and are
generally time invariant. Since these have the potential of impacting different companies
differently and may therefore bias leverage there is a need to control for these.
In this regard, Love, Preve and Sarria-Allende (2007) argue that fixed effect model not only
captures the unobserved time-invariant heterogeneous firm characteristic, but also allows
researchers to disentangle the post-market friction effect from the precrisis effect (Rehman
et al, 2013). The fixed effects specification removes all firmspecific time-invariant omitted
variables. Similarly, the fixed effect model can effectively account for both observable and
unobservable firm characteristics and firm heterogeneity (Rehman et al., 2013) .
There is a potential concern of unobserved heterogeneity, since this study employs panel
data. This is because the data contains multiple observations per firm. Minguex-Vera and
Martin-Ugedo (2007) argued that unobservable heterogeneity might result in spurious
correlations with dependent variables, which would bias the coefficients obtained. According
to Rehman et al. (2013) it can therefore be argued that the fixed effect model will help to
account for this concern. Jeon and Miller (2004) also support the view that when using panel
data, the fixed-effect model produces unbiased and consistent estimates of the coefficients.

58
The fixed effect regression model used in this research is highlighted below:
𝑌𝑖𝑡 = 𝛼1𝑡 + ∏1 ∗ Friction𝑖𝑡 + 𝛿2 ∗ ∑𝑋𝑖𝑡 + 𝛿3 ∗ Friction ∗ ∑𝑋𝑖𝑡 + 𝜇𝑖𝑡 (9)
Where 𝑌𝑖𝑡 is a measure of firm leverage ratios, 𝛼1 is the firm fixed effect; ∏1is the differential
slope coefficient and indicates how much is the slope coefficient of the capital markets’
friction periods (2001 – 2002 and 2007 – 2009) differ from that of the non-capital markets’
friction periods (2000,2003-2006 and2010 – 2014); friction is a dummy variable equal to one
for the capital markets’ friction periods (2001 – 2002 and 2007 – 2009) and 0 otherwise (2000,
2003-2006 and 2010 – 2014). The interactive term 𝛿3 represents the change in response
relative to the pre-crisis period, and 𝑋𝑖𝑡 is a set of firm specific characteristics as discussed in
sub-Section 3.1. In light of the aforegoing, the following model is constructed. The benchmark
model for firm leverage ratio, which was regressed against firm demand and supply side
factors, can be written as follows.
𝐿𝑉𝑖𝑡 = 𝛽0 + 𝛽1 ∗ SZ + 𝛽2 ∗ TAN + 𝛽3 ∗ PROF + 𝛽4 ∗ MF + 𝛽1 ∗ SZ ∗ MF + 𝛽2 ∗ TAN ∗ MF + 𝛽3 ∗ PROF
∗ MF + 𝜇𝑖𝑡 (10)
Where SZ, TAN and PROF are size, tangibility and profitability respectively. Size, tangibility
and profitability are defined as per Section 3.1: Firm-specific variables. MF is a dummy
variable equal to one for the capital market friction periods (2001 – 2002 and 2007 – 2009)
and 0 otherwise (2000, 2003 -2006 and 2010 – 2014). This model is tested using both book
value and market value leverage resulting in the following two equations respectively:
BLVit = 𝛽0 + 𝛽1 ∗ SZ + 𝛽2 ∗ TAN + 𝛽3 ∗ PROF + 𝛽4 ∗ MF + 𝛽1 ∗ SZ ∗ MF + 𝛽2 ∗ TAN ∗ MF + 𝛽3 ∗ PROF
∗ MF + 𝜇𝑖𝑡 (11)
MLVit = 𝛽0 + 𝛽1 ∗ SZ + 𝛽2 ∗ TAN + 𝛽3 ∗ PROF + 𝛽4 ∗ MF + 𝛽1 ∗ SZ ∗ MF + 𝛽2 ∗ TAN ∗ MF + 𝛽3 ∗ PROF
∗ MF + 𝜇𝑖𝑡 (12)
5.3. The model specification - integrated dynamic partial adjustment capital
structure model
In a perfect market, trade off theory predicts that, firms would instantaneously adjust back
to target leverage. The perfect market assumes that there are no transaction costs (i.e.
transaction costs could include early penalty fees and advisory fee in a non frictionless world)
hence it is possible for firms to instantaneously revert to the target leverage. On the other
hand, in imperfect capital markets, where recapitalisation costs are non-trivial, reversion to
target leverage may only be visible during multiple periods (i.e. partial adjustment) (Camara,
2012).
This research does not follow a two-stage estimation procedure that is commonly used in the
literature, since Flannery and Rangan (2006) shows that the partial adjustment speed
reflected by the coefficient on target leverage from first-stage regressions is abnormally
smaller than theory would predict and that the long-term elasticity of the observed debt ratio
relative to its target is significantly different from unity. Thus, following prior studies (
Flannery and Rangan, 2006; Cook and Tang, 2010), this research estimates the impact of

59
macroeconomic conditions on the capital structure adjustment speed by including the partial
adjustment and firm fixed effects in one integrated capital structure model.
As per the literature, the standard partial adjustment mode followed is stated as follows:
𝐿𝑉𝑖𝑡 − 𝐿𝑉𝑖,𝑡−1 = 𝛿 ( 𝐿𝑉𝑖,𝑡 ∗ − 𝐿𝑉𝑖,𝑡−1), 0 < 𝛿 < 1 (13)
The parameter 𝛿 is the speed of adjustment and explains the actual changes in capital
structure from 𝑡 − 1 to 𝑡 (𝐿𝑉𝑖𝑡 − 𝐿𝑉𝑖,𝑡−1) and it lies between 0 and 1, including multiple
periods of adjustment. The parameter estimate for the lagged leverage represents the
proportion of deviation closed in one period. If transaction costs are zero, then 𝛿 = 1,
meaning that firms will automatically adjust to their capital structure. If transaction costs are
1, then 𝛿 = 0, meaning that transaction costs are so high that 𝐿𝑉𝑖𝑡 = 𝐿𝑉𝑖,𝑡−1(Chipeta and
Mbululu, 2012). Generally speaking, the parameter 𝛿 is expected to be more than zero but
not more than 1 as per previous literature. From equation 13, the actual leverage level can
be computed as:
𝐿𝑉𝑖𝑡 = 𝛿𝐿𝑉𝑖,𝑡 ∗ + (1 − 𝛿)𝐿𝑉𝑖,𝑡−1 (14)
Assume 𝐿𝑉𝑖,𝑡 ∗ is equal to equation 1, therefore by substituting equation 1 into equation 12
and rearranging yields the following:
𝐿𝑉𝑖𝑡 = (1 − 𝛿)𝐿𝑉𝑖,𝑡−1 + 𝛿𝛼𝑖 + 𝛿𝛾Macro𝑖,𝑡−1 + 𝛿𝛽𝑋𝑖,𝑡−1 + 𝜇𝑖𝑡 (15)
The speed of capital structure adjustment speed is estimated from equation 15 across good
and bad macroeconomic states. The research estimate equation 15 using standard ordinary
least squares (“OLS”) with robust t-statistics from standard errors corrected for
heretoskedasticity. This model is tested using both book value leverage and market value
leverage resulting in the following two equations respectively:
BLVit = (1 − 𝛿)𝐿𝑉𝑖,𝑡−1 + 𝛿𝛼𝑖 + 𝛿𝛾Macro𝑖,𝑡−1 + 𝛿𝛽𝑋𝑖,𝑡−1 + 𝜇𝑖𝑡 (16)
MLVit = (1 − 𝛿)𝐿𝑉𝑖,𝑡−1 + 𝛿𝛼𝑖 + 𝛿𝛾Macro𝑖,𝑡−1 + 𝛿𝛽𝑋𝑖,𝑡−1 + 𝜇𝑖𝑡 (17)
5.3.1. Defining good and bad states of macroeconomic conditions
This study examines the impact of macroeconomic conditions on capital structure adjustment
by estimating and comparing the adjustment speed across good and bad macroeconomic
states. This research follows previous literature (Cook and Tang, 2010; Tzang et al., 2013) in
identifying the good and bad macroeconomic states based on the macro economic factors
discussed in section 3.2. For this research, inflation and GDP growth rate are used. The
interest rates have been fairly stable in South Africa and any classification based on this might
not be meaningful, although this is not tested empirically. This study divides the 15-year
sample period from 2000 to 2014 into quintiles based on the order of each economic factor.
This research followed Cook and Tang (2010) in dividing the states into the aforementioned
quintiles. For divisions based on the GDP growth factor, the research equates good
macroeconomic states with the highest quintile factor years, moderate macroeconomic

60
states with the mid-three quintiles factor years, and bad macroeconomic states with the
lowest quintile factor years since, good states are defined as higher GDP growth rate. For
division based on inflation rate, the research equate good macroeconomic states with the
lowest quintile factor years, moderate macroeconomic states with the mid-three quintile
factor years, and bad macroeconomic states with the highest quintile factor years because
good states are defined in terms of lower inflation rate.
Table 4 - Definition of good and bad states
G: good state; M: moderate state; B: bad state
6. Empirical analysis
6.1. Summary statistics
Figure 11 shows the mean leverage of the sample for the period from 2000 to 2014.
Consistent with the argument in the literature that book-valued debt ratios are less subject
to non-controllable factors, the results show that the book debt ratio fluctuates less over the
sample period than the market debt ratio. The market-based leverage is relatively low during
the periods of stock market expansion in the early 21st century, increasing during the global
financial crisis (2007 - 2009) as stock prices declined. The market based leverage then
decreased as the stock market began to recover. The book value continued to increase during
the expansion and then declined slightly after the global financial crisis (2007 – 2009). This is
consistent with the view that firms time their equity issuance and have less incentive to issue
debt when the stock market performs well (Cook and Tang, 2010).
Year Rate State Year Rate State
Q1 2003 0.34% G 2006 7.11% G
2010 3.48% G 2004 5.67% G
2004 3.52% G 2005 5.03% G
Q2 2005 3.57% M 2007 4.66% M
2001 4.55% M 2000 4.44% M
2014 5.31% M 2002 3.89% M
Q3 2013 5.40% M 2010 3.40% M
2012 5.71% M 2011 3.27% M
2006 5.79% M 2013 2.95% M
Q4 2011 6.05% M 2003 2.40% M
2009 6.29% M 2001 2.01% M
2000 6.98% M 2012 1.76% M
Q5 2007 8.88% B 2014 1.33% B
2008 10.19% B 2008 1.14% B
2002 12.29% B 2009 -0.54% B
Inflation Rate GDP Growth Rate

61
Figure 11 - Market value leverage vs. book value leverage
Table 5 presents the annual mean, median and standard deviation of leverage from 2000 to
2014. This research calculates target book value and market value leverage according to
equation 5 and equation 6 respectively, and employs the quasi-maximum likelihood
estimation method to fit values. The sample includes all companies listed on JSE Limited main
board after the adjustment mentioned in section 4. The debt ratios are defined as follows:
BVL is the book valued debt ratio computed by (long-term book debt + short-term book
debt)/total book assets. MLV is the market valued debt ratio computed by (long-term book
debt + short-term book debt)/(long-term book debt + short-term book debt + stock price*
number of shares outstanding). Long and short-term debt and total assets numbers are in
book values.
Table 5 - Annual mean, median and standard deviation of leverage
0,0%
5,0%
10,0%
15,0%
20,0%
25,0%
30,0%
35,0%
40,0%
2000 2001 2002 2003 2004 2005 2006 2007 2008 2009 2010 2011 2012 2013 2014
Market value leverage v.s. Book value leverage
MLV(mean) BLV(mean)
Mean Median Std Obs Mean Median Std Obs
2000 24% 22% 20% 79 20% 19% 18% 59
2001 26% 26% 19% 81 19% 17% 17% 62
2002 25% 22% 20% 82 17% 12% 15% 68
2003 28% 26% 30% 84 15% 10% 16% 69
2004 28% 24% 40% 88 14% 10% 16% 74
2005 33% 26% 47% 90 13% 9% 15% 75
2006 29% 24% 26% 91 12% 8% 14% 78
2007 29% 27% 23% 94 14% 9% 16% 84
2008 34% 32% 24% 97 23% 17% 21% 90
2009 32% 28% 25% 100 19% 14% 19% 91
2010 29% 23% 23% 101 15% 10% 15% 94
2011 27% 24% 21% 101 17% 14% 17% 98
2012 29% 27% 19% 101 17% 13% 16% 100
2013 30% 28% 19% 101 19% 15% 16% 101
2014 29% 26% 20% 101 18% 14% 16% 101
Book value Leverage Market Value Leverage

62
Table 6 - Sample statistics
Figure 12 shows the relative proportions of different categories of leveraged firms based on
market value leverage definition. The leverage ratio of each firm was classified into the low
leverage (0 - 0.25), medium leverage (0.25 – 0.499), or high leverage (0.5 and above) groups.
The figure shows that the relative proportion of low leverage firms increased during the
economic expansion and declined sharply between 2006 and 2008. The decline in the
proportion of low leverage firms post 2006, is also an indication of the denominator effect as
market values declined and leverage increased. Based on market value leverage definition,
low leveraged firms and medium leveraged firms constituted approximately 77% and 17% of
the sample companies respectively on average. High leveraged firms constituted c.5% of the
sample companies on average.
Figure 12 - Relative proportion of different categories of leveraged firms - market value basis
Figure 13 shows a stable spread of high, medium and low leveraged firms throughout the
sample period, with a visible “noise” in the trend across all three categories during the 2007
Sample statistics (2000-2014)
Variable Obs Mean SD Min Max
Book Leverage 1391 29% 26% 0% 365%
Market Leverage 1244 17% 16% 0% 99%
EBIT margin (Prof) 1391 0,14 0,10 -0,26 0,93
Tangiability 1391 0,80 0,16 0,16 1,00
Size 1391 9,03 1,67 4,12 14,34
0%
10%
20%
30%
40%
50%
60%
70%
80%
90%
100%
2000 2001 2002 2003 2004 2005 2006 2007 2008 2009 2010 2011 2012 2013 2014
Sam
ple
leve
rage
pro
po
rtio
n
Proportions of High (above 0.5), Medium (0.25 - 0.499) and Low (below 0.25) leverage firms (Market Value)
Low leverage Medium leverage High leverage

63
– 2009 period. Book value leverage is usually unaffected by external movements in values
other than exogenous factors affecting supply of capital (debt or equity) and this research
shows in the research results in sub-section 6.2.3. Based on book value leverage definition,
low leveraged firms and medium leveraged firms constituted approximately 49% and 37% of
the sample companies respectively on average. High leveraged firms constituted c.14% of the
sample companies on average.
Figure 13 - Relative proportion of different categories of leveraged firms - book value basis
Table 7 - Correlation matrix: Book value leverage
Table 7 presents the correlation analysis between the dependent variable (i.e. book value
leverage) and the independent variables. Table 7 also shows the correlation between the
independent variables (i.e. GDP growth, Prime rate, CPI, EBIT, TAN and Size). The p-values are
shown in bold. ***, ** and * denote statistical significance at the 1%, the 5% and the 10%
level respectively.
0%
10%
20%
30%
40%
50%
60%
2000 2001 2002 2003 2004 2005 2006 2007 2008 2009 2010 2011 2012 2013 2014
Sam
ple
leve
rage
pro
po
rtio
n
Proportions of High (above 0.5), Medium (0.25 - 0.499) and Low (below 0.25) leverage firms (Book Value)
Low leverage Medium leverage High leverage
Book
Leverage
GDP
growth Prime rate CPI EBIT TAN Size
Book Leverage 1
GDP growth -0.25 1
0.37
Prime rate -0.24 0.22 1
0.4 0.44
CPI -0.01 -0.05 0.66 1
0.97 0.87 0.01***
EBIT 0.32 0.6 0.45 0.23 1
0.24 0.02** 0.09* 0.4
Tangiabilty -0.66 0.39 0.51 -0.05 -0.06 1
0.01*** 0.16 0.05* 0.87 0.83
Size 0.51 -0.41 -0.64 0.04 -0.24 -0.85 1
0.05* 0.12 0.01** 0.89 0.39 0.00005***

64
Table 8 - Correlation matrix: Market value leverage
Table 8 presents the correlation analysis between the dependent variable (i.e. market value
leverage) and the independent variables. Table 8 also shows the correlation between the
independent variables (i.e. GDP growth, Prime rate, CPI, EBIT, TAN and Size). The p-values are
shown in bold. ***, ** and * denote statistical significance at the 1%, the 5% and the 10%
level respectively.
6.2. Results and discussion
6.2.1. Regression results
Table 9 shows the results of estimation equation 5 and equation 6 where the dependent
variables are the book and market leverage respectively. R2 is the correlation between the
fitted value of the dependent variable from the regression and its actual value in the data.
***, ** and * denote statistical significance at the 1%, the 5% and the 10% level respectively.
GDP is the annualised real GDP growth rate. Prime rate is a reference interest rate commercial
banks use when issuing variable interest rate loans to their customers. CPI is the official
measure of annual inflation that is used in South Africa. EBIT is the operating profit divided
by the total assets. Tangibility is the ratio of tangible assets to the book value of total assets.
Size is measured as the logarithm of total assets.
Market
Leverage GDP Prime rate CPI EBIT TAN Size
Market Leverage 1
GDP -0.72 1
0.0024***
Prime rate 0.17 0.22 1
0.54 0.44
CPI 0.40 -0.05 0.66 1
0.14 0.87 0.01***
EBIT -0.40 0.50 0.37 0.30 1
0.14 0.06* 0.17 0.28
Tangiabilty -0.19 0.43 0.52 -0.08 -0.19 1
0.5 0.11 0.05** 0.77 0.49
Size 0.13 -0.39 -0.63 0.03 0.02 -0.91 1
0.65 0.16 0.01** 0.91 0.96 0.0***

65
Table 9 - Regression results
The empirical evidence obtained has suggested that the coefficients of GDP, Prime, Inflation
rate, Profitability, Tangibility and Size are significant for the total leverage regression (Table
9). The notable exception is that the coefficient of inflation rate, although still having the same
sign, is not significant under the book value leverage regression. Having further corroborated
the relationships between the significant explanatory variables and the dependent variables
this research results are discussed in detail below.
6.2.2. Discussion
6.2.2.1. GDP growth
Intuitively, GDP growth impacts firms’ financial performance and how they are funded.
Empirical studies in this area are relatively new and there is no clear consensus as to whether
the data supports the intuitive assertion (Mokhova and Zinecker, 2014). Gertler and Gilchrist
(1993) show that subsequent to recessions induced by monetary contractions, aggregate net
debt issues increase for large firms but remain stable for small firms. During expansions, stock
prices go up, expected bankruptcy costs go down, taxable income goes up, and cash balances
increase. Thus, firms borrow more during expansion and collateral values are likely to be pro-
cyclical (Frank and Goyal, 2009).
Regression results (Leverage as a function of lagged firm specific and macro variables)
Variable name Coefficient Std. Error T-statistic p-value Significance
Book value leverage - Equation 5
'GDP' 0,8297 0,2938 2,8241 0,0048 ***
'Prime' 1,0316 0,4070 2,5345 0,0114 **
'CPI' -0,4225 0,3217 -1,3135 0,1892
'EBIT' -0,2339 0,0748 -3,1280 0,0018 ***
'Tangibility' 0,2391 0,0660 3,6214 0,0003 ***
'Size' 0,0608 0,0127 4,7886 0,0000 ***
R-squared = 0.0363 Nobs 1290
Market value leverage - Equation 6
'GDP' 0,3201 0,1032 3,1000 0,0020 ***
'Prime' 1,5335 0,2168 7,0718 0,0000 ***
'CPI' -0,4711 0,1720 -2,7388 0,0063 ***
'EBIT' -0,3516 0,0410 -8,5830 0,0000 ***
'Tangibility' 0,0831 0,0378 2,2024 0,0278 **
'Size' 0,0709 0,0068 10,3790 0,0000 ***
R-squared = 0.2368 Nobs 1143
p-value<0.01 ***
p-value<0.05 **
p-value<0.1 *

66
Agency problems are likely to be more severe during downturns/contractions since
managers’ wealth is reduced relative to that of shareholders. If debt aligns managers’
incentives with those of shareholders, leverage should be countercyclical.
This research finds a positive relation between GDP growth and leverage in the sampled
corporates. The results are significant for both book value leverage and market value leverage
at a 1% confidence level. If the pecking order theory holds true, leverage should decline
during expansions since internal funds increase during expansions, all else remaining equal
(Frank and Goyal, 2009). However, expansion periods also present higher growth
opportunities and firms trying to position themselves to take advantage of these
opportunities would need more funding as internal profits may not be enough to finance their
growth expansion projects. According to the pecking order theory, there will be stronger
preference for external financing; with debt being the first external funding form. The positive
relationship found in this research supports the assumptions of the pecking order theory and
other similar previous studies (Rajan and Zingales, 1995; Booth et al., 2001; Korajczyk and
Levy, 2003; Muthama et al., 2013; Mokhova and Zinecker, 2014; Chen, 2004).
According to the trade-off theory, firms with growth opportunities are likely to suffer from
financial distress and debt overhang (Myers, 1977). Under the trade-off theory model, a
negative relationship between GDP growth rate and leverage was expected and the results of
this research do not support the theory. On the other hand, if corporates’ profits have shown
an increase in the recent past, agency problems between shareholders and managers are less
severe. Consequently, firms should issue less debt (Frank and Goyal, 2009). The results of this
research also seem to contradict thesis around the agency problem.
6.2.2.2. Prime rate
The influence of interest rates on capital structure is not yet conclusive, given that prior
studies have contrasting results. Frank and Goyal (2004) argue that, when interest rates
increase, the value of the equity and bonds will decrease. The decrease in the value of equity
tends to be more than the decrease in the value of debt, which leaves the firm with a higher
degree of leverage (Frank and Goyal, 2004). Based on their argument, a positive relation
between interest rates and leverage is predicted, meaning that an increase in interest rates
will lead to an increase in leverage. This study results agree with these views. The interest
rate variable in this study is found to have a positive relationship with the total leverage, and
the results are statistically significant for both book value leverage and market value leverage.
Although these results are in contrast to some earlier studies related to interest rate impacts
on capital structure (Brigham and Houston, 1998; Henderson et al., 2006; Frank and Goyal,
2003), they confirm the results of Bokpin (2009) and Mokhova and Zinecker (2014). Also,
Muthama et al. (2013) found that interest rates, as measured by the treasury bills, have a
positive influence on the long-term debt ratio and the total debt ratio. This research results
are also in support of Muthama et al. (2013).

67
6.2.2.3. CPI
Another factor, which is supposed to affect capital structure, is the inflation rate. The inflation
rate has a negative sign for both definitions of leverage (book value leverage vs market value
leverage). This research has found that, based on book value leverage, inflation has a very
weak and non-significant influence on capital structure. However, the negative relationship is
significant for market value leverage at 1% confidence level. The observed relationship goes
against the expectation that firms use more debt financing than equity financing during
inflationary periods. The proposed reasoning is that the cost of debt financing will decrease
due to the Fisher Effect on interest rates, where inflation has a decreasing effect on the real
costs of debt financing (DeAngelo & Masulis, 1980).
The tax benefit resulting from the deduction of interest incurred in the production of income
from the firm’s taxable income is most optimal when inflation rates are higher (Taggart,
1985). This is achieved because the allowed deduction is based on nominal interest rates not
real interest rates. The trade-off theory predicts leverage to be positively related to expected
inflation, however the research results do not support this prediction. Kim and Wu (1988)
found supporting evidence for the view that a firm’s debt will increase when inflation
increases. In addition, market timing in debt markets also results in a positive correlation
between expected inflation and leverage if managers issue debt when expected inflation is
high relative to current interest rates (Frank and Goyal, 2009). This research does not agree
with these prior findings (Kim and Wu, 1998; Frank and Goyal, 2009) or the theoretical
explanations for the potential positive relationship.
On the other hand, Schall (1984) offers an opposing view to positive effect of inflation on debt
financing and this view is in line with the findings of this study. Schall (1984) stated that,
during periods of high inflation, the after-tax return on shares and thus equity financing is
relatively higher than the return on bonds. Therefore, investors will make asset rotation by
investing less in the debt asset class and more in equities; hence the firm’s debt ratio will
decrease. The negative relationship found in this study accords with this view. The negative
influence of inflation suggests that an increase in inflation rate brings uncertainty in economic
environment. This uncertainty theoretically increases the probability that firms will not have
the ability to repay their debts. Higher inflation decreases the benefits of leverage because of
higher bankruptcy costs of debt imposed on firms (Baltaci and Ayaydin, 2014). Also, elevated
uncertainty around the future of an economy will most likely see debt investors requiring
higher premiums for funding or limiting the debt capital availability.
Overall, during a high inflation environment, lenders will require higher interest rate returns
and are more likely to tighten their funding terms, and as a consequence firms will more likely
be compelled to fund themselves using internally generated cash or find shareholder support
through rights issue. This implies a reduction in debt levels. This study results are therefore in
line with international empirical evidence on the relationship between leverage and inflation
(Muthama et al., 2013; Baltaci and Ayaydan, 2014; Mokhova and Zinecker, 2014).

68
6.2.2.4. Tangibility
Tangible assets, such as property, plant and equipment, are easier for outsiders to value than
intangible ones such as the value of goodwill; this lowers lenders’ expected distress costs. In
addition, tangibility makes it difficult for shareholders to substitute high-risk assets for low-
risk ones (Frank and Goyal, 2009). The lower expected costs of distress and fewer debt-related
agency problems predict a positive relation between tangibility and leverage. In the South
African context, banks usually require some form of security when advancing short and long-
term loans to a corporates. The security can be in a form of: (a) mortgage bonds over
immovable property, (b) notarial bonds (special and general) over tangible movable property,
and (c) security cessions or pledges over financial claims (i.e. cession of shares).
The ability to provide security provides lenders with “hard” assets to sell in the event of
borrower default, making lending relatively easier and less riskier compared to a company
that doesn’t have tangible assets to offer as security. Therefore, in a South African context,
companies with “hard” assets that can be collateralised as security are expected to have
better / greater access to bank debt and hence higher leverage. From a theoretical point of
view, trade-off theory, information asymmetry theory, and agency theory, all provide an
intuitively corroborating explanation for the fact that companies with tangible assets are
more likely to use debt in funding their operations. This research results support the
theoretical models that predict that there is a positive relationship between leverage and
tangibility.
Scott (1977) suggests that, by selling secured debt, firms increase the value of their equity by
expropriating wealth from their existing unsecured creditors. Providing security to debt
funders is advantageous for corporates also, as it may reduce the funding costs whilst allowing
for more leverage. Myers and Majluf (1984) model demonstrate that there may be costs
associated with issuing securities about which the firms’ managers have better information
than shareholders. Issuing debt secured by property with known values avoids these costs.
For this reason, firms with assets that can be used as collateral are expected to issue more
debt to take advantage of this opportunity (Titman and Wessels, 1988). The research results
support this view.
Much research examining the correlation between leverage and tangibility in developing
countries has proved that a positive relationship exists because tangible assets are easy to
collateralise for debt (Harris and Raviv, 1991; Chen, 2004; Frank and Goyal, 2009; Haron,
2014). This study also confirms this positive relationship between a firm’s leverage and the
tangibility of its assets. In particular, the results show the significance at 1% and 5% for book
value leverage and market value leverage respectively. The empirical research conducted
indicates that South African lenders require tangible assets as security in order to provide
debt capital and such security forms an important part of lending policy. This result is also
consistent with both the trade-off theory (in terms of financial distress and bankruptcy) and
the pecking order theory hypothesis (in terms of asset mispricing) (Chen, 2004).

69
6.2.2.5. Size
Theoretically, the relationship between a firm’s size and its leverage is not clear; however
some empirical studies in capital structure have found a positive relation between firm size
and leverage (Chen, 2004). According to the trade-off theory, large firms are expected to have
a higher debt capacity and are able to be more highly geared (Frank and Goyal, 2009). Large
firms tend to be more diversified in terms product offering and operational revenue streams,
thus, less exposed to adverse economic performance and the risk of bankruptcy. They may
also be able to reduce transaction costs associated with long-term debt issuance and hence
the ease of raising debt capital. This research results confirms the trade-off theory prediction
that firm size has a positive relationship with leverage.
This research results also confirms the results of Rajan and Zingales (1995) and Wald (1999)
that suggested that size was positively correlated with debt based on the data from developed
countries. Larger companies in South Africa are less risky borrowers as they are less likely to
default and hence lenders (financial institutions and “Big 5” banks) are more likely to supply
them with more debt at better funding rates. Larger companies have better chances of
surviving economic downturns and hence theoretically a lower risk of bankruptcy. This
research results confirm the trade-off theory model and they are consistent with prior studies
(Frank and Goyal, 2009; Drobetz and Wanzenried, 2006; Harris and Raviv, 1991; Graham,
2000).
However, when size is used as a proxy for the (inverse) probability of default, it should not be
strongly positively correlated with leverage in countries where costs of financial distress are
low (Chen, 2004). Furthermore, according to the pecking order hypothesis, informational
asymmetries between insiders within a firm and capital markets are expected to be lower for
large firms, so large firms should be more capable of issuing informationally sensitive
securities like equity (Chen, 2004) or listed bonds. Titman and Wessels (1988) both found
evidence to support the negative hypothesis between size and leverage. This research results
do not support the pecking order hypothesis but rather the trade-off theory model.
6.2.2.6. Profitability
There is no consistent theoretical prediction on the influence of profitability on corporate
leverage. However, in the majority of empirical studies, a negative correlation between
profitability and leverage is observed. This research has confirmed the same result in respect
of the sample analysed. Myers and Majluf (1984) predict a negative relationship, because
firms prefer to finance with internal funds rather than debt. Their view is in support of the
pecking order theory. The negative influence of profitability on leverage becomes stronger as
a firm’s size increases (Rajan and Zingales, 1995). Rajan and Zingales (1995) found that for
firms in the smallest size quintile in their study, a unit increase in profitability decreases
leverage by -0.26. For firms in the largest quintile, a unit increase in profitability decreases
leverage by -1.09; over 4 times the effect as that for the smallest quintile (and significantly
different). Firms listed on JSE and that form part of the All Share Index tends to be large in

70
their sectors, and these are the firms that form part of the sample used for the purposes of
this research.
This research results do not support the predictions of Jensen (1986) that, if the market for
corporate control is effective and it forces firms to commit to paying out cash by leveraging
up or dividend payout there should be a positive relationship between profitability and
corporate leverage. This research results indicate an ineffective corporate control since
managers of profitable firms may prefer to avoid the disciplinary role of debt, which leads to
a negative correlation between profitability and debt (Rajan and Zingales, 1995). This research
found a negative relation between profitability and leverage for the sample companies listed
on JSE Limited stock exchange. This is as expected, since profitable companies are more likely
to be cash generative and more likely to have the ability to repay their debt faster. The results
are also statistically significant at a 1% confidence level for both market value leverage and
book value leverage.
6.2.3. Capital markets friction and leverage ratios
In order to examine the effects of extreme capital markets disruption on the leverage ratios
of South African corporates, this research ran the fixed effect regression on total debt ratio.
This study did not divide the total debt ratio into its components (such as short term debt,
long term debt and trade credit) in order to examine each component structure individually
and gain an understanding on the exact channel through which supply shocks travel. Although
this helps understand the substitution across credit sources, this has been left for further
research (since time and length constraints didn’t allow for it in this research)
MF represents the capital markets friction dummy for the disruption period in equation 10,
equation 11 and equation 12. The impact of the dependent variable during the friction period
is given by the sum of the coefficient associated with the given variable and variable
interacted with the friction dummy. The friction dummy is interacted with control variable to
determine the change in response relative to the pre-friction period and the net response
during the friction period is found by adding the coefficients. The coefficient referring to the
pre-friction period is given by the non-interacted variables. SZ is the measure of size, TAN is
the measure of tangibility and PROF is measure of profitability given by EBIT divided by total
assets. ***,**,* representing 1%, 5% and 10% levels of significance respectively.

71
Table 10 - Effects of extreme capital markets' frictions and leverage ratio
Results from the estimation from equation 11 and equation 12 are represented in table 10.
The dependent variable is the leverage ratio. The results show that all independent variables
have the expected signs and are highly significant at 1% level. This study is more focused on
MF (i.e. the friction dummy variable), which was the variable of interest for the purposes of
the regression model. This research was interested in the sign and significance of this variable
MF.
The results in table 10 highlight that the coefficient of the friction dummy is negative and
significance at 1% confidence level under the book value leverage and only showing the
expected sign under market value leverage definition and not significant. This implies that the
capital markets friction has a negative impact on corporate leverage. Interpreted differently,
the flow of credit to these firms was reduced during these two isolated friction periods. This
suggests that supply of debt capital is an important determinant of corporate financing.
6.2.4. Macroeconomic condition and capital structure speed adjustment
The table below presents differences in means and medians of leverage variables across
various macroeconomic states over the sample period 2000 – 2014. This study determines
states using two macroeconomic factors. The two macroeconomic factor indicators are: GDP
growth rate and Inflation rate. This research divides the 15 years in the sample periods into
quintiles based on each macroeconomic factor. Sorting by GDP growth factors years in the
highest macroeconomic quintile – good state (lowest macroeconomic quintile – bad state)
and GDP growth rate are in the highest (lowest) quintile. Sorting by inflation rate places years
Regression results - Capital Markets' Frictions (2001 - 2002, 2007 - 2009)
Variable name Coefficient Std. Error T-statistic p-value Significance
Book value leverage - Equation 11
'EBIT' -0,3469 0,0896 -3,8727 0,0001 ***
'Tangibility' 0,2132 0,0726 2,9381 0,0034 ***
'Size' 0,0252 0,0094 2,6983 0,0071 ***
'CR' -0,2321 0,0845 -2,7476 0,0061 ***
'CR*EBIT' 0,2586 0,1122 2,3043 0,0214 **
'CR*Tangiability' 0,0330 0,0722 0,4564 0,6482
'CR*Size' 0,0210 0,0068 3,0715 0,0022 ***
R-squared = 0.0354
Market value leverage - Equation 12
'EBIT' -0,3037 0,0454 -6,6886 0,0000 ***
'Tangibility' 0,1115 0,0413 2,6996 0,0070 ***
'Size' 0,0212 0,0049 4,2934 0,0000 ***
'CR' -0,0048 0,0475 -0,1018 0,9190
'CR*EBIT' 0,2761 0,0585 4,7166 0,0000 ***
'CR*Tangiability' 0,0887 0,0401 2,2141 0,0270 **
'CR*Size' -0,0087 0,0037 -2,3238 0,0203 **
R-squared = 0.0863

72
in the highest macroeconomic quintile – good state (lowest quintile – bad state) when
inflation rate in the lowest (highest) quintile. This research reports p-values for the means.
Table 11 - Summary statistics of leverage across states
Table 11 present the univariate tests of leverage across good and bad states of
macroeconomic conditions defined by different macroeconomic factors. For each factor (i.e.
the criteria dividing macroeconomic conditions into states including inflation rate and GDP
growth rate), this research reports the mean and medians in good and bad states, and the
differences in means and median between good and bad states. The P-values are reported
assuming unequal variances in variables between good and bad state sub-samples.
The results are in line with previous literature studies (Cook and Tang, 2010; Hackbarth et al.,
2006; Choe et al., 1993; Bayless and Chaplinksky, 1996; Korajczyk and Levy, 2003) and shows
that leverage ratios are generally significantly higher in bad states than in good states,
regardless of how leverage is measured (i.e. book value leverage vs. market-value leverage
ratio). Korajczyk and Levy’s (2003) agency model shows that optimal amount of leverage is
increased to realign manager’s incentives with those of shareholders during recessions and
this research results support this view.
Hackbarth et al.’s (2006) framework for analysing the impact of macroeconomic conditions
on dynamic capital structure choice predicts that leverage should be countercyclical.
Empirically, Choe et al. (1993) and Bayless and Chaplinsky (1996) present evidence that equity
issuance increases during expansions due to the countercyclical variation in adverse selection
costs. Korajczyk and Levy (2003) also provides evidence of the counter-cyclical feature of
corporate leverage. In light of the aforegoing, the counter-cyclicality of the leverage results
as evidenced from table 11 is consistent with theories developed and provided in literature.
The median leverage (i.e. both book value leverage and market value leverage) across good
and bad states exhibit the same pattern as the mean debt ratios.
Mean Median Mean Median
Book value leverage
G 28% 24% 30% 25%
B 30% 28% 32% 29%
G vs. B -2% -5% -2% -4%
p-value 0.509 0.565
Market value leverage
G 15% 10% 13% 9%
B 18% 13% 20% 15%
G vs. B -3% -3% -7% -6%
p-value 0.027 0.000
Inflation Rate GDP Growth Rate
Leverage statistics

73
6.2.4.1. Regression results for adjustment speed estimates
Table 12 presents the regression results for adjustment speed estimates from the integrated
dynamic partial adjustment capital structure model. This table reports the results of general
estimating equation (15) after substituting 𝐿𝑉𝑖,𝑡 for 𝐵𝐿𝑉𝑖,𝑡 and 𝑀𝐿𝑉𝑖.𝑡 where applicable:
𝐿𝑉𝑖,𝑡 = (1 − 𝛿)𝐿𝑉𝑖,𝑡−1 + 𝛿𝛼𝑖 + 𝛿𝛾Macro𝑖,𝑡−1 + 𝛿𝛽𝑋𝑖,𝑡−1 + 𝜇𝑖𝑡 by controlling for firm fixed
effects across good and bad macroeconomic states. Substituting 𝐿𝑉𝑖,𝑡 for 𝐵𝐿𝑉𝑖,𝑡 and 𝑀𝐿𝑉𝑖.𝑡
results in equiation 16 and equation 17 respectivley. Columns 2, 3 and 4 in Panel A present
the estimation results when the book-value leverage ratio is used, computed as (long term
debt + short-term book debt)/(long term debt + short-term book debt + equity book value).
Column 5, 6 and 7 in Panel A report the estimation results when market-value leverage is
used, computed by (long term debt + short-term book debt)/(long term debt + short-term
book debt + share price*number of shares outstanding). The independent variables are as
follows: GDP is the annualised real GDP growth rate. Prime rate is a reference interest rate
commercial banks use when issuing variable interest rate loans to their customers. CPI is the
official measure of annual inflation that is used in South Africa. EBIT is the operating profit
divided by the total assets. Tangibility is the ratio of tangible assets to the book value of total
assets. Size is measured as the logarithm of total assets. GoodDummy takes the value of 1 if
the firm year observation belongs to a good state and the value of 0, if otherwise. The
research creates interaction terms between the lagged leverage ratio, and the good state
dummy variable. Panel A and Panel B report the estimation results for the good, bad and
pooled-state sub-samples are defined by inflation rate and GDP growth rate. These two
macroeconomic indicators define good and bad states as follows: (1) GDP is the annualised
real GDP growth rate and (2) CPI is the official measure of annual inflation that is used in South
Africa. Sorting by inflation rate places years in the highest macroeconomic quintile – good
state (lowest quintile – bad state) when inflation rate in the lowest (highest) quintile. Sorting
by GDP growth factors years in the highest macroeconomic quintile – good state (lowest
macroeconomic quintile – bad state) and GDP growth rate are in the highest (lowest) quintile.
This research reports coefficient estimates in the tables (t-statistics are in parenthesis) with
***, **, and * indicating significance at the 1%, 5% and 10% levels, respectively.
Integrated dynamic partial adjustment capital structure model results analysis
In order to compare the difference in the speed of capital structure adjustment towards
target between good and bad states, the research includes an interaction term, computed by
the product of the lagged leverage and the good state dummy variable, which takes the value
of 1 if the firm-year observation belongs to a good state and takes the value 0 if otherwise.
Panel A presents estimation results for equation (16), when the states of macroeconomic
conditions are defined by inflation rate.

74
Table 12 - Good vs. Bad states when states are determined by inflation rate
The results show that, for both book value leverage and market value leverage, firms adjust
their capital structure back to target leverage slower in good states than in bad states.
Specifically, column 2 and 3 show that when the leverage ratio is based on book value
leverage definition, firms adjust slower in good states as reported in LagLev (16.6% = 1 -
83.4%) in column 2 than in bad state (58.4% = 1 – 41.6%) in column 3. Interpreted differently,
for the book value leverage ratio, firms close in one year about 16.6% (since 1 – 𝛿 = 83.4%)
of the gap between the actual and target leverage ratio in good states, while they correct
about 58.4% of the deviation away from target in bad states. The positive coefficient
estimate on the interaction term between the lagged book value leverage and the good state
dummy (GoodDummy*LagLev) in the pooled regression is further evidence that adjustment
is faster in bad state than in good state. GoodDummy*LagLev is significantly positive under
the book value leverage.
Column 5 through to 7 in Panel A show the results when the leverage ratio is based on market
value leverage definition. This research results are consistent with the results under book
value leverage with the exception of the interaction term (GoodDummy*LagLev). Specifically,
column 5 and 6 show that when the leverage ratio is defined by market value leverage, firms
adjust slower in good states as reported in LagLev (34.8% = 1 - 65.2%) in column 5 than in bad
state (50.1% = 1 – 49.9%) in column 6. Interpreted differently, for the book value leverage
Panel A. Results from regression when states are determined by inflation rate
'LagLev'0,834
(16,71) ***
0,416
(9,38) ***
0,515
(22,25) ***
0,652
(16,99) ***
0,499
(8,5) ***
0,568
(22,42) ***
'GDP'-0,876
(-1,21)
-0,02
(-0,07)
0,9
(3,24) ***
0,129
(0,41)
-0,464
(-1,95) *
0,29
(2,93) ***
'Prime'1,741
(1,36)
-0,723
(-0,67)
0,206
(0,61)
0,818
(1,47)
-1,574
(-1,72) *
0,659
(3,46) ***
'CPI'-0,504
(-1)
1,049
(1,11)
0,098
(0,37)
-0,364
(-1,61)
2,636
(3,31) ***
-0,245
(-1,74) *
'EBIT'-0,049
(-0,54)
0,167
(1,21)
-0,087
(-1,43)
-0,003
(-0,06)
-0,161
(-1,27)
-0,077
(-2,16) **
'Tangibility'0,137
(1,3)
0,05
(0,57)
-0,004
(-0,08)
0,058
(1,29)
-0,021
(-0,25)
0,05
(1,6)
'Size'0,019
(0,79)
0,031
(1,47)
0,02
(1,91) *
0,04
(3,44) ***
0,026
(1,46)
0,035
(5,9) ***
'GoodDummy'-0,084
(-4,82) ***
-0,012
(-1,34)
'GoodDummy*LagLev'0,318
(7,58) ***
-0,041
(-1,21)
R-square0,81 0,53 0,38 0,98 0,82 0,46
Nobs266 266 1290 228 224 1143
Market Value - Equation 17Book Leverage - Equation 16
G vs. B Good Bad G vs. BGood Bad

75
ratio, firms close in one year about 34.8% (since 1 – δ = 65.2%) of the gap between the actual
and target leverage ratio in good states, while they correct about 50.1% of the deviation away
from target in bad states.
Table 13 - Good vs. Bad states when states are determined by real GDP growth rate
The results show that, for both book value leverage and market value leverage, firms adjust
their capital structure back to target leverage faster in good states than in bad states, and
even turn to over adjust on book value leverage basis. Specifically, column 2 and 3 show that
when the leverage ratio is defined by book value leverage, firms adjust faster in good states
as reported in LagLev (103.0% = 1 – (-3.0%) in column 2 than in bad state (60.8% = 1 – 39.2%)
in column 3. Interpreted differently, for the book value leverage ratio, firms close in one year
about 103.0% (since 1 – δ = -3.0%) of the gap between the actual and target leverage ratio in
good states, while they correct about 60.8% of the deviation away from target in bad states.
The negative coefficient estimate on the interaction (GoodDummy*LagLev) term between the
lagged leverage ratio in column 7 and the good state dummy in the pooled regression is
further evidence that adjustment is faster in good states than in bad states. Also, the
interaction term is smaller (closer to 0) under the book value leverage providing evidence that
adjustment is faster in good states than in bad states.
The results of: (1) the reported book value LagLev under good states; (2) the reported market
value LagLev under good states; and (3) the interaction term between the lagged leverage
ratio and the good state dummy under both book value leverage and market value leverage,
Panel B. Results from regression when states are determined by real GDP growth arte
'LagLev'-0,03
(-0,41)
0,392
(7,53) ***
0,528
(16,44) ***
0,132
(1,56)
0,679
(15,24) ***
0,567
(22,65) ***
'GDP'7,287
(1,43)
0,863
(4,09) ***
0,729
(2,98) ***
1,029
(0,68)
1,593
(10,18) ***
0,549
(5,63) ***
'Prime'1,719
(1,51)
2,158
(3,15) ***
0,231
(0,67)
1,339
(3,25) ***
4,142
(8,39) ***
0,722
(3,79) ***
'CPI'-5,917
(-1,21)
-2,565
(-3,51) ***
0,241
(0,75)
-1,128
(-0,77)
-5,245
(-9,39) ***
-0,569
(-3,44) ***
'EBIT'-0,63
(-2,77) ***
0,143
(2,5) **
-0,124
(-1,99) **
-0,05
(-0,52)
-0,001
(-0,02)
-0,068
(-1,9) *
'Tangibility'0,214
(0,91)
-0,006
(-0,08)
0,018
(0,33)
-0,054
(-0,78)
0,036
(0,59)
0,052
(1,65) *
'Size'0,249
(2,56) **
0,022
(1,06)
0,026
(2,45) **
0,048
(1,47)
0,024
(1,71) *
0,035
(5,92) ***
'GoodDummy'0,007
(0,36)
-0,028
(-2,85) ***
'GoodDummy*LagLev'0,055
(1,45)
-0,024
(-0,64)
R-square 0,17 0,66 0,35 0,52 0,94 0,46
Nobs 262 292 1290 218 275 1143
Market Value - Equation 17Book Leverage - Equation 16
G vs. B Good Bad G vs. BGood Bad

76
all need to be qualified. These results are all insignificant even though they are intuitively of
the right magnitude and in the right direction. This provides scope for further research.
In light of the results in table 12 and table 13, it can be concluded that firms adjust faster in
bad state when leverage ratio is measured by the book value leverage and market value
leverage when the states are determined by inflation rate. The results support an intuition
that firms adjust their leverage faster in bad state than in good state. However, the results
when the states are determined in relation to GDP growth rate are not in support of the
results when the states are determined by inflation rate. Table 4 indicates that the good states
and bad states using GDP growth and inflation only overlap twice (i.e. 2004 and 2008) and
intuitively there is an expectation that one definition results may not confirm the other. The
results under the GDP growth rate states are in line with Cook and Tang (2010) and consistent
with the prediction of Hackbarth et al.’s (2006) model. However, the results of adjustment
speed are inconclusive across macroeconomic condition as defined by GDP growth rate for
both book value leverage and market value leverage.
7. Summary and conclusion
This study looked at how a sample of JSE Limited companies fund their investments and
general corporate activities. This research looked at three related issues that impact
corporate leverage in South Africa. Firstly, this research investigated the importance of firm
specific characteristics and macroeconomic factors on corporate capital structure decision
making in South Africa. The analysis is based on firm-level data from 2000 – 2014 and
macroeconomic data (GDP growth rate, inflation rate and prime interest rate) for the same
period.
Secondly, this research investigated the effects of extreme capital markets friction on credit
supply and financing decisions of corporates in South Africa. This research does not
investigate how corporates switch within funding channels through disruption periods. In
addition, this research does not investigate how the decline in leverage comes about.
Whether this is through equity issuance or internally generated cash flows, the research does
not investigate these possible reasons for the decline in leverage. However, the results
suggest that extreme capital market frictions do affect credit supply and corporate financing
decisions.
Thirdly, this study investigated the impact of macroeconomic condition on the speed of
capital structure adjustment by analysing South African data over the sample period from
2000 to 2014. Cook and Tang (2010), Korajczyk and Levy (2003) and Camara (2012) agree that
macroeconomic conditions play an important role in determining the adjustment speed and
firms financing choices because capital structure choices are quite diverse and much
dependent on the time and the firms leverage type (Tzang et al., 2013).
This research presents some interesting findings regarding the impact of macroeconomic
factors on capital structure of firms. The empirical results show that macroeconomic
conditions have a significant effect on capital structure dynamics and financing patterns. This

77
research finds a positive relationship between GDP growth rate and leverage. This finding
indicates that corporates do lever themselves up in order to take advantage of perceived
growth opportunities. Consistent with Shleifer and Vishny (1992) and Hackbarth et al. (2006)
firm’s debt capacity depends on current economic conditions. Firms can typically borrow
more funds in an economic boom, even assuming a constant loss given default. Hackbarth et
al. (2006) also find that if the recovery rate is procyclical, then the debt capacity of a firm in a
boom can be up to 40% larger than the debt capacity of the same firm in a contraction. This
research’s results are in line with these prior studies regarding the effects of GDP growth on
the ability for corporates to leverage themselves. These findings are also in line with evidence
found in other international studies (Korajczyk and Levy, 2003; Hackbarth et al., 2006;
Muthama et al., 2013; Mokhova and Zinecker, 2014)
This study also finds a negative relation between inflation and leverage. Intuitively, these
results are in line with expectation that higher inflationary periods represent more
uncertainty in the economy. From the borrower’s point of view, it wouldn’t be prudent to
take on more debt to invest further in projects when the purchasing power of its functional
currency is declining and its clients’ purchasing power is also declining. Moreover, uncertain
economic environments present a higher probability of default (and potentially bankruptcy)
and the suppliers of capital (i.e. banks and financial institutions) are more likely not be
aggressively lending during these periods. This research’s results in this regard are in line with
the international evidence on the relationship between leverage and inflation (Muthama et
al., 2013; Baltaci and Ayaydan, 2014; Mokhova and Zinecker, 2014).
A surprising result from this research is the relation between leverage and interest rates. This
research found a positive relationship between interest rates and leverage. This expectation
is more a demand-side assumption. As interest rates increase, firms are less willing to finance
new investments due to the increase in the cost of borrowings. Therefore, the research
expectation was that interest rates would be inversely correlated to leverage. This research
results are in contrast to Barnea, Haugen and Senbet (1981) predictions that firms would be
more willing to issue more debt if the yield on debt is low enough to compensate for any
additional costs such as agency costs. Furthermore, the supply of corporate bonds is positively
related to equity yields.
The results are however in line with the theoretical model of Kim and Wu (1988) that indicate
that the aggregate demand for corporate bonds is positively correlated to corporate bond
yields, ceteris paribus. Put differently, given a certain level of corporate bond yield, the
demand for corporate bonds will be higher if the yields on equities are smaller or,
equivalently, if the yield spread between corporate bonds and the competing securities
become larger. These arguments are in line with the supply-side effect on leverage.
At a high level, the supply-side effect assumes that the suppliers of capital tend to ration
capital based on the asset class that’s providing the best risk-adjusted return. Therefore, in a
high interest rate environment the supply of equity will decline due to the increase in supply
of debt capital in pursuit of high return. Corporates looking for funding are more likely to raise

78
debt funding after considering the tax-shield and default probability. These findings are
indeed in line with theoretical assumptions (Schall, 1984; Kim and Wu, 1988).
Another interesting observation relates to extreme capital market frictions and capital supply.
The results suggest that the exchange rate volatility and the financial crisis adversely affected
the total debt ratio of the sample firms. The results of equation 11 highlight that the
coefficient on the crisis dummy is negative and significant at the level of 1% or better. This
implies that during two window events (i.e. rand crisis and financial crisis), the flow of credit
slowed to the sample firms which implies that it is not only the supply side that matters in
making corporate financing decisions however executives need to consider the conditions of
capital markets. This also suggests that the supply of debt capital is an important determinant
of a firm’s financing decisions, which means that aggregate external financing activities of the
sample firms contracted in response to credit supply shocks.
These finding are, however, in contrast with Nilsen (2002), Peterson and Rajan (1997) and
Atanasova and Wilson (2003, 2004) who argue that when the supply of term debt is
squeezed, firms increase the use of working capital facilities in order supplement long term
debt. If corporates are able to switch between forms of funding, move from long term debt
funding to short term funding during extreme capital market frictions periods, leverage
should be stable or continue to increase. The findings of this study are in contrast to this
literature (Nilsen, 2002; Peterson and Rajan, 1997; Atanasova and Wilson, 2003; Atanasova
and Wilson, 2004) by suggesting that during extreme capital market frictions, supply of
funding from financial institutions to corporates declines. Thus, working capital facilities
drawings do not compensate for the reduction in long term funding from financial
institutions, which has a clear corporate funding policy implications (Rehman et al., 2013).
Another contrast to this research results is the findings by Ivashina and Scharfstein (2008)
that found that, after the failure of Lehman Brothers in September 2008, there was a run by
short-term bank creditors, making it difficult for banks to roll over their short term debt.
Finally, the results show that when the macroeconomic conditions are defined by reference
to the inflation rate, South African firms adjust their capital structure faster in bad states
(when leverage ratio is defined by both book value leverage and market value leverage).
When the macroeconomic conditions are defined by reference to the GDP growth rate, the
adjustment speed is greater during good states than it is during bad states (when leverage
ratio is defined by both book value leverage and market value leverage). The results when
macroeconomic conditions are defined with reference to GDP growth rate are inconclusive
due to the statistical insignificance of the coefficient.
7.1. Contributions
Firstly, this research aims to contribute to the knowledge of capital structure: (1) by examining
the determinants of capital structure across a sample of non-financial corporates that
constitute the majority of All Share Index; and (2) by focusing on both the characteristics of
the corporates and macroeconomic factors. This research has found a positive correlation

79
between leverage on the one hand and size and tangibility on the other; while profitability
has a negative correlation with leverage using both book value leverage and market value
leverage. These results are in line with the well-documented international evidence on the
relation between leverage and firm-specific determinants.
Secondly, this research contribute to the existing literature by first suggesting that both
demand and supply factors are crucial in understanding firms’ financing decisions. Thirdly, the
study extends the previous literature (Lemmon and Roberts, 2010; Rehman et al., 2013;
Faulkender and Peterson, 2006; Kisgen, 2006) on the implications of the financial crisis and
access to capital on firms’ behaviour. Finally, this research results contribute to the existing
literature that indicate that firm level characteristics have differing effects on the adjustments
and macroeconomic conditions play a significant role in influencing variations in capital
structure adjustments speeds (Cook and Tang, 2010; Chipeta and Mbululu, 2013; Hackbarth
et al., 2006; Tzang et al., 2013).
7.2. Limitations
The findings of this research are subject to some limitations. Firstly, there are several other
economic and institutional factors in the South African economy that potentially influence
corporate leverage and this research was limited to considering only three firm specific
characteristics and three key economic variables and their impact on corporate leverage.
Secondly, another limitation is the use of annual data (Rehman et al., 2013). Due to the non-
availability of quarterly data from the available database this research uses annual data in the
analysis. The frequency of using of quarterly data would however add new insights into
research findings and contributions. Thirdly, this research covered two isolated periods being:
(1) the 2001 – 2002 ZAR currency crisis and (2) the 2007 – 2009 global financial crises, and
South Africa has been part of the global economy since the late 90s, a longer period might
enhance the robustness of the results in this research.
Finally, patterns of firms financing decisions might not be observed clearly within 15 years.
The financing decisions and the effect of macroeconomic condition may be more completely
portrayed if the observed period could be extended. The macroeconomic condition defined
by the research only includes inflation rate and GDP growth rate. This may also deliver
inconsistent results delivered by both measures.
7.3. Recommendations
This study recommends a number of further research ideas around capital supply and
accessibility. In particular, investigating the financing decisions of firms during the disruption
period and comparing them with the pre-disruption and post-disruption period could be an
interesting area for future research. In addition, this research does not investigate whether
corporates switch from long-term funding to short-term funding during extreme capital
market disruption period and whether the reduction in leverage is through equity issuance or

80
internally generated cash flows. It would be very interesting to find answers to these
questions.
Future research should also consider the role of relationship lending during the friction
periods. In this regard, existing evidence suggests that establishing relationship with lenders
enhances the availability of financing during the friction period (Peterson and Rajan, 1997).
In addition, it has also been argued in the literature that a longer relationship with the lender
helps firms pay lower interest rates and pledge little or no collateral for loan capital borrowed
by them (Boot and Thakor, 1994). Therefore, investigating the role of relationship lending
during the disruption period could be an area for future research.
As far as economic conditions and corporate leverage is concerned, this research results raises
a number of interesting issues that can be addressed in the future research. Firstly, as with
other empirical studies (Cook and Tang, 2010; Korajczyk and Levy, 2003), the results suggests
that financing decisions reflect the state of the economy. Since information regarding security
issues is contemporaneous, it may be more useful in describing economic conditions than, for
example, infrequently reported information in – a firm’s earnings update (Korajczyk and Levy,
2003). Korajczyk and Levy (2003) argue that such results are of interest to policy makers as
well as to the research literature on asset pricing literature. Secondly, this research only
focused on how macroeconomic conditions impact the speed of adjustment or the level of
debt in the capital structure, it would also be very interesting to understand how
macroeconomic conditions impact the maturity structure of debt chosen by firms.

81
References
Al - Najjar, B., & Taylor, P. (2008). The relationship between capital structure and ownership structure:
New evidence from Jordanian panel data. Managerial Finance Journal, 34 (12), 919 - 933.
Almeida, H., Campello, M., Laranjeira, B., & Weisbenner. (2012). Corporate debt maturity and the real
effects of the 2007 credit crisis. Critical Finance Review, 1(1), 3 - 58.
Al-Najjar, B., & Hussainey, K. (2011). Revisiting the capita-structure puzzle: UK evidence. The Journal
of Risk Finance, 12(4), 329 - 338.
Alti, A. (2006). How persistent is the impact of market timing on capital structure. The Journal of
Finance, 61(4), 1681 - 1710.
Andrade, G., & Kaplan, S. (1998). How costly is financial (not economic) distress? Evidence from highly
leveraged transactions that became distressed. The Journal of Finance, 56(5), 1443 - 1493.
Asquith, P., & Mullins, D. (1986). Equity issues and offering dilution. Journal of Financial Economics,
15(2), 61 - 89.
Atanasova, C., & Wilson, N. (2003). Bank borrowing constraints and the demand for trade credit:
evidence from panel data. Managerial and decision economics, 24(6), 503 - 514.
Atanasova, C., & Wislon, N. (2004). Disequilibrium in the UK corporate loan market. Journal of Banking
& Finance, 28(3), 595 - 614.
Baker, M., & Wurgler, J. (2000). The equity share in new issues and aggregate stock returns. The
Journal of Finance, 55(5), 2219 - 2257.
Baker, M., & Wurgler, J. (2002). Market timing and capital structure. The Journal of Finance, 57(1), 1 -
32.
Baltaci, N., & Ayaydin, H. (2014). Firm, country and macroeconomic determinants of capital structure:
Evidence from Turkish banking sector. Emerging Markets Journal, 3(3), ISSN 2158 - 8708
(online).
Banerjee, S., Heshmati, A., & Wihlborg, C. (2000). The dynamics of capital structure. New York: SSE/EFI
Working Paper Series in Economics and Finance No. 333.
Barnea, A., Haugen, R., & Senbet, L. (1981). An equilibrium analysis of debt financing under costly tax
arbitrage and agency problems. Journal of Finance, 36(3), 569 - 581.
Bauer, P. (2004). Determinants of capital structure emperical evidence from the Czech Republic. Czech
Journal of Economics and Finance, 54, ã. 1-2.
Bayless, M., & Chaplinsky, S. (1996). Is there a window of opportunity for seasoned equity issuance?
The Journal of Finance, 51(1), 253 - 278.
Berger, A., & Udell, G. (1994). Did risk-based capital allocate bank credit and cause a 'Credit Crunch' in
the U.S.? Journal of Money, Credit and Banking, 26(3), 585 - 628.

82
Bernanke, B., & Gertler, M. (1995). Inside the black box: The credit channel of monetary policy
transmission. Journal of Economic Perspectives, 9(4), 27 - 48.
Bevan, A., & Danbolt, J. (2002). Capital structure and its determinants in the UK - a decompositional
analysis. Applied Financial Economics, 12(3), 159 - 170.
Bokpin, G. (2009). Macroeconomic development and capital structure decisions of firms: Evidence
from emerging market economics. Studies in Economics and Finance, 26(2), 129 - 142.
Boot, A., & Thakor, A. (1994). Moral hazard and secured lending in an infinitely repeated credit market
game. International Economic Review, 35(4), 899 - 920.
Booth, L., Aivazian, V., Demirguc-Kunt, A., & Maksimovic, V. (2001). Capital structures in developing
countries. The Journal of Finance, 56(1), 87 - 130.
Boyd, J., & Smith, B. (n.d.). The co-evolution of the real and financial sectors in the growth process.
Working Paper 541, World Bank Conference on Stock Markets, Corporate Finance, and
Economic Growth. Retrieved 19 July 2015.
Bradley, M., Jarrell, G., & Kim, H. (1984). On the existence of an optimal capital structure: Theory and
evidence. The Journal of Finance, 39(3), 857 - 878.
Brigham, E., & Houston, J. (1998). Fundamentals of Financial Management, 8th Edition. Chicago: The
Dryden Press.
Brinkmann, E., & Horvitz, P. (1995). Risk-based capital standards and the credit crunch. Journal of
Money, Credit and Banking, 27(3), 848 - 863.
Camara, O. (2012). Capital structure adjustment speed and macroeconomics conditions: U.S MNCs
and DCs. Journal of Multinational Financial Management, 22(5), 278 - 301.
Chava, S., & Purnanandam, A. (2011). The effect of banking crisis on bank-dependent borrowers.
Journal of Financial Economics, 99(1), 116 - 135.
Chen, J. (2004). Determinants of capital structure of Chinese listed companies. Journal of Business
Research, 57(12), 1341 - 1351.
Chipeta, C., & Mbululu, D. (2013). Firm heterogeneity, macroeconomic conditions and capital
structure adjustment speeds: Evidence from the JSE. Investment Analysts Journal, 77, 69 - 80.
Choe, H., Masulis, R., & Nanda, V. (1993). Common stock offerings across the business cycle: Theory
and evidence. Journal of Empirical Finance, 1(1), 3 - 31.
Choi, D., Getmansky, M., Henderson, B., & Tookes, H. (2010). Convertible bond arbitrageurs as
suppliers of capital. The Review of Financial Studies, 23(1), 2492 - 2522.
Coates, J. H., & Woolley, P. K. (1975). Corporate gearing in the EEC. Journal of Business Finance &
Accounting, 2(1), 1 - 18.

83
Cook, D., & Tang, T. (2010). Macroeconomic conditions and capital structure adjustment. Journal of
Corporate Finance, 16(1), 73 - 87.
Damijan, J. P. (2014). Corporate financial soundness and its impact on firm performance: Implications
for corporate debt restructuring in Slovenia . Debt Restructuring and Insolvency: Reviving
Corporate Growth in Slovenia (p. Working Paper No. 168). Ljubljana: European Bank for
Reconstruction and Development.
DeAngelo, H., & Masulis, R. (1980). Optimal capital structure under corporate and personal taxation.
Journal of Financial Economics, 8(1), 3 - 27.
Deesomsak, R., Paudyal, K., & Pescetto, G. (2004). The determinants of capital structure: Evidence
from the Asia Pacific region. Journal of Multinational Financial Management, 14, 387 - 405.
Deesomsak, R., Paudyal, K., & Pescetto, G. (2009). Debt maturity structure and the 1997 Asian financial
crisis. Journal of Multinational Financial Management, 19(1), 26 - 42.
DeJong, A., Nguyen, T., & Kabir, R. (2008). Capital structure around the world: The roles of firm and
country-specific determinants. Journal of Banking and Finance, 32(9), 1954 - 1969.
Doku, J., Adjasi, C., & Sarpong-Kumankuma, E. (2011). Financil market development and capital
structure of listed firms - Empirical evidence from Ghana. Serbian Journal of Management,
6(2), 155 - 168.
Donaldson, G. (1961). Corporate debt capacity: A study of corporate debt policy and the determination
of corporate debt capacity. Boston: Division of research, Harvard Graduate School of Business
Administration.
Donaldson, G. (1963). Financial goals: management vs. stockholders. Harvard Business Review, 41(3),
116 - 129.
Drobetz, W., & Wanzenried, G. (2006). What determines the speed of adjustment to the target capital
structure. Applied Financial Economics, 16(13), 941 - 958.
Duchin, R., Ozbas, O., & Sensoy, B. (2010). Costly external finance, corporate investment, and the
subprime mortgage financial crisis. Journal of Financial Economics, 97(3), 418 - 435.
Fama, E. (1970). Efficient capital markets: A review of theory and a empirical work. Journal of Finance,
25(2), 383 - 417.
Fama, E., & French, K. (2002). Testing trade-off and pecking order predictions about dividends and
debt. The Review of Financial Studies, 15(1), 1 - 33.
Fama, E., & Miller, M. (1972). The Theory of Finance. Hinsdale, Illinois: Dryden Press.
Faulkender, M., & Petersen, M. (2006). Does the source of capital affect capital structure. The Review
of Financial Studies, 19(1), 45 - 79.
Flannery, M. (1986). Asymmetric Information and Risky Debt Maturity Choice. The Journal of Finance,
41(1), 19 - 37.

84
Flannery, M., & Hankins, K. (2007). A theory of capital structure adjustment speed. (Working Paper).
United States: University of Florida.
Flannery, M., & Rangan, K. (2006). Partial adjustment toward target capital structure. Journal of
Financial Economics, 79(3), 469 - 506.
Fosberg, R. (2012). Capital structure and the Financial Crisis. Journal of Finance and Accountancy, 11,
46 - 55.
Frank, M., & Goyal, V. (2003). Testing the pecking order thoery of capital structure. Journal of Financial
Economics, 67(1), 217 - 248.
Frank, M., & Goyal, V. (2004). The effect of market conditions of capital structure adjustment. Finance
Research Letters, 1(1), 47 - 55.
Frank, M., & Goyal, V. (2009). Capital structure decisions: Which factors are reliably important.
Financial Management, 38(1), 1 -37.
Gajurel, D. (n.d.). Macroeconomic influences on corporate capital structure. Available at SSRN:
http://ssrn.com/abstract=899049, Retrieved 19 July 2015.
Gambacorta, L., & Marques-Ibanez, D. (2011). The bank lending channel: lessons from the crisis. Bank
for International Settlements Working Papers No. 345, Basel, Switzland .
Gaud, P., Hoesli, M., & Bender, A. (2007). Debt-equity choice in Europe. International Review of
Financial Analysis, 16(3), 201 - 222.
Gertler, M., & Gilchrist, S. (1993). The role of credit market imperfections in the transmission of
monetary policy: Arguments and evidence. Scandinavian Journal of Economics, 95(1), 43 - 64.
Gertler, M., & Gilchrist, S. (1994). Monetary policy, business cycles, and the behavior of small
manufacturing firms. Journal of Economics, 109 (2), 309 - 340.
Graham, J. (1996). Debt and the marginal tax rate. Journal of Financial Economics, 41(1), 41 - 73.
Graham, J. (2000). How big are the tax benefits of debt? The Journal of Finance, 55(5), 1901 - 1940.
Graham, J., & Harvey, C. (2001). The theory and practise of corporate finance: evidence from the field.
Journal of Financial Economics, 60, 187 - 243.
Grossman, S., & Hart, O. (1982). Corporate financial structure and managerial incentives. In J. McCall,
The economics of information and uncertainty (pp. 107 - 140). Chigago: University of Chicago
Press.
Gwatidzo, T., & Ojah, K. (2009). Corporate capital structure determinats - Evidence from five African
countries. The African Finance Journal, 11(1), 1-23.
Hackbarth, D., Miao, J., & Morellec, E. (2006). Capital structure, credit risk, and macroeconomic
conditions. Journal of Financial Economics, 82, 519–550.

85
Haron, R. (2014). Capital structure inconclusivess: evidence from Malaysia, Thailand and Singapore.
International Journal of Managerial Finance, 10(1), 23 - 38.
Harris, M., & Raviv, A. (1990a). Capital structure and the informational role of debt. The Journal of
Finance, 45(2), 321 - 349.
Harris, M., & Raviv, A. (1991). The theory of capital structure. The Journal of Finance, 46(1), 297-355.
Henderson, B., Jegadeesh, N., & Weisbach, M. (2006). World markets for rasing new capital. Journal
of Financial Economics, 82(1), 63 - 101.
Hennessy, C., & Whited, T. (2005). Debt dynamics. The Journal of Finance, 60(3), 1129 - 1165.
Higgins, R. (1977). How much growth can a firm afford. Financial management, Fall, 7 - 16.
Hovakimian, A., Hovakimian, G., & Tehranian, H. (2004). Determinants of target capital structure: The
case of dual debt and equity issues. Journal of Financial Economics, 71(3), 517 - 540.
Hovakimian, A., Opler, T., & Titman, S. (2001). The debt equity choice. The Journal of Financial and
Quantitative Analysis, 36(1), 1 - 24.
Ikenberry, D., Lakonishok, J., & Vermaelen, T. (1995). Market underreaction to open share
repurchases. Journal of Financial Economics, 39 (2), 181 - 208.
Ivashina, V., & Scharfstein, D. (2010). Bank lending during the financial crisis of 2008. Journal of
Financial Economics, 97(3), 319 - 338.
Jahanzeb, A., Rehman, S.-U., Bajuri, N., Karami, M., & Ahmadimousaabad, A. (2014). Trade-off, perking
order theory and market timing theory: A comprehensive review of capital structure theories.
International Journal of Management and Commerce Innovations, 1(1), 11 - 18.
Jalilvand, A., & Harris, R. (1984). Corporate behavior in adjusting to capital structure and dividend
targets: An econometric study. The Journal of Finance, 39(1), 127 - 145.
Jensen, M. (1986). Agency costs of free cash flow, corporate finance, and takeovers. American
Economic Review, 76(2), 323 - 329.
Jensen, M. (1989). The eclipse of the public corporation. Harvard Business Review, 67(5), 61 - 74.
Jensen, M., & Meckling, W. (1976). Theory of the firm: Managerial behavior, agency costs and
ownership structure. Journal of Financial Economics, 3(4), 305 - 360.
Jeon, Y., & Miller, M. (2004). The effect of the Asian financial crisis on the performance of Korean
nationwide banks. Applied Financial Economics, 14, 351 - 360.
Kahle, K., & Stulz, R. (2013). Access to capital, investment, and financial crisis. Journal of Financial
Economics, 110(2), 280 - 299.
Kayhan, A., & Titman, S. (2007). Firms' histories and thier capital structure. Journal of Financial
Economics, 83(1), 1 - 32.

86
Kim, M., & Wu, C. (1988). Effects of inflation on capital structure. The Financial Review, 23(2), 183 -
200.
Kisgen, D. (2006). Credit ratings and capital structure. The Journal of Finance, 61(3), 1035 - 1072.
Kiyotaki, N., & Moore, J. (1997). Credit cycles. Journal of Political Economy, 105(2), 211 - 248.
Korajczyk, R., & Levy, A. (2001, Working Paper #279). Capital structure choice: Macroeconomic
conditions and financial constraints. Illinois: Kellogg Graduate School of Management,
Northwestern University.
Korajczyk, R., & Levy, A. (2003). Capital structure choice: macroeconomic conditions and financial
constraints. Journal of Financial Economics, 68(1), 75 - 109.
Korajczyk, R., Lucas, D., & McDonald, R. (1992). Equity issues with time-varying asymmetric
information. Journal of Financial and Quantitative Analysis, 27(3), 397 - 417.
Leary, M. (2009). Bank loan supply, lender choice, and corporate capital structue. The Journal of
Finance, 64(3), 1143 - 1185.
Lemma, T., & Negash, M. (2013). Institutional, macroeconomic and firm-specific determinants of
capital structure: The African evidence. Management Research Review, 36(11), 1081 - 1122.
Lemmon, M., & Roberts, M. (2010). The response of corporate cinancing and investment to change in
the supply of credit: A natural experiment. Journal of Financial and Quantitative Analysis,
45(3), 555 - 587.
Lemmon, M., Roberts, M., & Zender, J. (2008). Back to the beginning: Persistence and the cross-section
of corporate capital struture. The Journal of Finance, 63(4), 1575 - 1608.
Levy, A., & Hennessy, C. (2007). Why does capital structure choice vary with macroeconomic
conditions. Journal of Monetary Economics, 54(6), 1545 - 1564.
Litzenberger, R., & Kraus, A. (1973). A state-preference model of optimal financial leverage. The
Journal of Finance, 28(4), 911-922.
Loughran, T., & Ritter, J. (1995). The new issues puzzle. The Journal of Finance, 50(1), 23 - 51.
Loughran, T., & Vijh, A. (1997). Do long term shareholders benefit from corporate acquisitions. The
Journal of Finance, 52(5), 1765 - 1790.
Loughran, T., Ritter, J., & Rydqvist, K. (1994). Initial public offerings: international insights. Pacific-Basin
Finance Journal, 2(2), 165 - 199.
Love, I., Preve, L., & Sarria-Allende, V. (2007). Trade credit and bank credit: Evidence from recent
financial crises. Journal of Financial Economics, 83(2), 453 - 469.
Lown, C., & Peristiani, S. (1995). The behavior of consumer loan rates during the 1990 credit
slowdown. Journal of Banking and Finance, 20(10), 1673 - 1694.

87
Lowry, M. (2003). Why does IPO volume fluctuate so much? Journal of Financial Economics, 67(1), 3 -
40.
Mackie-Mason, J. (1990). Do taxes affect corporate financing decisions. Journal of Finance, 45(5), 1471
- 1493.
Magud, N., Reinhart, C., & Vesperoni, E. (2014). Capital inflows, exchange rate flexibility and credit
booms. Review of Development Economics, 18(3), 415 - 430.
Marsh, P. (1982). The choice between equity and debt: An empirical study. The Journal of Finance,
37(1), 121-144.
Martin, J., & Scott, D. (1974). A discriminant analysis of the corporate debt-equity decision. Financial
Management, 3(4), 71-79.
Miller, M. (1977). Debt and taxes,. The Journal of Finance, 32(2), 261 - 275.
Miller, M., & Modigliani, F. (1963). Corporation income taxes and the cost of capital: A correction. The
American Economic Review, 53(3), 433 - 443.
Mínguez-Vera, A., & Martín-Ugedo, J. F. (2007). Does ownership structure affect value? A panel data
analysis for Spanish market. International Review of Financial Analysis, 16(1), 81 - 98.
Modigliani, F. (1980). The collected papers of Franco Modigliani. Cambridge, Massachusetts: MIT
Press, 3, 11- 19.
Modigliani, F., & Miller, M. (1958). The cost of capital, corporation finance and the theory of
investment. The American Economic Review, 48(3), 261 - 297.
Modigliani, F., & Miller, M. (1966). Some estimates of the cost of capital to the electricity industry. The
American Economic Review, 56(3), 333 - 391.
Mokhova, N., & Zinecker, M. (2014). Macroeconomic factors and corporate structure. Procedia - Social
and Behavioral Sciences, 110, 530 - 540.
Morellec, E. (2010). Credit supply and corporate policies. Ecole Polytechnique Federale de Lausanne;
Swiss Finance Institute.
Moyo, V., Wolmarans, H., & Brummer, L. (2013). Dynamic capital structure determinants: Some
evidence from South African firms. Journal of Economics and Financial Sciences, 6(3), 661 -
682.
Muthama, C., Mbaluka, P., & Kalunda, E. (2013). An empirical analysis of macro-economic influences
on corporate structure of listed companies in Kenya. Journal of Finance and Investment
Analysis, 2(2), 41 - 62.
Myers, S. (1977). Determinants of corporate borrowing. Journal of Financial Economics, 5(2), 147 -
175.
Myers, S. (1984). The capital structure puzzle. The Journal of Finance, 39(3), 574 - 592.

88
Myers, S. (2001). Capital structure. The Journal of Economic Perspectives, 15(2), 81 - 102.
Myers, S., & Majluf, N. (1984). Corporate financing and investment decisions when firns have
information that investors do not have. Journal of Financial Economics, 13(2), 187 - 221.
Nakamoto, M. (2007, July 9). http://www.ft.com/cms/s/0/80e2987a-2e50-11dc-821c-
0000779fd2ac.html#axzz3pwndhJv4. Retrieved from Financial Times: www.ft.com
Ngugi, R. (2008). Capital financing behaviour: evidence from firms listed on the Nairobi Stock
Exchange. The European Journal of Finance, 14(7), 609 - 624.
Nilsen, J. (2002,). Trade credit and the banking lending channel. Journal of Money, Credit and Banking,
34(1), 226 - 253.
Ooi, J. (1999). The determinants of capital structure evidence on UK property companies. Journal of
Property Investments & Finance, 17(5), 464 - 480.
Pagano, M., Panetta, F., & Zingales, L. (1998). Why do companies go public? An empirical analysis. The
Journal of Finance, 53(1), 27 - 64.
Papke, L., & Wooldridge, J. (1996). Econometric methods for fractional response variables with an
application to 401(k) plan participation rates. Journal of Applied Economics, 11, 619-632.
Peek, J., & Rosengren, E. (1992). The capital crunch in New England. New England Economic Review,
May/June, 21 - 31.
Peek, J., & Rosengren, E. (1995). The capital crunch: Neither a borrower nor a lender be. Journal of
Money, Credit, and Banking, 27(3), 625 - 638.
Peterson, M., & Rajan, R. (1997). Trade credit: Theories and evidence. Review of Financial Studies,
10(3), 661 - 691.
Puri, M., Rocholl, J., & Steffen, S. (2011). Global retail lending in the aftermath of the US financial crisis:
Distinguishing between supply and demand. Journal of Financial Economics, 100(3), 556 - 578.
Rajan, R., & Zingales, L. (1995). What do we know about capital structure? Some evidence from
international data. The Journal of Finance, 50(5), 1421 - 1460.
Ramjee, A., & Gwatidzo, T. (2012). Dynamics in capital structure determinants in South Africa. Meditari
Accountancy Research, 20(1), 52 - 67.
Rehman, S., Akbar, S., & Ormrod, P. (2013). The impact of recent financial shocks on the financing and
investment policies of UK private firms. International Review of Financial Analysis, 26, 59 - 70.
Rubio, G., & Sogorb, F. (2011). The adjustment to target leverage of Spanish public firms:
Macroeconomic conditions and distance from target. Revista Economia Aplicada, 19(57), 35 -
63.
Schall, L. (1984). Taxes, inflation and corporate finacial policy. The Journal of Finance, 39(1), 105 - 126.

89
Scott, J. (1977). Bankruptcy, secured debt and optimal capital structure. The Journal of Finance, 32(1),
1 - 19.
Shleifer, A., & Vishny, R. (1992). Liquidation values and debt capacity: A market equilibrium approach.
The Journal of Finance, 47(4), 1343 - 1366.
Shyam-Sunder, L., & Myers, S. (1999). Testing static tradeoff against pecking order models of capital
structure. Journal of Financial Economics, 51(2), 219 - 244.
Singh, A. (1995). Corporate financial patterns in industrialing economies: A comparative international
study. International Finance Corporation, Working Paper No.2, The World Bank, Washington,
D.C.
Singh, A., & Hamid, J. (1992). Corporate financial structures in developing countries. International
Finance Corporation, 1(1), Washington DC.
Stulz, R. (1990). Managerial discretion and optimal financing polices. Journal of Finance Economics,
26(1), 3 - 27.
Suarez, J., & Sussman, O. (1999). Financial distress and the business cycle. Oxford Review of Economic
Policy, 15(3), 39 - 51.
Suhaila, M. K., & Wan Mahmood, W. M. (n.d.). Capital structure and firm charactoristics: Some
evidence from Malaysian companies. Retrieved 19 July 2015 from
http://mpra.ub.unimuenchen.de/14616/ MPRA Paper No. 14616.
Taggart, R. (1977). A model of corporate financing decisions. The Journal of Finance, 32(5), 1467 -
1484.
Taggart, R. (1985). Secular patterns in the financing of U.S. corporations. In corporate capital structure
in the United States. Chicago: The University of Chicago Press.
Thakor, A. (1996). Capital requirments, monetary policy, and aggregate bank lending: Theory and
empirical evidence. The Journal of Finance, 51(1), 279 - 324.
Thies, C., & Klock, M. (1992). Determinants of capital structure. Review of Financial Economics, 1(2),
40 - 53.
Titman, S., & Wessels, R. (1988). The determinants of capital structure. The Journal of Finance, 43(1),
1 -19.
Tzang, S.-W., Wnag, K.-Y., & Rahim, R. N. (2013). Macroeconomic condition and capital structure
adjustment speed - evidence from Indonesian stock market. Innovative Mobile and Internet
Services, IEEE Computer Society, 784 - 789.
Van den Heuvel, S. (2002). Does bank capital matter for monetary transmission. Economic Policy
Review, 8(1), 259 - 265.
Voutsinas, K., & Werner, R. (2011). Credit supply and corporate capital structure: Evidence from Japan.
International Review of Financial Analysis, 20(5), 320 -334.

90
Wahab, S., & Ramli, N. (2014). The determinants of capital structure: An empirical investigation of
Malaysian listed government linked companies. International Journal of Economics and
Financial Issues, 4(4), 930 - 945.
Wald, J. (1999). How firm characteristics affect capital structure: An international comparison. Journal
of Financial Research, 22(2), 161 - 187.
Welch, I. (2004). Capital structure and stock returns. Journal of Political Economy, 112(1), 106 - 131.