capitaland limited
TRANSCRIPT

1
18 – 24 September 2018
Europe And North AmericaNon-Deal Roadshow
CapitaLand Limited

2
Disclaimer
This presentation may contain forward-looking statements that involve risks anduncertainties. Actual future performance, outcomes and results may differmaterially from those expressed in forward-looking statements as a result of anumber of risks, uncertainties and assumptions. Representative examples of thesefactors include (without limitation) general industry and economic conditions,interest rate trends, cost of capital and capital availability, availability of real estateproperties, competition from other companies and venues for the sale/distributionof goods and services, shifts in customer demands, customers and partners,changes in operating expenses, including employee wages, benefits and training,governmental and public policy changes and the continued availability offinancing in the amounts and the terms necessary to support future business. Youare cautioned not to place undue reliance on these forward looking statements,which are based on current view of management on future events.

3
Contents
• Overview Of CapitaLand
• Financial Performance
• Business Strategy Execution Updates
• Business Updates
- CapitaLand Singapore, Malaysia, Indonesia
- CapitaLand China
- CapitaLand Vietnam
- CapitaLand International
- Retail Platform
- Commercial Platform
- Lodging Platform
• Conclusion
• Supplementary Information

4
CapitaLand Presentation May 2013
Capital Tower, Singapore
Overview Of
CapitaLand

5
Strategic FrameworkOverview Of CapitaLand
Funan, Singapore
CapitaSpring, Singapore
Suzhou Center Mall, Suzhou
Raffles City Beijing
Citadines Saint-Germain-des-Prés Paris, France
The Loft, Chengdu
Raffles City Chongqing
CapitaLand Is Asia’s Premier
Diversified Real Estate Player
Our Approach Disciplined and focused in
developing and managing our
trading and investment properties,
underpinned by best-in-class
operating platforms
Our GoalTo build long-term shareholder
value by consistently delivering
returns ahead of cost of equity

6
Investor
A Complete Real Estate Value ChainOverview Of CapitaLand
Developer
Developer
• Present in our core markets where we have long-
standing local presence
• Key component of sustainable ROE and building
long-term shareholders’ value
➢ Target 20% of capital allocation
➢ Target ~50% of operating PATMI
Asset Owner
• Focus on four principal geographies (China, SMI,
Vietnam and International)
• Provides recurring income resilience via
investment properties
• Full income contribution across asset lifecycle
through revaluation and portfolio gains
• Disciplined capital recycling (~S$3 billion p.a.)
• Optimize capital deployment through 5 REITs and
16 Private Funds
Operating Platform
• Buildout of world class operating platforms, future
proofed by digital innovation and technology
• Asset light, ROE accretive strategy through fee
income
• Key component to optimise value of investment
properties
OperatingPlatform
Asset Owner
7
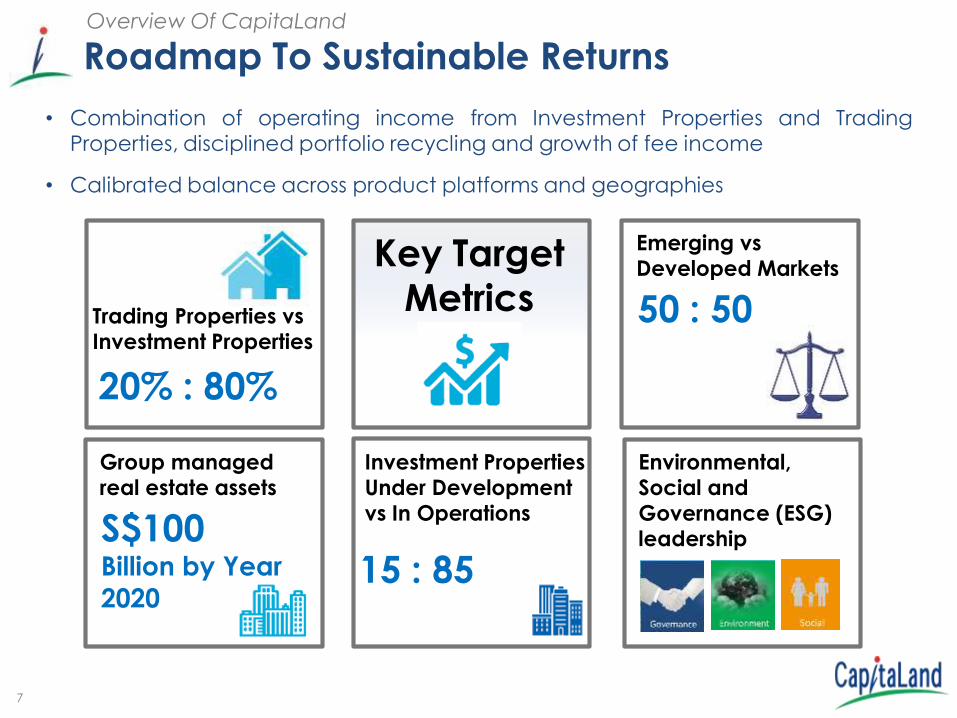
Roadmap To Sustainable ReturnsOverview Of CapitaLand
• Combination of operating income from Investment Properties and TradingProperties, disciplined portfolio recycling and growth of fee income
• Calibrated balance across product platforms and geographies
Investment Properties Under Development vs In Operations
15 : 85
Emerging vs Developed Markets
50 : 50
Group managed real estate assets
S$100Billion by Year
2020
Environmental, Social and Governance (ESG) leadership
Trading Properties vs Investment Properties
20% : 80%
Key Target Metrics

8
Staying Relevant With Real Estate Of The FutureOverview Of CapitaLand
Collective Works at Capital Tower C3 at Innov Center, Shanghai
Co
mm
erc
ial
• Provider of integrated core and
flexible workplace solutions across
the Group’s key geographies
Re
tail
• Asia’s best-in-class retail platform
and network, harnessing innovative
digital capabilities and data insights
to provide engaging retail
experiences
Lod
gin
g
• Global platform – Target 160,000 units
by Year 2023, accelerated through
strategic partnerships
• Expand branding and marketing
presence
9
Financial
Performance
Suzhou Center Mall, China

10
Overview – 2Q 20181Financials
Note:1. 2Q 2017 results restated to take into account the retrospective adjustments relating to SFRS(I)15 Revenue from Contracts with Customers
S$1,342.4million
Revenue
35% YoY
S$1,351.8million
37% YoY
EBIT
S$605.5million
PATMI
4% YoY
S$196.0million
Operating PATMI
6% YoY
2Q 2018 PATMI Increased Due To Contribution From Newly Acquired / Opened Investment Properties And Higher Revaluation Gains

11
Key Takeaways – 2Q 20181
• PATMI of S$605.5 million (vs. S$580.1 million in 2Q 2017) due to:
- Solid contribution from newly acquired / opened investment
properties to Operating PATMI
- Higher fair value gains for properties in Singapore and China
- Offset by lower contribution from residential projects in Singapore
and China
Financials
Note:1. 2Q 2017 results restated to take into account the retrospective adjustments relating to SFRS(I)15 Revenue from Contracts with Customers2. On a run rate basis
Robust Operating Performance
Healthy Balance Sheet
• Key coverage ratios
- Net debt/equity at 0.50x (vs. 0.49x in FY2017)
- Interest servicing ratio2 at 5.8x (vs. 6.7x in FY2017)
- Interest coverage ratio2 at 7.8x (vs. 8.2x in FY2017)
12
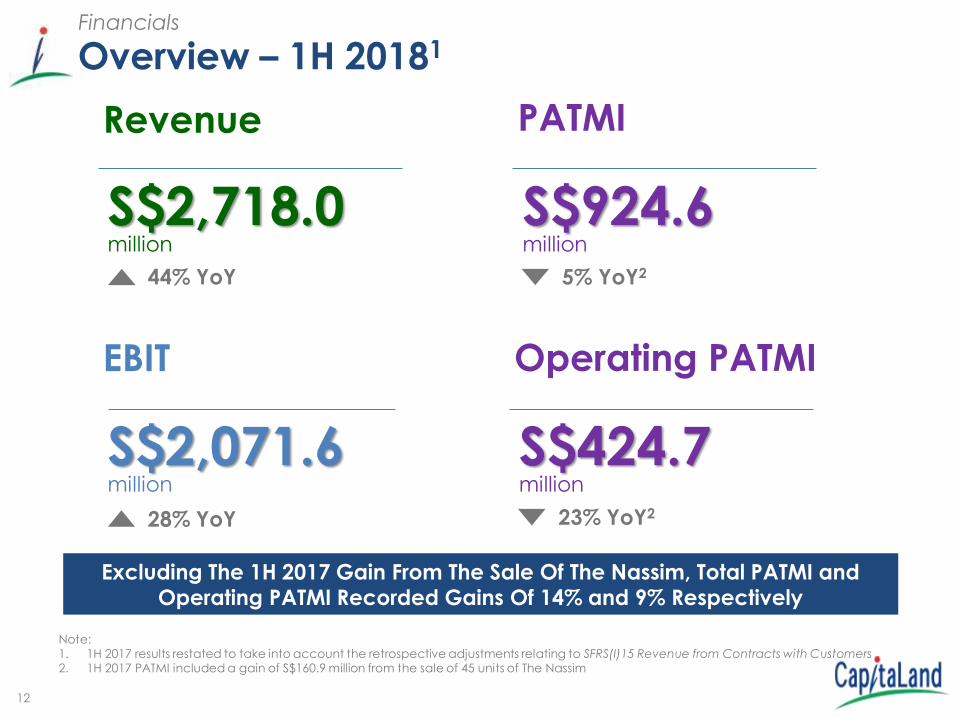
Overview – 1H 20181Financials
Note:1. 1H 2017 results restated to take into account the retrospective adjustments relating to SFRS(I)15 Revenue from Contracts with Customers2. 1H 2017 PATMI included a gain of S$160.9 million from the sale of 45 units of The Nassim
Excluding The 1H 2017 Gain From The Sale Of The Nassim, Total PATMI and Operating PATMI Recorded Gains Of 14% and 9% Respectively
S$2,718.0million
Revenue
44% YoY
S$2,071.6million
28% YoY
EBIT
S$924.6million
PATMI
5% YoY2
S$424.7million
Operating PATMI
23% YoY2

13
Financial Performance For 1H 2018Financials
Healthy Operating PATMI Growth Underpinned By Newly Acquired / Opened Investment Properties In Singapore, China And Germany
S$' million 1H 2017
(Restated)1
1H 20182
Change3
(including
gain from
The Nassim)
Change(excluding
gain from
The Nassim)
Revenue 1,889.9 2,718.0 44% 44%
EBIT 1,614.8 2,071.6 28% 42%
PATMI 972.9 924.6 -5% 14%
Operating PATMI 551.4 424.7 -23% 9%
Portfolio Gains 115.3 82.3 -29% -29%
Revaluation Gains/ Impairments 306.2 417.6 36% 36%
Note:
1. 1H 2017 results restated to take into account the retrospective adjustments relating to SFRS(I)15 Revenue from Contracts with Customers
2. CapitaLand consolidated CMT, CRCT and RCST into the Group’s results with effect from August 2017. The consolidation increased the Group’s
revenue and EBIT by approximately S$524.2 million and S$414.7 million for 1H respectively
3. 1H 2017 Operating PATMI included a gain of S$160.9 million from the sale of 45 units of The Nassim

14
1H 2018 PATMI Composition AnalysisFinancials
Cash PATMI1 Made Up 61% Of Total PATMINote:1. Cash PATMI = Operating PATMI + Portfolio Gains + Realised Revaluation Gains
82
360
58
46%
9%
45%
425
418
0%
20000%
40000%
60000%
80000%
100000%
120000%
Operating PATMI Portfolio gains Revaluations and
Impairments
PATMI
Realised revaluation gains relate to 20 China Malls, Twenty Anson & Bugis Village
925
Realised revaluation gains relate to 20 China Malls, Twenty Anson and Bugis Village
S$’ million

15
Delivering Sustainable Returns To Shareholders
Note:1. Include fair value arising from change in use of development projects of $30.5 million in FY 20162. Include corporate and unallocated cost3. Comparatives have been restated due to adoption of SFRS (I) 15 Revenue from Contracts with Customers
4.9 5.1
2.3
0.5
1.7
0.7
1.2
1.8
1.9
6.6
8.6
4.9
0
2
4
6
8
10
FY 2016 FY 2017 (Restated) 1H 2018
ROE (%)
(1)
Financials
Target To Consistently Achieve Return On Equity In Excess Of Cost Of Equity
Portfolio gains/Realised FV gains
Operating PATMI (2)
Revaluations and Impairments
(3)
16
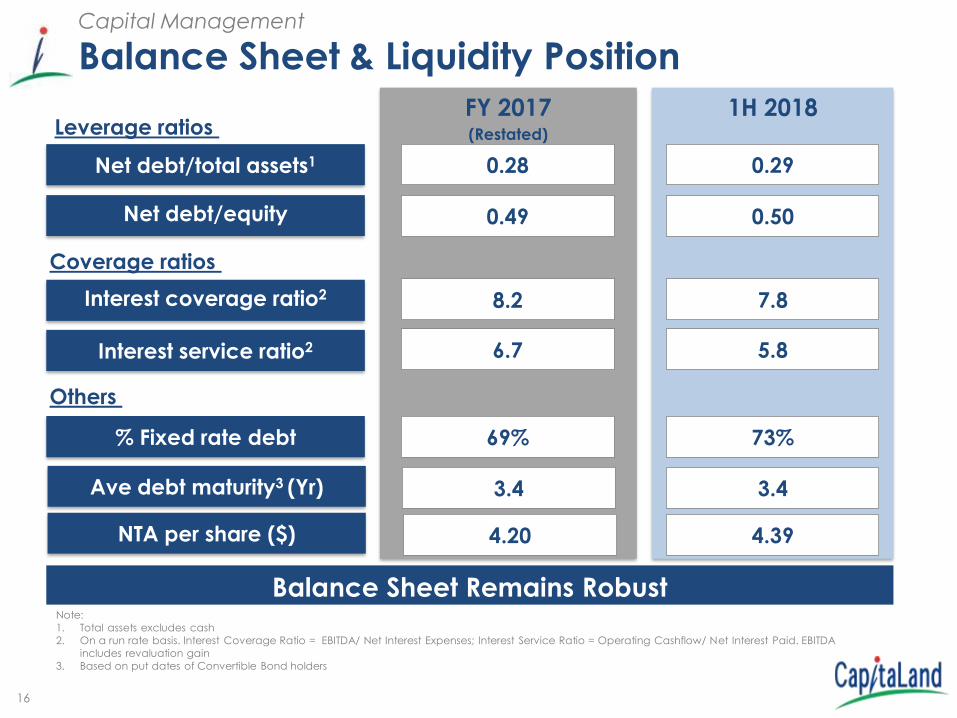
Balance Sheet & Liquidity Position Capital Management
Note:
1. Total assets excludes cash
2. On a run rate basis. Interest Coverage Ratio = EBITDA/ Net Interest Expenses; Interest Service Ratio = Operating Cashflow/ Net Interest Paid. EBITDA
includes revaluation gain
3. Based on put dates of Convertible Bond holders
Interest coverage ratio2
Net debt/equity
Net debt/total assets1
Interest service ratio2
FY 2017(Restated)
0.28
0.49
8.2
6.7
1H 2018
0.29
0.50
7.8
5.8
% Fixed rate debt 69% 73%
Balance Sheet Remains Robust
Ave debt maturity3 (Yr) 3.4 3.4
NTA per share ($) 4.20 4.39
Leverage ratios
Coverage ratios
Others

17
Well-Managed Maturity Profile1 Of 3.4 YearsCapital Management
Well Equipped With ~S$7.6 Billion In Cash And
Available Undrawn Facilities To Capture Investment Opportunities
Note:1. Based on the put dates of the convertible bonds2. Ascott Residence Trust (ART), CapitaLand Commercial Trust (CCT), CapitaLand Mall Trust (CMT), CapitaLand Malaysia Mall Trust,
CapitaLand Retail China Trust and RCS Trust (Raffles City Singapore – directly held by CCT and CMT)
On balance sheet debt due in 2018 S$’ billion
To be refinanced 1.5
To be repaid 0.1
Total 1.6
As a % of total on balance sheet debt 7.1%
Total Group cash balances and available undrawn facilities of CL's treasury vehicles = ~S$7.6 billion
(2)
Plans In Place For Refinancing / Repayment Of Debt Due In 2018
0.21.4
1.6
3.84.2
2.3
4.1
2.21.8
0.6
1.4
0.0
1.0
2.0
3.0
4.0
5.0
6.0
7.0
8.0
9.0
2018 2019 2020 2021 2022 2023 2024 2025 2026+
S$B
Total
Debt to be repaid or refinanced as planned
REIT Level Debt

18
Disciplined Interest Cost Management Capital Management
3
Note:1. Implied interest rate for all currencies = Finance costs before capitalisation/Average debt2. Implied interest rate for all currencies before restatement was 4.2%3. Straight annualisation
5.0
3.7
3.4 3.53.3 3.2 3.1
2012 2013 (Restated) 2014 2015 2016 2017 YTD Jun 201823
%
Implied interest rate
Implied Interest Rates1 Kept Low at 3.1%

19
CapitaLand Presentation May 2013
Cairnhill Nine and Ascott Orchard Singapore,
Singapore
Business Strategy
Execution
Updates

20
Business Strategy Execution Updates
1 Global Presence With Diverse Asset Classes
Note:1. Refers to the total value of all real estate managed by CL Group entities stated at 100% of property carrying value
China, 50%
Singapore, Malaysia & Indonesia, 34%
Vietnam, 2%
Rest of The World, 14%
Total RE AUM
S$93.1 Billion
2Q 2018 Real Estate Assets Under Management (AUM) Expands by S$2.1
Billion From S$91.0 Billion
On Course To Grow Total Group AUM To S$100 Billion By 2020

21
Business Strategy Execution Updates
1 Global Presence With Diverse Asset Classes (cont’d)
Note:1. Total assets from developed markets is 56.9%2. Trading properties made up ~18% of CapitaLand’s effective shares of total assets
China, 37%
Singapore, Malaysia & Indonesia, 45%
Vietnam, 2%
Rest of The World, 12%
Corporate & Others, 4%
Total Assets
S$62.5 Billion
Aim To Achieve Optimal Asset Class Allocation
Total Assets
S$62.5 Billion
Residential & Commercial Strata,
13%
Retail, 42%
Commercial, 27%
Serviced Residences,
14%
Corporate & Others, 4%
Target
Emerging vs Developed Markets
50 : 50(1)
Target
Trading Properties vs Investment Properties
20 : 80(2)

22
Business Strategy Execution Updates
2 Investment Gains Unlocked By Active Portfolio Reconstitution
Realised S$140.4 Million Gains From S$3.1 Billion Divestments And
Redeployed Into S$1.8 Billion New Investments Across Asset Classes
Sembawang Shopping Centre, Singapore Twenty Anson, Singapore
Artist’s Impression
Site in ChongqingGallileo, Frankfurt
InvestmentsConsideration
S$ million
Pearl Bank Apartments, Singapore 728.02
Grade A Office, Gallileo in
Frankfurt, Germany569.6
Mixed-use site in Chongqing,
China459.03
A real estate investment in
Vietnam40.4
Total 1,796.7
DivestmentsConsideration
S$ million
20 retail assets in China 1,705.9
Twenty Anson, Singapore 516.01
A real estate investment in
Vietnam441.5
Sembawang Shopping Centre,
Singapore248.0
Land parcel in Ahmedabad, India 10.8
Real estate investments in China 185.9
Total 3,108.1
Note:
• The table includes assets divested to unrelated parties and CapitaLand REITs/ Funds and acquired by CapitaLand / CapitaLand REITs/Funds from unrelated parties. Purchase
consideration figures are on 100% basis. Gain on divestments are based on effective stakes.
• Unless specified, transactions were completed in 1H 2018
1. Target completion in 3Q 2018
2. Target completion in 4Q 2018
3. Target completion in 2H 2018
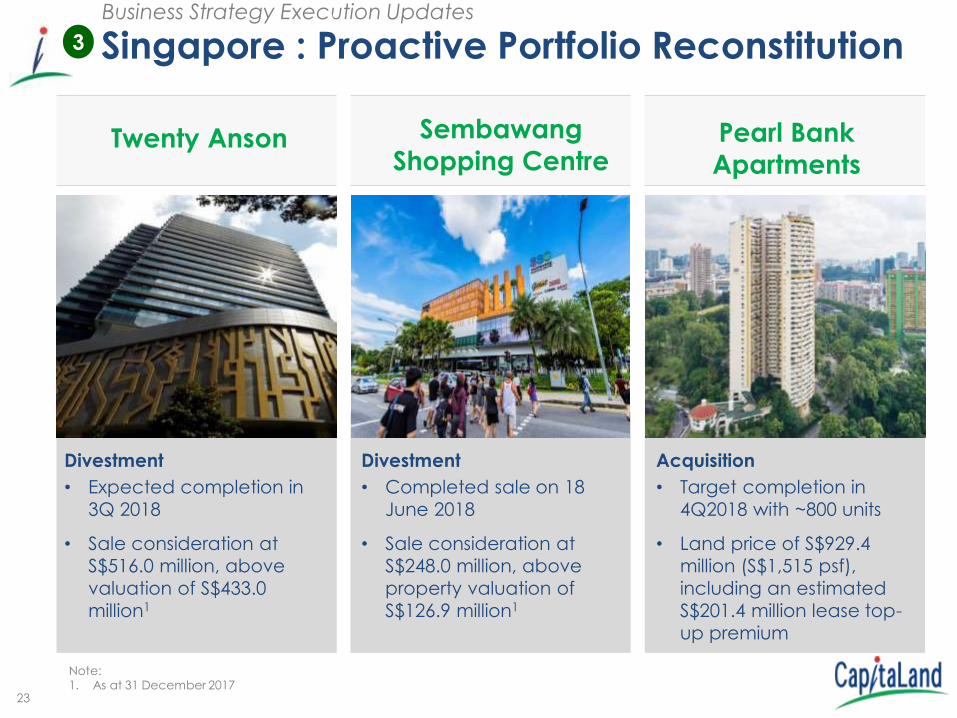
23
Sembawang
Shopping Centre
Divestment
• Expected completion in
3Q 2018
• Sale consideration at
S$516.0 million, above
valuation of S$433.0
million1
Twenty Anson Pearl Bank
Apartments
Acquisition
• Target completion in
4Q2018 with ~800 units
• Land price of S$929.4
million (S$1,515 psf),
including an estimated
S$201.4 million lease top-
up premium
Divestment
• Completed sale on 18
June 2018
• Sale consideration at
S$248.0 million, above
property valuation of
S$126.9 million1
Business Strategy Execution Updates
Note: 1. As at 31 December 2017
Singapore : Proactive Portfolio Reconstitution3

24
• 32-hectare prime mixed-use site with office and retail space
• Ramped up network in Chongqing which is experiencing rapid urbanisation dueto reforms to its residential permit system
• Economies of scale and synergies with existing developments, including RafflesCity Chongqing and serviced residences to be boosted
• Project is expected to be fully developed by 2022
China : Strengthening Footprint In A Core City Cluster
Artist’s Impression
Prime mixed-use site in Chongqing, China
Augment Landbank By Over 2,100 Units And Double Retail Network In
Chongqing
Business Strategy Execution Updates
4

25
Vietnam : Expanding Presence In The Growth Market
Business Strategy Execution Updates
5
• Added ~ 1.0 hectare Site In 1H 2018 For Future Development
• Strong Demand For New Residential Project Launches
• CapitaLand’s First Landed Property
Project In Vietnam
• Launched on 8 April 2018
• All 28 units, 100% sold with
• ASP: US$8,100 psm
• Sales value: ~US$27.2 million
Artist’s Impression
D2Eight
• Launched Block A (405 units) on 3
June 2018
• 81% sold with
• ASP: US$3,000 psm
• Sales value: ~US$96.0 million
Artist’s Impression
De La Sol

26
In Line With CapitaLand’s Strategy To Grow Our Platforms And Increase
Holdings Of Well-Located Assets In Developed Markets
Gallileo, Frankfurt
Note: 1. Include serviced residences
• Over S$1.2 billion1 of assets under
management in Germany
• Acquisition of Gallileo completed in June 2018
via a joint venture with CapitaLand
Commercial Trust
• This is CapitaLand’s second office acquisitions
in Germany in less than six months
Business Strategy Execution Updates
6
Quest Cannon Hill, Brisbane
International : Building Scale In Key Gateway Cities
• Pipeline of new-build projects on turnkey basis
from strategic partners
• Took delivery of Quest Cannon Hill, Brisbane in
July 2018
• First serviced residence in Brisbane
developed on a turnkey basis
Europe Australia

27
Lodging : Accelerating Scale-Up Through Strategic Partnerships Globally
Business Strategy Execution Updates
7
Expect To Exceed 80,000 Units In 2018 And Expand To 160,000 Units By 2023
Note:1. Figures as of 27 July 2018
• In May, the Group step-up expansion of the Citadines brand in
China through joint-ventures with China’s leading hotel
operators Huazhu Hotels Group and an apartment rental firm,
CJIA Apartments Group
• Target to more-than-triple the current Citadines portfolio in
China through signing 16,000 units by 2025
Joint venture with Huazhu Hotels and CJIA
Apartment Groups
• Ascott expands global network through strategic tie-ups with
reputable real estate developers across the globe
• New partnerships forged in YTD 2018 with Riverside Group
(China), NTT Urban Development Corporation (Japan),
Ananda Development (Thailand) and Cebu Landmasters Inc.
(The Philippines)
• Added 5,348 units in 20181
• Of a total of 29,394 in the pipeline, 3,500 are expected to turn
operational in 2H 2018
Citadines Bacolod City,
Cebu CitySomerset Rama 9 Bangkok
Artist’s Impression

28
Artist’s Impression
Business Strategy Execution Updates
8
• 3 third-party management
contracts secured in key focus
markets in Chengdu and
Guangzhou in China as well as
Phnom Penh, Cambodia
• Additional ~157,000 sqm retail
GFA secured in 1H 2018
Artist’s Impression
Retail : Dominant Malls In Core Markets
• Expanding Retail Network To Complement Existing Retail Presence
• Platform To Focus On Tech To Enhance Shoppers’ Convenience And
Tenants’ Analytics
• Launch all-in-one ePayment service,
StarPay
• About 880,000 CapitaStar members in
Singapore stand to benefit from
StarPay’s fuss-free way of auto-earning
shoppers’ rewards
Mall at Qingyang District,
Chengdu
Artist’s Impression
Mall at The Grand City,
Guangzhou
Artist’s Impression
Retail Component Of The Peak,
Phnom Penh
Artist’s Impression
Launch StarPay – An ePayment Service in April 2018

29
Commercial : Providing Integrated Core And Flex Workplace Solutions
• Made First Foray Into Shanghai’s Coworking Space With C3
• Adept At Meeting Evolving Needs Of Office Tenants
• Well-positioned To Benefit From Strengthening Office Markets Across The
Group’s Key Geographies
Business Strategy Execution Updates
9
Offering Flexibility, Mobility, Connectivity And Community To Tenants
C3 – coworking space in Innov
Center
NASDAQ-listed Bilibili, an existing tenant at Innov Center took up coworking space in C3
in May Innov Center, Shanghai

30
39.2
42.4
46.047.9
51.253.7
2013 2014 2015 2016 2017 Jun-18
On Track To Add Another S$10 Billion In AUM By 2020
Total Assets Under Management
S$ billion
• Earned S$112.7 Million In REITs/Fund Management Fees In 1H 2018 Through 5REITs And 16 PE Funds
• Successfully Closed CapitaLand Vietnam Commercial Value-Added Fund AtUS$130 million (~S$171 million)
Fund Management : Capital Deployment Optimised Through REITs And Funds
10
Business Strategy Execution Updates

31
Business Strategy Execution Updates
11
Artist’s Impression
ESG : Ensuring A Sustainable Business
Launch of CapitaLand Silver Empowerment Fund in July 2018
CapitaLand Le Xa Hope Kindergarten in Hanoi, Vietnam in May 2018
Launched S$2 million CapitaLand Silver
Empowerment Fund In Singapore Through Philanthropic Arm, CapitaLand Hope Foundation
CapitaLand Volunteer Day in July 2018
‘Mickey Go Local’ Exhibition in July 2018 in support of President’s Challenge 2018
Non-executive Independent Director, Mr Stephen Lee,
receives Best Managed Board (Silver) award
Most awarded company at
Singapore Corporate Awards 2018 for the second consecutive year
Left to right: Mr Tony Tan, CMT CEO, Mr Stephen Lee
and Mr Kevin Chee, CCT CEO

32
CapitaLand Presentation May 2013
ION Orchard, SingaporeION Orchard, Singapore
Business
Updates

33
Raffles City Beijing, China
CapitaLand
Singapore, Malaysia
and Indonesia
The Interlace, Singapore

34
Total Assets:
S$28.5 Billion
Singapore, Malaysia & Indonesia Asset PortfolioCapitaLand Singapore, Malaysia and Indonesia
S$28.5 Billion Corresponding To 45% Of Group’s Total Assets
Residential & Commercial
Strata, 3%
Retail, 52%
Commercial,
40%
Serviced
Residence, 5%

35
Singapore Residential Sales
Note:1. Based on options exercised2. 1H 2017 figures include the sale of 45 units in The Nassim (worth ~S$407.2 million)
84
40
103
37
187
77
0
100
200
1H 2017 1H 2018
Re
sid
en
tia
l U
nits
2Q 2018: ~0.4x y-o-y
1H 2018: ~0.4x y-o-y
504
150
289
136
793
286
0
200
400
600
800
1,000
1H 2017 1H 2018
Sa
les
Va
lue
(S$
mill
ion
)
2Q 2018: ~0.5x y-o-y
1H 2018: ~0.4x y-o-y
Singapore - Residential
1Q
2Q
Sold 77 Units1 Worth S$286 Million

36
Launched Projects Substantially Sold1
Note: 1. Figures might not correspond with income recognition2. Sales figures of respective projects are based on options issued3. Sell-by dates for The Interlace and d’Leedon have been extended to 13 September 2018 and 21 October 2018 respectively
Singapore - Residential
~99% Of Units Sold As At 30 June 20182
Project Total
units
Units sold
as of
30 June 20182
% of
launched
units sold
d'Leedon3 1,715 1,710 99.7%
Marine Blue 124 111 89.5%
Sky Habitat 509 501 98.4%
The Interlace3 1,040 1,035 99.5%
The Orchard Residences 175 173 98.9%

37
Jewel Changi AirportSingapore
B2 Food Hall
Overview
B1 Retail Corridor
Oculus
Forest Valley
Foggy Bowl1
Hedge Maze1
Walking Net1
Discovery Slide1
Note: 1. Attractions at Level 5.
• Overall Completion ~85% With Phases Progressively Opened
• On Track For Opening In 2019

38
CapitaLand
China
Raffles City Hangzhou, China

39
Total Assets:
S$23.2 Billion
China Asset PortfolioCapitaLand China
S$23.2 Billion Corresponding To 37% Of Group’s Total Assets
Residential &
Commercial
Strata, 29%
Retail, 46%
Commercial, 18%
Serviced
Residence, 7%

40
China Residential SalesChina – Residential
Note: 1. Units sold includes options issued as at 30 June 2018. 2. Above data is on a 100% basis. Comparative figures include strata units in integrated development. 1Q 2017 figures include the remaining
inventory sold through the divestment of Central Park City Wuxi (108 residential units with a total value RMB192 million) and The Botanica Chengdu (total value RMB105 million).
3. Value includes carpark, commercial and value added tax.
2,149
998
3,159
746
5,308
1,744
0
500
1,000
1,500
2,000
2,500
3,000
3,500
4,000
4,500
5,000
5,500
6,000
1H 2017 1H 2018
Re
sid
en
tia
l U
nits
2Q 2018: ~0.2x y-o-y
1H 2018: ~0.3x y-o-y
3,932
1,676
4,748
3,231
8,680
4,907
0
1,000
2,000
3,000
4,000
5,000
6,000
7,000
8,000
9,000
10,000
1H 2017 1H 2018
Sa
les
Va
lue
(R
MB
mill
ion
)
2Q 2018: ~0.7x y-o-y
1H 2018: ~0.6x y-o-y
1Q2Q
• 97% Of Launched Units Sold As At 30 June 20181
• Launches Deferred Due To Tighter Government Measures

4141
Tianjin
Beijing
ShanghaiHangzhou
Ningbo
Chengdu
Chongqing
Wuhan
Xian
Guangzhou
Shenyang
Kunshan
Focus on 5 City Clusters
2018 Landbank Acquisitions
Integrated Developments
Homes
Raffles City Developments
China - Residential
Strong Residential Presence In Strategic City Clusters In China
Note: Figures are as of 30 June 20181. Excludes approximately 2,100 units from the acquisition of mixed-use site in Chongqing (announced on 27 June 2018) and 1,300 units from
the two sites in Guangzhou (announced on 14 August 2018).2. Excludes area from the two above-mentioned acquisitions.
>27,000(1)
HomesIncludes units
under development in the pipeline
>3.7(2)
Million sqm in GFAIncludes area under development
in the pipeline
Shenzhen
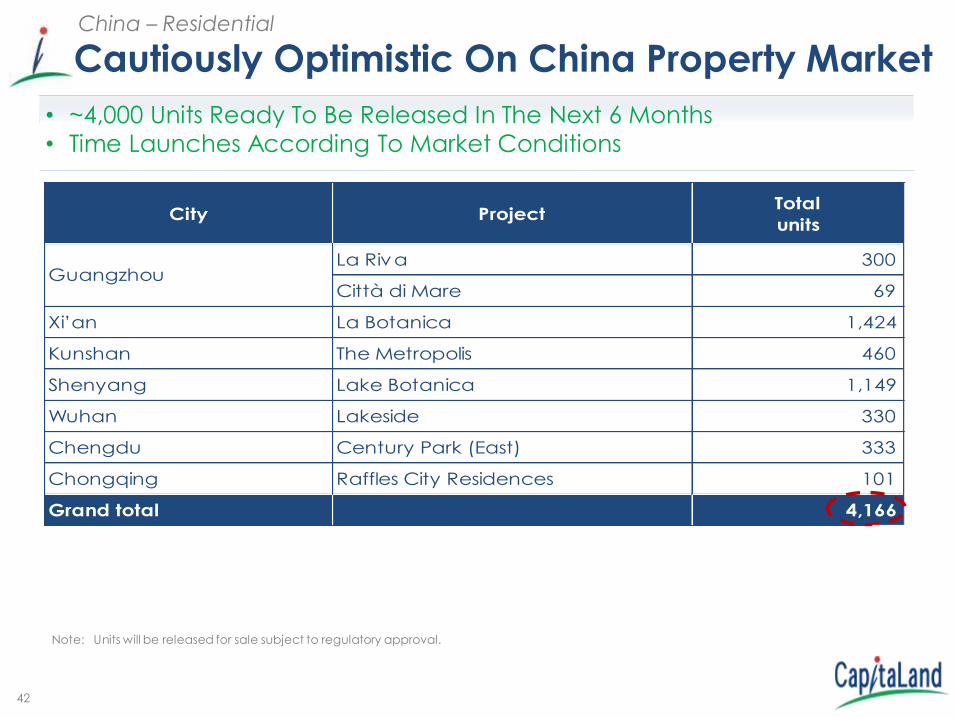
42
Cautiously Optimistic On China Property MarketChina – Residential
Note: Units will be released for sale subject to regulatory approval.
City Project Total
units
La Riva 300
Città di Mare 69
Xi’an La Botanica 1,424
Kunshan The Metropolis 460
Shenyang Lake Botanica 1,149
Wuhan Lakeside 330
Chengdu Century Park (East) 333
Chongqing Raffles City Residences 101
Grand total 4,166
Guangzhou
• ~4,000 Units Ready To Be Released In The Next 6 Months
• Time Launches According To Market Conditions
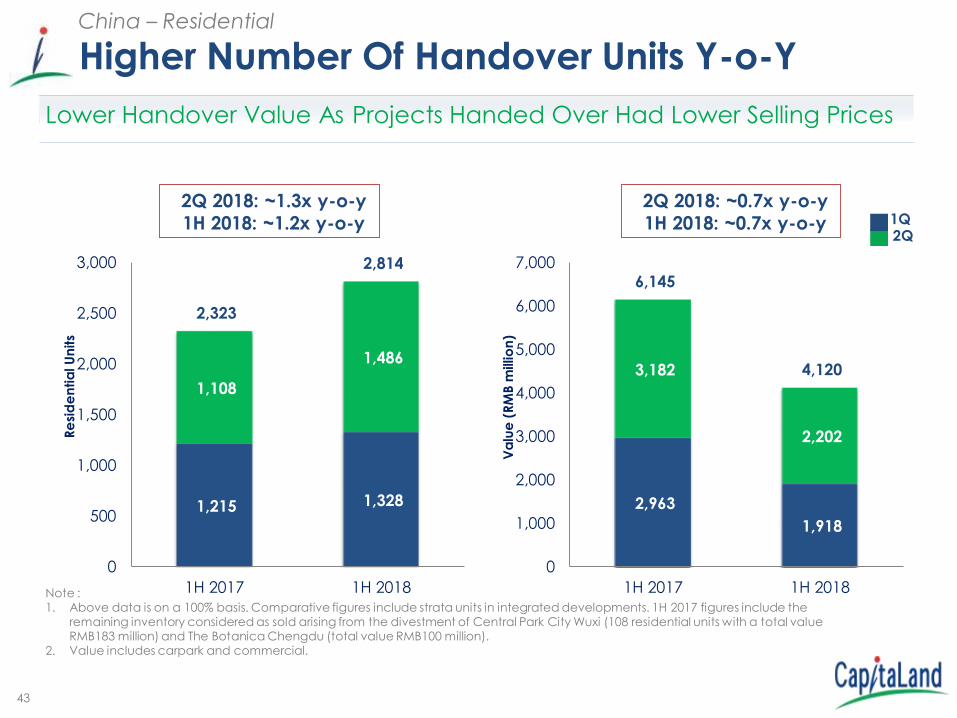
43
Higher Number Of Handover Units Y-o-YChina – Residential
Note :1. Above data is on a 100% basis. Comparative figures include strata units in integrated developments. 1H 2017 figures include the
remaining inventory considered as sold arising from the divestment of Central Park City Wuxi (108 residential units with a total value RMB183 million) and The Botanica Chengdu (total value RMB100 million).
2. Value includes carpark and commercial.
1,215 1,328
1,108
1,486
2,323
2,814
0
500
1,000
1,500
2,000
2,500
3,000
1H 2017 1H 2018
Re
sid
en
tia
l U
nits
2Q 2018: ~1.3x y-o-y
1H 2018: ~1.2x y-o-y
2,963
1,918
3,182
2,202
6,145
4,120
0
1,000
2,000
3,000
4,000
5,000
6,000
7,000
1H 2017 1H 2018
Va
lue
(R
MB
mill
ion
)
2Q 2018: ~0.7x y-o-y
1H 2018: ~0.7x y-o-y 1Q2Q
Lower Handover Value As Projects Handed Over Had Lower Selling Prices

44
On-Time Completion And HandoverChina – Residential
New Horizon,
Shanghai
Note: Sales value includes value added tax.
• Completed 828 units
• 99% sold with
• ASP: RMB13.3k psm
• Sales value: ~RMB1,057.2m
• Handed over 100% of the
units sold
Century Park West,
ChengduCitta Di Mare,
Guangzhou
• Completed 174 units
• 100% sold with
• ASP: RMB14.3k psm
• Sales value: ~RMB260.6m
• Handed over 100% of the
units sold
• Completed 280 units
• 100% sold with
• ASP: RMB18.4k psm
• Sales value: ~RMB487.4m
• Handed over 100% of the
units sold

45
Future Revenue Recognition China – Residential
Note: 1. Units sold include options issued as at 30 June 2018. Above data is on a 100% basis, including strata units in integrated developments2. Value refers to value of residential units sold including value added tax.
Città di Mare, GuangzhouVermont Hills, Beijing La Botanica, Xi’anNew Horizon, Shanghai
• ~8,000 Units Sold1 With A Value Of ~RMB 16.2 Billion2 Expected To Be
Handed Over From 3Q 2018 Onwards
• More Than Half Of The Units Expected To Be Handed Over The Next 6
Months

46 Raffles City Chengdu, China
Raffles City
China Portfolio

47
Raffles City China Portfolio
Robust NPI
Note:1. Relates to Gross Floor Area of leasing components excluding carparks2. Excludes strata/trading components. Comparative NPI adjusted to include government rebates3. NPI yields based on valuations as at 30 June 2018 and on an annualised basis4. Relates mainly to retail and office components, as serviced residence and hotel have yet to commence operations5. Not meaningful as these properties’ main components (retail and office) only commence operations in 2Q 2017
Raffles CityTotal GFA1
(sqm)
CL Effective
stake
(%)
Net Property Income2
(RMB million)
(100% basis)NPI
Y-o-Y
growth (%)
NPI Yield on
Valuation3 (%)
(100% basis)
1H 2018 1H 2017
Shanghai ~140,000 30.7 302 294 2.7
~4 to 5%Beijing ~111,000 55.0 135 133 1.5
Chengdu ~209,000 55.0 89 86 3.5
Ningbo ~82,000 55.0 48 47 2.1
Changning ~260,000 42.8 172 -5
Not
meaningful~3%Hangzhou ~158,000 55.0 66
4-5
Shenzhen ~122,000 30.4 76 -5

48
Raffles City China Portfolio
Note:1. Relates to the year of opening of the first component of the Raffles City project.
Strong Committed OccupancyCommence Operations 1 2016 2017
As at June2018
Raffles City Shanghai
- Retail2003
100% 100% 100%
- Office 95% 97% 95%
Raffles City Beijing
- Retail2009
100% 100% 100%
- Office 95% 99% 100%
Raffles City Chengdu
- Retail
2012
98% 96% 100%
- Office Tower 1 81% 96% 100%
- Office Tower 2 91% 92% 100%
Raffles City Ningbo
- Retail2012
100% 98% 100%
- Office 87% 98% 98%
Raffles City Changning
- Retail
2015
92% 96%
- Office Tower 1 13% 34%
- Office Tower 2 60% 98% 100%
- Office Tower 3 97% 98% 100%
Raffles City Shenzhen
- Retail2016
99% 99%
- Office 20% 93% 100%
Raffles City Hangzhou
- Retail2016
98% 99%
- Office 8% 72% 87%

49
Raffles City Chongqing – Construction On Track
Note: Value is as at 30 June 2018 and includes value added tax.
Raffles City China Portfolio
Overall construction progressing well Second section of conservatory hoisted in June 2018
Raffles City Residences Towers 2 And 6 Achieved ~RMB 3.3 Billion In Sales,
~91% Of Launched Units Sold

CapitaLand
Vietnam
The Vista, Ho Chi Min City, Vietnam

51
Total Assets:
S$1.1 Billion
Vietnam Asset PortfolioCapitaLand Vietnam
S$1.1 Billion Corresponding To 2% Of Group’s Total Assets
Residential &
Commercial
Strata, 51%
Retail, 2%
Commercial, 6%
Serviced
Residence,
41%

52
Vietnam Residential SalesVietnam – Residential
316
95
340
524
656 619
0
100
200
300
400
500
600
700
1H 2017 1H 2018
Re
sid
en
tia
l U
nits
2Q 2018: ~1.5x y-o-y
1H 2018: ~0.9x y-o-y
119
23
83
186
202 209
0
100
200
300
1H 2017 1H 2018
Sa
les
Va
lue
(S$
mill
ion
)
2Q 2018: ~2.2x y-o-y
1H 2018: ~1.0x y-o-y 1Q2Q
Higher Sales Value Of S$209 Million Achieved In 1H 2018

5353
Vietnam - Residential
Strong Residential Presence In Ho Chi Minh City
Note: Figures are as of 30 June 2018
>6,200HomesIncludes units
under development in the pipeline
>1,100Thousand sqm in GFAIncludes area under development
in the pipelineHomes
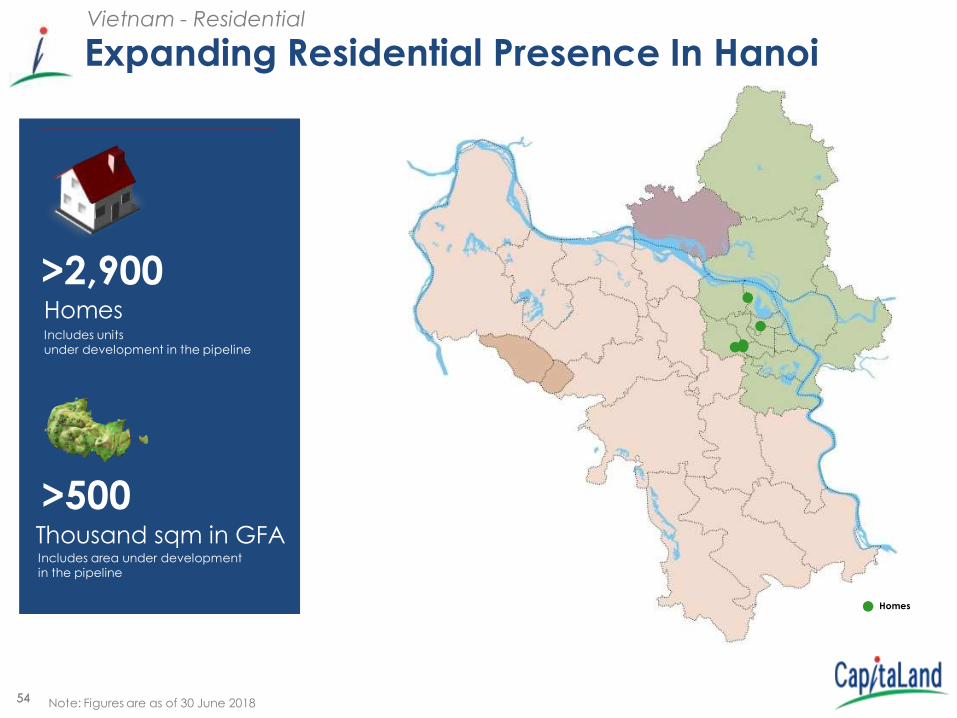
5454
Vietnam - Residential
Expanding Residential Presence In Hanoi
Note: Figures are as of 30 June 2018
>2,900HomesIncludes units
under development in the pipeline
>500Thousand sqm in GFAIncludes area under development
in the pipeline
Homes
55
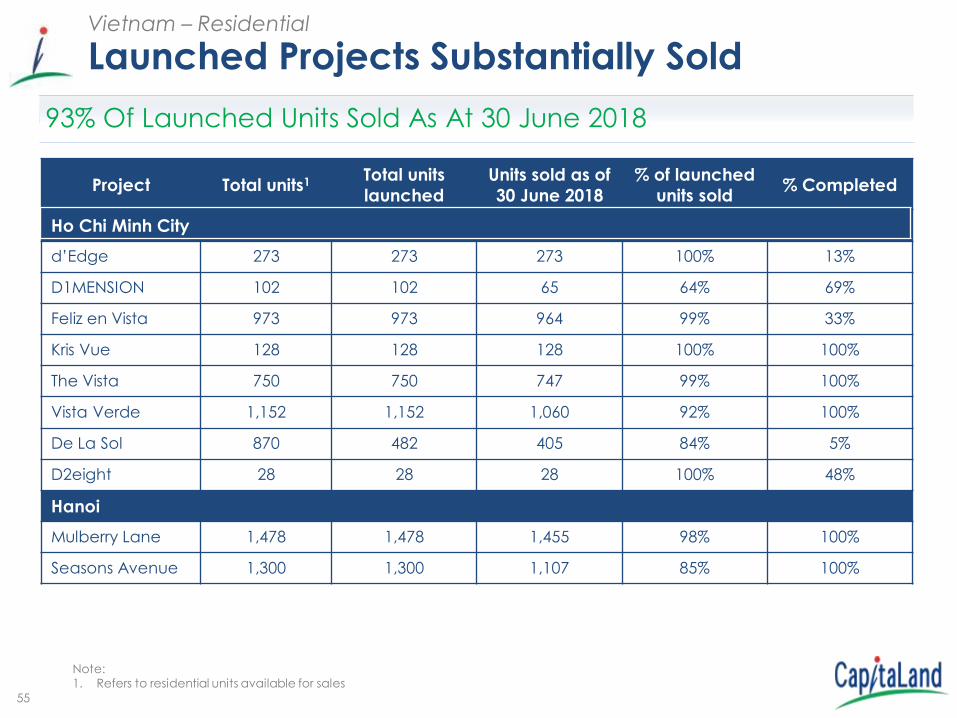
Launched Projects Substantially SoldVietnam – Residential
Note:1. Refers to residential units available for sales
Project Total units1 Total units
launched
Units sold as of
30 June 2018
% of launched
units sold% Completed
Ho Chi Minh City
d’Edge 273 273 273 100% 13%
D1MENSION 102 102 65 64% 69%
Feliz en Vista 973 973 964 99% 33%
Kris Vue 128 128 128 100% 100%
The Vista 750 750 747 99% 100%
Vista Verde 1,152 1,152 1,060 92% 100%
De La Sol 870 482 405 84% 5%
D2eight 28 28 28 100% 48%
Hanoi
Mulberry Lane 1,478 1,478 1,455 98% 100%
Seasons Avenue 1,300 1,300 1,107 85% 100%
93% Of Launched Units Sold As At 30 June 2018
56
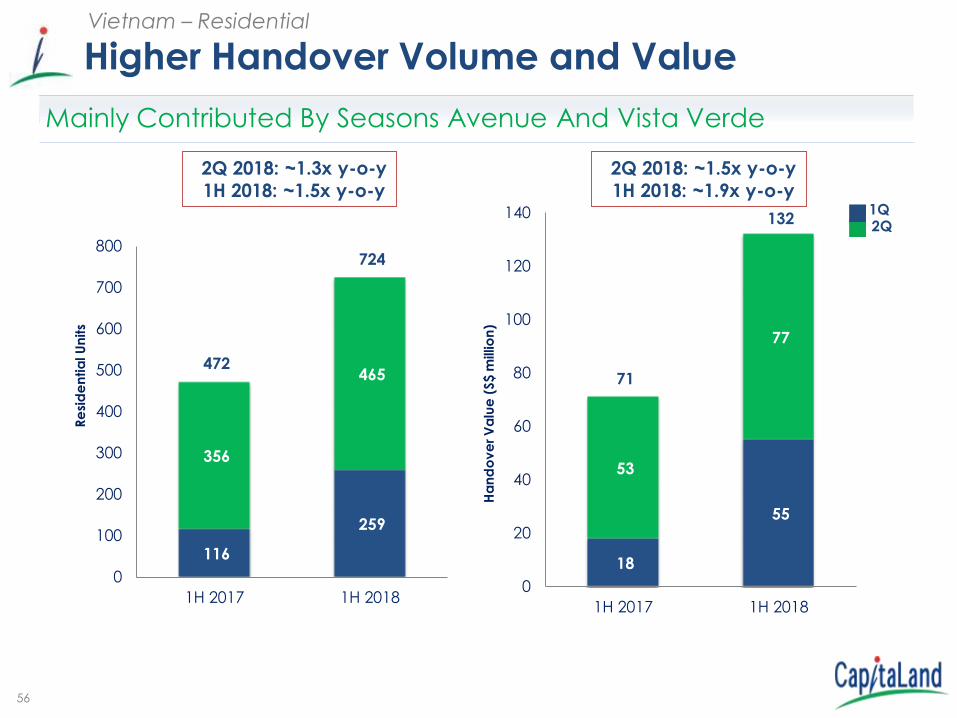
Higher Handover Volume and ValueVietnam – Residential
116
259
356
465 472
724
0
100
200
300
400
500
600
700
800
1H 2017 1H 2018
Re
sid
en
tia
l U
nits
18
55
53
77
71
132
0
20
40
60
80
100
120
140
1H 2017 1H 2018
Ha
nd
ov
er V
alu
e (
S$
mill
ion
)
1Q2Q
2Q 2018: ~1.3x y-o-y
1H 2018: ~1.5x y-o-y
2Q 2018: ~1.5x y-o-y
1H 2018: ~1.9x y-o-y
Mainly Contributed By Seasons Avenue And Vista Verde

57
Future Revenue Recognition Vietnam – Residential
Vista Verde, Ho Chi Minh City Seasons Avenue, HanoiKris Vue, Ho Chi Minh City
• 2,680 Units Sold With A Value Of S$811 Million Expected To Be Handed
Over From 3Q 2018 Onwards
• More Than 30% Of The Units Expected To Be Handed Over In 2018

58
CapitaLand
International
Main Airport Center, Frankfurt

59
Total Assets:
S$7.5 Billion
International Asset PortfolioCapitaLand International
S$7.5 Billion Corresponding To 12% Of Group’s Total Assets
Total Assets:
S$7.5 Billion
Retail, 13%
Commercial, 21%
Serviced Residence, 66%
Europe, 43%
Japan, 32%
USA, 11%
Australia, 7%
Others, 7%
By Asset Class By Geographies

6060
CapitaLand International
Key Strategy And Focus
• Diversify portfolio and achieve higher risk-adjusted returnsby deploying capital to developed markets
• Focus on value-add, growth sectors, managementplatforms and portfolio opportunities
• Actively exploring opportunities across various assetclasses in key gateway cities and growth locations/sectors
Citadines on Bourke Melbourne La Clef Tour Eiffel Paris
Build Up Scale To Grow Assets Under Management And Seed Operator
Platform
Main Airport Center, Frankfurt

61ION Orchard, SingaporeION Orchard, Singapore
Retail
Platform

62
Singapore Malaysia & Cambodia China Japan
Retail
23%
10%
61%
6%
38%
4%
57%
1%
35%
7%
56%
2%
Retail Platform Overview1
Note:1. Operational data includes properties under management contract. Total sales and traffic info are for 1H 20182. Includes properties owned/managed by retail platform as at 30 Jun 2018. Decrease from 102 (as at 31 Mar 2018) to 83 with the
divestment of 20 assets in China and Sembawang Shopping Centre in Singapore, offset by the addition of two managementcontracts in China
49%
8%
43%
832 Properties
across
five countries
Total property
value of
S$47.1 Billion
Total sales of
S$5.4 billion1
Total traffic
of
576 million1

63
Healthy Tenant Sales Growth Across Core MarketsRetail
Note:1. Portfolio includes properties that are operational as at 30 June 2018. It excludes the 20 properties divested in China2. Same-mall compares the performance of the same set of property components opened/acquired prior to 1 January 20173. NPI Yield on valuation is based on valuations as at 30 June 20184. Committed occupancy rates as at 30 June 2018 for retail components only5. China: Excludes two master-leased malls. Tenants’ sales from supermarkets and department stores are excluded6. Japan: Excludes two master-leased malls
Portfolio1
(1H 2018 vs 1H 2017) Singapore China
Tenants’ sales growth +2.0% +20.2%
Same-mall1,2
1H 2018 1H 2018 vs 1H 2017
NPI yield on
valuation3
Committed
occupancy rate4
Shopper traffic
growth
Tenants’ sales
growth (per sq ft/m)
Singapore 5.7% 98.1% +0.1% +0.4%
China5 5.0% 97.6% +0.3% +5.4%
Malaysia 6.0% 92.6% -2.2% +2.3%
Japan6 5.3% 96.8% -2.1% -0.5%

64
Resilient Same-Mall NPI Growth1 In Core MarketsRetail
Raffles City Singapore
Suzhou Center Mall
Currency Change
(mil) 2018 2017 (%)
Singapore SGD 459 451 +1.7%
China RMB 1,928 1,798 +7.2%
Malaysia2 MYR 148 155 -5.0%
Japan3 JPY 1,250 1,319 -5.3%
Country 1H
Note:• The above figures are on 100% basis, with the NPI of each property taken in its entirety regardless of CapitaLand’s effective interest. This analysis
compares the performance of the same set of property components opened/acquired prior to 1 January 2017, excluding the 20 divestedproperties as announced in 1Q 2018
1. An integrated development is regarded as a single asset. Above tabulation comprises NPI from all the components present in an integrateddevelopment
2. Excluding Sungei Wang, which is undergoing asset enhancement works, Malaysia’s same-mall NPI growth would have been -2.9%3. Excluding Olinas, which is undergoing asset enhancement works, Japan’s same-mall NPI growth would have been +4.6%

65
China Retail Portfolio Is Focused On Tier 1 andTier 2 Cities
Retail
Note:• The above figures are on 100% basis, with the financials of each property taken in its entirety regardless of CapitaLand’s effective interest. This
analysis compares the performance of the same set of property components that are opened/acquired prior to 1 January 2017, excludingthe 20 divested properties as announced in 1Q 2018
• Data for Tenants’ Sales excludes two master-leased malls. Tenants’ sales from supermarkets and department stores are excluded
1. Tier 1: Beijing, Shanghai, Guangzhou and Shenzhen2. Tier 2: Provincial capital and city enjoying provincial-level status
Same-Mall NPI Yield Improvement Remains Healthy
2018 2017
Tier 11 12 28.4 8.5 8.1 +4.2% 6.6%
Tier 22 19 22.7 6.3 5.5 +13.5% 5.3%
Tier 3 & others 1 0.8 6.5 6.2 +5.8% 12.3%
City tier NPI yield
on cost (%)
(100% basis)
Tenants’
sales (psm)
growth
Number of
operating
malls
Yield
improvement
Cost
(100% basis)
(RMB bil.)
1H 2018 vs. 1H 2017
1H 2018 NPI yield on cost Gross revenue on cost
China portfolio 7.5% 11.1%

66
Pipeline Of Properties Opening Retail
2018 2019 & beyond
Singapore 17 - 2 19
China1 41 2 8 51
Malaysia 7 - - 7
Japan 5 - - 5
Cambodia - - 1 1
Total 70 2 11 83
Number of properties
Target2 to be opened in Opened Total
Country
Note: 1. Excludes 20 divested properties as announced in 1Q 2018 and includes two new management contracts in China2. The opening targets relate to the retail components of integrated developments and properties managed by CL Retail
67
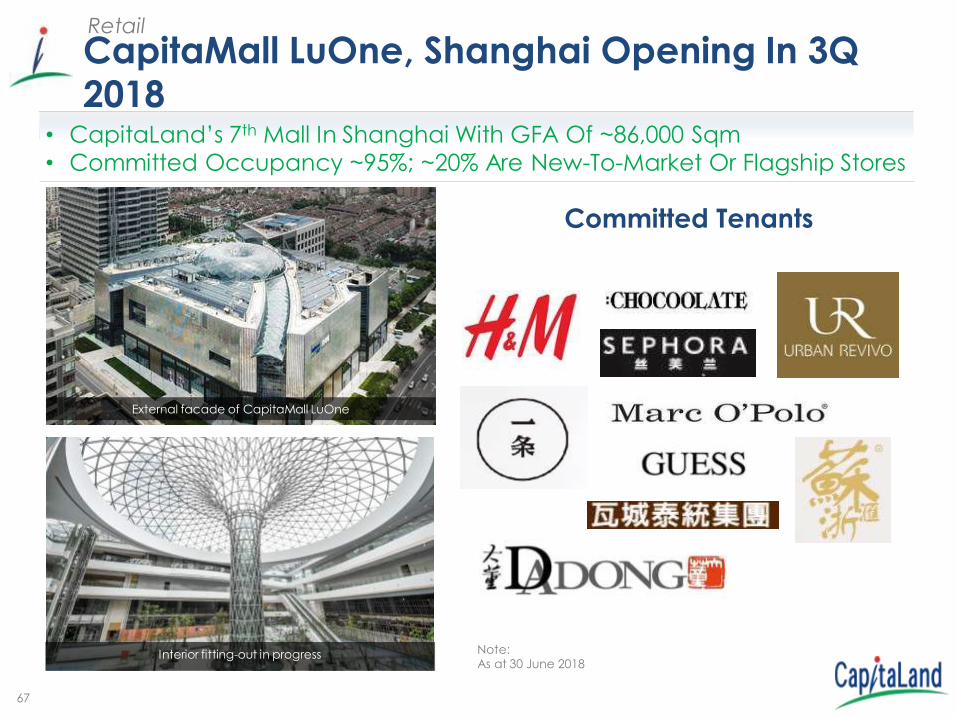
CapitaMall LuOne, Shanghai Opening In 3Q 2018
Retail
Note: As at 30 June 2018
Committed Tenants
Interior fitting-out in progress
External facade of CapitaMall LuOne
• CapitaLand’s 7th Mall In Shanghai With GFA Of ~86,000 Sqm
• Committed Occupancy ~95%; ~20% Are New-To-Market Or Flagship Stores
68CapitaGreen, Singapore
Commercial
Platform

69
Singapore Southeast
Asia
China Japan Germany
Note:1. Southeast Asia excludes Singapore
2. Information as at 31 December 2017
Commercial
Total 41 properties in portfolio
1%
Total property value
of S$35.9 billion
Total GFA of 1.8 Mil. sqm2
Total no. of tenants –
1,3602
53%
3%
27%10%
3%
54%
1%
37%60%
3%
26%
2%
66%
28%
3%
2%
Commercial Platform Overview
7%
5%
9%
1%

70
Resilient Office PortfolioCommercial - Singapore
CCT Singapore portfolio committed occupancy 1
97.6% Singapore core CBD occupancy1 94.1%
Notes:1. As at 30 June 20182. Average gross rent per month for office portfolio (S$ psf) = Actual gross rent for occupied office + Committed gross rent for vacant office
Committed area of office
7.96 8.03 8.13 8.22 8.238.42
8.618.78 8.88 8.89 8.90 8.96 8.98
9.22 9.20 9.18 9.18 9.23
9.74 9.70 9.65
Average gross rent per month for office portfolio (S$ psf)
Achieved Above Market Committed Occupancy
Average Office Rent2 Of CCT’s Singapore Portfolio Eased By 0.5% QoQ
71
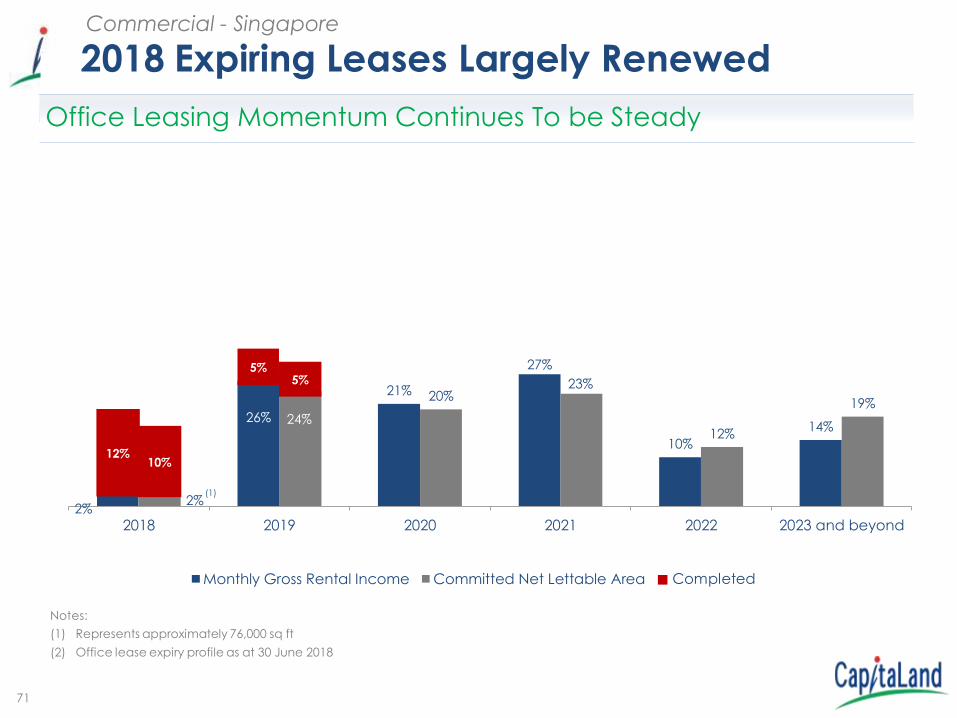
2%
26%
21%
27%
10%
14%
2%
24%
20%23%
12%
19%
2018 2019 2020 2021 2022 2023 and beyond
Monthly Gross Rental Income Committed Net Lettable Area Completed
12%10%
5%5%
2018 Expiring Leases Largely Renewed
Notes:
(1) Represents approximately 76,000 sq ft
(2) Office lease expiry profile as at 30 June 2018
(1)
Commercial - Singapore
Office Leasing Momentum Continues To be Steady

72
Lodging
Platform
Ascott Heng Shan Shanghai, China

73
22%
7%
3%
9%
5%
7%
8%
39%
28%
7%
12%
45%
27%
54%
9%
6%
Singapore SE Asia & Australia
(Ex-S'pore)
China North Asia
(Ex-China)
Europe Others
9%
Lodging
Total 517
properties1
in portfolio
Total property
value2 of
S$26.2 billion
26%
Serviced Residence Platform Overview
Note: Includes properties owned/managed by service residence platform1. Figures as at 27 July 2018
2. Figures as at 30 June 2018 and includes estimates of 3rd party owned assets in various stages of development.
Total no. of
units1 –
75,391
3%

7474
190
9399 102
144
125112
213
87
107102
163
114 117
Singapore SE Asia &
Australia (ex
S'pore)
China North Asia
(ex China)
Europe Gulf Region
& India
Total
1H 2017 1H 2018
Notes: 1. Include all serviced residences owned, leased and managed. Foreign currencies are converted to SGD at average rates
for the period.2. RevPAU – Revenue per available unit
Resilient Operational PerformanceLodging
S$
-9%
+13%
-6%
+12%
+8%
+4%
Overall 1H 2018 RevPAU Increased 4% YoY On Same Store Basis
-3% based
on local
currency
-3% based
on local
currency
75
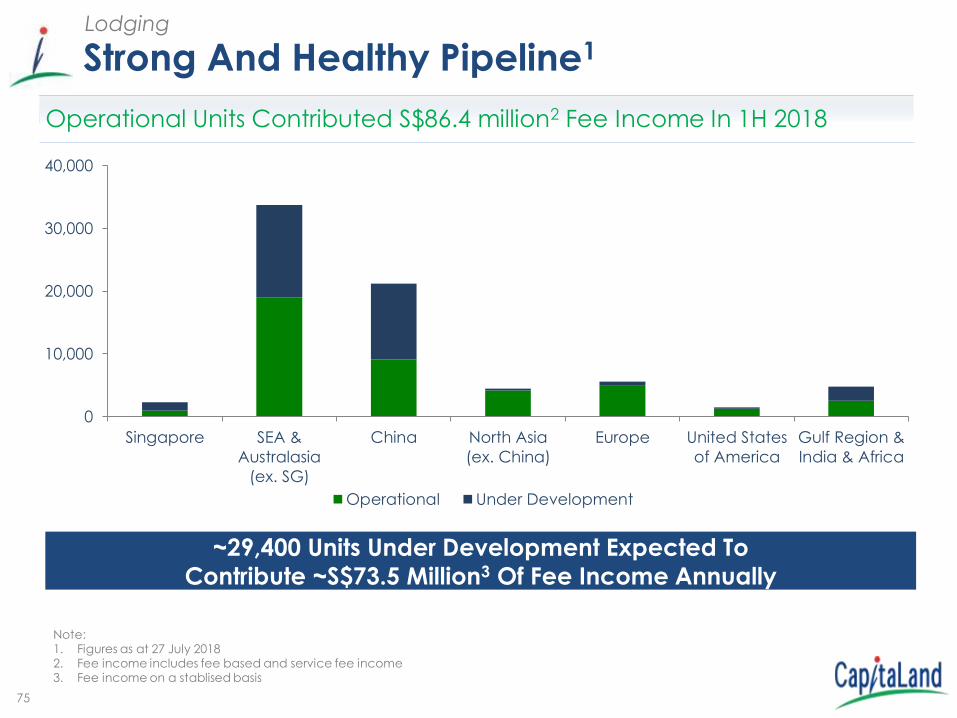
Strong And Healthy Pipeline1Lodging
~29,400 Units Under Development Expected To
Contribute ~S$73.5 Million3 Of Fee Income Annually
Note: 1. Figures as at 27 July 20182. Fee income includes fee based and service fee income3. Fee income on a stablised basis
0
10,000
20,000
30,000
40,000
Singapore SEA &
Australasia
(ex. SG)
China North Asia
(ex. China)
Europe United States
of America
Gulf Region &
India & Africa
Operational Under Development
Operational Units Contributed S$86.4 million2 Fee Income In 1H 2018

76Raffles City Shanghai, China
Conclusion

77
Solid Progress In Strategy Execution In 1H 2018Conclusion
• Resilient Operating PATMI contributed by newly acquired/opened InvestmentProperties
• Achieved S$3 billion annual divestment target within two financial quarters
• Effective redeployment of S$1.8 billion into new investments
• Strengthened Trading Properties pipeline with acquisition of prime mixed-usesite in Chongqing, China (~2,100 residential units) and Pearl Bank Apartmentsin Singapore (~800 residential units)
• Increased Developed Markets footprints with another Grade A officeinvestment in Frankfurt, Germany
• Continued progress in scaling up operating platforms – 3 new retailmanagement contracts, > 75,000 serviced residences keys
On Track To Deliver Sustainable Returns Above Cost Of
Equity To Shareholders

Thank You

79
Raffles City Beijing, China
Supplementary Information

80
Residential / Trading Sales & Completion StatusChina – Residential
Projects Units
launched
CL effective
stake
% of
launched
units sold1
Average
Selling
Price2
Completed
units in
% As at 30 Jun
2018
RMB/Sqm 2Q 2018 3Q to 4Q 2018 2019
SHANGHAI
The Paragon 178 4 99% 100% 156,610 0 0 0
New Horizon Ph 2 765 95% 100% 22,027 280 485 0
KUNSHAN
The Metropolis Ph 2A – Blk 15 and 18 709 4 99% 0 0 0
The Metropolis Ph 2B – Blk 1 262 100% 0 262 0
The Metropolis Ph 3 – Blk 2 to 5, 8 1,111 3 99% 0 0 1,111
The Metropolis – Total 2,082 100% 99% 23,432 0 262 1,111
HANGZHOU
Sky Habitat (RCH) 102 4 55% 99% 34,654 0 0 0
Skyview (RCH) 45 55% 100% 38,000 0 45 0
NINGBO
The Summit Executive Apartments (RCN) 180 4 55% 33% 21,856 0 0 0
Summit Era 1,085 4 99% 100% 19,178 0 0 0
BEIJING
Vermont Hills Ph 1 86 4 97% 0 0 0
Vermont Hills Ph 2 88 92% 0 88 0
Vermont Hills Ph 3 87 48% 0 0 87
Vermont Hills – Total 261 100% 79% 35,527 0 88 87
WUHAN
Lakeside - Phase 2 488 100% 99% 6,507 0 0 488
CapitaMall Westgate, Wuhan (SOHO) 399 100% 98% 17,034 0 399 0
GUANGZHOU
Citta di Mare – Blk 3 to 5 & 7 to 8, Townhouse & Villa 996 3 45% 91% 29,588 174 694 128
SHENZHEN
ONE iPARK 243 4 73% 99% 89,252 0 0 0
CHENGDU
Chengdu Century Park - Blk 1, 3, 4 & 14 (West site) 588 4 99% 0 0 0
Chengdu Century Park - Blk 9 to 13 (West site) 828 99% 828 0 0
Chengdu Century Park (West site) – Total 1,416 60% 99% 18,007 828 0 0
Chengdu Century Park (East site) - Blk 11 & 13 221 60% 98% 44,602 0 221 0
Skyline (RCC) 88 4 55% 3% 26,533 0 0 0
Parc Botanica - Phase 2 396 56% 100% 6,039 0 0 396
CapitaMall Tianfu, Chengdu 280 4 50% 100% 30,561 0 0 0
CHONGQING
Raffles City Residences (RCCQ) - T2 & T6 500 63% 91% 35,696 0 0 500
Sub-total 9,725 96% 1,282 2,194 2,710
Expected Completion for
launched units

81
Residential / Trading Sales & Completion Status (Cont’d)
China – Residential
Note:1. % sold: Units sold (Options issued as of 30 June 2018) against units launched. 2. Average selling price (RMB) per sqm is derived using the area sold and sales value achieved (including options issued) in the latest transacted
quarter.3. Launches from existing projects in 2Q 2018, namely The Metropolis: 304 units, Lake Botanica (Shenyang): 118 units and Citta Di Mare: 49 units.4. Projects/Phases fully completed prior to 2Q 2018.
Projects Units
launched
CL
effective
stake
% of
launched
units sold1
Average
Selling
Price2
Completed
units in
% As at 30 Jun
2018
RMB/Sqm 2Q 2018 3Q to 4Q 2018 2019
SHENYANG
Lake Botanica - Phase 4 (Plot 4) 323 3 60% 61% 6,063 0 323 0
XIAN
La Botanica - Phase 2A (2R8) 432 4 99% 0 0 0
La Botanica - Phase 5 (2R6) 612 4 99% 0 0 0
La Botanica - Phase 6 (2R2) 2,692 4 100% 0 0 0
La Botanica - Phase 7 (2R4) 1,619 4 99% 0 0 0
La Botanica - Phase 8 (3R2) 1,703 100% 0 1,703 0
La Botanica - Phase 9 (2R5) 1,386 100% 0 1,386 0
La Botanica - Total 8,444 38% 100% 11,874 0 3,089 0
Sub-total 8,767 99% 0 3,412 0
CL China 18,492 97% 1,282 5,606 2,710
Expected Completion for
launched units

8282
199
91103 106
161
123 117
222
83
110 109
184
121 122
Singapore SE Asia &
Australia (ex
S'pore)
China North Asia (ex
China)
Europe Gulf Region &
India
Total
2Q 2017 2Q 2018
Notes: 1. Include all serviced residences owned, leased and managed. Foreign currencies are converted to SGD at average rates for the period.2. RevPAU – Revenue per available unit
Resilient Operational PerformanceLodging
S$
+12%
+4%
+7%-2%
+3%
+14%
-9%
Overall 2Q 2018 RevPAU Increased 4% YoY On Same Store Basis
-5% based
on local
currency
+4% based
on local
currency
83
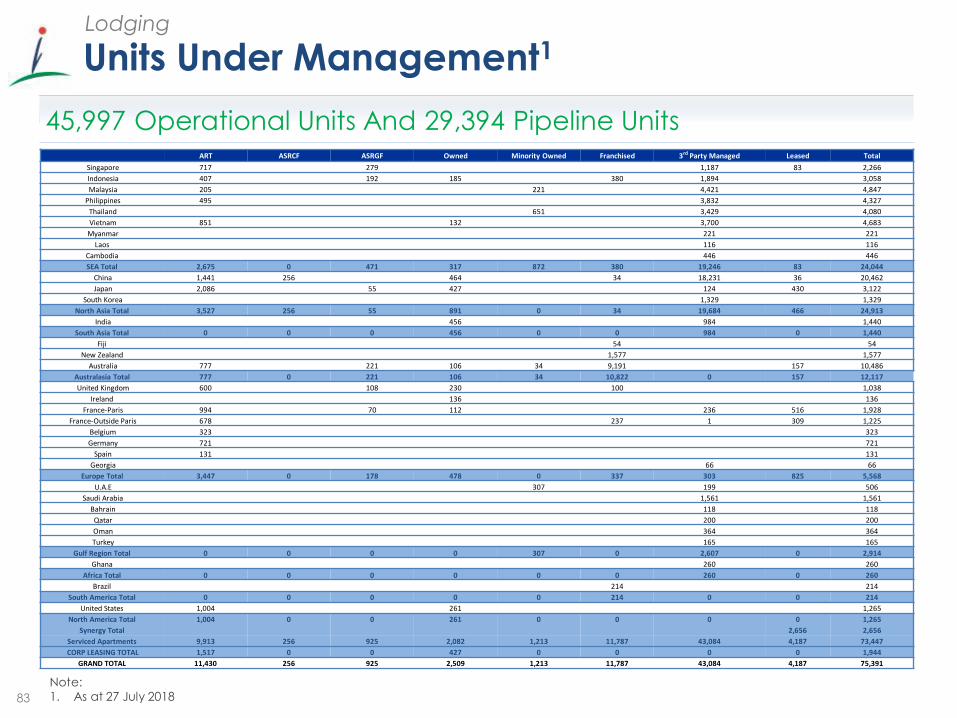
Units Under Management1Lodging
Note: 1. As at 27 July 2018
45,997 Operational Units And 29,394 Pipeline UnitsART ASRCF ASRGF Owned Minority Owned Franchised 3rd Party Managed Leased Total
Singapore 717 279 1,187 83 2,266
Indonesia 407 192 185 380 1,894 3,058
Malaysia 205 221 4,421 4,847
Philippines 495 3,832 4,327
Thailand 651 3,429 4,080
Vietnam 851 132 3,700 4,683
Myanmar 221 221
Laos 116 116
Cambodia 446 446
SEA Total 2,675 0 471 317 872 380 19,246 83 24,044
China 1,441 256 464 34 18,231 36 20,462
Japan 2,086 55 427 124 430 3,122
South Korea 1,329 1,329
North Asia Total 3,527 256 55 891 0 34 19,684 466 24,913
India 456 984 1,440
South Asia Total 0 0 0 456 0 0 984 0 1,440
Fiji 54 54
New Zealand 1,577 1,577
Australia 777 221 106 34 9,191 157 10,486
Australasia Total 777 0 221 106 34 10,822 0 157 12,117
United Kingdom 600 108 230 100 1,038
Ireland 136 136
France-Paris 994 70 112 236 516 1,928
France-Outside Paris 678 237 1 309 1,225
Belgium 323 323
Germany 721 721
Spain 131 131
Georgia 66 66
Europe Total 3,447 0 178 478 0 337 303 825 5,568
U.A.E 307 199 506
Saudi Arabia 1,561 1,561
Bahrain 118 118
Qatar 200 200
Oman 364 364
Turkey 165 165
Gulf Region Total 0 0 0 0 307 0 2,607 0 2,914
Ghana 260 260
Africa Total 0 0 0 0 0 0 260 0 260
Brazil 214 214
South America Total 0 0 0 0 0 214 0 0 214
United States 1,004 261 1,265
North America Total 1,004 0 0 261 0 0 0 0 1,265
Synergy Total 2,656 2,656
Serviced Apartments 9,913 256 925 2,082 1,213 11,787 43,084 4,187 73,447
CORP LEASING TOTAL 1,517 0 0 427 0 0 0 0 1,944
GRAND TOTAL 11,430 256 925 2,509 1,213 11,787 43,084 4,187 75,391

84
3.7
21.0
5.6
22.8
0.1
0.5
China Singapore Others
AUM by geography (S$ billion)
REITs PE Funds
3
Diversified Portfolio Of Funds
Funds Business
Fund Business
Note:1. Fund size as at respective fund closing date2. Formerly known as Raffles City China Fund3. Others include Malaysia, Vietnam, Other Asia, Europe, United States of America
No. Fund name
1 CapitaLand Mall China Income Fund US$ 900
2 CapitaLand Mall China Income Fund I I US$ 425
3 CapitaLand Mall China Income Fund I I I S$ 900
4 CapitaLand Mall China Development Fund I I I US$ 1,000
5 Ascott Serviced Residence (China) Fund US$ 500
6 Ascott Serviced Residence (Global) Fund US$ 600
7 Raffles City China Income Ventures Limited2 US$ 1,180
8 Raffles City Changning JV S$ 1,026
9 CTM Property Trust S$ 1,120
10 CapitaLand Township Development Fund I US$ 250
11 CapitaLand Township Development Fund I I US$ 200
12 Vietnam Joint Venture Fund US$ 200
13 CapitaLand Mall India Development Fund S$ 880
14 Raffles City China Investment Partners I I I US$ 1,500
15 CapitaLand Vietnam Commercial Fund I US$ 300
16 CapitaLand Vietnam Commercial Value-Added Fund US$ 130
Fund size
(million)1

85
1.9
2.7
3.94.1
YTD June 2017 YTD June 2018
Statutory revenue Revenue under managementS$’ billion
Financials
Revenue Under Management

86
Group Managed Real Estate Assets1Financials
Note:1. Group Managed Real Estate Assets is the value of all real estate managed by CapitaLand Group entities stated at 100% of the
property carrying value2. Others include 100% value of properties under management contracts, franchise and corporate leasing
As at 30 June 2018
(S$ billion)
On balance sheet & JVs 19.4
Funds 22.7
REITs 31.0
Others2 20.0
Total 93.1
Group managed real estate assets

87
Financial Performance For 2Q 2018Financials
Note:1. 2Q 2017 results restated to take into account the retrospective adjustments relating to SFRS(I)15 Revenue from Contracts with Customers2. CapitaLand consolidated CMT, CRCT and RCST into the Group’s results with effect from August 2017. The consolidation increased the
Group’s revenue and EBIT by approximately S$259.4 million and S$280.5 million for 2Q respectively.3. Lower 2Q 2018 operating PATMI was due to lower contributions from residential projects in Singapore and China, partially mitigated by
higher contribution from newly acquired/opened investment properties.
S$' million 2Q 2017
(Restated)1
2Q 20182 Change
Revenue 992.4 1,342.4 35%
EBIT 989.4 1,351.8 37%
PATMI 580.1 605.5 4%
Operating PATMI 207.6 196.0 -6%
Portfolio Gains 97.6 49.3 -49%
Revaluation Gains/ Impairments 274.9 360.2 31%
(3)

88
EBIT By SBU – 2Q 2018Financials
Singapore And China Contribute 90% Of Total EBIT
S$' million Operating
EBIT
Portfolio
gains
Revaluation
gain/
impairments
Total
CL Singapore, Malaysia and Indonesia 301.0 121.1 300.1 722.2
CL China 224.2 12.3 290.1 526.6
CL Vietnam 12.8 - 11.8 24.6
CL International 66.3 0.4 18.1 84.8
Corporate and others (6.4) - - (6.4)
Total 597.9 133.8 620.1 1,351.8

89
456.9 443.0
5.6 87.3
(3.4)
722.2
526.6
24.6 84.8
(6.3)
CapitaLand Singapore,
Malaysia & Indonesia
CapitaLand China CapitaLand Vietnam CapitaLand
International
Corporate & Others
S$’million
-3%
Consolidation of CMT & RCST, portfolio gain from divestment of SSC and higher FV gain from revaluation of Investment Properties (“IP”)
Contributions from newly opened & acquired malls, higher revaluation gains of IP & consolidation of CRCT, partially offset by lower portfolio gains
Contributions from joint venture projects and higher revaluations gains from IP
Absence of gains from divestments of properties in Japan in 1H 2017, partially mitigated by higher contributions from newly acquired properties in Germany & Japan and higher revaluations gains from IP in Europe
Financials
EBIT By SBUs – 2Q 2018
+19%
+339%86%
+58% Mainly timing difference in corporate costs recovery
2Q 2018
2Q 2017 (Restated)
(1)
Note:1. Includes intercompany eliminations
(6.4)

90
EBIT By SBU – 1H 2018Financials
Singapore And China Contribute 88% Of Total EBIT
S$' million Operating
EBIT
Portfolio
gains
Revaluation
gain/
impairments
Total
CL Singapore, Malaysia and Indonesia 622.9 121.1 317.1 1,061.1
CL China 453.4 20.5 336.0 809.9
CL Vietnam 27.8 31.4 11.8 71.0
CL International 110.4 0.6 18.2 129.2
Corporate and others 0.4 - - 0.4
Total 1,214.9 173.6 683.1 2,071.6
1
Note:1. Includes intercompany eliminations

91
EBIT By Asset Class – 1H 2018Financials
Investment Properties Contribute 89% Of Total EBIT
S$' million Operating
EBIT
Portfolio
gains
Revaluation
gain/
impairments
Total
Residential & commercial strata 213.9 8.0 13.8 235.7
Retail 638.8 121.0 281.7 1,041.5
Commercial 266.4 31.4 365.5 663.3
Serviced residences 106.6 13.2 22.1 141.9
Corporate and others (10.8) - - (10.8)
Total 1,214.9 173.6 683.1 2,071.6
1
Note:1. Includes intercompany eliminations and expenses at SBU corporates

92
558.0
342.3
6.7 104.6
(1.9)
622.9
453.4
27.8 110.4 0.4
CapitaLand Singapore,
Malaysia & Indonesia
CapitaLand China CapitaLand Vietnam CapitaLand International Corporate & Others
Consolidation of CMT and RCST, offset by absence of gain from the divestment of The Nassim in 1H 2017
Higher contributions from consolidation of CRCT and newly opened & acquired malls
Contributions from joint venture projects and fee income
Higher contributions from newly acquired properties in Germany and Japan
Financials
Operating EBIT By SBU – 1H 2018
+32%
+315%+6%
NM
1H 2018
1H 2017 (Restated)
Note:1. Includes intercompany eliminations
(1)
S$’million
+12% Higher interest income offset by timing difference in corporate costs recovery

93
Group’s Valuation Gain For 1H 2018 – PATMI Impact
Financials
S$ mil Key highlights
CL SMI
- Commercial 60.5 The gains are mainly driven by lower capitalisation rates as well as realised fair value gains from divestment of Twenty Anson.
- Retail 45.5 Revaluation gains mainly contributed by properties held through CMT , ION Orchard and Westgate mall mainly due to compression of capitalisation rates.
- Serviced Residences 0.6
106.6
CL China
- Commercial 9.1 Gain is largely from Innov Centre due to better operating performance.
- Retail 63.0 Mainly due to improvements in NPI largely from Beijing malls such as Xizhimen, Taiyanggong and Jinniu in Chengdu as well as FV uplift from the proposed divestments of china malls.
- Serviced Residences (0.6)
- Intergrated Development 214.2 Revaluation gains are mainly from Raffles City portfolio, Minhangand Hongkou due to compression of capitalisation and discount rates as well as improvements in NPI.
285.7

94
Group’s Valuation Gain For 1H 2018 – PATMI Impact (cont’d)
Financials
S$ mil Key highlights
CL Vietnam 3.5 Mainly came from serviced residences properties.
CL International
- Commercial 5.3
- Retail 0.7
- Serviced Residences 2.1
8.1
Total Revaluation Gain 403.9
Increase mainly from an office property in Germany.
Increase mainly from UK properties due to better performance.

9595
Sustainability Accolades (CapitaLand Limited)
A constituent of FTSE4Good Index Series
*The inclusion of CapitaLand Limited in any MSCI index and the use of MSCI logos, trademarks, service marks or index names herein, do not constitute a sponsorship, endorsement or promotion of CapitaLand Limited by MSCI or any of its affiliates. The MSCI Indexes are the exclusive property of MSCI. MSCI and the MSCI index names and logos are trademarks or service marks of MSCI or its affiliates.
A constituent of MSCI ESG Leaders Index and MSCI SRI Index 2017
A constituent of • Euronext Vigeo Index: World 120
• STOXX® Global ESG Leaders Indices
• SGX Sustainability Leaders Indices
Top 5% ESG company
in real estate industry
GRESB 5 Star, 2018Dow Jones Sustainability
World and Asia Pacific Indexes 2018
Highest-ranked real
estate management and development company, 2018
Sustainability

9696
Public Disclosure and External Assurance
1st Global Sustainability Report for FY2009, referencing Global Reporting Initiative (GRI) Framework
Entire report is externally assured since FY2010. Since FY2013, the entire report is externally assured to AA10000 Assurance Standard
Current report references GRI Standards, UN Sustainable Development Goals (SDG), International Integrated Reporting Council (IIRC) Framework, ISO 26000 and the Taskforce on Climate related Financial Disclosures (TCFD)
Signatory to the United Nations Global Compact (UNGC) and participates in the Carbon Disclosure Project (CDP)
Sustainability
97
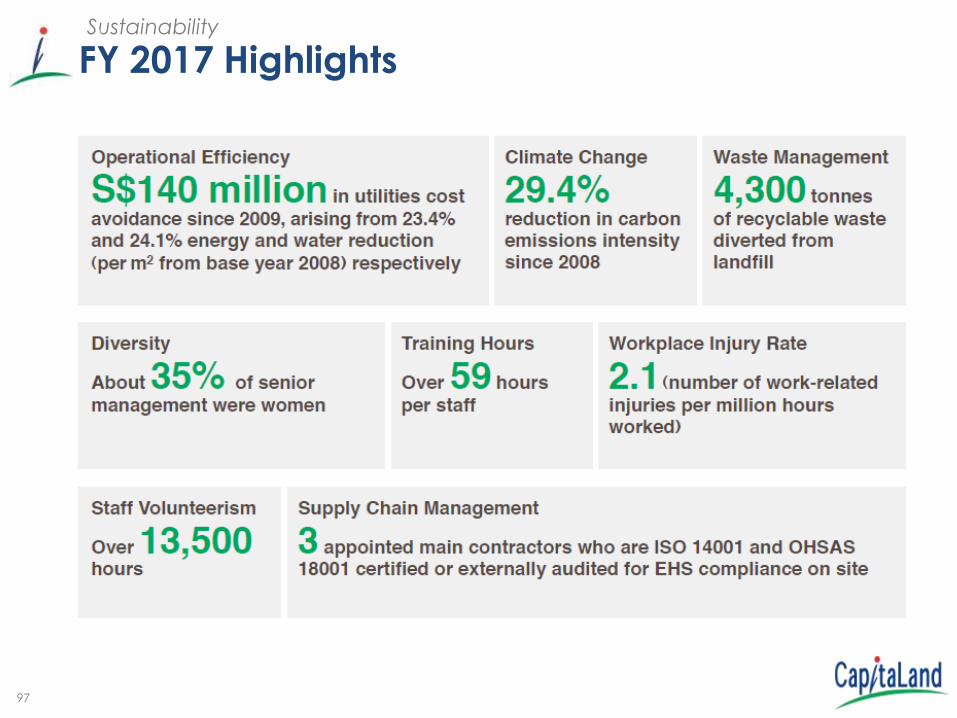
Sustainability
FY 2017 Highlights