capitaland mall trust -...
TRANSCRIPT

CapitaLand Mall Trust Full Year 2017 Financial Results *January 2018*
24 January 2018
CAPITALAND MALL TRUST Singapore’s First & Largest REIT
Full Year 2017 Financial Results
Annexes

CapitaLand Mall Trust Full Year 2017 Financial Results *January 2018*
Gross Revenue by Property
(1) Includes CMT’s 40.0% interest in Raffles City Singapore, CMT’s 30.0% interest in Westgate and excludes Funanwhich was closed in July 2016 for redevelopment.
(2) Includes Sembawang Shopping Centre and JCube.
2
CMT PORTFOLIO(1)
% of Total Gross Revenue
For FY 2017
Tampines Mall 10.0
Junction 8 7.4
IMM Building 10.4
Plaza Singapura 11.3
Bugis Junction 10.7
Lot One Shoppers' Mall 5.6
Bukit Panjang Plaza 3.6
The Atrium@Orchard 6.2
Clarke Quay 4.8
Bugis+ 4.1
Bedok Mall 6.8
Other assets(2) 4.9
Raffles City Singapore 11.6
Westgate 2.6
Total 100.0

CapitaLand Mall Trust Full Year 2017 Financial Results *January 2018*
Well-Diversified Trade MixCMT PORTFOLIO(1)
(1) Includes CMT’s 40.0% interest in Raffles City Singapore (excluding hotel lease), CMT’s 30.0% interest in Westgate and excludes Funan
which was closed in July 2016 for redevelopment.
(2) Excludes gross turnover rent.
(3) Includes tenants approved as thematic dining, entertainment and a performance centre in Bugis+.
(4) Others include Art Gallery and Luxury.
3
% of Gross Rental Income(2)
For the month of
December 2017
Food & Beverage 31.0
Fashion 12.4
Beauty & Health 11.4
Department Store 6.3
Gifts & Souvenirs / Toys & Hobbies / Books & Stationery / Sporting Goods 5.1
Leisure & Entertainment / Music & Video(3) 4.6
Services 4.3
Supermarket 4.3
Shoes & Bags 4.2
Office 3.2
IT & Telecommunications 3.1
Home Furnishing 2.6
Jewellery & Watches 2.4
Electrical & Electronics 1.6
Education 1.5
Warehouse 1.4
Others(4) 0.6
Total 100.0

CapitaLand Mall Trust Full Year 2017 Financial Results *January 2018*
Tenant Trade Sector% of Gross Rental
Income
RC Hotels (Pte) Ltd Hotel 3.2
Temasek Holdings (Private) Limited Office 2.7
Cold Storage Singapore (1983) Pte LtdSupermarket / Beauty & Health /
Services / Warehouse 2.6
Robinson & Co. (Singapore) Pte Ltd Department Store / Beauty & Health 2.1
NTUC Enterprise Supermarket / Beauty & Health / Services 2.1
BHG (Singapore) Pte. Ltd. Department Store 1.7
Wing Tai Retail Management Pte. Ltd. Fashion / Sporting Goods 1.5
Auric Pacific Group Limited Food & Beverage 1.4
BreadTalk Group Limited Food & Beverage 1.2
Isetan (Singapore) Limited Department Store / Supermarket 1.2
Total 19.7
Top 10 Tenants
(1) Based on gross rental income for the month of December 2017 and excludes gross turnover rent.
10 Largest Tenants Contribute About 19.7% of Total Gross Rental Income(1)
No Single Tenant Contributes More Than 4.0% of Total Gross Rental Income
4

CapitaLand Mall Trust Full Year 2017 Financial Results *January 2018*
Trade Mix – Tampines Mall
(1) Excludes gross turnover rent.
5
% of Gross Rental Income(1)
For the month of
December 2017
Food & Beverage 29.5
Fashion 12.5
Beauty & Health 11.0
Gifts & Souvenirs / Toys & Hobbies / Books & Stationery / Sporting Goods 7.0
Jewellery & Watches 6.7
Supermarket 6.0
IT & Telecommunications 5.9
Department Store 5.2
Leisure & Entertainment / Music & Video 3.9
Shoes & Bags 3.8
Education 3.3
Electrical & Electronics 2.7
Services 2.1
Home Furnishing 0.4
Total 100.0
(1) Excludes gross turnover rent.

CapitaLand Mall Trust Full Year 2017 Financial Results *January 2018*
Trade Mix – Junction 8
6
% of Gross Rental Income(1)
For the month of
December 2017
Food & Beverage 35.0
Beauty & Health 13.5
Fashion 10.9
Department Store 7.2
Supermarket 5.6
Services 4.8
Electrical & Electronics 4.6
Gifts & Souvenirs / Toys & Hobbies / Books & Stationery / Sporting Goods 4.3
Shoes & Bags 4.2
Leisure & Entertainment / Music & Video 3.5
Jewellery & Watches 2.0
IT & Telecommunications 1.6
Office 1.5
Home Furnishing 0.7
Education 0.6
Total 100.0
(1) Excludes gross turnover rent.

CapitaLand Mall Trust Full Year 2017 Financial Results *January 2018*
Trade Mix – IMM Building
7
% of Gross Rental Income(1)
For the month of
December 2017
Food & Beverage 22.0
Warehouse 14.4
Home Furnishing 14.3
Fashion 10.4
Supermarket 6.8
Shoes & Bags 6.3
Gifts & Souvenirs / Toys & Hobbies / Books & Stationery / Sporting Goods 6.2
Beauty & Health 6.1
Electrical & Electronics 4.7
Services 2.8
Department Store 2.1
Jewellery & Watches 2.1
IT & Telecommunications 1.8
Total 100.0
(1) Excludes gross turnover rent.

CapitaLand Mall Trust Full Year 2017 Financial Results *January 2018*
Trade Mix – Plaza Singapura
8
% of Gross Rental Income(1)
For the month of
December 2017
Food & Beverage 28.4
Beauty & Health 11.7
Fashion 9.3
Gifts & Souvenirs / Toys & Hobbies / Books & Stationery / Sporting Goods 7.5
Home Furnishing 6.4
Leisure & Entertainment / Music & Video 5.5
Services 5.5
Department Store 5.3
IT & Telecommunications 5.1
Shoes & Bags 4.8
Supermarket 4.2
Jewellery & Watches 3.4
Education 2.6
Electrical & Electronics 0.3
Total 100.0
(1) Excludes gross turnover rent.

CapitaLand Mall Trust Full Year 2017 Financial Results *January 2018*
Trade Mix – Bugis Junction
9
% of Gross Rental Income(1)
For the month of
December 2017
Food & Beverage 30.3
Fashion 17.0
Beauty & Health 12.2
Department Store 11.6
Gifts & Souvenirs / Toys & Hobbies / Books & Stationery / Sporting Goods 7.5
IT & Telecommunications 6.3
Shoes & Bags 5.2
Jewellery & Watches 5.1
Supermarket 2.9
Services 1.5
Electrical & Electronics 0.4
Total 100.0
(1) Excludes gross turnover rent.

CapitaLand Mall Trust Full Year 2017 Financial Results *January 2018*
Trade Mix – Sembawang Shopping Centre
10
% of Gross Rental Income(1)
For the month of
December 2017
Food & Beverage 27.7
Supermarket 17.2
Beauty & Health 14.0
Education 11.5
Department Store 8.5
Fashion 6.7
Home Furnishing 3.7
Leisure & Entertainment / Music & Video 3.1
Services 2.7
IT & Telecommunications 1.7
Gifts & Souvenirs / Toys & Hobbies / Books & Stationery / Sporting Goods 1.4
Shoes & Bags 1.2
Jewellery & Watches 0.6
Total 100.0
(1) Excludes gross turnover rent.

CapitaLand Mall Trust Full Year 2017 Financial Results *January 2018*
% of Gross Rental Income(1)
For the month of
December 2017
Food & Beverage 39.6
Fashion 14.8
Leisure & Entertainment / Music & Video 13.4
Beauty & Health 10.8
Services 4.6
Education 3.9
Supermarket 3.5
Gifts & Souvenirs / Toys & Hobbies / Books & Stationery / Sporting Goods 3.4
Shoes & Bags 2.0
Department Store 1.6
IT & Telecommunications 1.1
Home Furnishing 0.6
Jewellery & Watches 0.4
Electrical & Electronics 0.3
Total 100.0
Trade Mix – JCube
11
(1) Excludes gross turnover rent.

CapitaLand Mall Trust Full Year 2017 Financial Results *January 2018*
% of Gross Rental Income(1)
For the month of
December 2017
Food & Beverage 30.1
Fashion 18.3
Department Store 16.6
Beauty & Health 8.7
Shoes & Bags 7.9
Others(2) 5.7
Services 4.8
Gifts & Souvenirs / Toys & Hobbies / Books & Stationery / Sporting Goods 3.1
Supermarket 2.5
IT & Telecommunications 1.0
Jewellery & Watches 1.0
Electrical & Electronics 0.3
Total 100.0
Trade Mix – Raffles City Singapore (Retail Only)
12
(1) Excludes gross turnover rent.(2) Others include Art Gallery and Luxury.

CapitaLand Mall Trust Full Year 2017 Financial Results *January 2018*
Trade Mix – Lot One Shoppers’ Mall
13
% of Gross Rental Income(1)
For the month of
December 2017
Food & Beverage 32.3
Beauty & Health 16.9
Fashion 13.3
Services 5.8
Gifts & Souvenirs / Toys & Hobbies / Books & Stationery / Sporting Goods 4.8
Supermarket 4.2
Leisure & Entertainment / Music & Video 4.2
Department Store 4.1
Electrical & Electronics 3.5
IT & Telecommunications 2.8
Shoes & Bags 2.7
Jewellery & Watches 2.1
Education 1.8
Home Furnishing 1.5
Total 100.0
(1) Excludes gross turnover rent.

CapitaLand Mall Trust Full Year 2017 Financial Results *January 2018*
Trade Mix – Bukit Panjang Plaza
14
% of Gross Rental Income(1)
For the month of
December 2017
Food & Beverage 40.2
Beauty & Health 14.2
Supermarket 10.9
Services 10.1
Education 4.8
Gifts & Souvenirs / Toys & Hobbies / Books & Stationery / Sporting Goods 4.3
Fashion 3.5
Jewellery & Watches 2.5
Electrical & Electronics 2.2
IT & Telecommunications 2.1
Home Furnishing 1.9
Department Store 1.8
Shoes & Bags 1.5
Total 100.0
(1) Excludes gross turnover rent.
CapitaLand Mall Trust Full Year 2017 Financial Results *January 2018*
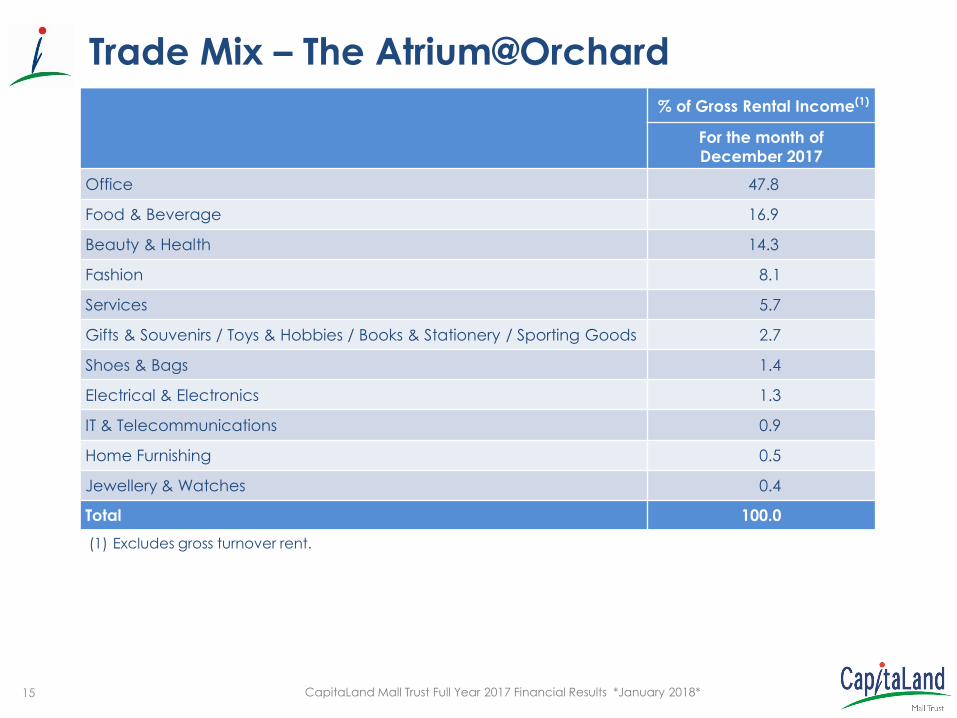
Trade Mix – The Atrium@Orchard
15
% of Gross Rental Income(1)
For the month of
December 2017
Office 47.8
Food & Beverage 16.9
Beauty & Health 14.3
Fashion 8.1
Services 5.7
Gifts & Souvenirs / Toys & Hobbies / Books & Stationery / Sporting Goods 2.7
Shoes & Bags 1.4
Electrical & Electronics 1.3
IT & Telecommunications 0.9
Home Furnishing 0.5
Jewellery & Watches 0.4
Total 100.0
(1) Excludes gross turnover rent.

CapitaLand Mall Trust Full Year 2017 Financial Results *January 2018*
Trade Mix – Clarke Quay
16
% of Gross Rental Income(1)
For the month of
December 2017
Food & Beverage 61.2
Leisure & Entertainment / Music & Video 34.2
Office 3.5
Beauty & Health 0.9
Services 0.2
Total 100.0
(1) Excludes gross turnover rent.

CapitaLand Mall Trust Full Year 2017 Financial Results *January 2018*
Trade Mix - Bugis+
(1) Excludes gross turnover rent.(2) Includes tenants approved as thematic dining, entertainment and a performance centre.
17
% of Gross Rental Income(1)
For the month of
December 2017
Leisure & Entertainment / Music & Video(2) 36.5
Fashion 30.0
Food & Beverage 15.0
Beauty & Health 7.7
Gifts & Souvenirs / Toys & Hobbies / Books & Stationery / Sporting Goods 5.6
Shoes & Bags 1.9
Services 1.6
Jewellery & Watches 0.9
IT & Telecommunications 0.8
Total 100.0

CapitaLand Mall Trust Full Year 2017 Financial Results *January 2018*
Trade Mix – Westgate
18
% of Gross Rental Income(1)
For the month of
December 2017
Food & Beverage 36.6
Beauty & Health 15.2
Fashion 9.1
Department Store 8.7
Services 7.9
Education 4.5
Gifts & Souvenirs / Toys & Hobbies / Books & Stationery / Sporting Goods 4.5
IT & Telecommunications 4.0
Supermarket 3.5
Shoes & Bags 3.3
Home Furnishing 1.7
Jewellery & Watches 0.6
Leisure & Entertainment / Music & Video 0.4
Total 100.0
(1) Excludes gross turnover rent.

CapitaLand Mall Trust Full Year 2017 Financial Results *January 2018*
% of Gross Rental Income(1)
For the month of
December 2017
Food & Beverage 36.4
Beauty & Health 16.4
Fashion 14.6
Supermarket 6.5
Gifts & Souvenirs / Toys & Hobbies / Books & Stationery / Sporting Goods 5.2
Services 4.6
IT & Telecommunications 3.5
Shoes & Bags 3.3
Jewellery & Watches 2.6
Electrical & Electronics 2.4
Home Furnishing 2.3
Department Store 1.7
Education 0.4
Leisure & Entertainment / Music & Video 0.1
Total 100.0
Trade Mix – Bedok Mall
19
(1) Excludes gross turnover rent.

CapitaLand Mall Trust Full Year 2017 Financial Results *January 2018*
Lease Expiry Profile – Tampines Mall(1
)
(1) As at 31 December 2017. Based on committed gross rental income for the expiry month of the lease and
excludes gross turnover rental.
20
0.0
10.0
20.0
30.0
40.0
2018 2019 2020 2021 2022 2023 and
beyond
29.9
26.4
31.5
5.8
1.3
5.1
% o
f to
tal G
ross
Re
nta
l In
co
me

CapitaLand Mall Trust Full Year 2017 Financial Results *January 2018*
Lease Expiry Profile – Junction 8(1
)
21
(1) As at 31 December 2017. Based on committed gross rental income for the expiry month of the lease andexcludes gross turnover rental.
0.0
10.0
20.0
30.0
40.0
50.0
2018 2019 2020 2021 2022 2023 and
beyond
22.5
42.9
21.0
12.1
1.5
% o
f to
tal G
ross
Re
nta
l In
co
me

CapitaLand Mall Trust Full Year 2017 Financial Results *January 2018*
Lease Expiry Profile – IMM Building(1
)
22
(1) As at 31 December 2017. Based on committed gross rental income for the expiry month of the lease and
excludes gross turnover rental.
0.0
10.0
20.0
30.0
40.0
50.0
2018 2019 2020 2021 2022 2023 and
beyond
41.3
32.2
15.4
3.3
7.2
0.6
% o
f to
tal G
ross
Re
nta
l In
co
me
CapitaLand Mall Trust Full Year 2017 Financial Results *January 2018*
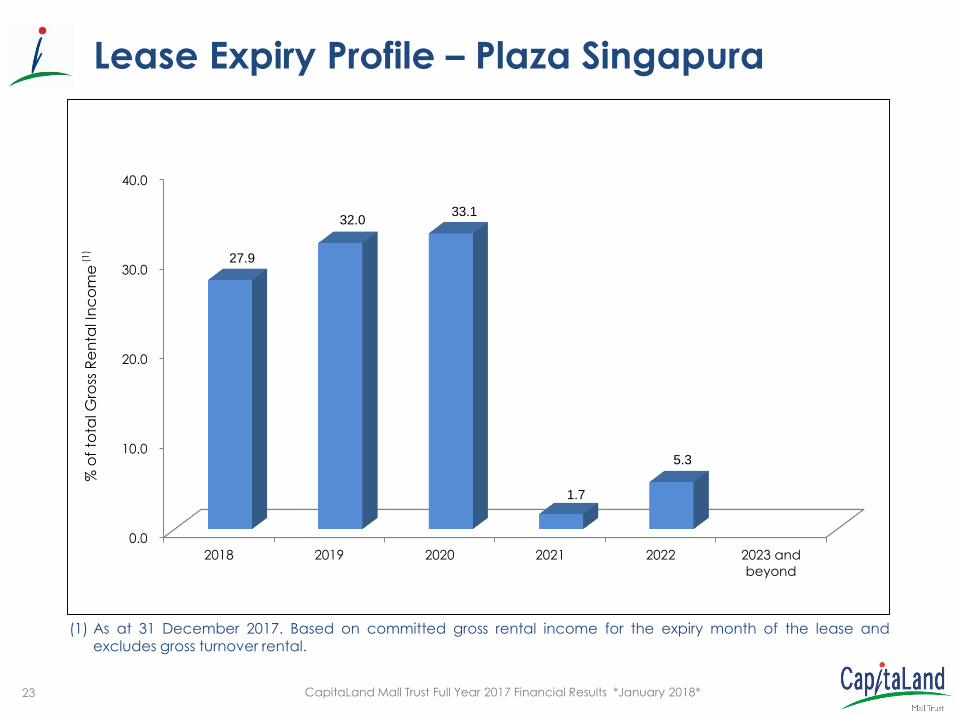
Lease Expiry Profile – Plaza Singapura(1
)
23
(1) As at 31 December 2017. Based on committed gross rental income for the expiry month of the lease and
excludes gross turnover rental.
0.0
10.0
20.0
30.0
40.0
2018 2019 2020 2021 2022 2023 and
beyond
27.9
32.0 33.1
1.7
5.3
% o
f to
tal G
ross
Re
nta
l In
co
me

CapitaLand Mall Trust Full Year 2017 Financial Results *January 2018*
0.0
10.0
20.0
30.0
40.0
50.0
2018 2019 2020 2021 2022 2023 and
beyond
18.8
45.2
26.4
8.1
1.5
% o
f to
tal G
ross
Re
nta
l In
co
me
Lease Expiry Profile – Bugis Junction(1
)
24
(1) As at 31 December 2017. Based on committed gross rental income for the expiry month of the lease and
excludes gross turnover rental.

CapitaLand Mall Trust Full Year 2017 Financial Results *January 2018*
0.0
10.0
20.0
30.0
40.0
2018 2019 2020 2021 2022 2023 and
beyond
38.9
23.8
32.9
2.0 2.4
% o
f to
tal G
ross
Re
nta
l In
co
me
Lease Expiry Profile – Sembawang Shopping Centre(1
)
25
(1) As at 31 December 2017. Based on committed gross rental income for the expiry month of the lease and
excludes gross turnover rental.

CapitaLand Mall Trust Full Year 2017 Financial Results *January 2018*
Lease Expiry Profile – JCube(1
)
26
(1) As at 31 December 2017. Based on committed gross rental income for the expiry month of the lease and
excludes gross turnover rental.
0.0
10.0
20.0
30.0
40.0
50.0
2018 2019 2020 2021 2022 2023 and
beyond
48.2
31.4
13.3
4.3 2.8
% o
f to
tal G
ross
Re
nta
l In
co
me

CapitaLand Mall Trust Full Year 2017 Financial Results *January 2018*
0.0
10.0
20.0
30.0
40.0
2018 2019 2020 2021 2022 2023 & Beyond
10.2
18.7
15.8
4.2
0.51.8
7.1
4.45.4
31.9
% o
f to
tal G
ross
Re
nta
l In
co
me
Retail Office Hotel
Lease Expiry Profile – Raffles City Singapore
(1) As at 31 December 2017. Based on committed gross rental income and excludes gross turnover rental.
27
(1)

CapitaLand Mall Trust Full Year 2017 Financial Results *January 2018*
Lease Expiry Profile – Lot One Shoppers’ Mall(1
)
28
(1) As at 31 December 2017. Based on committed gross rental income for the expiry month of the lease and
excludes gross turnover rental.
0.0
10.0
20.0
30.0
40.0
50.0
2018 2019 2020 2021 2022 2023 and
beyond
44.0
16.6
29.0
9.0
1.4
% o
f to
tal G
ross
Re
nta
l In
co
me

CapitaLand Mall Trust Full Year 2017 Financial Results *January 2018*
0.0
10.0
20.0
30.0
40.0
50.0
2018 2019 2020 2021 2022 2023 and
beyond
44.8
27.3
22.0
1.3 0.9
3.7
% o
f to
tal G
ross
Re
nta
l In
co
me
Lease Expiry Profile – Bukit Panjang Plaza(1
)
29
(1) As at 31 December 2017. Based on committed gross rental income for the expiry month of the lease and
excludes gross turnover rental.

CapitaLand Mall Trust Full Year 2017 Financial Results *January 2018*
0.0
10.0
20.0
30.0
40.0
50.0
2018 2019 2020 2021 2022 2023 and
beyond
18.7
21.7
8.6
1.6
49.4
% o
f to
tal G
ross
Re
nta
l In
co
me
Lease Expiry Profile – The Atrium@Orchard(1
)
30
(1) As at 31 December 2017. Based on committed gross rental income for the expiry month of the lease and
excludes gross turnover rental.

CapitaLand Mall Trust Full Year 2017 Financial Results *January 2018*
Lease Expiry Profile – Clarke Quay(1
)
31
(1) As at 31 December 2017. Based on committed gross rental income for the expiry month of the lease and
excludes gross turnover rental.
0.0
10.0
20.0
30.0
2018 2019 2020 2021 2022 2023 and
beyond
21.2
27.1 26.6
21.5
3.6
% o
f to
tal G
ross
Re
nta
l In
co
me

CapitaLand Mall Trust Full Year 2017 Financial Results *January 2018*
0.0
10.0
20.0
30.0
40.0
2018 2019 2020 2021 2022 2023 and
beyond
38.4
20.3
17.9
20.1
3.3
% o
f to
tal G
ross
Re
nta
l In
co
me
Lease Expiry Profile – Bugis+(1
)
32
(1) As at 31 December 2017. Based on committed gross rental income for the expiry month of the lease and
excludes gross turnover rental.

CapitaLand Mall Trust Full Year 2017 Financial Results *January 2018*
Lease Expiry Profile – Westgate(1
)
33
(1) As at 31 December 2017. Based on committed gross rental income for the expiry month of the lease andexcludes gross turnover rental.
0.0
10.0
20.0
30.0
40.0
2018 2019 2020 2021 2022 2023 and
beyond
23.5
30.9
36.9
8.4
0.3
% o
f to
tal G
ross
Re
nta
l In
co
me
CapitaLand Mall Trust Full Year 2017 Financial Results *January 2018*
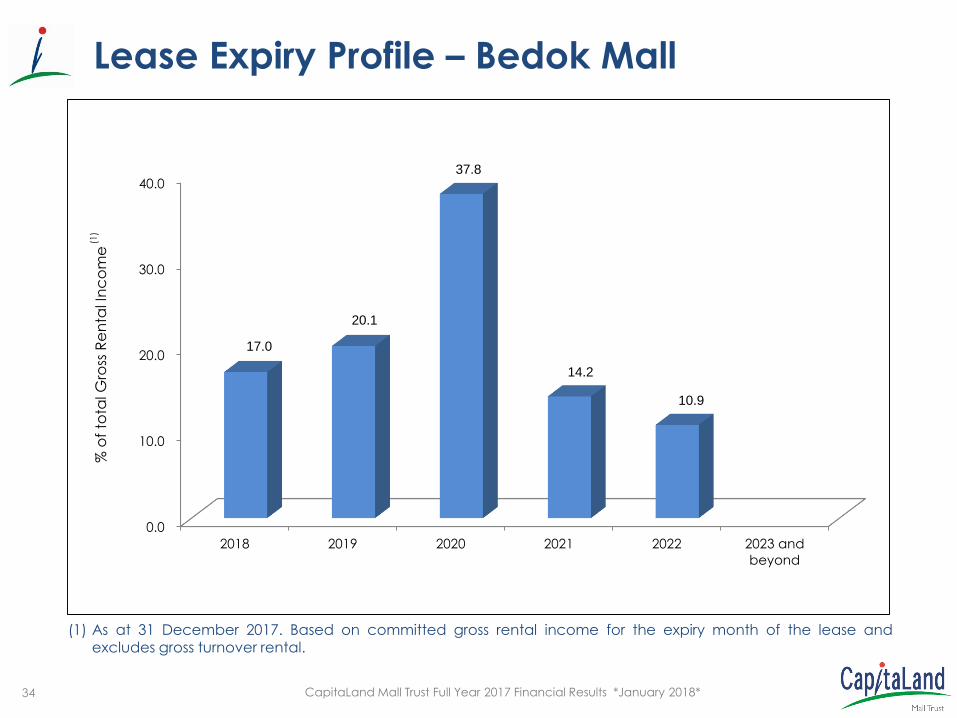
Lease Expiry Profile – Bedok Mall(1
)
34
(1) As at 31 December 2017. Based on committed gross rental income for the expiry month of the lease and
excludes gross turnover rental.
0.0
10.0
20.0
30.0
40.0
2018 2019 2020 2021 2022 2023 and
beyond
17.0
20.1
37.8
14.2
10.9
% o
f to
tal G
ross
Re
nta
l In
co
me

CapitaLand Mall Trust Full Year 2017 Financial Results *January 2018*
Thank you
For enquiries, please contact: Ms Audrey Tan, Investor Relations,
Direct: (65) 6713 1507 Email: [email protected]
CapitaLand Mall Trust Management Limited (http://www.cmt.com.sg)
168 Robinson Road, #30-01 Capital Tower, Singapore 068912
Tel: (65) 6713 2888; Fax: (65) 6713 2999