capitaldynamics_valuecreationinpe
TRANSCRIPT

8/6/2019 capitaldynamics_valuecreationinpe
http://slidepdf.com/reader/full/capitaldynamicsvaluecreationinpe 1/6
1/6
Value Creation in Private Equity
By Prof. Dr. Dr. Ann-Kristin Achleitner, CEFS; Dr. Katharina Lichtner and Dr. Christian Diller,
Capital Dynamics
The last 18 months have been characterized by an unprecedented financial crisis. The subprime
crisis has led to a change in the banking sector that has never been seen before. In particular,
debt issuance has decreased substantially—while leverage seemed to be available in abun-
dance in early 2007, debt volumes have come down by two thirds since then. These develop-
ments question the business model of private equity and raise crucial questions:
To what extent is private equity value creation driven by operational improvements
and what is the dependency on leverage?
How did value creation happen in the past?
What is private equity value creation likely to look like in the next cycle?
To answer these questions, Capital Dynamics teamed up with Prof. Dr. Dr. Ann-Kristin Achleit-
ner, Co-Director of the Center for Entrepreneurial and Financial Studies at the Technical Univer-
sity of Munich (CEFS), and her research team1 in a joint study to cover this topic. The study
screened a comprehensive data set of private equity transactions for its value drivers, offering in-
depth insight into private equity value creation during the last 20 years. In addition, the methodo-
logical framework for calculating the value drivers was further improved.
Overall, the results of the study draw a bright picture for private equity. Two thirds of the value
creation were attributed to operational enhancements at the respective portfolio companies and
to an increase in market multiples. The leverage effect (i.e. increasing the return on equity by
deploying debt) accounted for one third of value creation. Furthermore, the study offers evi-
dence that operational improvements were higher at private equity portfolio companies com-
pared to their listed counterparts.
The underlying study examines value creation and cash flow data — enterprise value, equity
value, sales, EBITDA, net debt at entry and exit, and interim cash flows2 — of 241 firms from
1989 until 20063. Transaction volumes at company level covered a broad spectrum, ranging
from EUR 1 million to EUR 4.3 billion. 85% of all transactions were European. The data not only
covered successful deals but also transactions which failed to pay back the total initial investedcapital. The average debt-to-equity ratio of portfolio companies amounted to 1.7x at investment
entry and was lowered to 0.8x on average over an average holding period of 3.5 years.
1Dr. Reiner Braun, Nico Engel, Christian Figge and Florian Tappeiner.
2Cash flows between portfolio company and fund during the holding period of the investment.
3Members of the CEFS only received fully anonymized data without any reference to company, fund or manager.

8/6/2019 capitaldynamics_valuecreationinpe
http://slidepdf.com/reader/full/capitaldynamicsvaluecreationinpe 2/6
2/6
In contrast to earlier research, the study not only accounts for the free cash flow effect (hence
also for the de-leverage effect), but also for the leverage effect taking a company’s financial risk
into consideration. Furthermore, the operational component distinguishes between sales growth
and improved operational margins, giving a detailed picture as illustrated in Figure 1.
Figure 1: Value creation in private equity
Figure 1 shows that out of a total value increase of 2.72x of the equity invested by the PE gen-
eral partner, 0.89x is accounted for by the use of leverage, while a further 0.88x resulted from
positive EBITDA growth. The remainder was almost equally split by free cash flow improve-
ments and multiples growth, with 0.42x and 0.47x respectively. The combination components4
were largely negligible. A closer examination of the EBITDA growth shows that almost 80% isaccounted for by sales growth, while only 20% resulted from improved margins. These results
indicate that (a) leverage accounted for one third of value creation, and (b) value creation without
the use of leverage was considerable at 1.84x over an average holding period of 3.5 years.
Figure 2: Value creation in private equity over different time horizons
4The combination components are correction factors to capture the combined effects of EBITDA and multiples.
Value drivers EBITDA components
N=241
HP*=3,49
Sample info:
* Holding Period in years
2,72
1,84
0,88
0,42 0,47 0,07
0,89
-0,50
0,00
0,50
1,00
1,50
2,00
2,50
3,00
0,880,68
0,22
-0,02
-0,50
0,00
0,50
1,00
1,50
2,00
2,50
3,00
Totalvalue
- Leverage EBITDAgrowth
FCFContri-bution
MultipleContri-bution
Combi-nation
EBITDAgrowth
Revenuegrowth
MarginImprove-ment
-OperativeContri-bution
Combi-nation
Comparison of value drivers Comparison of EBITDA component
2.5x 3.0x 1.0x 0,75x
-16%8%
28%
41%
22%
17%
-8%
36%
25%
10%20%
8%
-20%
-10%
0%
10%
20%
30%
40%
50%
60%
70%
80%
90%
100%
1989-2000
2001-200673%
30%
-2%
83%
18%
-2%
-20%
-10%
0%
10%
20%
30%
40%
50%
60%
70%
80%
90%
100%
1989 - 2000
2001 - 2006
Totalvalue
- Lev er age EBITDAgrowth
FCFContri-bution
MultipleContri-bution
Combi-nation
EBITDAgrowth
Revenuegrowth
MarginImprove-ment
- Combi-nation
Comparison of value drivers Comparison of EBITDA component
1.0x 0.8x
-16%8%
28%
41%
22%
17%
-8%
36%
25%
10%17%
11%
-20%
-10%
0%
10%
20%
30%
40%
50%
60%
70%
80%
90%
100%
1989-2000
2001-200673%
30%
-2%
83%
19%
-2%
-20%
-10%
0%
10%
20%
30%
40%
50%
60%
70%
80%
90%
100%
1989 - 2000
2001 - 2006
Totalvalue
- Lev er age EBITDAgrowth
FCFContri-bution
MultipleContri-bution
Combi-nation
EBITDAgrowth
Revenuegrowth
MarginImprove-ment
- Combi-nation
Comparison of value drivers Comparison of EBITDA component
2.5x 3.0x 1.0x 0,75x
-16%8%
28%
41%
22%
17%
-8%
36%
25%
10%20%
8%
-20%
-10%
0%
10%
20%
30%
40%
50%
60%
70%
80%
90%
100%
1989-2000
2001-200673%
30%
-2%
83%
18%
-2%
-20%
-10%
0%
10%
20%
30%
40%
50%
60%
70%
80%
90%
100%
1989 - 2000
2001 - 2006
Totalvalue
- Lev er age EBITDAgrowth
FCFContri-bution
MultipleContri-bution
Combi-nation
EBITDAgrowth
Revenuegrowth
MarginImprove-ment
- Combi-nation
Comparison of value drivers Comparison of EBITDA component
1.0x 0.8x
-16%8%
28%
41%
22%
17%
-8%
36%
25%
10%17%
11%
-20%
-10%
0%
10%
20%
30%
40%
50%
60%
70%
80%
90%
100%
1989-2000
2001-200673%
30%
-2%
83%
19%
-2%
-20%
-10%
0%
10%
20%
30%
40%
50%
60%
70%
80%
90%
100%
1989 - 2000
2001 - 2006
Totalvalue
- Lev er age EBITDAgrowth
FCFContri-bution
MultipleContri-bution
Combi-nation
EBITDAgrowth
Revenuegrowth
MarginImprove-ment
- Combi-nation
8/6/2019 capitaldynamics_valuecreationinpe
http://slidepdf.com/reader/full/capitaldynamicsvaluecreationinpe 3/6
3/6
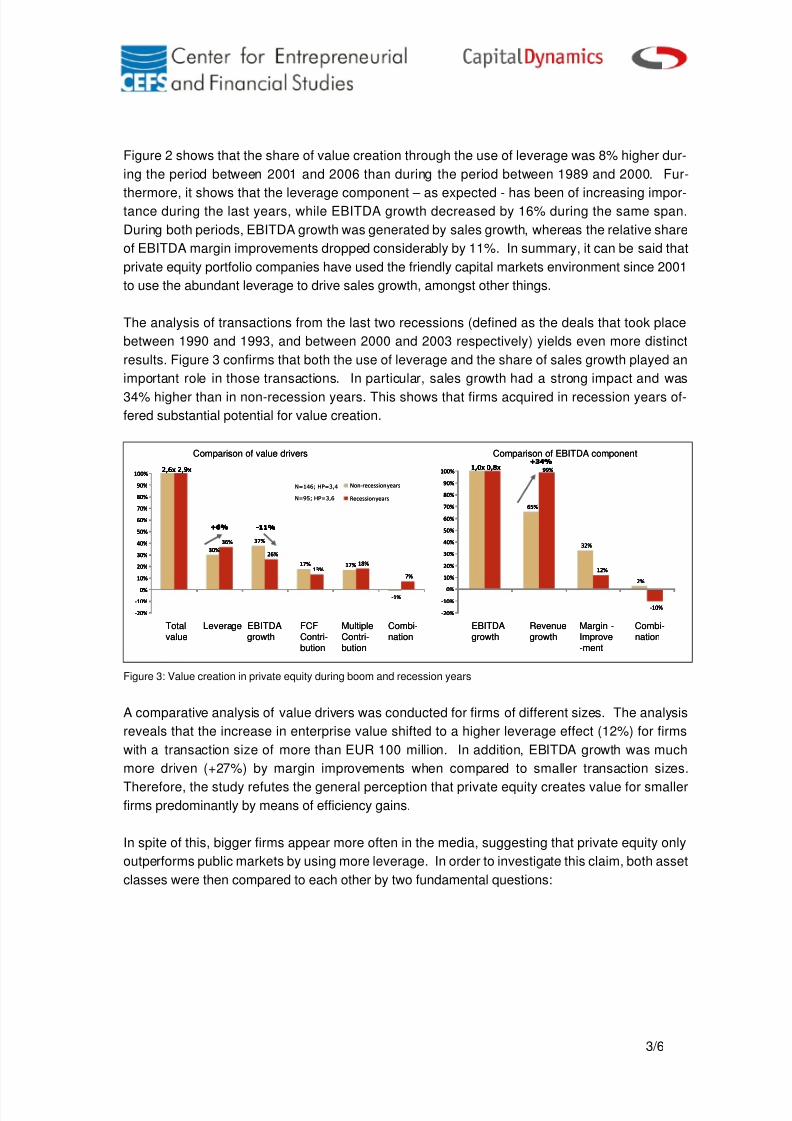
Figure 2 shows that the share of value creation through the use of leverage was 8% higher dur-
ing the period between 2001 and 2006 than during the period between 1989 and 2000. Fur-
thermore, it shows that the leverage component – as expected - has been of increasing impor-tance during the last years, while EBITDA growth decreased by 16% during the same span.
During both periods, EBITDA growth was generated by sales growth, whereas the relative share
of EBITDA margin improvements dropped considerably by 11%. In summary, it can be said that
private equity portfolio companies have used the friendly capital markets environment since 2001
to use the abundant leverage to drive sales growth, amongst other things.
The analysis of transactions from the last two recessions (defined as the deals that took place
between 1990 and 1993, and between 2000 and 2003 respectively) yields even more distinct
results. Figure 3 confirms that both the use of leverage and the share of sales growth played an
important role in those transactions. In particular, sales growth had a strong impact and was
34% higher than in non-recession years. This shows that firms acquired in recession years of-
fered substantial potential for value creation.
Figure 3: Value creation in private equity during boom and recession years
A comparative analysis of value drivers was conducted for firms of different sizes. The analysis
reveals that the increase in enterprise value shifted to a higher leverage effect (12%) for firms
with a transaction size of more than EUR 100 million. In addition, EBITDA growth was much
more driven (+27%) by margin improvements when compared to smaller transaction sizes.
Therefore, the study refutes the general perception that private equity creates value for smallerfirms predominantly by means of efficiency gains.
In spite of this, bigger firms appear more often in the media, suggesting that private equity only
outperforms public markets by using more leverage. In order to investigate this claim, both asset
classes were then compared to each other by two fundamental questions:
30%
37%
17% 17%
-1%
36%
26%
13%18%
7%
-20%
-10%
0%
10%
20%
30%
40%
50%
60%
70%
80%
90%
100%
65%
32%
2%
99%
12%
-10%-20%
-10%
0%
10%
20%
30%
40%
50%
60%
70%
80%
90%
100%2,6x 2,9x 1,0x 0,8x
+6% -11%
N=146; HP=3,4
+34%
30%
37%
17% 17%
-1%
36%
26%
13%18%
7%
-20%
-10%
0%
10%
20%
30%
40%
50%
60%
70%
80%
90%
100%
Non-recession years
Recession years
65%
32%
2%
99%
12%
-10%-20%
-10%
0%
10%
20%
30%
40%
50%
60%
70%
80%
90%
100%2,6x 2,9x 1,0x 0,8x
+6% -11%
+34%
2,6x 2,9x 1,0x 0,8x
+6% -11%
N=95; HP=3,6
+34%
Totalvalue
Leverage EBITDAgrowth
FCFContri-bution
MultipleContri-bution
Combi-nation
EBITDAgrowth
Revenuegrowth
MarginImprove-ment
- Combi-nation
Comparison of value drivers Comparison of EBITDA component
30%
37%
17% 17%
-1%
36%
26%
13%18%
7%
-20%
-10%
0%
10%
20%
30%
40%
50%
60%
70%
80%
90%
100%
65%
32%
2%
99%
12%
-10%-20%
-10%
0%
10%
20%
30%
40%
50%
60%
70%
80%
90%
100%2,6x 2,9x 1,0x 0,8x
+6% -11%
N=146; HP=3,4
+34%
30%
37%
17% 17%
-1%
36%
26%
13%18%
7%
-20%
-10%
0%
10%
20%
30%
40%
50%
60%
70%
80%
90%
100%
Non-recession years
Recession years
65%
32%
2%
99%
12%
-10%-20%
-10%
0%
10%
20%
30%
40%
50%
60%
70%
80%
90%
100%2,6x 2,9x 1,0x 0,8x
+6% -11%
+34%
2,6x 2,9x 1,0x 0,8x
+6% -11%
N=95; HP=3,6
+34%
Totalvalue
Leverage EBITDAgrowth
FCFContri-bution
MultipleContri-bution
Combi-nation
EBITDAgrowth
Revenuegrowth
MarginImprove-ment
- Combi-nation
Comparison of value drivers Comparison of EBITDA component

8/6/2019 capitaldynamics_valuecreationinpe
http://slidepdf.com/reader/full/capitaldynamicsvaluecreationinpe 4/6
4/6
Does private equity create value for its portfolio companies in comparison to publicly traded
companies? If this is the case, what is the extent of the operational alpha created by private
equity?
To answer this question, each of the 241 companies was matched to a comparable publicly
traded counterpart (with respect to geography, industry, sales and EBITDA) in such a way as to
minimize the differences at the time of investment. The unlevered, equity-only (unlevered) IRR
was then calculated for both data sets, and the difference gives the operational alpha in private
equity. Figure 4 reveals a positive alpha of 6% in private equity on an unlevered basis. Further-
more, the figure shows that, within the given sample, the higher use of leverage in private equity
increased the absolute return of private equity by 21% compared to the public market.
Figure. 4: Operational private equity alpha
In conclusion, the underlying study reveals that private equity has been able to create value even
with reduced levels of leverage as well as an operational alpha. Two thirds of the value was
created by operational enhancements, which in turn were mainly due to sales growth instead of
margin improvements. Furthermore, the study shows that firms acquired in recession times not
only yielded superior returns but also achieved that by increasing sales. However, increasing
EBITDA margins and using higher leverage gained in importance for larger companies.
The study presented here helps to draw a clearer picture of how value is created in private eq-
uity, and serves as a basis for an informed discussion about private equity. From Capital Dy-
namics point of view, the study marks a big step forward for due diligence, as it improves theframework to analyze private equity value creation and makes it comparable. Until now bench-
marking was only possible with respect to IRRs and multiples, but these figures do not permit
conclusions to be drawn on future performance. A deeper understanding of the value creation
potential of a private equity manager as well as the manager's success relative to a benchmark
enables the formation of an opinion of how far a manager can be successful in the future.
48%
31%
6%
17%
25%
0%
5%
10%
15%
20%
25%
30%
35%
40%
45%50%
55%
Levered
IRR PE
Leverage-
effect
Unlevered
IRR PE
Unlevered IRR
Benchmark
Operative
Alpha
0%
5%
10%
15%
20%
25%
30%
35%
40%
45%
50%
55%
PE Benchmark
PE IRR 48%
100%
Benchmark IRR 27% 100%
Leverage
Operational
N=242
HP**=3,49
Alpha
Value drivers Operative vs. Financial driver
65%
35%
9%
91%

8/6/2019 capitaldynamics_valuecreationinpe
http://slidepdf.com/reader/full/capitaldynamicsvaluecreationinpe 5/6
5/6
For further information, please contact
Prof. Dr. Dr. Ann-Kristin Achleitner Dr. Katharina Lichtner, Managing DirectorHead of Research
CEFS Capital DynamicsArcisstr. 21 Bahnhofstrasse 22D-80331 München CH-6301 ZugGermany Switzerland
Phone: +49 289 25181 Phone: +41 41 748 8402Mobile: +41 76 314 8402
Fax : +49 289 25188 Fax: +41 41 748 8444Email : [email protected] Email: [email protected]
Center for Entrepreneurial and Financial Studies (CEFS) at the Technischen UniversitätMünchen
The Center for Entrepreneurial and Financial Studies aims at providing state of the art research
in the fields of entrepreneurial and corporate finance. Its research focus is on corporate financing
and ownership structure in public and private capital markets. Special attention is paid to the
analysis of demand for capital by smaller and young, innovative companies as well as the supply
of debt and risk capital by banks and institutional investors.
The CEFS is mainly concerned with practical issues and tries to develop scientifically thorough
solutions in a close dialogue with practitioners. In doing so, CEFS receives broad support from
its international network of researchers and practitioners in the field of finance.
www.cefs.de
About Capital Dynamics
Capital Dynamics is an independent asset management firm focused on private equity. Capital
Dynamics offers institutional investors and family offices a wide range of private equity products
and services: fund of funds, co-investments, separate account solutions and structured private
equity products. With more than 20 years of experience, Capital Dynamics oversees over USD
20 billion of client capital committed to the funds of leading private equity managers. Capital Dy-
namics’s client list includes some of the world’s largest and most sophisticated investors in pri-
vate equity.
www.capdyn.com

8/6/2019 capitaldynamics_valuecreationinpe
http://slidepdf.com/reader/full/capitaldynamicsvaluecreationinpe 6/6
6/6
Since 2001, Prof. Dr. Dr. Ann-Kristin Achleitner holds the KfW En-
dowed Chair in Entrepreneurial Finance and is Scientific Co-Director at
the Center for Entrepreneurial and Financial Studies (CEFS) at Tech-
nische Universität München (TUM). Her research focus is in the areas
of venture capital, private equity and social entrepreneurship. She also
worked as an expert for the Federal Ministry of Finance on the legal and
tax environment of private equity in Germany and contributed to “The
Global Economic Impact of Private Equity Report 2008” as part of the
World Economic Forum 2008. Prof. Achleitner earned several awards
for both research and teaching including the Order of Merit of the Fed-
eral Republic of Germany in 2007.
Katharina Lichtner is a Managing Director and heads Research at
Capital Dynamics. She has been instrumental in developing the invest-
ment and post-investment monitoring skills of Capital Dynamics.
Katharina is a member of the board of directors of Capital Dynamics as
well as a member of the Executive Committee. She is also member of
the board of the IPEV (International Private Equity and Venture Capital
Valuation Guidelines) being one of the representative of the EVCA.
Previously, she was a consultant at McKinsey & Company. From 1992through 1996, Katharina worked in a research position at the Basle
Institute for Immunology. Katharina holds a PhD in Immunology and an
MSc in Molecular Biology and Biochemistry from the Biocenter Basle.
Christian Diller is a Director and heads the Solutions team including
Capital Dynamics’ Portfolio & Risk Management and Structuring activi-
ties. Christian has more than six years experience in analyzing and
structuring private equity portfolios. He gained his professional experi-
ence in traditional asset management divisions at Allianz Group and
Pioneer Investments (UniCredit) and worked on various advisory pro- jects for the European Private Equity and Venture Capital Association
(EVCA) and Standard & Poor’s. Before joining Capital Dynamics he was
a research assistant at the Technical University of Munich where he
received his PhD in finance specializing on risk-/return characteristics of
Private Equity Funds.