capitamall trust - cmt.listedcompany.comcmt.listedcompany.com/newsroom/20141111_173432_c38... ·...
TRANSCRIPT

CAPITAMALL TRUST Singapore’s First & Largest REIT
Morgan Stanley Thirteenth Annual Asia Pacific Summit
12 November 2014
Photo
Cre
dit: K
wek S
wee S
eng, S
ingapore
Photo
Cre
dit: K
wek S
wee S
eng, S
ingapore

Morgan Stanley Thirteenth Annual Asia Pacific Summit *November 2014*
This presentation may contain forward-looking statements that involve assumptions, risks and uncertainties. Actual
future performance, outcomes and results may differ materially from those expressed in forward-looking statements
as a result of a number of risks, uncertainties and assumptions. Representative examples of these factors include
(without limitation) general industry and economic conditions, interest rate trends, cost of capital and capital
availability, competition from other developments or companies, shifts in expected levels of occupancy rate,
property rental income, charge out collections, changes in operating expenses (including employee wages,
benefits and training costs), governmental and public policy changes and the continued availability of financing
in the amounts and the terms necessary to support future business. You are cautioned not to place undue
reliance on these forward-looking statements, which are based on the current view of management on future
events.
The information contained in this presentation has not been independently verified. No representation or warranty
expressed or implied is made as to, and no reliance should be placed on, the fairness, accuracy, completeness or
correctness of the information or opinions contained in this presentation. Neither CapitaMall Trust Management Limited (the “Manager”) or any of its affiliates, advisers or representatives shall have any liability whatsoever (in
negligence or otherwise) for any loss howsoever arising, whether directly or indirectly, from any use, reliance or
distribution of this presentation or its contents or otherwise arising in connection with this presentation.
The past performance of CapitaMall Trust (“CMT”) is not indicative of the future performance of CMT. Similarly, the
past performance of the Manager is not indicative of the future performance of the Manager.
The value of units in CMT (“Units”) and the income derived from them may fall as well as rise. Units are not
obligations of, deposits in, or guaranteed by, the Manager or any of its affiliates. An investment in Units is subject to
investment risks, including the possible loss of the principal amount invested.
Investors should note that they will have no right to request the Manager to redeem or purchase their Units for so
long as the Units are listed on the Singapore Exchange Securities Trading Limited (the “SGX-ST”). It is intended that
unitholders of CMT may only deal in their Units through trading on the SGX-ST. Listing of the Units on the SGX-ST does
not guarantee a liquid market for the Units.
This presentation is for information only and does not constitute an invitation or offer to acquire, purchase or
subscribe for Units.
Disclaimer

Morgan Stanley Thirteenth Annual Asia Pacific Summit *November 2014*
Contents
3
Key Highlights and Financial Results
Portfolio Updates
Asset Enhancement Initiatives
Acquisitions & Development
Looking Forward
Annexes

Morgan Stanley Thirteenth Annual Asia Pacific Summit *November 2014*
Key Highlights and
Financial Results
Westgate

Morgan Stanley Thirteenth Annual Asia Pacific Summit *November 2014*
Key Highlights of 3Q 2014
• Operational performance (year-to-date)
– 417 new leases/renewals achieved with 6.3% positive rental reversion
– 98.5% portfolio occupancy rate as at end-September 2014
– Shopper traffic decreased by 1.5% year on year
– Tenants’ sales per square foot (“psf”) decreased by 3.0% year on year
• Update on asset enhancement initiatives (AEIs)
– Bugis Junction: Completed Phase 2 asset enhancement works in September 2014
– JCube: J. Avenue commenced trading in September 2014
• Proactive capital management
– Issued S$300.0 million fixed rate notes with 10 years tenure at 3.48% p.a.
5

Morgan Stanley Thirteenth Annual Asia Pacific Summit *November 2014*
Delivering Consistent Returns Over Time and Across Economic Cycles
6
Solid Performance Since Listing
Gross Revenue (1) (S$ million) Distributable Income (S$ million)
(1) The amount does not take into account the retrospective adjustments relating to Financial Reporting Standards (“FRS”) 111
Joint Arrangements.
(2) Based on compounded annual growth rate (“CAGR”).

Morgan Stanley Thirteenth Annual Asia Pacific Summit *November 2014*
Steadfast Performance
Delivering Consistent Returns Over Time
# The amount does not take into account the retrospective adjustments relating to FRS 111 Joint Arrangements.
#
7

Morgan Stanley Thirteenth Annual Asia Pacific Summit *November 2014*
276.2261.8
YTD Sep 2014 YTD Sep 2013
Distributable Income (S$ mil)
7.98 7.55
YTD Sep 2014 YTD Sep 2013
DPU (cents)
YTD Sep 2014 Distributable Income Up 5.5% Y-o-Y
8
Distributable Income
S$276.2 million
5.5% Y-o-Y
Distribution Per Unit (DPU)
7.98 cents
5.7% Y-o-Y
Annualised DPU
10.67 cents
5.7% Y-o-Y
Annualised Distribution
Yield
5.57
%
(1)
(1) For YTD Sep 2014 and YTD Sep 2013, CMT had retained S$11.2 million and S$3.8 million of its taxable income available for distribution
to Unitholders for distribution in 4Q 2014 and 4Q 2013 respectively.
(1)
(Based on unit price of S$1.915 on 17 October 2014)

Morgan Stanley Thirteenth Annual Asia Pacific Summit *November 2014*
Debt Maturity Profile as at 30 September 2014
505.2
157.6 190.1 140.0
100.0
250.0
62.0 185.6
320.0
80.0 10.4
350.0
799.5
596.0
226.0
412.0450.0
0
100
200
300
400
500
600
700
800
2015 2016 2017 2018 2019 2020 2021 2022 2023 2024
S$ m
illio
n
Notes issued under US$ Euro-Medium Term Note ("EMTN") Programme Notes issued under S$ Medium Term Note ("MTN") Programme
Secured Banking Facilities - 30.0% interest in Infinity Trusts Secured CMBS from Silver Oak - 40.0% interest in RCS Trust
Secured term loan from Silver Oak - 40.0% interest in RCS Trust Secured revolving credit facility from Silver Oak - 40.0% interest in RCS Trust
Retail Bonds due 2021 at fixed rate of 3.08% p.a.
(1) Includes CMT’s share of borrowings in RCS Trust (40.0%) and Infinity Office Trust and Infinity Mall Trust (collectively known as “Infinity Trusts”)(30.0%). (2) Includes US$500.0 million 4.321% fixed rate notes (“EMTN Series 1”) which were swapped to S$699.5 million at a fixed interest rate of 3.794% p.a. in April 2010. (3) Drawdown of S$26.0 million under Silver Oak from the S$300.0 million revolving credit facility. CMT’s 40.0% share thereof is S$10.4 million. (4) S$200.0 million 5-year term loan under Silver Oak. CMT’s 40.0% share thereof is S$80.0 million. (5) US$645.0 million in principal amount of Class A Secured Floating Rate Notes with expected maturity on 21 June 2016 issued pursuant to the S$10.0 billion Multicurrency Secured
Medium Term Note Programme established by Silver Oak and are secured by its rights to Raffles City Singapore. The proceeds have been swapped into S$800.0 million. CMT’s 40.0% share thereof is S$320.0 million.
(6) S$618.6 million secured banking facilities by Infinity Trusts. CMT’s 30.0% share thereof is S$185.6 million. The secured banking facilities are repayable on the earlier of (i) the date 12 months after the Final Temporary Occupation Permit (“TOP”) date for the mixed development which comprises Westgate and Westgate Tower or (ii) 60 months after date of facility agreement. Westgate has commenced operations on 2 December 2013 and Westgate Tower has obtained TOP on 9 October 2014.
(7) US$400.0 million 3.731% fixed rate notes (“EMTN Series 2”) were swapped to S$505.2 million at a fixed rate of 3.29% p.a. in March 2012. (8) ¥10.0 billion 1.309% fixed rate notes (“EMTN Series 4”) were swapped to approximately S$157.6 million at a fixed rate of 2.79% p.a. in October 2012. (9) ¥10.0 billion 1.039% fixed rate notes (“MTN Series 10”) were swapped to S$126.0 million at a fixed rate of 3.119% p.a. in November 2013. (10) ¥5.0 billion floating rate (at 3 months JPY LIBOR + 0.48% p.a.) notes (“MTN Series 12”) were swapped to S$62.0 million at a fixed rate of 3.148% p.a. in February 2014. (11) HK$1.15 billion 3.76% fixed rate notes (“EMTN Series 3”) were swapped to S$190.1 million at a fixed rate of 3.45% p.a. in June 2012. (12) HK$885.0 million 3.28% fixed rate notes (“EMTN Series 5”) were swapped to S$140.0 million at a fixed rate of 3.32% p.a. in November 2012.
Silver Oak: Silver Oak Ltd CMBS: Commercial mortgage backed securities Debts with secured assets
185.6 (6)
80.0 (4)
320.0 (5)
(8) (11)
(2)
(7)
(9) 126.0
100.0
(3)
(10) 150.0
300.0 (6)
(12)
1
100.0
100.0
Funding
partially
raised for
refinancing
300.0
9

Morgan Stanley Thirteenth Annual Asia Pacific Summit *November 2014*
Key Financial Indicators
(1) In line with the change in accounting policy, with effect from 1 January 2014, the key financial indicators, except for gearing
ratio (please see Note 2), are computed using consolidated results of CMT Group based on equity accounting method.
(2) In accordance to Property Funds Appendix, CMT’s proportionate share of its joint ventures borrowings and total deposited
property are included when computing the gearing ratio.
(3) Funds raised ahead of the maturity of the existing borrowings of CMT are excluded from both borrowings and total deposited
property for the purpose of computing the gearing ratio as the funds are set aside solely for the purpose of repaying the existing
borrowings of CMT.
(4) Net Debt comprises Gross Debt less temporary cash intended for refinancing and capital expenditure and EBITDA refers to
earnings before interest, tax, depreciation and amortisation.
(5) Ratio of net investment income at CMT Group before interest and tax over interest expense from 1 January 2014 to 30
September 2014.
(6) Ratio of interest expense over weighted average borrowings.
(7) Moody’s has assigned an “A2” issuer rating to CMT in March 2013.
As at 30 September 2014
As at 30 June 2014
Unencumbered Assets as % of Total Assets 100.0% 100.0%
Gearing Ratio (2,3) 34.1% 34.3%
Net Debt / EBITDA (4) 5.0x 5.0x
Interest Coverage (5) 4.6x 4.7x
Average Term to Maturity (years) 4.7 4.2
Average Cost of Debt (6) 3.6% 3.6%
CMT’s Issuer Rating (7) “A2”
10
(1)

Morgan Stanley Thirteenth Annual Asia Pacific Summit *November 2014*
CMT Portfolio
as at 30 June 2014
Valuation
as at 30 Jun 14
Valuation
as at 31 Dec 13
Variance Valuation as at
30 Jun 14
Valuation
Cap Rate
Valuation
Cap Rate
S$ million S$ million S$ million S$ per sq ft NLA as at 30 Jun 14 as at 31 Dec 13
Tampines Mall 889.0 852.0 37.0 2,698 5.35% 5.35%
Junction 8 654.0 636.0 18.0 2,591 5.35% 5.35%
Funan DigitaLife Mall 360.0 358.0 2.0 1,206 5.50% 5.50%
IMM Building 632.0 632.0 0.0 663
Retail: 6.50%
Office: 6.25%
Warehse: 7.50%
Retail: 6.50%
Office: 6.25%
Warehse: 7.50%
Plaza Singapura 1,221.0 1,168.0 53.0 2,532 5.00% 5.00%
Bugis Junction 928.0 901.0 27.0 2,503 5.35% 5.35%
JCube 330.0 360.0 (30.0) 1,663 5.60% 5.60%
Lot One Shoppers’ Mall 497.0 485.0 12.0 2,261 5.35% 5.35%
Bukit Panjang Plaza 280.0 274.0 6.0 1,837 5.45% 5.45%
The Atrium@Orchard 725.0 722.0 3.0 1,862 Retail: 5.25%
Office: 4.00%
Retail: 5.25%
Office: 4.00%
Clarke Quay 358.0 347.0 11.0 1,230 5.50% 5.50%
Bugis+ 335.0 330.0 5.0 1,562 5.70% 5.70%
Others(2) 219.0 211.0 8.0 1,014 5.55 – 5.60% 5.55 – 5.60%
Total CMT Portfolio excluding Raffles
City Singapore and Westgate 7,428.0 7,276.0 152.0 1,701 - -
Less additions during the period (19.1)
Net increase in valuations 132.9
Raffles City Singapore (40.0%) 1,231.2 1,207.2 24.0 N.M. Retail: 5.25%
Office: 4.25% Hotel: 5.25%
Retail: 5.25%
Office: 4.25%
Hotel: 5.55%
Westgate (30.0%) 319.2 316.2 3.0 2,595 5.35% 5.35%
Share of Joint Ventures’ investment
properties 1,550.4 1,523.4 27.0
Less additions during the period (7.4)
Net increase in valuations 19.6
(1) Reflects valuation of the property in its entirety.
(2) Comprising Sembawang Shopping Centre and Rivervale Mall.
(3) Not meaningful because Raffles City Singapore comprises retail units, office units, hotels and a convention centre.
(4) Valuation for Westgate is as at 2 May 2014.
N.M. – Not Meaningful
Valuations and Valuation Cap Rates
11
(1)
(1)
(4)
(3)
Morgan Stanley Thirteenth Annual Asia Pacific Summit *November 2014*
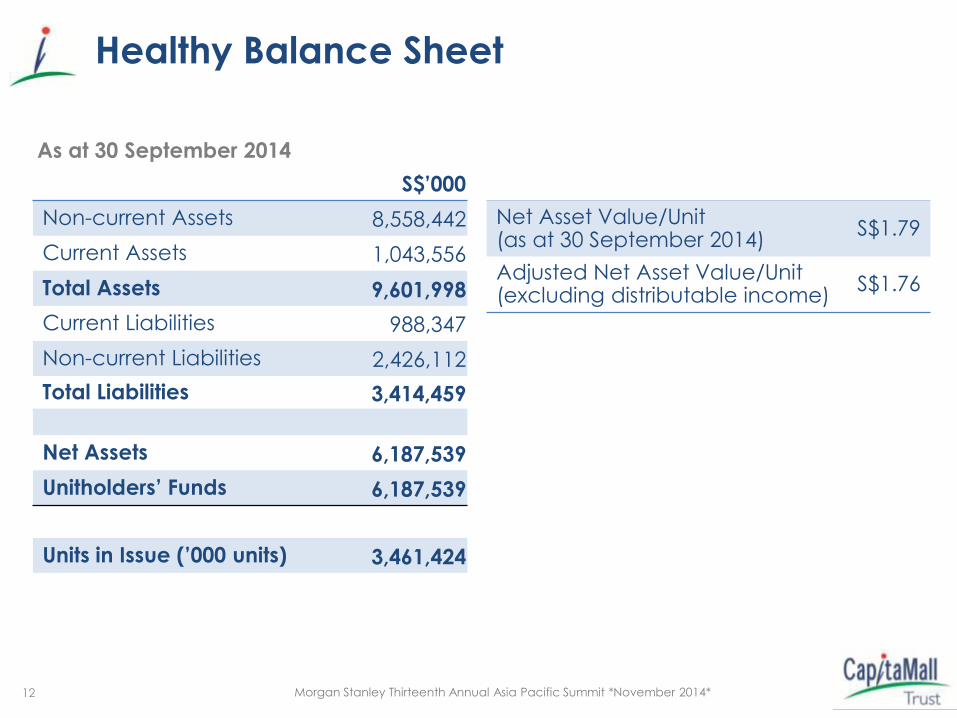
As at 30 September 2014
S$’000
Healthy Balance Sheet
Non-current Assets 8,558,442
Current Assets 1,043,556
Total Assets 9,601,998
Current Liabilities 988,347
Non-current Liabilities 2,426,112
Total Liabilities 3,414,459
Net Assets 6,187,539
Unitholders’ Funds 6,187,539
Units in Issue (’000 units) 3,461,424
Net Asset Value/Unit (as at 30 September 2014)
S$1.79
Adjusted Net Asset Value/Unit (excluding distributable income)
S$1.76
12

Morgan Stanley Thirteenth Annual Asia Pacific Summit *November 2014*
Portfolio Updates
Clarke Quay
Ra
y A
ng
, C
ap
ita
Lan
d “
Bu
ildin
g P
eo
ple
” P
ho
tog
rap
hy C
om
pe
titio
n 2
01
3

Morgan Stanley Thirteenth Annual Asia Pacific Summit *November 2014*
100,000
120,000
140,000
160,000
180,000
200,000
YTD Sep 2014 YTD Sep 2013
Sh
op
pe
r Tr
aff
ic (
‘00
0)
Source: CMTML
Shopper Traffic for YTD Sep 2014
(1) For comparable basis, the chart includes the entire CMT portfolio of malls, except Bugis Junction (which underwent Phase 1 AEI from April 2013 to October 2013 and Phase 2 AEI from March 2014 to September 2014) and Westgate (which commenced operations in December 2013).
14
YTD Sep 2014 Shopper Traffic(1) Decreased by 1.5% Y-o-Y

Morgan Stanley Thirteenth Annual Asia Pacific Summit *November 2014*
Portfolio Tenants’ Sales for YTD Sep 2014
Ten
an
ts’
Sa
les
($ p
sf/m
th)
Source: CMTML
15
(1) For comparable basis, the chart includes the entire CMT portfolio of malls, except Bugis Junction (which underwent Phase 1 AEI from April 2013 to October 2013 and Phase 2 AEI from March 2014 to September 2014) and Westgate (which commenced operations in December 2013).
YTD Sep 2014 Tenants’ Sales psf(1) Decreased by 3.0% Y-o-Y
40
50
60
70
80
90
YTD Sep 2014 YTD Sep 2013
Morgan Stanley Thirteenth Annual Asia Pacific Summit *November 2014*
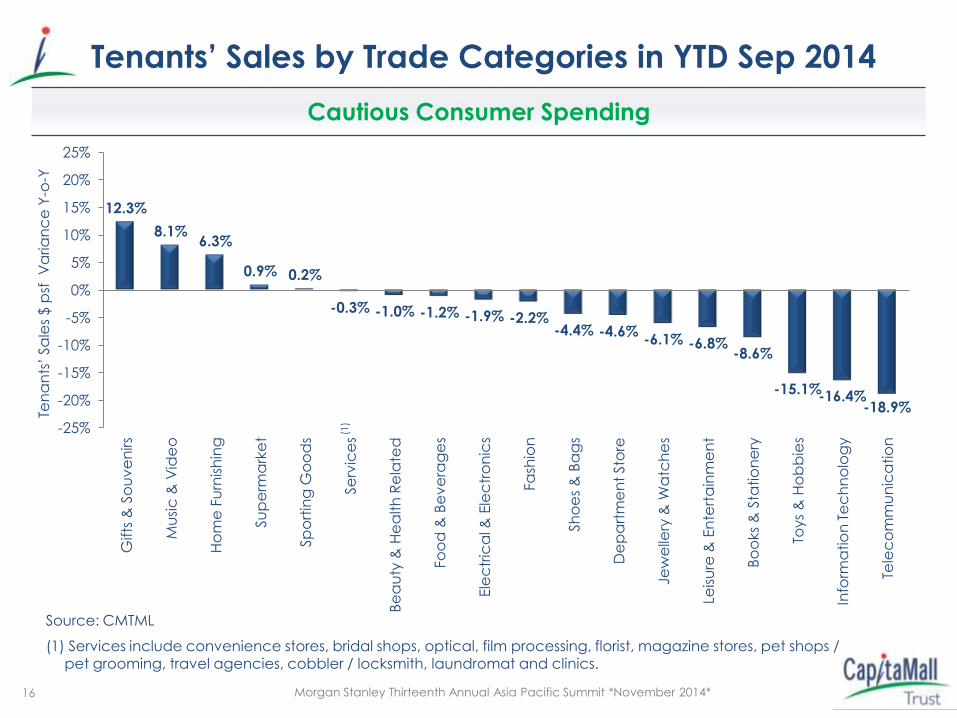
12.3%
8.1% 6.3%
0.9% 0.2%
-0.3% -1.0% -1.2% -1.9% -2.2% -4.4% -4.6%
-6.1% -6.8% -8.6%
-15.1% -16.4%
-18.9%
-25%
-20%
-15%
-10%
-5%
0%
5%
10%
15%
20%
25%
Gifts
& S
ou
ve
nirs
Mu
sic
& V
ide
o
Ho
me
Fu
rnis
hin
g
Su
pe
rma
rke
t
Sp
ort
ing
Go
od
s
Se
rvic
es
Be
au
ty &
He
alth
Re
late
d
Fo
od
& B
ev
era
ge
s
Ele
ctr
ica
l & E
lec
tro
nic
s
Fa
shio
n
Sh
oe
s &
Ba
gs
De
pa
rtm
en
t Sto
re
Jew
elle
ry &
Wa
tch
es
Leis
ure
& E
nte
rta
inm
en
t
Bo
oks
& S
tatio
ne
ry
Toys
& H
ob
bie
s
Info
rma
tio
n T
ec
hn
olo
gy
Tele
co
mm
un
ica
tio
n
Source: CMTML
(1) Services include convenience stores, bridal shops, optical, film processing, florist, magazine stores, pet shops / pet grooming, travel agencies, cobbler / locksmith, laundromat and clinics.
Tenants’ Sales by Trade Categories in YTD Sep 2014
(1)
Ten
an
ts’
Sa
les
$ p
sf V
aria
nc
e Y
-o-Y
16
Cautious Consumer Spending

Morgan Stanley Thirteenth Annual Asia Pacific Summit *November 2014*
From 1 January to 30 September 2014 (Excluding Newly Created and Reconfigured Units)
Property
No. of
Renewals /
New Leases
Retention
Rate
Net Lettable Area Increase in Current
Rental Rates vs
Preceding Rental
Rates
(typically committed
3 years ago)
Area (sq ft) Percentage
of Mall
Tampines Mall 44 77.3% 92,056 27.9% 6.3%
Junction 8 43 90.7% 80,048 31.7% 6.7%
Funan DigitaLife Mall 29 86.2% 37,182 12.5% 2.2%
IMM Building 10 50.0% 16,570 4.0% -2.8%
Plaza Singapura 49 77.6% 158,662 32.9% 7.0%
Bugis Junction 43 55.8% 58,922 15.0% 6.6%
JCube 14 78.6% 24,359 11.6% 23.2%
Raffles City Singapore 38 76.3% 157,929 37.5% 5.8%
Lot One Shoppers’ Mall 70 88.6% 79,232 36.0% 6.2%
Bukit Panjang Plaza 22 77.3% 9,466 6.2% 6.9%
The Atrium@Orchard 4 100.0% 1,378 1.0% 3.9%
Clarke Quay 17 88.2% 62,537 24.2% 7.6%
Bugis+ 2 100.0% 850 0.4% 11.9%
Other assets(2) 32 96.9% 25,884 12.0% 5.3%
CMT Portfolio 417 80.6% 805,075 20.1% 6.3%
Rental Reversions
17
(1) Includes renewal of a mini-anchor lease that was signed in 2005. (2) Include Sembawang Shopping Centre and Rivervale Mall.
(1)

Morgan Stanley Thirteenth Annual Asia Pacific Summit *November 2014*
(1) As at 30 September 2014 for YTD Sep 2014 and 31 December for years 2005 to 2013. For IMM Building and Raffles City Singapore, only retail units were included in the analysis.
(2) Based on the respective yearly financial results presentation slides available at the investor relations section of CMT’s website at http://www.capitamall.com
(3) Not applicable as there was no forecast for years 2009, 2011, 2012, 2013 and YTD Sep 2014.
Renewals Achieved Year-on-Year
18
CMT Portfolio (Year)(1)
No. of
Renewals /
New Leases
Net Lettable Area Increase in Current Rental Rates vs
Area
(sq ft)
% of Total
NLA
Forecast Rental
Rates (2)
Preceding Rental
Rates
(typically
committed
3 years ago)
YTD Sep 2014 417 805,075 20.1% N.A.(3) 6.3%
2013 629 942,737 24.4% N.A.(3) 6.3%
2012 446 623,388 16.9% N.A.(3) 6.0%
2011 503 686,143 18.4% N.A.(3) 6.4%
2010 571 898,713 25.4% 2.2% 6.5%
2009 614 971,191 29.8% N.A.(3) 2.3%
2008 421 612,379 19.0% 3.6% 9.6%
2007 385 806,163 25.6% 5.8% 13.5%
2006 312 511,045 16.0% 4.7% 8.3%
2005 189 401,263 23.2% 6.8% 12.6%

Morgan Stanley Thirteenth Annual Asia Pacific Summit *November 2014*
(1) Includes CMT’s 40.0% stake in Raffles City Singapore (office and retail leases, excluding hotel lease) and CMT’s 30.0% stake in Westgate.
(2) Based on committed gross rental income for the expiry month of the lease and excludes gross turnover rental.
(3) Of which 84 leases are retail leases.
Portfolio Lease Expiry Profile
as at 30 September 2014(1)
2014
2015
2016
2017
2018 & Beyond
Total
Number of Leases
106(3)
1,054
975
765
115
3,015
Gross Rental Income per Month(2)
S$’000 % of Total
1,784 2.9
17,272 28.1
16,445 26.7
17,039 27.7
9,018 14.6
61,558 100.0
19

Morgan Stanley Thirteenth Annual Asia Pacific Summit *November 2014*
2014 Portfolio Lease Expiry Profile by Property
(1) As a percentage of total net lettable area for each respective mall as at 30 September 2014. (2) As a percentage of total gross rental income for each respective mall and excludes gross turnover rent. (3) Include non-retail leases for IMM Building, Raffles City Singapore and The Atrium@Orchard.
(4) Include Sembawang Shopping Centre and Rivervale Mall. (5) Of which 84 leases are retail leases.
As at 30 September 2014
20
No. of
Leases
Net Lettable Area Gross Rental Income
Sq Ft ('000) % of Mall NLA(1) S$'000 % of Mall Income(2)
Tampines Mall 3 9.6 2.7% 102 1.8%
Junction 8 5 17.9 5.8% 235 5.6%
Funan DigitaLife Mall 2 2.8 1.0% 21 0.8%
IMM Building(3) 34 79.2 8.5% 529 8.9%
Plaza Singapura 4 3.5 0.7% 79 1.2%
Bugis Junction 9 9.6 2.4% 156 2.4%
JCube 13 5.8 3.0% 84 3.6%
Raffles City Singapore(3) 4 25.4 3.2% 117 2.6%
Lot One Shoppers’ Mall 10 8.1 3.7% 178 5.7%
Bukit Panjang Plaza 6 2.5 1.5% 60 3.0%
The Atrium@Orchard(3) 6 6.3 1.6% 62 1.4%
Clarke Quay 4 8.3 3.0% 103 3.6%
Bugis+ 2 2.1 1.0% 26 1.1%
Westgate 3 5.0 1.3% 25 0.4%
Other assets(4) 1 0.4 0.3% 7 0.7%
Portfolio 106(5) 186.5 3.3% 1,784 2.9%

Morgan Stanley Thirteenth Annual Asia Pacific Summit *November 2014*
High Occupancy Maintained
(3.6)
21
(1) Based on retail leases only.
(2) Other assets include:
a) Sembawang Shopping Centre, except for years 2007 and 2008 when it underwent an AEI;
b) Rivervale Mall;
c) Hougang Plaza, until it was sold in 2012;
d) JCube, except from 2008 to 2011 when it underwent an AEI. The asset was classified separately from 2012 onwards; and
e) Bugis+, which was acquired in 2011 and subsequently underwent an AEI from November 2011 to July 2012. The asset was classified separately from 2012 onwards.
(3) Lower occupancy rates were due to asset enhancement works.
(4) Includes retail and office leases.
Tampines Mall 100.0% 100.0% 100.0% 100.0% 100.0% 100.0% 100.0% 100.0% 100.0% 99.0%
Junction 8 100.0% 100.0% 100.0% 100.0% 100.0% 100.0% 100.0% 99.6% 99.4% 100.0%
Funan DigitaLife Mall 99.4% 99.6% 99.7% 99.8% 99.3% 100.0% 100.0% 100.0% 98.2% 98.6%
IMM Building(1) 99.0% 99.0% 99.9% 100.0% 99.7% 100.0% 100.0% 98.1% 99.0% 95.0%
Plaza Singapura 100.0% 100.0% 100.0% 99.8% 100.0% 100.0% 100.0% 91.3% 100.0% 99.9%
Bugis Junction 100.0% 100.0% 100.0% 100.0% 100.0% 100.0% 100.0% 100.0% 100.0% 99.8%
Other assets(2) 99.8% 100.0% 100.0% 100.0% 99.8% 99.8% 80.9% 100.0% 100.0% 100.0%
Raffles City Singapore(1) 99.3% 100.0% 100.0% 100.0% 99.6% 100.0% 100.0% 100.0% 99.7%
Lot One Shoppers' Mall 92.7% 99.3% 99.9% 99.6% 99.7% 99.8% 100.0% 99.9%
Bukit Panjang Plaza 99.9% 100.0% 99.8% 100.0% 100.0% 100.0% 99.8% 99.4%
The Atrium@Orchard(4) 98.0% 99.1% 93.5% 65.5% 95.3% 99.5% 99.7%
Clarke Quay 100.0% 100.0% 97.9% 100.0% 97.7%
JCube 99.6% 100.0% 92.1%
Bugis+ 99.5% 100.0% 100.0%
Westgate 85.8% 96.3%
CMT Portfolio 99.7% 99.5% 99.6% 99.7% 99.8% 99.3% 94.8% 98.2% 98.5% 98.5%
30 Sep
2014
31 Dec
2013As at
31 Dec
2005
31 Dec
2006
31 Dec
2007
31 Dec
2008
31 Dec
2009
31 Dec
2010
31 Dec
2011
31 Dec
2012
(3)
(3)
(3)
(3)
(3)

Morgan Stanley Thirteenth Annual Asia Pacific Summit *November 2014*
19.2% 17.3%
15.2% 16.1% 15.8%
Westfield
(Australia & NZ)
CFS Retail
Property Trust
(Australia)
Westfield
(US)
CMT (2012) CMT (2013) (1) (1)
(2)
(3,4) (3,5)
Source: Companies reports, CMTML
(1) As at 13 November 2013.
(2) As at 30 June 2013. (3) Occupancy cost is defined as a ratio of gross rental (inclusive of service charge, advertising & promotional charge
and gross turnover rent) to tenants’ sales. (4) Year 2012 include the entire CMT portfolio of malls, except JCube, Bugis+, The Atrium@Orchard, Westgate and
Hougang Plaza (sold in June 2012). (5) Year 2013 include the entire CMT portfolio of malls, except JCube, Bugis+, The Atrium@Orchard, Bugis Junction,
and Westgate.
Average Occupancy Cost
22
Healthy Occupancy Cost

Morgan Stanley Thirteenth Annual Asia Pacific Summit *November 2014*
Asset Enhancement Initiatives
IMM Building

Morgan Stanley Thirteenth Annual Asia Pacific Summit *November 2014*
On-going AEIs
Malls JCube IMM Building Tampines Mall Bukit Panjang Plaza
Estimated Capital
Expenditure
S$10 mil S$21 mil S$36 mil (1) S$18.5 mil (2)
Area of work Reconfiguration of
25,000 sq ft space on
L2 and part of B1
Phase 2
reconfiguration
works to house more
outlet stores and
enhance the outlet
shopping
experience
Converting L5 roof
area into new
leasable space,
reconfiguration of
retail units at L2/ L3,
rejuvenation works
(new facade,
covered walkway
from Tampines MRT
station)
Expansion of CSFS
space on L4, create
a new 2-storey F&B
block on L2,
relocation of roof
garden from L2 to
L4, rejuvenation
works (new facade,
replacement of
skylight and
upgrading of
escalators)
(1) Excludes capital expenditure of approximately S$29 mil for rejuvenation works.
(2) Excludes capital expenditure of approximately S$14 mil for rejuvenation works.
24

Morgan Stanley Thirteenth Annual Asia Pacific Summit *November 2014*
AEI - JCube
JCube
Da
vid
Ho
ng
, C
ap
ita
Lan
d “
Bu
ildin
g P
eo
ple
” P
ho
tog
rap
hy C
om
pe
titio
n 2
01
2

Morgan Stanley Thirteenth Annual Asia Pacific Summit *November 2014*
Update on JCube
26
Re-configuration of 25,000 sq ft space on Level 2
Reconfiguration of
Level 2 space

Morgan Stanley Thirteenth Annual Asia Pacific Summit *November 2014*
Update on JCube
27
Trendy Cluster of Shops at J.Avenue
• New ‘J.Avenue’ zone with street shopping ambience commenced
operations in September 2014
• All the 70 retail units are fully committed
Entrance of J.Avenue Retail units in J.Avenue
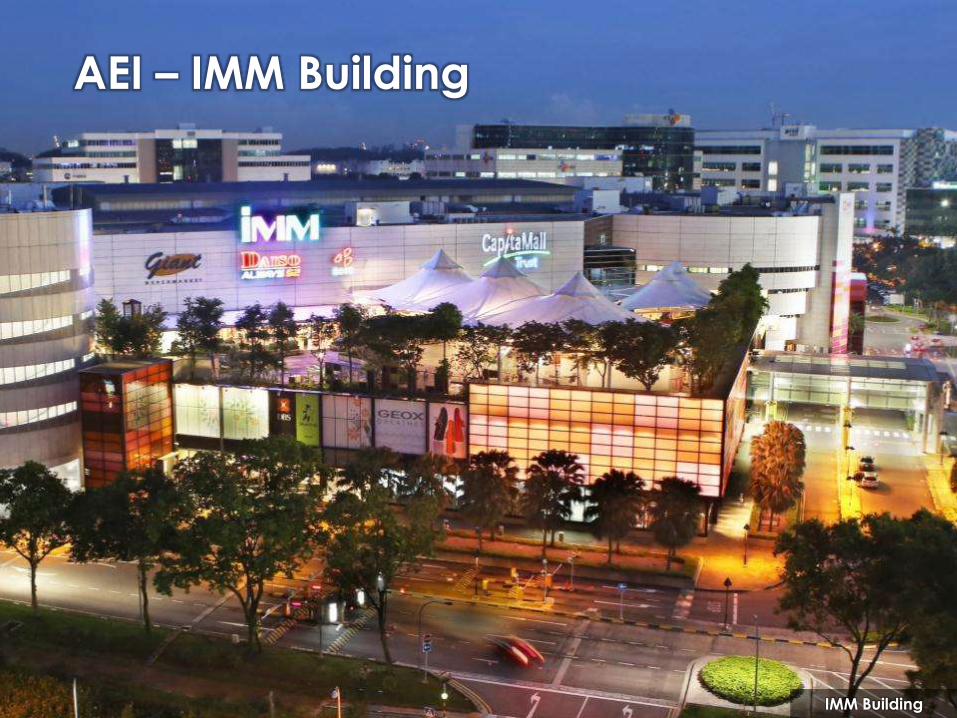
Morgan Stanley Thirteenth Annual Asia Pacific Summit *November 2014* IMM Building
AEI – IMM Building

Phase 1 AEI of IMM Building
Completed in June 2013
A value-focused mall with 56 outlet stores
Singapore’s largest outlet mall with more than
55 outlet stores
29

Morgan Stanley Thirteenth Annual Asia Pacific Summit *November 2014*
Proposed Phase 2 AEI at IMM Building
Reconfiguration works to house more outlet stores
2nd Storey Plan
30

Morgan Stanley Thirteenth Annual Asia Pacific Summit *November 2014*
Proposed Phase 2 AEI at IMM Building
Enhance the outlet shopping experience
New void to improve visibility
Setback shop fronts
2nd Storey Plan
31

Morgan Stanley Thirteenth Annual Asia Pacific Summit *November 2014*
AEI – Tampines Mall
Tampines Mall

Morgan Stanley Thirteenth Annual Asia Pacific Summit *November 2014*
Proposed Asset Enhancement Initiatives
The proposed AEI for Tampines Mall includes:
• Converting Level 5 roof area into new leasable space (~25,000 to 30,000 sq
ft of NLA) to house enrichment schools and educational tenants
• Reconfiguration of retail units at levels 2 & 3 to enhance the fashion
offering
• Rejuvenation works including a new facade and covered walkway from
Tampines MRT station
Reconfigured into
leasable space
Existing roof holds M&E
Equipment L5 BEFORE L5 AFTER
33

Morgan Stanley Thirteenth Annual Asia Pacific Summit *November 2014*
Tampines Mall: Proposed AEI Plans
(1) Artist’s impression.
Modern Facade (1)
Additional leasable space on Level 5 (1) Upgraded Covered Walkway from MRT station (1)
BEFORE AFTER
34

Morgan Stanley Thirteenth Annual Asia Pacific Summit *November 2014*
Value Creation
Estimated Capital Expenditure Target Start Date Target Completion Date
S$36.00 mil(1) 1Q 2014 4Q 2015
Projections(2) S$ million
Incremental Gross Revenue per annum 3.39
Incremental Net Property Income 2.88
Return On Investment 8.0%
Capital Value of AEI
(based on 5.5% capitalisation rate) 52.36
Increase in Value (net of investment cost) 16.36
(1) Excludes capital expenditure of S$29.22 mil for rejuvenation works. (2) Based on the Manager’s estimates on a stabilised basis, assuming 100.0% occupancy rate and
excluding rejuvenation works.
Projected Return on Investment of 8.0%
35

Morgan Stanley Thirteenth Annual Asia Pacific Summit *November 2014* Bukit Panjang Plaza
Rya
n M
ab
uh
ay,
Ca
pita
Lan
d “
Bu
ildin
g P
eo
ple
” P
ho
tog
rap
hy C
om
pe
titio
n 2
01
3
AEI – Bukit Panjang Plaza

Morgan Stanley Thirteenth Annual Asia Pacific Summit *November 2014*
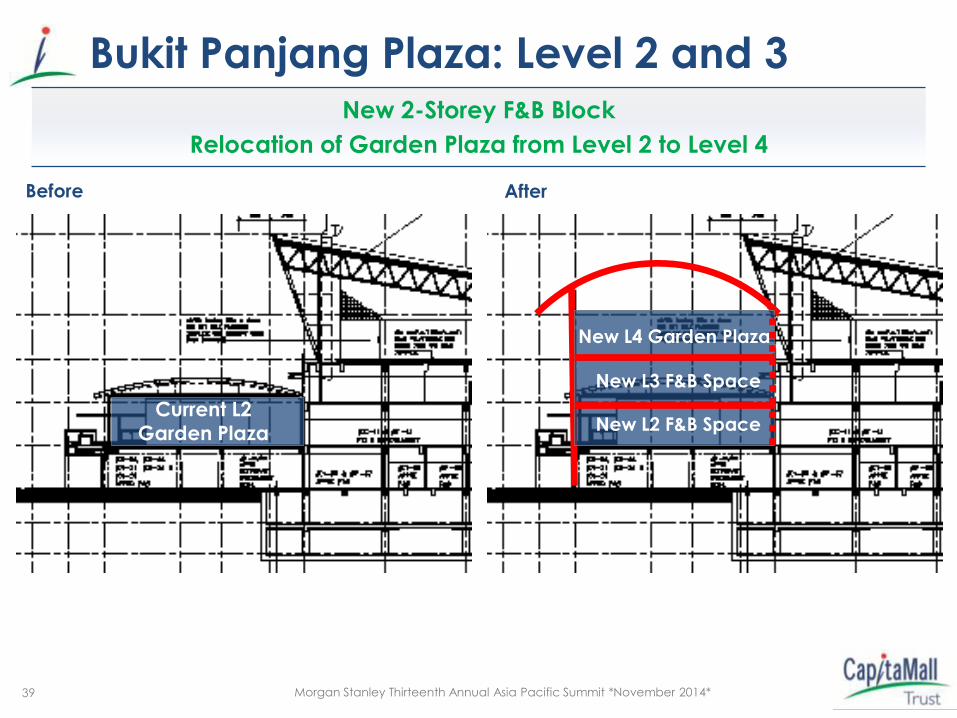
Proposed Asset Enhancement Initiative
37
The proposed AEI for Bukit Panjang Plaza includes:
• Expansion of Community/Sports Facility Scheme (“CSFS”) space
on Level 4 to free up approximately 18,000 sq ft of commercial
Gross Floor Area (“GFA”)
• Transfer of commercial GFA to create a new 2-storey Food and
Beverage (“F&B”) block on Level 2, where the existing roof garden
is located
• Relocation of roof garden from Level 2 to Level 4 next to the
expanded public library and a new childcare centre
• Rejuvenation works including a fresh facade, replacement of
skylight and upgrade of current single file escalators to dual file
escalators to improve traffic flow

Morgan Stanley Thirteenth Annual Asia Pacific Summit *November 2014*
Bukit Panjang Plaza: Level 4
38
Before
After
Current CSFS Space (NLB)
Current CSFS Space (NLB)
Expanded CSFS Space
Expansion of CSFS space to free
up commercial GFA
Expansion Of CSFS Space To Free Up Commercial GFA
Morgan Stanley Thirteenth Annual Asia Pacific Summit *November 2014*
Bukit Panjang Plaza: Level 2 and 3
39
Before After
New L3 F&B Space
New L2 F&B Space Current L2
Garden Plaza
New L4 Garden Plaza
New 2-Storey F&B Block
Relocation of Garden Plaza from Level 2 to Level 4

Morgan Stanley Thirteenth Annual Asia Pacific Summit *November 2014*
Before After Level 2
Level 3 Before
Convert existing roof
garden to F&B space
Current roof
garden
Current Air
Space New F&B
space
After
40
Transfer Commercial GFA From Level 4 To Level 2 And 3
Bukit Panjang Plaza: Level 2 and 3

Morgan Stanley Thirteenth Annual Asia Pacific Summit *November 2014*
Bukit Panjang Plaza: Level 2 and 3
41
(1) Artist’s impression.
Additional leasable space on Level 2(1) Walkway leading to Level 3 extension block(1)
Level 2 Level 3
New Extension Block With More F&B Offerings

Morgan Stanley Thirteenth Annual Asia Pacific Summit *November 2014*
Bukit Panjang Plaza: Facade Rejuvenation
42
Before After
Current Facade Updated Facade(1)
(1) Artist’s impression.
Morgan Stanley Thirteenth Annual Asia Pacific Summit *November 2014*
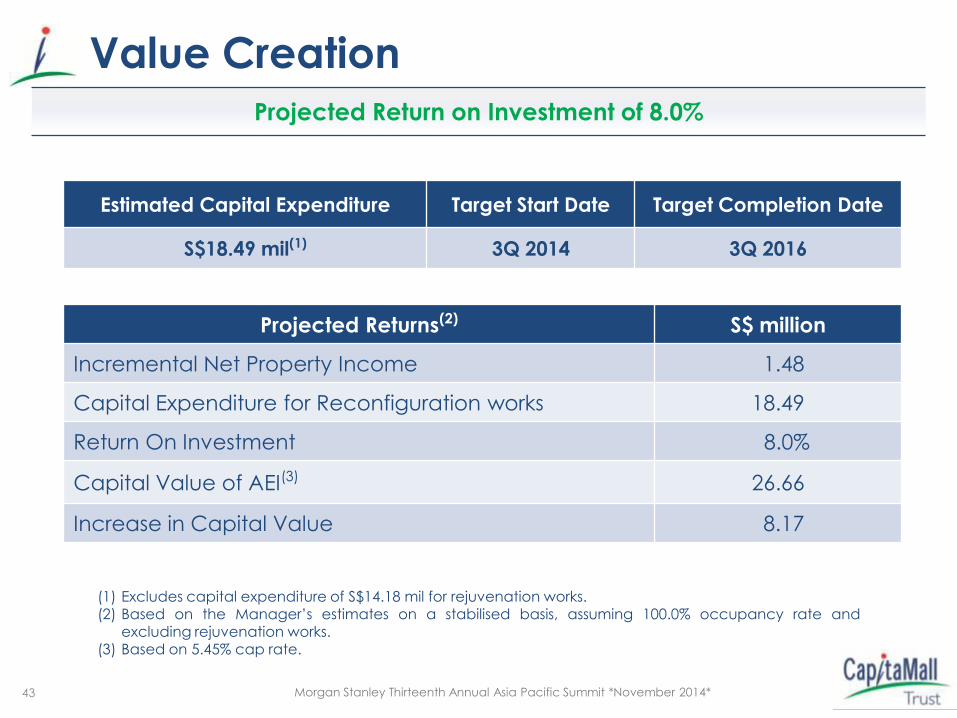
Value Creation
43
Estimated Capital Expenditure Target Start Date Target Completion Date
S$18.49 mil(1) 3Q 2014 3Q 2016
(1) Excludes capital expenditure of S$14.18 mil for rejuvenation works. (2) Based on the Manager’s estimates on a stabilised basis, assuming 100.0% occupancy rate and
excluding rejuvenation works. (3) Based on 5.45% cap rate.
Projected Returns(2) S$ million
Incremental Net Property Income 1.48
Capital Expenditure for Reconfiguration works 18.49
Return On Investment 8.0%
Capital Value of AEI(3) 26.66
Increase in Capital Value 8.17
Projected Return on Investment of 8.0%

Morgan Stanley Thirteenth Annual Asia Pacific Summit *November 2014*
To be updated
Bugis Junction
Completed AEI - Bugis Junction
On
g Y
i C
ha
o,
Ca
pita
Lan
d “
Bu
ildin
g P
eo
ple
” P
ho
tog
rap
hy C
om
pe
titio
n 2
01
2

Morgan Stanley Thirteenth Annual Asia Pacific Summit *November 2014*
• The AEI includes:
– Recovery of close to 70,000 sq ft of anchor space from BHG and conversion of recovered space to specialty shops
– Installation of new escalators in
recovered area for better access to levels 2 and 3
– Revision of lease lines at Basement 1 to improve line-of-sight
– Straightening of corridors at Levels 2 and
3 to improve visibility
Bugis Junction - AEI Completed in September 2014
Value Creation(1)
1 Capital Expenditure S$35.0 million
2 Incremental Gross Revenue p.a.
S$3.9 million
3 Incremental NPI p.a. S$3.1 million
4 Return on Investment 9.0%
5 Capital value of AEI (based on 5.5% capitalisation rate)
S$57.1 million
6 Increase in value (net of investment cost)
S$22.1 million
(1) Based on the Manager’s estimates on a stabilised basis and assuming 100.0% occupancy rate.
45

Morgan Stanley Thirteenth Annual Asia Pacific Summit *November 2014*
Acquisitions & Development
Westgate
Cre
dit t
o B
en
oy L
td

Morgan Stanley Thirteenth Annual Asia Pacific Summit *November 2014*
Acquisition & Development Track Record – From 3 to 16 Assets(1)
13 Acquisitions, 1 Divestment and 1 Greenfield Development Since IPO
3 Acquisitions were From Sponsor
(1) 16 assets, after divestment of Hougang Plaza in June 2012 and commencement of mall operations in Westgate on 2 December 2013.
(2) Acquisition of Class “E” bonds issued by CapitaRetail Singapore Limited ("CRS") which owned Lot One Shoppers’ Mall, Bukit Panjang Plaza (90 out of 91 strata lots) and Rivervale Mall.
(3) 92.4% stake purchase; 100% of the strata area was acquired in June 2006. (4) 14.8% stake as at 30 September 2014.
IPO
27.2% stake in CRS(2)
Hougang Plaza(3)
(40.0% stake)
(20.0% stake(4))
Remaining 72.8%
stake in CRS (2)
The Atrium@Orchard
2003 2005
2002 2004 2006
2007
2008
2010
2011
2012
Divestment Hougang Plaza
2013
(30.0% stake)
47
(1)

Morgan Stanley Thirteenth Annual Asia Pacific Summit *November 2014*
First Greenfield Development - Westgate
Opened on 2 December 2013
48
Tree House Zone
Premier Lifestyle & Family Mall
Thematic Outdoor Playgrounds
Gym & Pool
Magic Mushrooms Play Zone
48

Morgan Stanley Thirteenth Annual Asia Pacific Summit *November 2014*
Divestment of Westgate Tower
(1) Artist’s impression.
• A consortium entered into sales
and purchase agreements to
purchase Westgate Tower for
S$579.4 million (CMT’s 30.0% share
is S$173.8 million)
• Obtained Temporary Occupation
Permit (“TOP”) on 9 October 2014
Westgate Tower(1)
49

Morgan Stanley Thirteenth Annual Asia Pacific Summit *November 2014*
• Prime location
- ~2.5 times the size
of Tampines
Regional Centre
• Large catchment
- Caters to more
than 1 million
population in the
West region
• CMT’s Jurong retail
NLA at 1 million sq
ft, with more than
2,200 car park
spaces
Creating a “3-in-1” Mega Mall in Jurong
Bringing Value, Entertainment and Lifestyle Experiences
Young & Entertainment- Focused Mall
Family &
Lifestyle Mall
Value-Focused
Mall
3
2
1
50

Morgan Stanley Thirteenth Annual Asia Pacific Summit *November 2014*
Looking Forward
Jim
my C
ha
n,
Ca
pita
Lan
d “
Bu
ildin
g P
eo
ple
” P
ho
tog
rap
hy C
om
pe
titio
n 2
01
2
Bugis+

Morgan Stanley Thirteenth Annual Asia Pacific Summit *November 2014*
• Asset enhancement initiatives
– Tampines Mall/Bukit Panjang Plaza/JCube: AEIs in progress
– IMM Building: Focus on Phase 2 AEI to house more outlet stores
• Active lease management
– Focus on the remaining 84 retail leases due for renewal in 2014
• Explore new opportunities
– Opportunistic acquisition of properties
– Explore greenfield development projects
Looking Forward
52
Healthy Underlying Property Fundamentals
Thank you
For enquiries, please contact: Ms Audrey Tan, Investor Relations,
Direct: (65) 6713 1507 Email: [email protected]
CapitaMall Trust Management Limited (http://www.capitamall.com)
39 Robinson Road, #20-01 Robinson Point, Singapore 068911
Tel: (65) 6713 2888; Fax: (65) 6713 2999 P
hoto
Cre
dit: K
wek S
wee S
eng, S
ingapore
Photo
Cre
dit: K
wek S
wee S
eng, S
ingapore

Morgan Stanley Thirteenth Annual Asia Pacific Summit *November 2014*
Annexes
Ke
nn
y T
eo
Se
ng
Ch
ye
, C
ap
ita
Lan
d “
Bu
ildin
g P
eo
ple
” P
ho
tog
rap
hy C
om
pe
titio
n 2
01
2
Morgan Stanley Thirteenth Annual Asia Pacific Summit *November 2014*
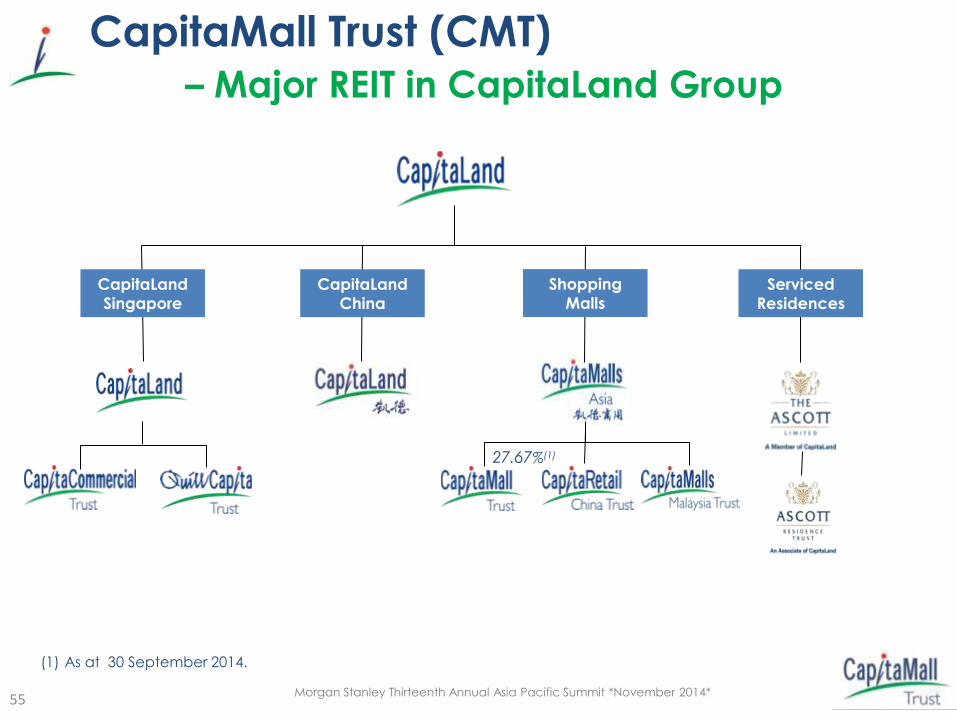
CapitaMall Trust (CMT)
– Major REIT in CapitaLand Group
CapitaLand
Singapore
Shopping Malls
Serviced Residences
Serviced
Residences
CapitaLand
China
CapitaLand
Singapore
Shopping
Malls
27.67%(1)
(1) As at 30 September 2014.
55

Morgan Stanley Thirteenth Annual Asia Pacific Summit *November 2014*
Singapore REIT Landscape CMT: Largest S-REIT by Market Capitalisation(1) and Asset Size;
‘A2’ Issuer Rating
56
(1) Size of bubble denotes market capitalisation and balance sheet data as at 5 November 2014. (2) As at 5 November 2014.
Source: Bloomberg and companies data
39 REITs and business trusts in Singapore(2)
LippoMall
SPH Starhill
Suntec
MCT
MGCCT
CCT KREIT
OUECT
AREIT
FCOT
MLT
MINT
Cache Ascendas India
ART
FEHT
SABANA
OUEHT
FIRT Parkway
CMT
0
2,000
4,000
6,000
8,000
10,000
12,000
0% 5% 10% 15% 20% 25% 30% 35% 40% 45% 50%
Total Assets
(S$ million)
Total Debt / Total Assets

Morgan Stanley Thirteenth Annual Asia Pacific Summit *November 2014*
CapitaMall Trust Market Leadership in Singapore Retail
(1) Above information as at 30 September 2014.
(2) Based on total NLA, including retail, office and warehouse.
S$6.6b Market
Capitalisation (1)
16 Properties in
Singapore
S$9.6b Asset Size
5.6m sq ft NLA (2)
11-year Track Record
Junction 8
IMM Building
Funan DigitaLife
Raffles City Singapore (40% stake)
Rivervale Mall
Bugis Junction Bukit Panjang Plaza Lot One Shoppers’ Mall
Clarke Quay Bugis+
Westgate (30% stake)
Plaza Singapura Sembawang SC Tampines Mall
JCube
57
The Atrium@Orchard

Morgan Stanley Thirteenth Annual Asia Pacific Summit *November 2014*
Strategically Located Portfolio - Close Proximity to Public Transport and Population Catchments
- Create and Offer Lifestyle Shopping Experiences
(1) Includes the Westgate (30.0% stake) which commenced mall operations on 2 December 2013.
~3,000 leases
~27 million mall visitors each month (1)
58

Morgan Stanley Thirteenth Annual Asia Pacific Summit *November 2014*
Acquired 13 Properties Since IPO
(1) Includes CMT’s share of the total deposited assets in RCS Trust (40.0%) and Infinity Trusts (30.0%). (2) Includes NLA for retail, office and warehouse components in CMT’s portfolio, excluding hotel component.
59
990.2 1,351.5
2,361.7
3,483.6
4,811.3
5,957.3
7,509.0 7,423.0
8,125.9
9,172.2
9,888.7 10,017.5
2002 2003 2004 2005 2006 2007 2008 2009 2010 2011 2012 2013
Total Deposited Assets(1) (S$ million)
NLA(2)
(mil sq ft) 0.8 1.7 2.2 2.9 4.0 4.6 3.7 4.5 4.9 5.1 5.2 5.6
Total Deposited Assets(1) Grew More Than 10 Times

Morgan Stanley Thirteenth Annual Asia Pacific Summit *November 2014*
Necessity
Shopping(2)
Discretionary
Shopping (3)
Necessity
Shopping (2)
Discretionary
Shopping(3)
By Gross
Revenue (For Year 2013)
More than 70.0% of Malls in Portfolio(1) Cater to Necessity Shopping
(1) Excludes CMT’s 30.0% interest in Westgate which commenced mall operations on 2 December 2013. (2) Includes Tampines Mall, Junction 8, IMM Building, Plaza Singapura, Bugis Junction, Sembawang Shopping
Centre, Lot One Shoppers’ Mall, Bukit Panjang Plaza, Rivervale Mall, JCube and The Atrium@Orchard.
(3) Includes Funan DigitaLife Mall, Clarke Quay, Bugis+ and CMT’s 40.0% interest in Raffles City Singapore.
By Asset Valuation
(As at 31
December 2013)
60
Defensive Portfolio

Morgan Stanley Thirteenth Annual Asia Pacific Summit *November 2014*
10.1%
7.6%
4.6%
10.3%
11.5%
10.0% 4.6%
12.4%
5.8%
3.5%
6.8%
5.1%
4.3%
0.2%
3.2%
Tampines Mall
Junction 8
Funan DigitaLife Mall
IMM Building
Plaza Singapura
Bugis Junction
JCube
40.0% Interest in Raffles City
Lot One Shoppers' Mall
Bukit Panjang Plaza
The Atrium@Orchard
Clarke Quay
Bugis+
30.0% Interest in Westgate
Other Assets
No Single Property Contributed over 12.4% by Gross Revenue and
17.0% by Net Lettable Area
Portfolio by FY2013 Total Gross Revenue
(1)
(1) Refers to the 30.0% interest in Westgate.
(2) Include Sembawang Shopping Centre and Rivervale Mall.
5.9% 4.5%
5.3%
17.0%
8.6%
7.0% 3.7%
14.3%
3.9%
2.7%
6.9%
5.2%
3.8%
7.3% 3.9%
Portfolio by Net Lettable Area as at 31 December 2013
(2)
Singapore
61
Diversified Portfolio

Morgan Stanley Thirteenth Annual Asia Pacific Summit *November 2014*
19.2%
9.0%
6.2%
3.6%
8.9% 10.4%
4.8% 2.2%
6.2%
7.9%
3.1% 0.9%
3.2% 2.9%
8.7%
2.5%
0.3%
27.7%
14.8%
9.7% 6.5%
6.1%
5.6%
4.9%
4.1%
3.5%
3.5% 2.9%
2.6% 2.6%
2.3%
1.2% 1.2%
0.8%
(1) Includes CMT’s 40.0% interest in Raffles City Singapore (retail and office leases, excluding hotel lease).
(2) Based on committed gross rental income and excludes gross turnover rental.
(3) Include tenants approved as thematic dining, entertainment and a performance centre in Bugis+.
(4) Others include Art Gallery and Luxury.
For the month of
December 2013
(3)
(4)
As at
31 December 2013
Portfolio(1) by Total Gross Rent(2)
Portfolio(1) by Net Lettable Area
62
Well Diversified Trade Mix

Morgan Stanley Thirteenth Annual Asia Pacific Summit *November 2014*
10 Largest Tenants(1) by Gross Rental Contribute 21.4% of Total Gross Rental
No Single Tenant Contributes More than 3.2% of Total Gross Rental
Gross Rental(1) by Tenant Top 10 Tenants Trade % of Gross
Rental
1 RC Hotels (Pte) Ltd Hotel 3.2%
2 Cold Storage Singapore (1983) Pte Ltd
Supermarket/ Beauty & Health / Services/ Warehouse
2.7%
3 Temasek Holdings (Private) Ltd
Office 2.5%
4 Wing Tai Clothing Pte Ltd
Fashion / Food & Beverage 2.4%
5 Robinson & Co. (Singapore) Pte Ltd
Department Store/ Beauty & Health
2.4%
6 NTUC Supermarket / Beauty & Health / Food Court /Services
1.9%
7 BHG (Singapore) Pte. Ltd
Department Store 1.9%
8 Jay Gee Enterprises (Pte.) Ltd
Fashion/ Beauty & Health / Sporting Goods & Apparel/ Shoes & Bags
1.7%
9 Auric Pacific Group Limited
Food & Beverage 1.6%
10 McDonald’s Restaurants Pte. Ltd.
Food & Beverage 1.1%
Total 21.4%
(1) Include CMT’s 40.0% interest in Raffles City Singapore and CMT’s 30.0% interest in Westgate; based on actual gross rental
income for the month of December 2013 and exclude gross turnover rental.
63
Diverse Tenant Base
Morgan Stanley Thirteenth Annual Asia Pacific Summit *November 2014*
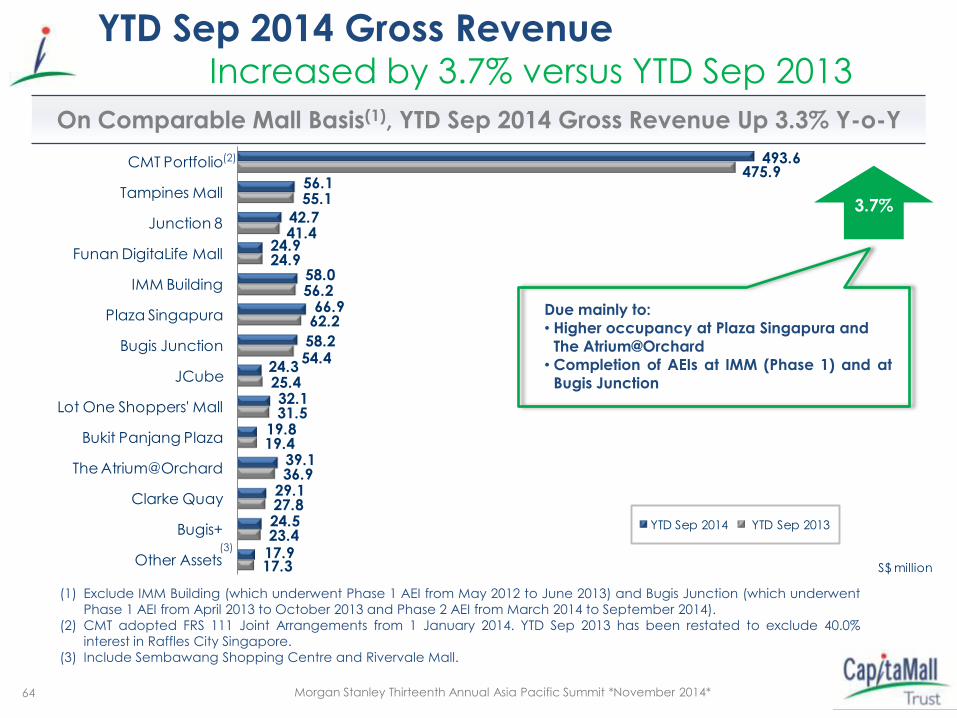
493.6
56.1
42.7
24.9
58.0
66.9
58.2
24.3
32.1
19.8
39.1
29.1
24.5
17.9
475.9
55.1
41.4
24.9
56.2
62.2
54.4
25.4
31.5
19.4
36.9
27.8
23.4
17.3
CMT Portfolio
Tampines Mall
Junction 8
Funan DigitaLife Mall
IMM Building
Plaza Singapura
Bugis Junction
JCube
Lot One Shoppers' Mall
Bukit Panjang Plaza
The Atrium@Orchard
Clarke Quay
Bugis+
Other AssetsS$ million
YTD Sep 2014 YTD Sep 2013
On Comparable Mall Basis(1), YTD Sep 2014 Gross Revenue Up 3.3% Y-o-Y
(1) Exclude IMM Building (which underwent Phase 1 AEI from May 2012 to June 2013) and Bugis Junction (which underwent
Phase 1 AEI from April 2013 to October 2013 and Phase 2 AEI from March 2014 to September 2014).
(2) CMT adopted FRS 111 Joint Arrangements from 1 January 2014. YTD Sep 2013 has been restated to exclude 40.0%
interest in Raffles City Singapore.
(3) Include Sembawang Shopping Centre and Rivervale Mall.
64
Due mainly to:
• Higher occupancy at Plaza Singapura and
The Atrium@Orchard
• Completion of AEIs at IMM (Phase 1) and at
Bugis Junction
(3)
3.7%
YTD Sep 2014 Gross Revenue Increased by 3.7% versus YTD Sep 2013
(2)

Morgan Stanley Thirteenth Annual Asia Pacific Summit *November 2014*
151.2
14.6
11.8
8.3
19.9
16.5
18.5
9.9
9.6
6.8
9.6
11.1
7.7
6.9
147.7
14.6
12.1
8.3
19.5
15.7
18.2
8.7
9.8
6.8
9.0
10.5
7.5
7.0
CMT Portfolio
Tampines Mall
Junction 8
Funan DigitaLife Mall
IMM Building
Plaza Singapura
Bugis Junction
JCube
Lot One Shoppers' Mall
Bukit Panjang Plaza
The Atrium@Orchard
Clarke Quay
Bugis+
Other AssetsS$ million
YTD Sep 2014 YTD Sep 2013
YTD Sep 2014 Operating Expenses
Increased by 2.4% versus YTD Sep 2013
2.4%
• Due mainly to higher maintenance and
marketing expenses • Offset by lower utilities expenses
65
(2)
(3)
(1) Exclude IMM Building (which underwent Phase 1 AEI from May 2012 to June 2013) and Bugis Junction (which underwent
Phase 1 AEI from April 2013 to October 2013 and Phase 2 AEI from March 2014 to September 2014).
(2) CMT adopted FRS 111 Joint Arrangements from 1 January 2014. YTD Sep 2013 has been restated to exclude 40.0%
interest in Raffles City Singapore and 30.0% interest in Westgate and Westgate Tower.
(3) Include Sembawang Shopping Centre and Rivervale Mall.
On Comparable Mall Basis(1), YTD Sep 2014 OPEX Up 2.5% Y-o-Y

Morgan Stanley Thirteenth Annual Asia Pacific Summit *November 2014*
342.4
41.5
30.9
16.6
38.1
50.4
39.7
14.4
22.5
13.0
29.5
18.0
16.8
11.0
328.2
40.5
29.3
16.6
36.7
46.5
36.2
16.7
21.7
12.6
27.9
17.3
15.9
10.3
CMT Portfolio
Tampines Mall
Junction 8
Funan DigitaLife Mall
IMM Building
Plaza Singapura
Bugis Junction
JCube
Lot One Shoppers' Mall
Bukit Panjang Plaza
The Atrium@Orchard
Clarke Quay
Bugis+
Other Assets
S$ million
YTD Sep 2014 YTD Sep 2013
On Comparable Mall Basis(1), YTD Sep 2014 NPI Up 3.6% Y-o-Y
YTD Sep 2014 Net Property Income
Increased by 4.3% versus YTD Sep 2013
66
(2)
(3)
4.3%
(1) Exclude IMM Building (which underwent Phase 1 AEI from May 2012 to June 2013) and Bugis Junction (which underwent
Phase 1 AEI from April 2013 to October 2013 and Phase 2 AEI from March 2014 to September 2014).
(2) CMT adopted FRS 111 Joint Arrangements from 1 January 2014. YTD Sep 2013 has been restated to exclude 40.0%
interest in Raffles City Singapore and 30.0% interest in Westgate and Westgate Tower.
(3) Include Sembawang Shopping Centre and Rivervale Mall.

Morgan Stanley Thirteenth Annual Asia Pacific Summit *November 2014*
Prudent Capital Management
67
Gearing (1,2) across different economic cycles
Financial flexibility with high percentage of unsecured borrowings (3)
35.2 34.5
42.8
30.2
35.9 38.4
36.7 35.3 34.1
0.0
10.0
20.0
30.0
40.0
50.0
2006 2007 2008 2009 2010 2011 2012 2013 3Q
2014
%
84.0%
16.0%
Unsecured
borrowings
Secured
borrowings
(1) In accordance to Property Funds Appendix, CMT’s proportionate share of its joint ventures borrowings and total deposited
property are included when computing the gearing ratio.
(2) Funds raised ahead of the maturity of the existing borrowings of CMT are excluded from both borrowings and total
deposited property for the purpose of computing the gearing ratio as the funds are set aside solely for the purpose of
repaying the existing borrowings of CMT.
(3) Includes CMT’s share of borrowings in RCS Trust (40.0%) and Infinity Trusts (30.0%).

Morgan Stanley Thirteenth Annual Asia Pacific Summit *November 2014*
74.6%
9.4%
5.0%
11.0%
Unsecured medium-term notes
Retail Bonds
Secured banking facilities in Infinity Trusts (CMT's 30% interest)
Secured CMBS and term loan at RCS Trust level from Silver Oak
(CMT's 40.0% interest)
Debt Mix
by Type (%)
Diversified Sources of Funding
99.7% fixed rate borrowings(1) as at 30 September 2014
68
99.7%
(1) Includes CMT’s share of borrowings in RCS Trust (40.0%) and Infinity Trusts (30.0%).
0%
20%
40%
60%
80%
100%
Fixed Rate
Borrowings
Floating Rate
Borrowings
0.3%

Morgan Stanley Thirteenth Annual Asia Pacific Summit *November 2014* 69
Management Fees
CMT has one of the lowest management fees as a % of AUM
CMT ------------------------------------------------------------------------

Morgan Stanley Thirteenth Annual Asia Pacific Summit *November 2014*
Retail Space at End-2013: 61.1 million sq ft, of which 44.7% is
estimated to be shopping centre floor space
Singapore Retail Floor Space Supply(1) (million sq ft)
70
Available Retail Floor Space
Morgan Stanley Thirteenth Annual Asia Pacific Summit *November 2014*
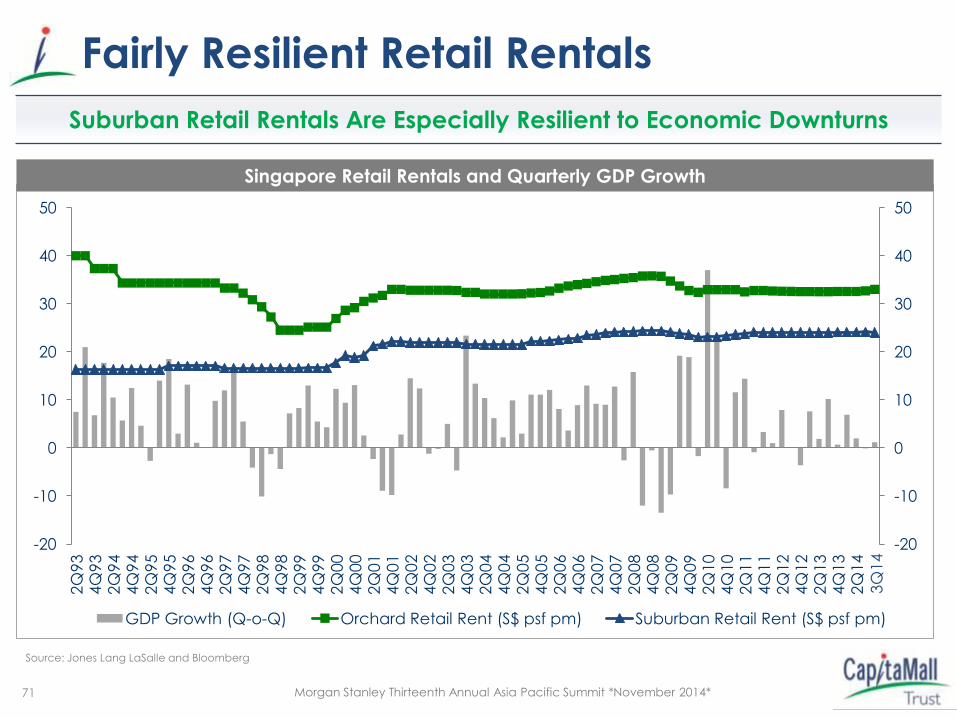
Suburban Retail Rentals Are Especially Resilient to Economic Downturns
Source: Jones Lang LaSalle and Bloomberg
Singapore Retail Rentals and Quarterly GDP Growth
71
Fairly Resilient Retail Rentals
-20
-10
0
10
20
30
40
50
-20
-10
0
10
20
30
40
50
2Q
93
4Q
93
2Q
94
4Q
94
2Q
95
4Q
95
2Q
96
4Q
96
2Q
97
4Q
97
2Q
98
4Q
98
2Q
99
4Q
99
2Q
00
4Q
00
2Q
01
4Q
01
2Q
02
4Q
02
2Q
03
4Q
03
2Q
04
4Q
04
2Q
05
4Q
05
2Q
06
4Q
06
2Q
07
4Q
07
2Q
08
4Q
08
2Q
09
4Q
09
2Q
10
4Q
10
2Q
11
4Q
11
2Q
12
4Q
12
2Q
13
4Q
13
2Q
14
GDP Growth (Q-o-Q) Orchard Retail Rent (S$ psf pm) Suburban Retail Rent (S$ psf pm)
3Q
14

Morgan Stanley Thirteenth Annual Asia Pacific Summit *November 2014*
Nominal Retail Sales Over 2001 – 2013 Grew by 3.8% per annum
Source: Department of Statistics Singapore, Urbis
(1) Excluding sales of motor vehicles, at current prices.
72
Resilient Retail Sales Growth

Morgan Stanley Thirteenth Annual Asia Pacific Summit *November 2014*
Singapore’s Population Estimated to Reach ~6.5 - 6.9 Million by 2030(1)
Singapore Population
'000 YoY change
Source: Singapore Department of Statistics
(1) Singapore Population White Paper, January 2013
73
Population Growth Drives Local Consumption

Morgan Stanley Thirteenth Annual Asia Pacific Summit *November 2014*
Singapore Has One of the Lowest Unemployment Rates Internationally
Source: Bloomberg
74
Low Unemployment Rate
Morgan Stanley Thirteenth Annual Asia Pacific Summit *November 2014*
-100
100
300
500
700
900
1,100
1,300
1,500
1,700
2007 2008 2009 2010 2011 2012 2013
Shares & Securities Insurance Funds CPF Balances
Cash & Deposits Property Total Liabilities
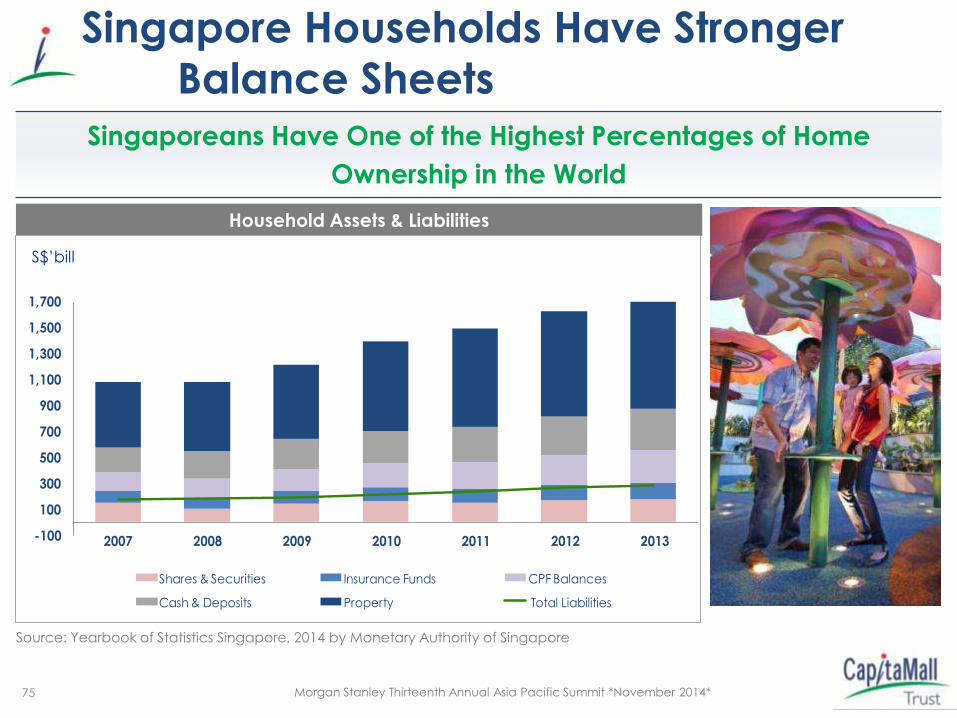
Singaporeans Have One of the Highest Percentages of Home
Ownership in the World
Source: Yearbook of Statistics Singapore, 2014 by Monetary Authority of Singapore
S$’bill
Household Assets & Liabilities
75
Singapore Households Have Stronger
Balance Sheets

Morgan Stanley Thirteenth Annual Asia Pacific Summit *November 2014*
2013 Visitor Arrivals Grew 6.7% y-o-y to 15.5 million
Source: Singapore Tourism Board (STB), DBS Bank
Singapore Tourist Arrivals
-30%
-20%
-10%
0%
10%
20%
30%
40%
0
2
4
6
8
10
12
14
16
18
20
02
20
03
20
04
20
05
20
06
20
07
20
08
20
09
20
10
20
11
20
12
20
13
20
14
20
15
YoY Growth million
Tourist Arrivals Forecast YoY Growth
17.0
Global
Financial
Crisis SARS
New Tourist Attractions
Marine Life Park
Giant Panda Forest - River Safari
Gardens by the Bay
14.5 15.6
16.3
- 16.8
76
STB Targets 17.0 Million Tourists by 2015