capstone milestones benchmark written … · written communication value rubric 4 3 2 1 ... many...
TRANSCRIPT

Capstone Milestones Benchmark Written Communication Value Rubric 4 3 2 1 Total # students evaluatedContext of and Purpose for Writing 13 35 20 18 86 Content Development 12 19 10 7 48 Genre and Disciplinary Conventions 13 33 21 18 85 Sources and Evidence 12 35 21 18 86 Control of Syntax and Mechanics 15 32 22 17 86
Note: There is one instructor evaluating the students based on her grade criteria mapping to the rubric. She did not evaluate
Identify the source(s) of evidence used todetermine the scores of your students noted above:
Consider the following questions and provide feedback: How are these 6 constructsaddressed in my course? Are all addressed? Ifnot why? What (if anything) is missing fromthis rubric that is valued at SAU forQuantitative Literacy development? Otherinsight gained from using this rubric tobaseline student progress towards general education Outcome 1?
Final course grades, slightly readjusted to no longer factor in attendance and late assignments and insteadsolely reflect skill and ability. 4=A level, 3=B level, 2=C level, 1=D/F level
Argumentative research paper (intended to demonstrate culmination of skills learned throughout thesemester); holistic assessment of other writing completed throughout the semester (narrative essay,rhetorical analysis, persuasive essay, various 1-‐2 page writing assignments based on course material-‐-‐typically requiring both reflection and critical analysis of reading material)
used the final grades for my course, which comprise the grades of 4 projects (See Fahey Rubrics); thegrades of 2 documentation quizzes; 1 punctuation quiz; and 1 research exercise. Final grades are reflective ofmy Course Outcomes (See Fahey Syllabus), which are based on the standard for outcomes in my field. (Astandard source in the field of Rhetoric and Writing for developing program and course outcomes for first-‐year writing and beyond is the WPA Outcomes Statement for First-‐Year Compositionhttp://wpacouncil.org/positions/outcomes.html). I have not assessed students based on Content Development, as it does not make sense to me in the context of the course; the development of writers andwriting itself IS the content of the course. The glossary does not clear up these categories for me as the first two (Content Development and Audience and Purpose) seem redundant. I did not include students who didnot pass ENGL.101 with the required C. Students earning a C in my sections meet Benchmark 1 in allcategories. Students earning a B in my sections meet Milestone 2. Students earning an A meet Milestone 3;however, my students meeting Milestone 3 are showing proficiency in a particular writing task and genre,not in disciplinary writing. Disciplinary proficiency would only be attained in courses devoted to disciplinespecific writing. (Some, not all, WI courses would address this.). Of 43 final grades submitted, 5 students didnot pass; 15 received a grade in the A range; 11 in the B range, and 12 in the C range.
Each of the 5 constructs are addressed and assessed through the various paper assignments: Narrative,Reflection, Critical Reading Response, Ethnographic Research Essay & Portfolio, and Multi-‐Genre in-‐classEssay Exam. The only thing I question is the phrase "mastery of the subject" under the "Content Development" construct. In English 101, I don't necessarily think it's the case that the goal of writing is toillustrate "mastery" of a particular subject (perhaps this is how writing is used outside the discipline, in WACcourses for instance), but the goal instead would be mastery of a particular type of writing style withdemonstration of critical thought and understanding.
Time spent in class on #1-‐4; do not typically use class time to cover grammar and sentence-‐level revision(offer help outside of class in order to address needs of individual students). In past semesters, havedevoted time to substantial review of student work in workshops conducted as class; this semester, I choseto concentrate mainly on discussion and examination of reading material for modeling, but will return to theworkshop approach-‐-‐ it has been more effective in encouraging revision so students show more significant improvment in the above 5 constructs.
One staple of the introductory course in the field (and understood in the department) is the development ofsuccessful writing habits using what is known as the Process model of composing, of which peer feedback isintegral. This construct is not addressed in the rubric. In my syllabus, I phrase this outcome in twostatements: 1. Follow a process for writing an effective essay (and possibly multimedia compositions), applyinvention strategies, revise drafts, and incorporate peer feedback and 2. Analyze and comment on work-‐in-‐progress, recognizing elements of strength and areas for improvement in drafts. Additionally, the fieldregards composing and editing work electronically, and distributing and possibly publishing work digitally, anintegral part of composing in the 21st century. Such beliefs are stated in the WPA Outcomes Statement andin various position statements on the NCTE/CCC website: http://www.ncte.org/cccc/resources/positions.While many writing instructors here are underprepared for such developments, such measures becomecritical with our distance and hybrid writing course offerings. This construct is additionally not represented inthe rubric.

QUANTITATIVE LITERACY VALUE RUBRIC The VALUE rubrics were developed by teams of faculty experts representing colleges and universities across the United States through a process that examined many existing campus rubrics and related documents for each learning outcome
and incorporated additional feedback from faculty. The rubrics are intended for institutional-‐level use in evaluating and discussing student learning, not for grading. The core expectations articulated in all 15 of the VALUE rubrics can and should betranslated into the language of individual campuses, disciplines, and even courses. The utility of the VALUE rubrics is to position learning at all undergraduate levels within a basic framework of expectations such that evidence of learning can beshared nationally through a common dialog and understanding of student success.
Definition Quantitative Literacy (QL) – also known as Numeracy or Quantitative Reasoning (QR) – is a “habit of mind,” competency, and comfort in working with numerical data. Individuals with strong QL skills possess the ability to reason and solve
quantitative problems from a wide array of authentic contexts and everyday life situations. They understand and can create sophisticated arguments supported by quantitative evidence and they can clearly communicate those arguments in avariety of formats (using words, tables, graphs, mathematical equations, etc., as appropriate).
Quantitative Literacy Across the Disciplines Current trends in general education reform demonstrate that faculty are recognizing the steadily growing importance of Quantitative Literacy (QL) in an increasingly quantitative and data-‐dense world. AAC&U’s recent survey showed that
concerns about QL skills are shared by employers, who recognize that many of today’s students will need a wide range of high level quantitative skills to complete their work responsibilities. Virtually all of today’s students, regardless of careerchoice, will need basic QL skills such as the ability to draw information from charts, graphs, and geometric figures, and the ability to accurately complete straightforward estimations and calculations.
Preliminary efforts to find student work products which demonstrate QL skills proved a challenge in this rubric creation process. It’s possible to find pages of mathematical problems, but what those problem sets don’t demonstrate is whetherthe student was able to think about and understand the meaning of her work. It’s possible to find research papers that include quantitative information, but those papers often don’t provide evidence that allows the evaluator to see how much ofthe thinking was done by the original source (often carefully cited in the paper) and how much was done by student herself, or whether conclusions drawn from analysis of the source material are even accurate.
Given widespread agreement about the importance of QL, it becomes incumbent on faculty to develop new kinds of assignments which give students substantive, contextualized experience in using such skills as analyzing quantitativeinformation, representing quantitative information in appropriate forms, completing calculations to answer meaningful questions, making judgments based on quantitative data and communicating the results of that work for various purposes andaudiences. As students gain experience with those skills, faculty must develop assignments that require students to create work products which reveal their thought processes and demonstrate the range of their QL skills.
This rubric provides for faculty a definition for QL and a rubric describing four levels of QL achievement which might be observed in work products within work samples or collections of work. Members of AAC&U’s rubric development team forQL hope that these materials will aid in the assessment of QL – but, equally important, we hope that they will help institutions and individuals in the effort to more thoroughly embed QL across the curriculum of colleges and universities.
Framing Language This rubric has been designed for the evaluation of work that addresses quantitative literacy (QL) in a substantive way. QL is not just computation, not just the citing of someone else’s data. QL is a habit of mind, a way of thinking about the
world that relies on data and on the mathematical analysis of data to make connections and draw conclusions. Teaching QL requires us to design assignments that address authentic, data-‐based problems. Such assignments may call for thetraditional written paper, but we can imagine other alternatives: a video of PowerPoint presentation, perhaps, or a well designed series of web pages. In any case, a successful demonstration of QL will place the mathematical work in the context ofa full and robust discussion of the underlying issues addressed by the assignment.
Finally, QL skills can be applied to a wide array of problems of varying difficulty, confounding the use of this rubric. For example, the same student might demonstrate high levels of QL achievement when working on a simplistic problem and lowlevels of QL achievement when working on a very complex problem. Thus, to accurately assess a student’s QL achievement it may be necessary to measure QL achievement within the context of problem complexity, much as is done in divingcompetitions where two scores are given, one for the difficulty of the dive, and the other for the skill in accomplishing the dive. In this context, that would mean giving one score for the complexity of the problem and another score for the QLachievement in solving the problem.
BENCHMARKING SAU GENERAL EDUCATION OUTCOMES Outcome 1: Develop fundamental skills and knowledge necessary to flourish in a rapidly changing world. (Fundamental skills and Knowledge)
Instructor: All instructors in Spring 2014 Course Number: MATH 171, QUANT 131, STAT 213, STBE 137 Section: (all)
QUANTITATIVE LITERACY VALUE RUBRIC Complete this rubric by recording the number of students who completed the identified course with their corresponding levels (1-‐4) for each constructed noted.
Definition Quantitative Literacy (QL) – also known as Numeracy or Quantitative Reasoning (QR) – is a “habit of mind,” competency, and comfort in working with numerical data. Individuals with strong QL skills possess the ability to reason and solve
quantitative problems from a wide array of authentic contexts and everyday life situations. They understand and can create sophisticated arguments supported by quantitative evidence and they can clearly communicate those arguments in avariety of formats (using words, tables, graphs, mathematical equations, etc., as appropriate).
Evaluators are encouraged to assign a zero to any work sample or collection of work that does not meet benchmark (cell one) level performance.
Capstone Milestones Benchmark 4 # of students 3 # of students 2 # of students 1 # of students

Interpretation Ability to explain informationpresented in mathematical forms(e.g., equations, graphs, diagrams,tables, words)
Provides accurate explanations ofinformation presented inmathematical forms. Makesappropriate inferences based onthat information. For example,accurately explains the trend datashown in a graph and makesreasonable predictions regardingwhat the data suggest about future events.
49 (25%)
Provides accurate explanationsof information presented inmathematical forms. Forinstance, accurately explains thetrend data shown in a graph.
42 (22%)
Provides somewhat accurateexplanations of informationpresented in mathematical forms,but occasionally makes minorerrors related to computations orunits. For instance, accuratelyexplains the trend data shown in agraph, but may miscalculate theslope of the trend line.
64 (33%)
Attempts to explain informationpresented in mathematical forms,but draws incorrect conclusionsabout what the information means.For example, attempts to explainthe trend data shown in a graph,but will frequently misinterpret thenature of that trend, perhaps byconfusing positive and negativetrends.
38 (20%)
Representation Ability to convert relevant information into variousmathematical forms (e.g.,equations, graphs, diagrams,tables, words)
Skillfully converts relevant information into an insightfulmathematical portrayal in a waythat contributes to a further ordeeper understanding.
62 (32%)
Competently converts relevant information into an appropriateand desired mathematicalportrayal.
41 (21%)
Completes conversion ofinformation but resultingmathematical portrayal is onlypartially appropriate or accurate.
56 (29%)
Completes conversion ofinformation but resultingmathematical portrayal isinappropriate or inaccurate.
35 (18%)
Calculation
Calculations attempted areessentially all successful andsufficiently comprehensive to solvethe problem. Calculations are alsopresented elegantly (clearly,concisely, etc.)
61 (32%)
Calculations attempted areessentially all successful andsufficiently comprehensive tosolve the problem.
57 (30%)
Calculations attempted are eitherunsuccessful or represent only aportion of the calculations requiredto comprehensively solve theproblem.
51 (27%) Calculations are attempted but areboth unsuccessful and are not comprehensive.
19 (10%)
Application/Analysis Ability tomake judgments and drawappropriate conclusions based onthe quantitative analysis of data,while recognizing the limits of thisanalysis
Uses the quantitative analysis ofdata as the basis for deep andthoughtful judgments, drawinginsightful, carefully qualifiedconclusions from this work.
33 (19%)
Uses the quantitative analysis ofdata as the basis for competent judgments, drawing reasonableand appropriately qualifiedconclusions from this work.
37 (22%)
Uses the quantitative analysis ofdata as the basis for workmanlike(without inspiration or nuance,ordinary) judgments, drawingplausible conclusions from thiswork.
45 (26%)
Uses the quantitative analysis ofdata as the basis for tentative, basicjudgments, although is hesitant oruncertain about drawingconclusions from this work.
57 (33%)
Assumptions Ability to make and evaluateimportant assumptions inestimation, modeling, and dataanalysis
Explicitly describes assumptionsand provides compelling rationalefor why each assumption isappropriate. Shows awareness that confidence in final conclusions islimited by the accuracy of theassumptions.
31 (18%)
Explicitly describes assumptionsand provides compellingrationale for why assumptionsare appropriate.
37 (22%) Explicitly describes assumptions. 30 (17%) Attempts to describe assumptions. 74 (43%)
Communication Expressing quantitative evidence insupport of the argument or purposeof the work (in terms of what evidence is used and how it isformatted, presented, andcontextualized)
Uses quantitative information inconnection with the argument orpurpose of the work, presents it inan effective format, and explicatesit with consistently high quality.
34 (22%)
Uses quantitative information inconnection with the argument orpurpose of the work, thoughdata may be presented in a lessthan completely effective format or some parts of the explicationmay be uneven.
32 (21%)
Uses quantitative information, but does not effectively connect it tothe argument or purpose of thework.
40 (26%)
Presents an argument for whichquantitative evidence is pertinent,but does not provide adequateexplicit numerical support. (Mayuse quasi-‐quantitative words suchas “many,” “few,” “increasing,”“small,” and the like in place ofactual quantities.)
46 (30%)
Identify the source(s) of evidence used to determine the scores of your students noted above: Four unit tests and a final exam, all of which examine the students' abilities of critical thinking and analysis using elementary functions. Observation of student responses during class discussion. Note: I included all students who stayed in the course long enough for me to get a somewhat reliable measure of their achievement in each area. This includes 12 students who, ultimately, dropped or withdrew from the class. The evidence I usedincluded 4 unit exams (primarily measuring interpretation, calculation, analysis); 8 key assignments (primarily measuring representation, application, assumptions, and communication); and in-‐class participation. In class discussions, electronic discussions that include "Critical Thinking" topics, textbook homework assignements, projects, case project presentation, and case project report. There were 21 students enrolled in the course. Throughout the semester five written projects were assigned involving various types of analysis: descriptive, parametric tests of significance; crosstabulation and Chi Square, correlation (includingPearson's r and Spearman's rho), and one multivariate regression assignment. Students used real data, conceptualized their project, used SPSS to obtain the findings, interpreted them and wrote them up in a more or less formal report. Exams, In-‐class exercises, Practice Exams, Presentation, Assignments, and Participation "1. Questioning during class on assigned problems and solutions 2. Paper and pencil exams 3. Individual computer projects" The data provided above is based on the grades of weekly quizzes (totally 10 throughout semester), two midterm tests, and the final test. I gave an exam, using questions from an externally-‐normed CAOS exam, covering basic statistical conceptsand calculations. I also had students present a brief data analysis.

Consider the following questions and provide feedback: How are these 6 constructs addressed in my course? Are all addressed? If not, why? What (if anything) is missing from this rubric that is valued at SAU for Quantitative Literacy development?Other insight gained from using this rubric to baseline student progress towards general education Outcome 1?
The primary focus of this course is critical thinking and analysis using elementary functions. Students are expected to represent data using tables, graphs, and equations. All 6 constructs are addressed but not equally. My course focuses primarily on representation, interpretation, application, and calculation. While communication and assumptions are addressed, they aren't assessed heavily (at least formally) in mycourse. Although it's not directly related to quantitative literacy, I'd like to see a measure of perseverance. Many of the students who scored poorly in each area did so because they didn't put any effort into solving problems – they gave up whenthe problem wasn't something they could solve instantly. The rubric clearly shows that my students weren't able to evaluate assumptions or make appropriate conclusions. The vast majority of students made overly strong conclusions from theircalculations; they didn't recognize any limits of their analyses. The communication scores are low, in part, because I didn't give students much of an opportunity to demonstrate achievement equal to scores of 3 or 4. They are all a component in my course. The use of modern, and common technology seems to be missing from these rubrics, but this is fine. This course does not have students performing any direct calculations -‐-‐ rather all results are computed using statistical software. In this light the following numbers would apply: 4 = 9; 3 = 6; 2 = 3; 1 =3. While this course is an excellent supplement for an actual mathematics class, I don't believe that it would replace it as a general education requirement.
"1. Addressed? Through lecture, lab and discussion 2. Capstone is a stretch in stbe137. These are freshmen, so capstone is “IFy” 3. Nothing is missing 4. All elements are, at least, touched upon. " Of course, it might not be appropriate to conclude the above numeric data is "true." We do not know the future progress for students. However, according to my data (expressed at the very above), it seems the most accurate data I can get for2014 Spring semester.

N= 6 instructors IDENTIFY THE DEGREE TO WHICH STUDENTS ACHIEVED THE FOLLOWING OBJECTIVES Excellent Good Satisfactory Poor Audience-‐focused delivery suggesting speaker confidence 17% 25% 37 20% Supporting materials enhancing clarity of the information 12% 23% 39% 18% Organizational sequencing unifying contents of the information 23% 24% 36% 14% Visual design reinforcing contents of the information 21% 27% 40% 10% Language choices enriching the contents of the information 12% 25% 44% 19%
OPEN-‐ENDED COMMENTS: STRENGTHS & WEAKNESSES As part of the survey, respondents were asked to identify students’ strengths and weaknesses. Based on recurring themes, the following points were identified: Strengths: Crafting a well-‐designed introduction and conclusion
Sequencing information in a coherent pattern Weaknesses: Lacking academic sources to support information
Utilizing language choices to enhance contents
Unsatisfactory 1% 8% 3% 2%
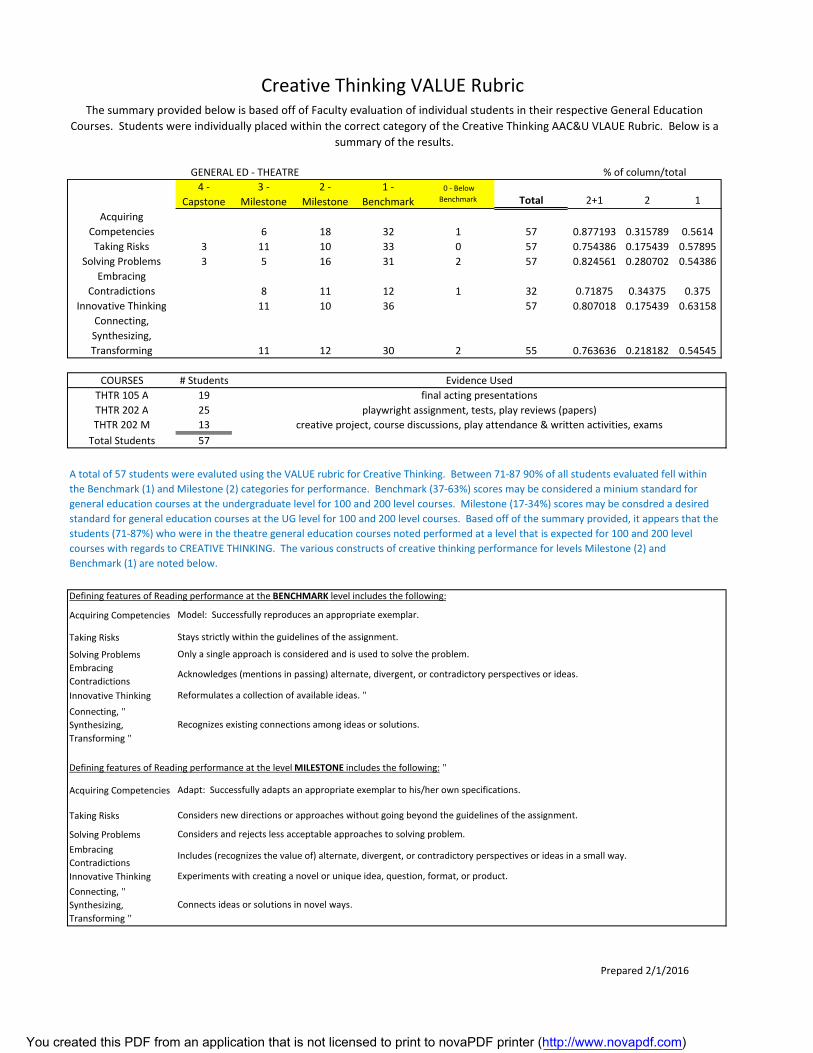
Creative Thinking VALUE Rubric The summary provided below is based off of Faculty evaluation of individual students in their respective General Education
Courses. Students were individually placed within the correct category of the Creative Thinking AAC&U VLAUE Rubric. Below is a summary of the results.
GENERAL ED - THEATRE % of column/total 4 - 3 - 2 - 1 - 0 - Below
Capstone Milestone Milestone Benchmark Benchmark Total 2+1 2 1 Acquiring
Competencies 6 18 32 1 57 0.877193 0.315789 0.5614 Taking Risks 3 11 10 33 0 57 0.754386 0.175439 0.57895
Solving Problems 3 5 16 31 2 57 0.824561 0.280702 0.54386 Embracing
Contradictions 8 11 12 1 32 0.71875 0.34375 0.375 Innovative Thinking 11 10 36 57 0.807018 0.175439 0.63158
Connecting, Synthesizing, Transforming 11 12 30 2 55 0.763636 0.218182 0.54545
COURSES # Students Evidence Used THTR 105 A THTR 202 A THTR 202 M
Total Students
19 25 13 57
creative project, course discussions, play attendance & written activities, exams
final acting presentations playwright assignment, tests, play reviews (papers)
A total of 57 students were evaluted using the VALUE rubric for Creative Thinking. Between 71-87 90% of all students evaluated fell within the Benchmark (1) and Milestone (2) categories for performance. Benchmark (37-63%) scores may be considered a minium standard for general education courses at the undergraduate level for 100 and 200 level courses. Milestone (17-34%) scores may be consdred a desired standard for general education courses at the UG level for 100 and 200 level courses. Based off of the summary provided, it appears that the students (71-87%) who were in the theatre general education courses noted performed at a level that is expected for 100 and 200 level courses with regards to CREATIVE THINKING. The various constructs of creative thinking performance for levels Milestone (2) and Benchmark (1) are noted below.
Defining features of Reading performance at the BENCHMARK level includes the following:
Acquiring Competencies Model: Successfully reproduces an appropriate exemplar.
Taking Risks Stays strictly within the guidelines of the assignment.
Solving Problems Only a single approach is considered and is used to solve the problem. Embracing" Acknowledges (mentions in passing) alternate, divergent, or contradictory perspectives or ideas. Contradictions"
Innovative Thinking Reformulates a collection of available ideas."
Connecting,"Synthesizing, Recognizes existing connections among ideas or solutions. Transforming"
Defining features of Reading performance at the level MILESTONE includes the following:"
Acquiring Competencies Adapt: Successfully adapts an appropriate exemplar to his/her own specifications.
Taking Risks Considers new directions or approaches without going beyond the guidelines of the assignment.
Solving Problems Considers and rejects less acceptable approaches to solving problem. Embracing" Includes (recognizes the value of) alternate, divergent, or contradictory perspectives or ideas in a small way. Contradictions"Innovative Thinking Experiments with creating a novel or unique idea, question, format, or product. Connecting,"Synthesizing, Connects ideas or solutions in novel ways. Transforming"
Prepared 2/1/2016
You created this PDF from an application that is not licensed to print to novaPDF printer (http://www.novapdf.com)

Creative Thinking VALUE Rubric The summary provided below is based off of Faculty evaluation of individual students in their respective General Education
Courses. Students were individually placed within the correct category of the Creative Thinking AAC&U VLAUE Rubric. Below is a summary of the results.
GENERAL ED - THEATRE % of column/total 4 - 3 - 2 - 1 - 0 - Below
Capstone Milestone Milestone Benchmark Benchmark Total 2+1 3 4 Acquiring
Competencies 47 29 0 39 0 115 0.33913 0.252174 0.4087 Taking Risks 52 63 0 0 115 0.547826 0.452174
Solving Problems 47 52 16 0 115 0.591304 0.408696 Embracing
Contradictions 18 81 16 0 115 0.843478 0.156522 Innovative Thinking 29 70 16 0 115 0.747826 0.25217
Connecting, Synthesizing, Transforming 29 34 52 0 0 115 0.452174 0.295652 0.25217
COURSES # Students Evidence Used MUS 101
MUS 102 M MUS 110 A MUS 117 A MUS 130
Total Students
16 18 23 29 29
115
Individual project, group project, tests, presentations
quizzes, in-class discussions, concert attendance papers concerts, homework, playing instruments
song writing project, composition, projects, papers, exams
A total of 115 students were evaluted using the VALUE rubric for Creative Thinking. Between 33-84% of all students evaluated fell within the Benchmark (1) and Milestone (2) categories for performance. Benchmark scores may be considered a minium standard for general education courses at the undergraduate level for 100 and 200 level courses. Milestone scores may be consdred a desired standard for general education courses at the UG level for 100 and 200 level courses. Based off of the summary provided, it appears that the students who were in the theatre general education courses noted performed at a higher level than expected for 100 and 200 level courses with regards to CREATIVE THINKING. This can be seen by examining the % of students who performed a the Mileston (3) and Capstone (4) performance leveles. The various constructs of creative thinking performance for levels Milestone (2) and Benchmark (1) are noted below.
Defining features of Reading performance at the BENCHMARK level includes the following:
Acquiring Competencies Model: Successfully reproduces an appropriate exemplar.
Taking Risks Stays strictly within the guidelines of the assignment."
Solving Problems Only a single approach is considered and is used to solve the problem."Embracing" Acknowledges (mentions in passing) alternate, divergent, or contradictory perspectives or ideas. Contradictions"
Innovative Thinking Reformulates a collection of available ideas."
Connecting,"Synthesizing, Recognizes existing connections among ideas or solutions."Transforming"
Defining features of Reading performance at the level MILESTONE includes the following:"
Acquiring Competencies Adapt: Successfully adapts an appropriate exemplar to his/her own specifications."
Taking Risks Considers new directions or approaches without going beyond the guidelines of the assignment."
Solving Problems Considers and rejects less acceptable approaches to solving problem."Embracing" Includes (recognizes the value of) alternate, divergent, or contradictory perspectives or ideas in a small way. Contradictions"Innovative Thinking Experiments with creating a novel or unique idea, question, format, or product."Connecting,"Synthesizing, Connects ideas or solutions in novel ways."Transforming"
Prepared 2/1/2016
You created this PDF from an application that is not licensed to print to novaPDF printer (http://www.novapdf.com)

Fall 2015 Art History
Critical Thinking VALUE Rubric The summary provided below is based off of Faculty evaluation of individual students in their respective General Education
Courses. Students were individually placed within the correct category of the Critical Thinking AAC&U VLAUE Rubric. Below is a summary of the results.
GENERAL ED - HISTORY % of column/total 4 3 2 1 0 - Below
Capstone Milestone Milestone Benchmark Benchmark Total 2+1 2 3
Explanation of Issues 0 36 12 3 7 58 0.258621 0.206897 0.62069
Evidence 0 36 12 3 7 58 0.258621 0.206897 0.62069
Influence of Context & Assumptions
0 36 12 3 7 58 0.258621 0.206897 0.62069
Students' Position 0 36 12 3 7 58 0.258621 0.206897 0.62069 Conclusions & Related
Outcomes 0 36 12 3 7 58 0.258621 0.206897 0.62069
COURSES # Students Evidence Used HIST 102 - D 7
AH 251 -L 10 AH 251 - B & C 14
AH 250/HIST 215 21 AH 120
Total Students 6
58
A total of 58 students were evaluted using the VALUE rubric for Critical Thinking. On average over 82% of all students evaluated fell within the Milestone (2 & 3) categories for performance. Benchmark scores may be considered a minium standard for general education courses at the undergraduate level for 100 and 200 level courses. Milestone (82%) scores may be consdred a desired standard for general education courses at the UG level for 100 and 200 level courses. Based off of the summary provided, it appears that the students (82%) who were in the art history general education courses noted performed at a level that is slightly higher than expected for 100 and 200 level courses with regards to READING. The various constructs of reading performance for levels Milestone (2 & 3) and Benchmark (1) are noted below.
Defining features of Reading performance at the BENCHMARK level includes the following:
Explanation of Issues Issue/problem to be considered critically is stated without clarification or description. Information is taken from source(s) without any interpretation/evaluation.
Evidence Viewpoints of experts are taken as fact, without question.
Influence of Context & Shows an emerging awareness of present assumptions (sometimes labels assertions as assumptions). Begins to identify some Assumptions contexts when presenting a position.
Students' Position Specific position (perspective, thesis/hypothesis) is stated, but is simplistic and obvious. Conclusions & Related Conclusion is inconsistently tied to some of the information discussed; related outcomes (consequences and implications) are Outcomes oversimplified.
Defining features of Reading performance at the level MILESTONE includes the following (2):
Issue/problem to be considered critically is stated but description leaves some terms undefined, ambiguities unexplored, Explanation of Issues boundaries undetermined, and/or backgrounds unknown.
Information is taken from source(s) with some interpretation/evaluation, but not enough to develop a coherent analysis or Evidence synthesis. Influence of Context & Questions some assumptions. Identifies several relevant contexts when presenting a position. May be more aware of others' Assumptions assumptions than one's own (or vice versa).
Students' Position Specific position (perspective, thesis/hypothesis) acknowledges different sides of an issue.
Conclusions & Related Conclusion is logically tied to information (because information is chosen to fit the desired conclusion); some related outcomes Outcomes (consequences and implications) are identified clearly.
Defining features of Reading performance at the level MILESTONE includes the following (3): Issue/problem to be considered critically is stated, described, and clarified so that understanding is not seriously impeded by
Explanation of Issues omissions. Information is taken from source(s) with enough interpretation/evaluation to develop a coherent analysis or synthesis. Viewpoints
Evidence of experts are subject to questioning. Influence of Context & Identifies own and others' assumptions and several relevant contexts when presenting a position. Assumptions
Specific position (perspective, thesis/hypothesis) takes into account the complexities of an issue. Others' points of view are Students' Position acknowledged within position (perspective, thesis/hypothesis). Conclusions & Related Conclusion is logically tied to a range of information, including opposing viewpoints; related outcomes (consequences and Outcomes implications) are identified clearly.
Prepared 1/22/2016
You created this PDF from an application that is not licensed to print to novaPDF printer (http://www.novapdf.com)

Reading VALUE Rubric The summary provided below is based off of Faculty evaluation of individual students in their respective General Education
Courses. Students were individually placed within the correct category of the Reading AAC&U VLAUE Rubric. Below is a summary of the results.
GENERAL ED - HISTORY % of column/total 4 3 2 1 0 - Below
Capstone Milestone Milestone Benchmark Benchmark Total 2+1 2 1 Comprehension 1 4 33 36 0 74 0.932432 0.445946 0.48649
Genres 2 0 14 60 0 76 0.973684 0.184211 0.78947 Relationship to text 1 6 24 49 0 80 0.9125 0.3 0.6125
Analysis 1 5 18 56 0 80 0.925 0.225 0.7 Interpretation 2 0 29 51 0 82 0.97561 0.353659 0.62195 Reader's Voice 1 5 27 45 0 78 0.923077 0.346154 0.57692
COURSES # Students Evidence Used HIST 102 - B HIST 213 - A
HIST 217 HIST 102 R
HIST 102 - D Total Students
14 17 20 9
22 82
3 quizzes over reading material, 18 pages of writing using primary & secondary sources 2 examinations, discussion, research paper
weekly quiz over reading, 2 examinations, research paper 3 online quizzes based on readings, 48 pages of writing assignments using primary & secondary resources,
discussion
A total of 82 students were evaluted using the VALUE rubric for Reading. On average over 90% of all students evaluated fell within the Benchmark (1) and Milestone (2) categories for performance. Benchmark (48-78%) scores may be considered a minium standard for general education courses at the undergraduate level for 100 and 200 level courses. Milestone (18-44%) scores may be consdred a desired standard for general education courses at the UG level for 100 and 200 level courses. Based off of the summary provided, it appears that the students (91-97%) who were in the history general education courses noted performed at a level that is expected for 100 and 200 level courses with regards to READING. The various constructs of reading performance for levels Milestone (2) and Benchmark (1) are noted below.
Defining features of Reading performance at the BENCHMARK level includes the following:
Comprehension Apprehends vocabulary appropriately to paraphrase or summarize the information the text communicates. Genres Applies tacit genre knowledge to a variety of classroom reading assignments in productive, if unreflective, ways.
Approaches texts in the context of assignments with the intention and expectation of finding right answers and learning facts and Relationship to Text concepts to display for credit.
Identifies aspects of a text (e.g., content, structure, or relations among ideas) as needed to respond to questions posed in assigned Analysis tasks. Interpretation Can identify purpose(s) for reading, relying on an external authority such as an instructor for clarification of the task. Reader's Voice Comments about texts in ways that preserve the author's meanings and link them to the assignment.
Defining features of Reading performance at the level MILESTONE includes the following:
Evaluates how textual features (e.g., sentence and paragraph structure or tone) contribute to the author’s message; draws basic Comprehension inferences about context and purpose of text.
Reflects on reading experiences across a variety of genres, reading both with and against the grain experimentally and Genres intentionally. Relationship to Text Engages texts with the intention and expectation of building topical and world knowledge.
Recognizes relations among parts or aspects of a text, such as effective or ineffective arguments or literary features, in considering Analysis how these contribute to a basic understanding of the text as a whole.
Interpretation Demonstrates that s/he can read purposefully, choosing among interpretive strategies depending on the purpose of the reading. Discusses texts in structured conversations (such as in a classroom) in ways that contribute to a basic, shared understanding of the
Reader's Voice text.
Prepared 1/22/2016
You created this PDF from an application that is not licensed to print to novaPDF printer (http://www.novapdf.com)

Departmental Data Collected as of 11.7.2016
General Education Assessment: Theology Dept. Outcome #3: Catholic Intellectual Tradition
Degree of Excellence
100 & 200 Level THEO
Courses
Below Expectations
Approaching Expectations
Meeting Expectations
Exceeding Expectations
Greatly Exceeding
Expectations
Spring 2014 12 18 84 78 33 Fall 2014 25 46 77 100 42
Spring 2015 9 22 58 59 11 Fall 2015 13 24 68 81 53
Spring 2016 22 21 99 126 79 Fall 2016
050
100150200250300350400
Spring 2014 Fall 2014 Spring 2015 Fall 2015 Spring 2016 Fall 2016
Coun
t of S
tude
nts
Data Collection Semesters
General Education Assessment100 and 200 Level Courses: Degree of Excellence
Catholic Intellectual Tradition: evaluate truth claims derived from Philosophy & Theology in order to scrutinize the relationship between faith & reason
Below Expectations Approaching Expectations Meeting Expectations
Exceeding Expectations Greatly Exceeding Expectations

Departmental Data Collected as of 11.7.2016
Degree of Excellence 300 & 400
Level THEO Courses
Below Expectations
Approaching Expectations
Meeting Expectations
Exceeding Expectations
Greatly Exceeding
Expectations
Spring 2014 1 9 61 19 9 Fall 2014 3 7 20 25 9
Spring 2015 3 11 25 25 9 Fall 2015 3 2 18 74 29
Spring 2016 6 10 17 47 40 Fall 2016
050
100150200250300350400
Spring 2014 Fall 2014 Spring 2015 Fall 2015 Spring 2016 Fall 2016
Coun
t of S
tude
nts
Data Collection Semesters
General Education Assessment300 and 400 Level Courses: Degree of Excellence
Catholic Intellectual Tradition: evaluate truth claims derived from Philosophy & Theology in order to scrutinize the relationship between faith & reason
Below Expectations Approaching Expectations Meeting Expectations
Exceeding Expectations Greatly Exceeding Expectations

4 - Capstone
3 - Milestone
2 - Milestone
1 - Benchmark
0 - Below Benchmark Total 2+1 2 3
Connections to Experience
56 48 22 4 0 130 0.2 0.169231 0.36923
Connections to Discipline
54 64 8 4 0 130 0.092308 0.061538 0.49231
Transfer of Knowledge 85 37 5 3 0 130 0.061538 0.038462 0.28462
Reflection and Self-Assessment
97 25 6 2 0 130 0.061538 0.046154 0.19231
Commitment of faith and reason
8 12 1 3 0 24 0.166667 0.041667 0.5
Cherishing of wisdom of the past
25 16 2 4 0 47 0.12766 0.042553 0.34043
Inclusive, non-elitist 25 16 2 4 0 47 0.12766 0.042553 0.34043
Communal dimension of all human actions
25 16 2 4 0 47 0.12766 0.042553 0.34043
Scholarship of knowledge
94 28 4 4 0 130 0.061538 0.030769 0.21538
COURSES # StudentsPHIL 343A 24PHIL 310C 23
PHIL 305A & B 53PHIL 340A 30
Total Students 130
Connections to Experience
Connections to Discipline
Transfer of Knowledge
Reflection and Self-Assessment
Connections to Experience
Connections to Discipline
Transfer of Knowledge
Reflection and Self-Assessment
Connections to Experience
Connections to Discipline
Transfer of Knowledge
Reflection and Self-Assessment
Connections to Experience
Connections to Discipline
Transfer of Knowledge
Reflection and Self-Assessment
Identifies connections between life experiences and those academic texts and ideas perceived as similar and related to own interests.
When prompted, presents examples, facts, or theories from more than one field of study or perspective.
Uses skills, abilities, theories, or methodologies gained in one situation in a new situation to contribute to understanding of problems or issues.
Adapts and applies skills, abilities, theories, or methodologies gained in one situation to new situations to solve problems or explore issues.
Compares life experiences and academic knowledge to infer differences, as well as similarities, and acknowledge perspectives other than own.
Articulates strengths and challenges (within specific performances or events) to increase effectiveness in different contexts (through increased selfawareness).
Describes own performances with general descriptors of success and failure.
When prompted, connects examples, facts, or theories from more than one field of study or perspective.
Uses, in a basic way, skills, abilities, theories, or methodologies gained in one situation in a new situation.
Defining features of Reading performance at the level MILESTONE includes the following (2):
Independently connects examples, facts, or theories from more than one field of study or perspective.
Evaluates changes in own learning over time, recognizing complex contextual factors (e.g., works with ambiguity and risk, deals with frustration, considers ethical frameworks).
Fall 2016 Philosophy
Defining features of Reading performance at the level MILESTONE includes the following (3):Effectively selects and develops examples of life experiences, drawn from a variety of contexts (e.g., artistic participation, civic involvement, work experience), to illuminate concepts/theories/frameworks of fields of study.
Defining features of Reading performance at the BENCHMARK level includes the following:
A total of 58 students were evaluted using the VALUE rubric for Critical Thinking. On average over 82% of all students evaluated fell within the Milestone (2 & 3) categories for performance. Benchmark scores may be considered a minium standard for general education courses at the undergraduate level for 100 and 200 level courses. Milestone (82%) scores may be consdred a desired standard for general education courses at the UG level for 100 and 200 level courses. Based off of the summary provided, it appears that the students (82%) who were in the art history general education courses noted performed at a level that is slightly higher than expected for 100 and 200 level courses with regards to READING. The various constructs of reading performance for levels Milestone (2 & 3) and Benchmark (1) are noted below.
Integrative Learning VALUE Rubric
GENERAL ED - Philosophy
Evidence Used
The summary provided below is based off of Faculty evaluation of individual students in their respective General Education Courses. Students were individually placed within the correct category of the Integrative Learning AAC&U VALUE Rubric. Below is
a summary of the results.
% of column/total
Envisions a future self (and possibly makes plans that build on past experiences) that have occurred across multiple and diverse contexts.
Defining features of Reading performance at the level CAPSTONE includes the following (4):
Meaningfully synthesizes connections among experiences outside of the formal classroom (including life experiences and academic experiences such as internships and travel abroad) to deepen understanding of fields of study and to broaden own points of view. Independently creates wholes out of multiple parts (synthesizes) or draws conclusions by combining examples, facts, or theories from more than one field of study or perspective. Adapts and applies, independently, skills, abilities, theories, or methodologies gained in one situation to new situations to solve difficult problems or explore complex issues in original ways.