capturing economic benefits from blasting · pdf filecapturing economic benefits from blasting...
TRANSCRIPT

The Southern African Institute of Mining and Metallurgy Surface Mining 2008
A Ndibalema
________________________________________________________________
Page 97
C A P T U R I N G E C O N O M I C B E N E F I T S F R O M B L A S T I N G
A N d i b a l e m a
AngloGold Ashanti- Geita Gold Mine
Tanzania
ABSTRACT
Blasting is one of the primary functions in any mining operation. Despite the fact that it
generally constitutes between 30% to 40% of the mining cost, blasting also affects the
cost-effectiveness of down steam activities such as load and haul, safety, tyre life for haul
trucks, crushing and milling.
Over the past three decades, significant progress has been made in the development of
new technology in an attempt to reduce costs and increase efficiencies and productivities
of blasting activities. Mine to mill project concepts have paved the way for such
developments. Other advancements have included sophisticated computer modelling
technologies for blast design and performance analysis.
There are many factors that affect the cost of blasting. These can be divided into two
categories; controllable and uncontrollable. The latter includes costs related to
depreciation, exchange rates and government legislation with the former category
including contractor versus owner blasting costs, efficiency and productivity issues and
product quality. Controllable factors have one common denominator which can
determine their outcome; direct site management influence. Excavator digging rates and
final floor conditions give a good measure of blasting performance, and alternatively cost
effectiveness.
This paper is aimed at benchmarking against a blast optimisation database, understanding
the relationship between costs and identifying opportunities for improvement.
Understanding the cost drivers allowed a typical cost model to be developed for the
current mining operation at Geita and this was used to drive continuous improvement
with emphasis on closing the information loop.
1. INTRODUCTION
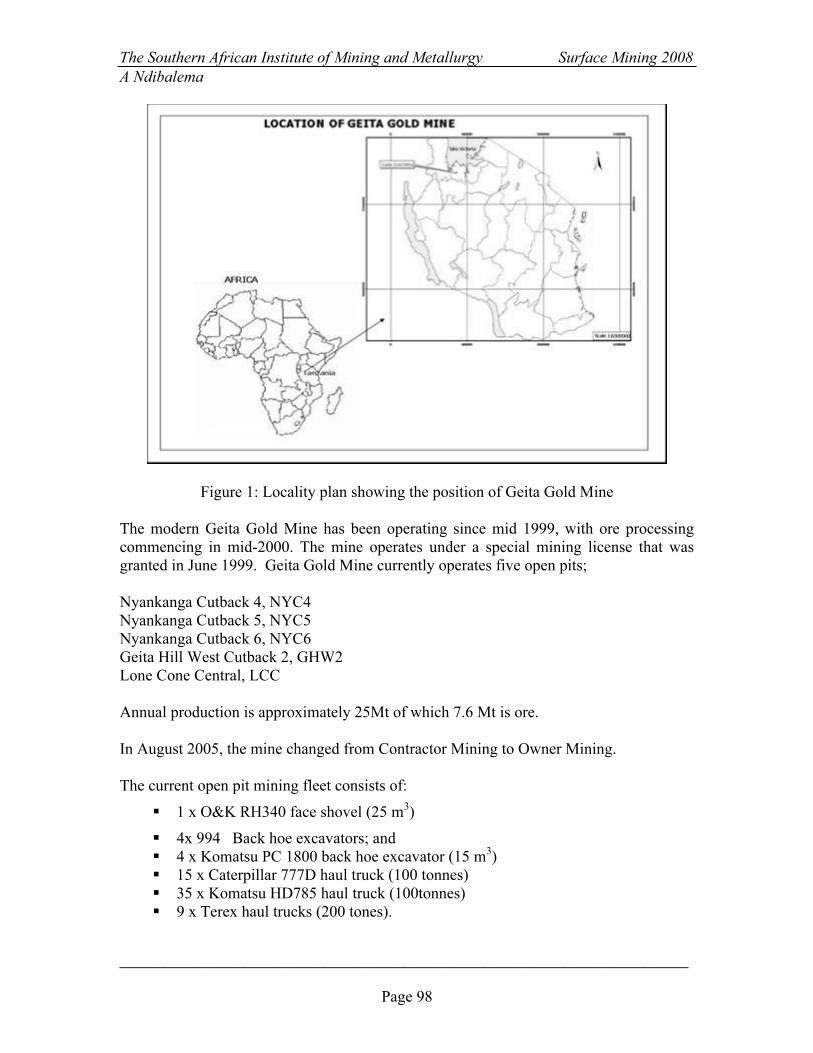
Geita Gold Mine (GGM) is an operation owned and managed by AngloGold Ashanti.
The mine is located in the Geita district in northwest Tanzania, 295 kilometres and 590
kilometres from Serengeti National park and Mount Kilimanjaro respectively (Figure 1).
Mining in this area has taken place for many years with the last major operation being an
underground mine, which operated from the 1930s through to the 1960s and produced
almost 1 Moz of gold. Some small-scale mining continues to this day.
The Southern African Institute of Mining and Metallurgy Surface Mining 2008
A Ndibalema
________________________________________________________________
Page 98
Figure 1: Locality plan showing the position of Geita Gold Mine
The modern Geita Gold Mine has been operating since mid 1999, with ore processing
commencing in mid-2000. The mine operates under a special mining license that was
granted in June 1999. Geita Gold Mine currently operates five open pits;
Nyankanga Cutback 4, NYC4
Nyankanga Cutback 5, NYC5
Nyankanga Cutback 6, NYC6
Geita Hill West Cutback 2, GHW2
Lone Cone Central, LCC
Annual production is approximately 25Mt of which 7.6 Mt is ore.
In August 2005, the mine changed from Contractor Mining to Owner Mining.
The current open pit mining fleet consists of:
� 1 x O&K RH340 face shovel (25 m3
)
� 4x 994 Back hoe excavators; and
� 4 x Komatsu PC 1800 back hoe excavator (15 m3
)
� 15 x Caterpillar 777D haul truck (100 tonnes)
� 35 x Komatsu HD785 haul truck (100tonnes)
� 9 x Terex haul trucks (200 tones).

The Southern African Institute of Mining and Metallurgy Surface Mining 2008
A Ndibalema
________________________________________________________________
Page 99
Geita Gold mine is classified as a hard rock mining operation, with the main pits
requiring drilling and blasting. In total, blasting activities range from paddock blasting in
soft laterite and oxide to hard rock blasting in sulphides. Drilling and blasting operations
are carried out using ROC L8’s, DML’s and a Pantera drill rig. All explosives are
managed and supplied by AEL (Explosive contractor). The current drill fleet consists of:
� 10 ROC L8 (Atlas Copco)
� 5 DML HP (Atlas Copco) and
� 1 Tamrock Pantera.
The recent rollout of continuous improvement initiatives across the mine is one of the
motivating forces for this case study. This study covers aspects of the economics
associated with blasting at Geita with the opinion that the drill and blasting continuous
improvement strategy will significantly improve blasting associated costs at the Geita
operations. The project is a joint undertaking between the GGM drill and blast
department and explosives supply contractor (African Explosives Limited (AEL)).
1.1 Current Blasting Practise at Geita Gold Mine
History
The Geita blasting operations are currently undertaken in oxide to fresh materials using
both ROC L8 and DML drilled blast holes. Typical drill and blast parameters are shown
in Table 1.
Table 1: Geita current drilling patterns
AEL bulk explosive products used at Geita are
Emulsion P400 (65% ammonium nitrate),
P700 (80% ammonium nitrate) and
Ammonium Nitrate fuel oil (ANFO)

The Southern African Institute of Mining and Metallurgy Surface Mining 2008
A Ndibalema
________________________________________________________________
Page 100
Two types of initiation systems are used: non-electric detonation (Nonel) and electronic
detonation, Smartdet. All other accessories are a mix of AEL products and third party
products supplied by AEL.
Blasting quality control
After design and drilling quality checks; the charging and blasting activities are also
checked.
Pumped emulsion is checked for gassing and calibration by measuring two 25kg buckets
of bulk explosive against the pump flow meters. Explosive is then pumped into each
blast hole and the Kg’s recorded against individual hole IDs.
Holes are remeasured to confirm gassing has occurred and the correct (design) stemming
height achieved.
Holes are stemmed after gassing. Gassing time ranges from 30 minutes to 40 minutes
whereby 0.8 m to 1 m of column rise in a 127mm hole is achieved.
Further effort is required in blasting practice to:
� Avoid hard toe – survey control of hole position and application of ‘stitch holes’
between blast boundaries
� Attain optimum fragmentation – typically at Geita this involves quick timing
between spacing and calibrated timing against the burden.
� Minimise ore loss and dilution – blast material movement is directed along strike
� Achieve the final wall and grade – Slopes in the Nyankanga pit are steep. Limit
blasting must result in a clean hard face that is on design.
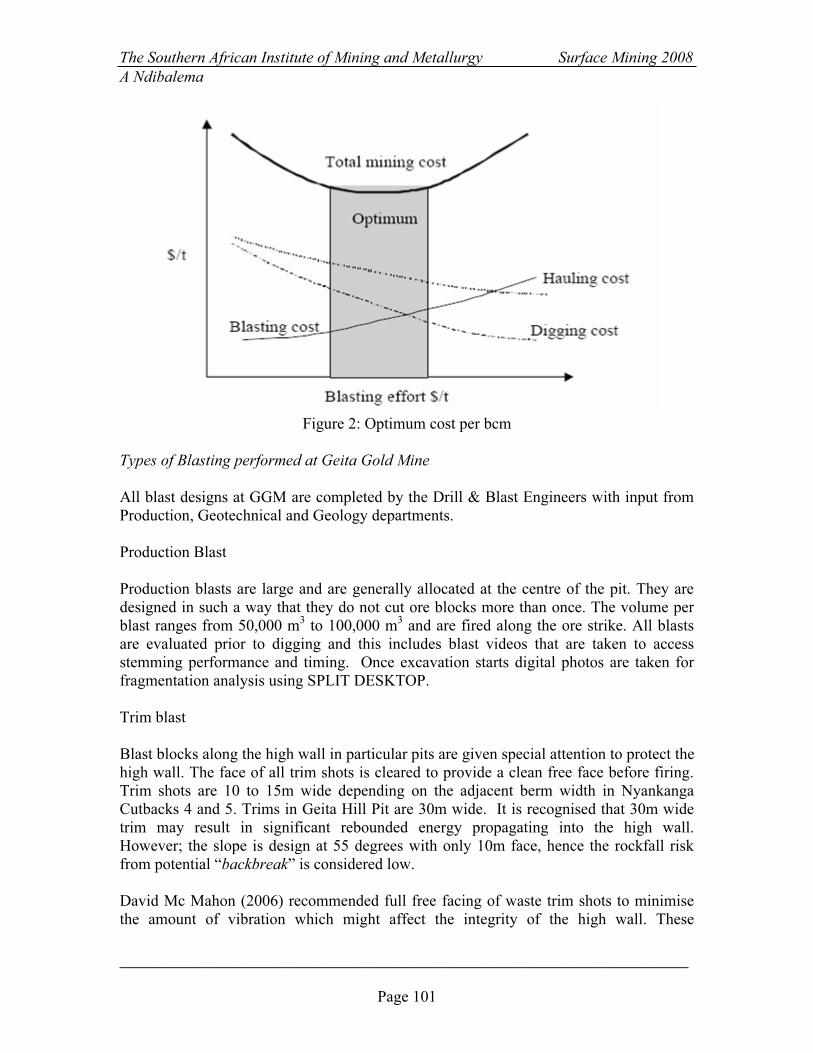
Blast evaluation is obtained from Geology, Geotechnical and Load and Haul groups.
Good blasting results are when there is minimal impact on ore dilution berms and final
walls are achieved and good fragmentation and dig rates are achieved. The combined
evaluation is simply measured by total cost. The traditional interpretation of the optimum
cost per bcm is shown in Figure 2. (McKenzie 1965, Dinis da Gama 1990, and Elolanta
1995).
The Southern African Institute of Mining and Metallurgy Surface Mining 2008
A Ndibalema
________________________________________________________________
Page 101
Figure 2: Optimum cost per bcm
Types of Blasting performed at Geita Gold Mine
All blast designs at GGM are completed by the Drill & Blast Engineers with input from
Production, Geotechnical and Geology departments.
Production Blast
Production blasts are large and are generally allocated at the centre of the pit. They are
designed in such a way that they do not cut ore blocks more than once. The volume per
blast ranges from 50,000 m3
to 100,000 m3
and are fired along the ore strike. All blasts
are evaluated prior to digging and this includes blast videos that are taken to access
stemming performance and timing. Once excavation starts digital photos are taken for
fragmentation analysis using SPLIT DESKTOP.
Trim blast
Blast blocks along the high wall in particular pits are given special attention to protect the
high wall. The face of all trim shots is cleared to provide a clean free face before firing.
Trim shots are 10 to 15m wide depending on the adjacent berm width in Nyankanga
Cutbacks 4 and 5. Trims in Geita Hill Pit are 30m wide. It is recognised that 30m wide
trim may result in significant rebounded energy propagating into the high wall.
However; the slope is design at 55 degrees with only 10m face, hence the rockfall risk
from potential “backbreak” is considered low.
David Mc Mahon (2006) recommended full free facing of waste trim shots to minimise
the amount of vibration which might affect the integrity of the high wall. These
The Southern African Institute of Mining and Metallurgy Surface Mining 2008
A Ndibalema
________________________________________________________________
Page 102
recommendations come about to strike a balance between drill and blast and geotechnical
objectives.
Presplit blast
Presplit are currently only used at Nyankanga cutback 4 and occasionally cutback 5 to
achieve final wall. Recent results from the Nyankanga cut 5 trim blast have resulted in
load and haul achieving 90% to 98% of the design toe after buffer line adjustments with
out putting in a presplit.
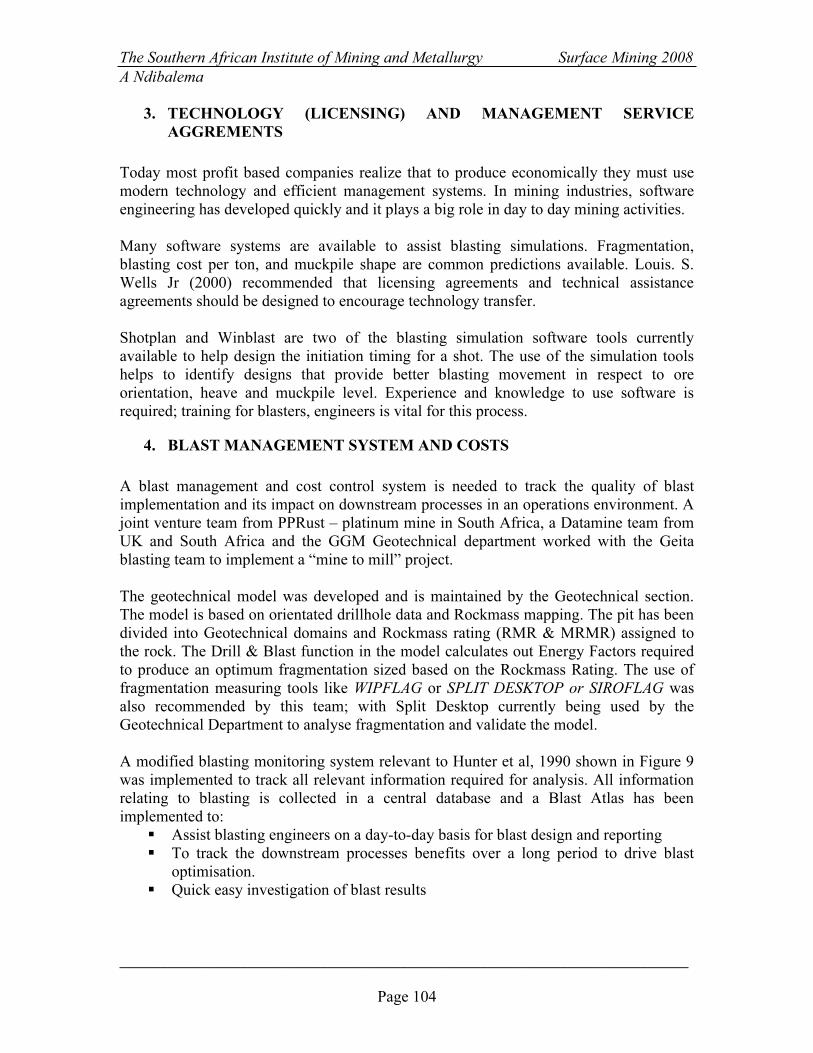
2. WHAT DOES BLASTING ECONOMICS MEAN?
For any profit-based company the main goal is to maximise the rate of return on its
investment. The profit earned per bcm of broken material is the difference between the
price of the valuable material from the ore it uncovers and the cost of producing it. Total
profit can be estimated from the following equation:
FixedCostostOperatingCvenueofit −−= RePr
Where,
ThroughputingCostUnitOperatostOperatingC *=
LiberationGrindingCrushingHauling
LoadingBlastingDrilling
UnitCostofingCostUnitOperat
+++
+++
=
Fixed Cost = Cost of capital and overhead
Depending on the type of mining operation involved, a blast will have a varying degree
of influence on both revenue and the cost of operation. In this paper the influence that
blasting has on the operating cost of the current Geita Gold Mine is described. Figure 3
illustrates an approach to the evaluation of the total mining cost based on blast
performance.

The Southern African Institute of Mining and Metallurgy Surface Mining 2008
A Ndibalema
________________________________________________________________
Page 103
Figure 3: The assessment of blast performance using total mining cost as the yardstick.
(Modified from Hunter et al 1990)
Blasting performance is usually evaluated from loading performance and crushing
efficiency. It is important to be able to understand the impact of blasting in relation to
company revenue. M J Cameron (1996) demonstrated the following common elements
on the performance and cost relationship for operations.
� Suspension and frame life versus loading unit. Suspension and frame life is
sensitive to rolling resistance and running surface and loading faces and tires life
at loading face
� Crusher efficiency versus power consumption, throughput versus blasting
fragmentation.
� Ore loss and dilution versus blasting initiation techniques in relationship to
loading priority.
It is necessary to look beyond the obvious inherent performance and costs to the marginal
and underlying cost components that tend to become increasingly significant with
increasing production.
Primary Drilling and
Blasting Cost
Blast Results Fragmentation
Grade Control
DiggabilitySecondary Drilling
Digging cost
Hauling Cost
Crushing Cost
TOTAL MINING COST
BLAST PERFORMANCE
The Southern African Institute of Mining and Metallurgy Surface Mining 2008
A Ndibalema
________________________________________________________________
Page 104
3. TECHNOLOGY (LICENSING) AND MANAGEMENT SERVICE
AGGREMENTS
Today most profit based companies realize that to produce economically they must use
modern technology and efficient management systems. In mining industries, software
engineering has developed quickly and it plays a big role in day to day mining activities.
Many software systems are available to assist blasting simulations. Fragmentation,
blasting cost per ton, and muckpile shape are common predictions available. Louis. S.
Wells Jr (2000) recommended that licensing agreements and technical assistance
agreements should be designed to encourage technology transfer.
Shotplan and Winblast are two of the blasting simulation software tools currently
available to help design the initiation timing for a shot. The use of the simulation tools
helps to identify designs that provide better blasting movement in respect to ore
orientation, heave and muckpile level. Experience and knowledge to use software is
required; training for blasters, engineers is vital for this process.
4. BLAST MANAGEMENT SYSTEM AND COSTS
A blast management and cost control system is needed to track the quality of blast
implementation and its impact on downstream processes in an operations environment. A
joint venture team from PPRust – platinum mine in South Africa, a Datamine team from
UK and South Africa and the GGM Geotechnical department worked with the Geita
blasting team to implement a “mine to mill” project.
The geotechnical model was developed and is maintained by the Geotechnical section.
The model is based on orientated drillhole data and Rockmass mapping. The pit has been
divided into Geotechnical domains and Rockmass rating (RMR & MRMR) assigned to
the rock. The Drill & Blast function in the model calculates out Energy Factors required
to produce an optimum fragmentation sized based on the Rockmass Rating. The use of
fragmentation measuring tools like WIPFLAG or SPLIT DESKTOP or SIROFLAG was
also recommended by this team; with Split Desktop currently being used by the
Geotechnical Department to analyse fragmentation and validate the model.
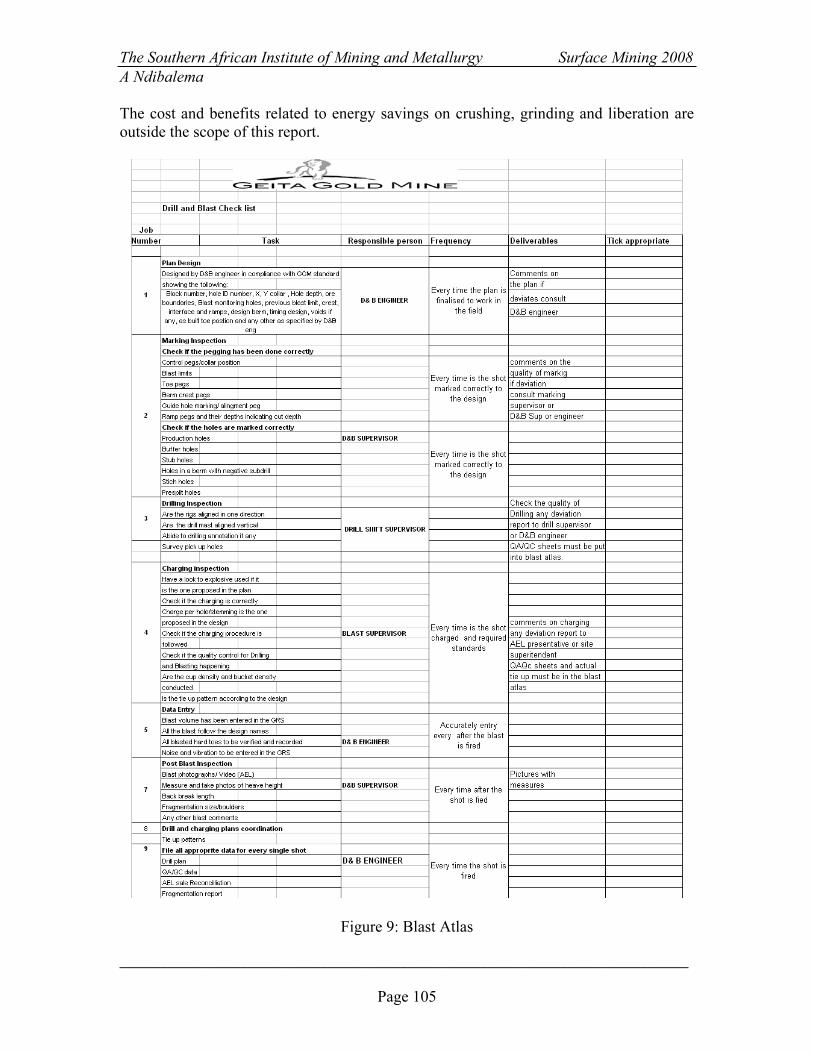
A modified blasting monitoring system relevant to Hunter et al, 1990 shown in Figure 9
was implemented to track all relevant information required for analysis. All information
relating to blasting is collected in a central database and a Blast Atlas has been
implemented to:
� Assist blasting engineers on a day-to-day basis for blast design and reporting
� To track the downstream processes benefits over a long period to drive blast
optimisation.
� Quick easy investigation of blast results
The Southern African Institute of Mining and Metallurgy Surface Mining 2008
A Ndibalema
________________________________________________________________
Page 105
The cost and benefits related to energy savings on crushing, grinding and liberation are
outside the scope of this report.
Figure 9: Blast Atlas
The Southern African Institute of Mining and Metallurgy Surface Mining 2008
A Ndibalema
________________________________________________________________
Page 106
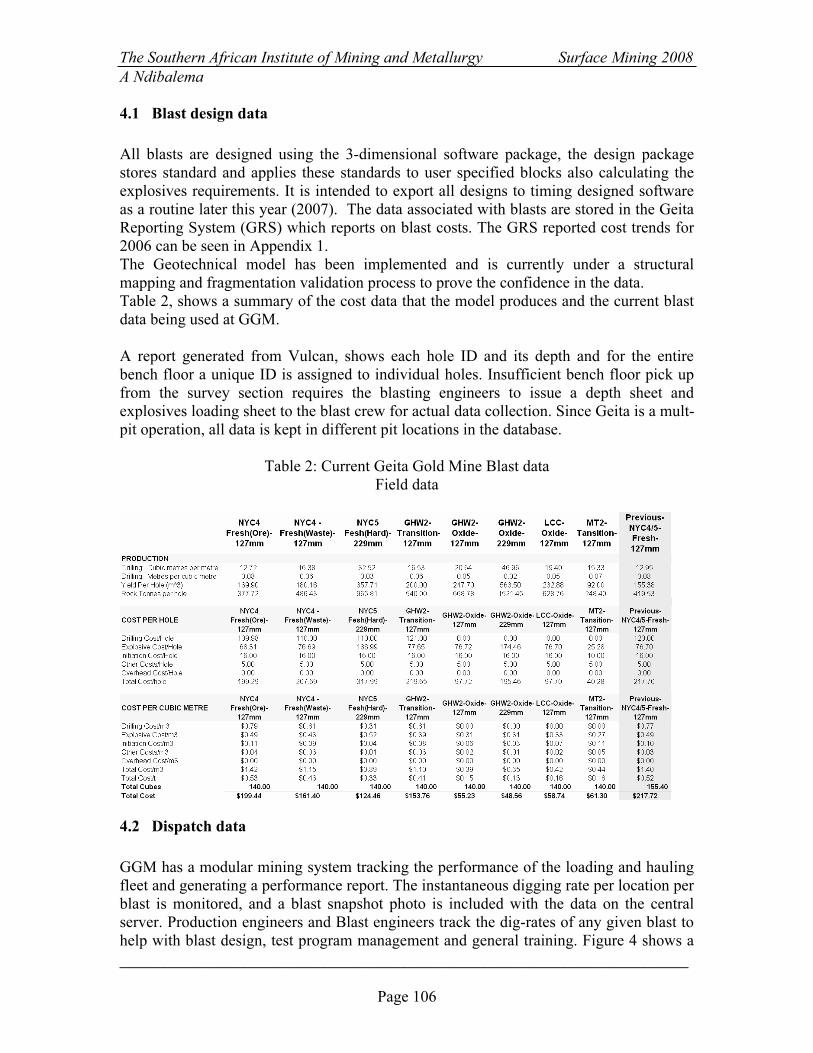
4.1 Blast design data
All blasts are designed using the 3-dimensional software package, the design package
stores standard and applies these standards to user specified blocks also calculating the
explosives requirements. It is intended to export all designs to timing designed software
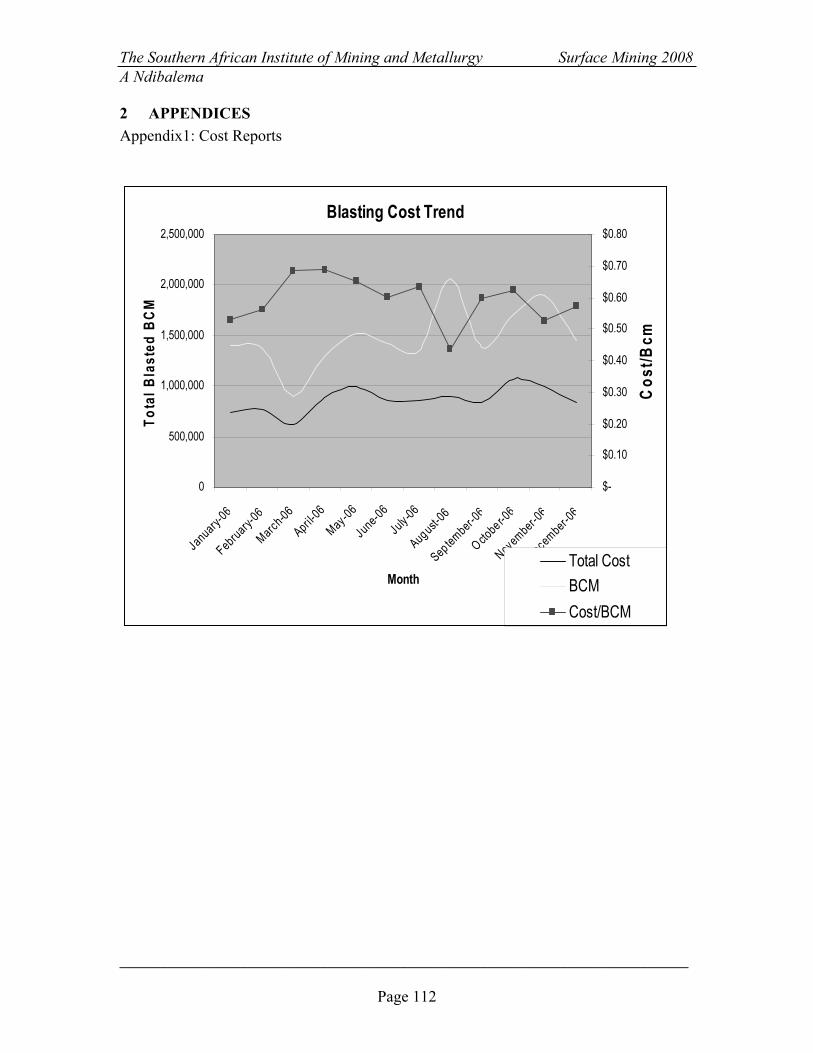
as a routine later this year (2007). The data associated with blasts are stored in the Geita
Reporting System (GRS) which reports on blast costs. The GRS reported cost trends for
2006 can be seen in Appendix 1.
The Geotechnical model has been implemented and is currently under a structural
mapping and fragmentation validation process to prove the confidence in the data.
Table 2, shows a summary of the cost data that the model produces and the current blast
data being used at GGM.
A report generated from Vulcan, shows each hole ID and its depth and for the entire
bench floor a unique ID is assigned to individual holes. Insufficient bench floor pick up
from the survey section requires the blasting engineers to issue a depth sheet and
explosives loading sheet to the blast crew for actual data collection. Since Geita is a mult-
pit operation, all data is kept in different pit locations in the database.
Table 2: Current Geita Gold Mine Blast data
Field data
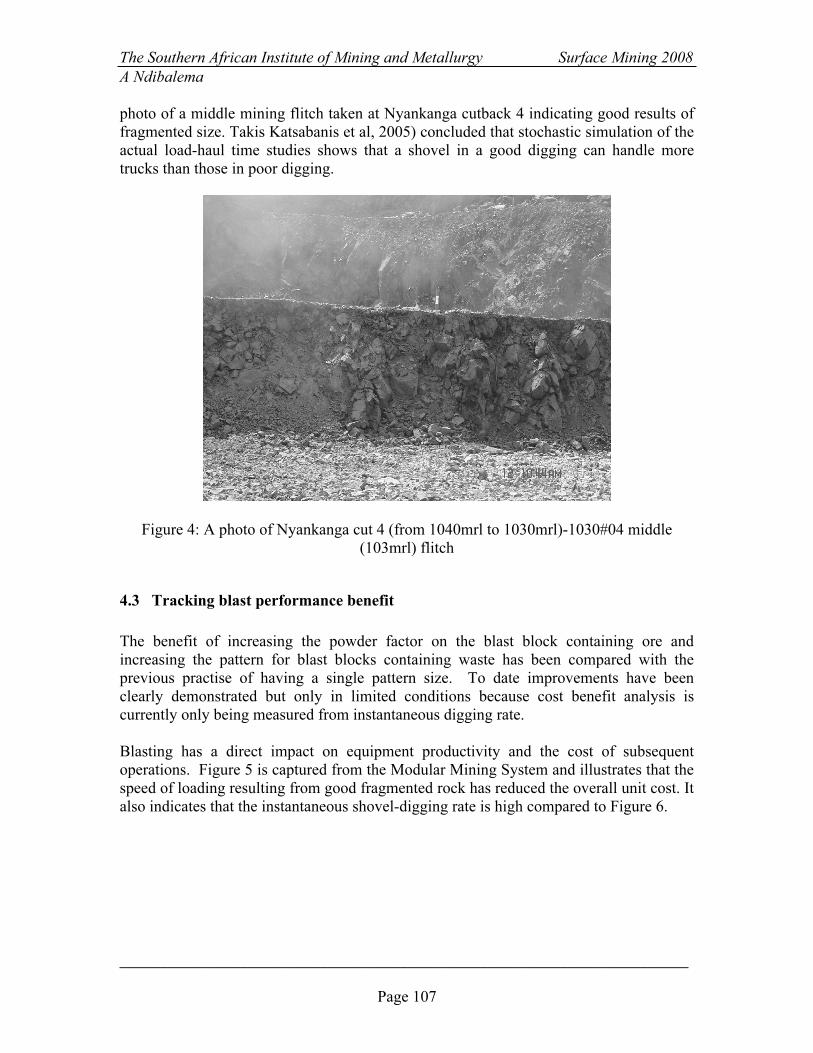
4.2 Dispatch data
GGM has a modular mining system tracking the performance of the loading and hauling
fleet and generating a performance report. The instantaneous digging rate per location per
blast is monitored, and a blast snapshot photo is included with the data on the central
server. Production engineers and Blast engineers track the dig-rates of any given blast to
help with blast design, test program management and general training. Figure 4 shows a
The Southern African Institute of Mining and Metallurgy Surface Mining 2008
A Ndibalema
________________________________________________________________
Page 107
photo of a middle mining flitch taken at Nyankanga cutback 4 indicating good results of
fragmented size. Takis Katsabanis et al, 2005) concluded that stochastic simulation of the
actual load-haul time studies shows that a shovel in a good digging can handle more
trucks than those in poor digging.
Figure 4: A photo of Nyankanga cut 4 (from 1040mrl to 1030mrl)-1030#04 middle
(103mrl) flitch
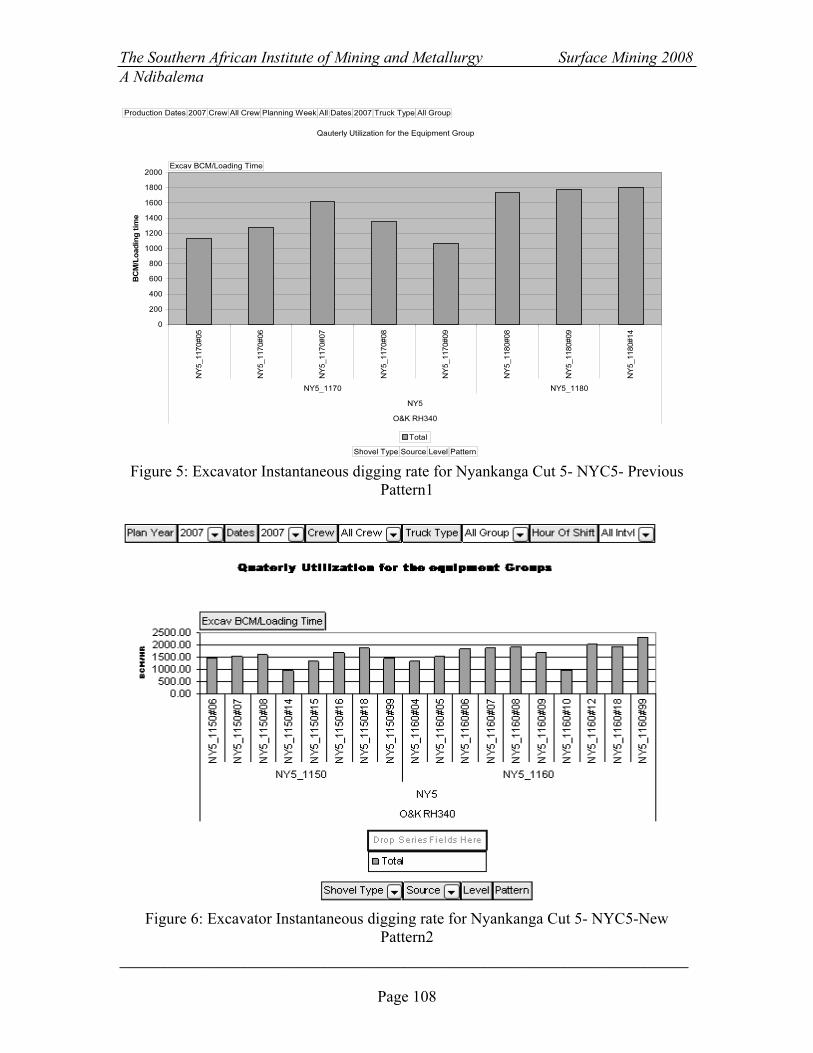
4.3 Tracking blast performance benefit
The benefit of increasing the powder factor on the blast block containing ore and
increasing the pattern for blast blocks containing waste has been compared with the
previous practise of having a single pattern size. To date improvements have been
clearly demonstrated but only in limited conditions because cost benefit analysis is
currently only being measured from instantaneous digging rate.
Blasting has a direct impact on equipment productivity and the cost of subsequent
operations. Figure 5 is captured from the Modular Mining System and illustrates that the
speed of loading resulting from good fragmented rock has reduced the overall unit cost. It
also indicates that the instantaneous shovel-digging rate is high compared to Figure 6.
The Southern African Institute of Mining and Metallurgy Surface Mining 2008
A Ndibalema
________________________________________________________________
Page 108
Qauterly Utilization for the Equipment Group
0
200
400
600
800
1000
1200
1400
1600
1800
2000
NY5_1170#05
NY5_1170#06
NY5_1170#07
NY5_1170#08
NY5_1170#09
NY5_1180#08
NY5_1180#09
NY5_1180#14
NY5_1170 NY5_1180
NY5
O&K RH340
BC
M/L
oad
in
g tim
e
Total
Production Dates 2007 Crew All Crew Planning Week All Dates 2007 Truck Type All Group
Excav BCM/Loading Time
Shovel Type Source Level Pattern
Figure 5: Excavator Instantaneous digging rate for Nyankanga Cut 5- NYC5- Previous
Pattern1
Figure 6: Excavator Instantaneous digging rate for Nyankanga Cut 5- NYC5-New
Pattern2
The Southern African Institute of Mining and Metallurgy Surface Mining 2008
A Ndibalema
________________________________________________________________
Page 109
The optimisation criteria to assess blasting requirements are the combination of activity
costs and managing them in order to minimise the overall production costs. This does not
mean that reducing any particular parameter in exclusion will necessarily result in
lowering overall costs. It should be understood that the effectiveness of the blast does not
necessarily increase with a reduction in blasting costs as some changes can be counter
productive.
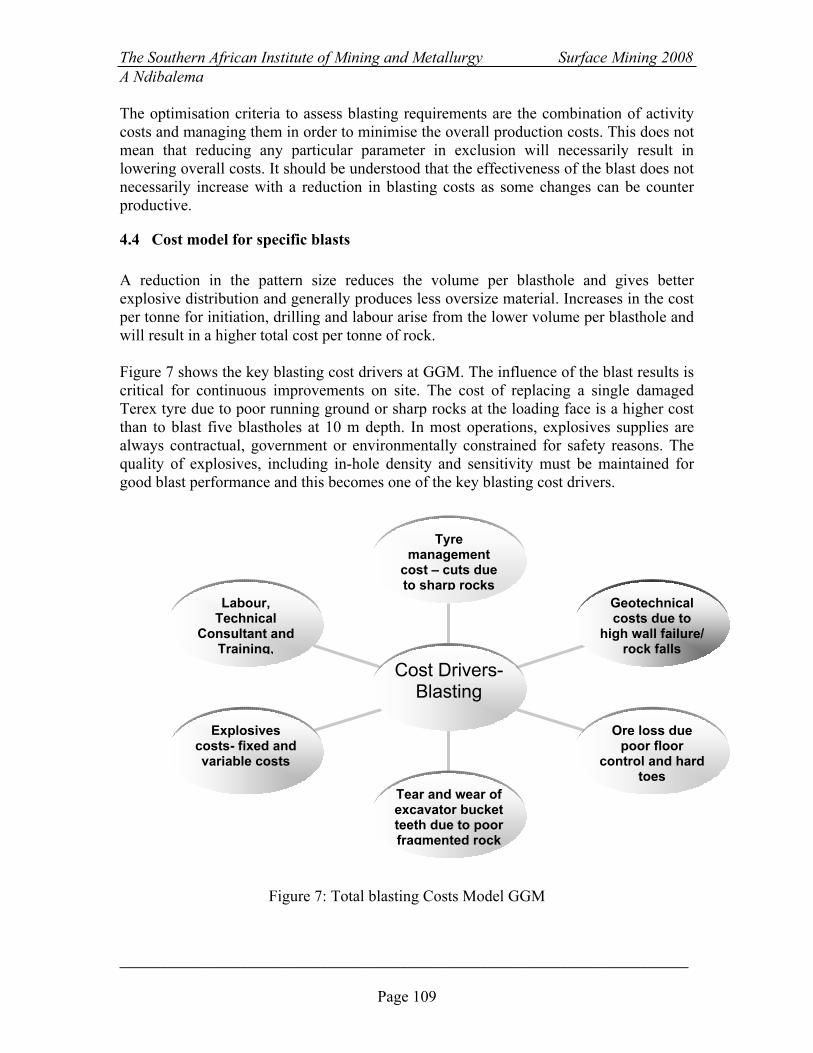
4.4 Cost model for specific blasts
A reduction in the pattern size reduces the volume per blasthole and gives better
explosive distribution and generally produces less oversize material. Increases in the cost
per tonne for initiation, drilling and labour arise from the lower volume per blasthole and
will result in a higher total cost per tonne of rock.
Figure 7 shows the key blasting cost drivers at GGM. The influence of the blast results is
critical for continuous improvements on site. The cost of replacing a single damaged
Terex tyre due to poor running ground or sharp rocks at the loading face is a higher cost
than to blast five blastholes at 10 m depth. In most operations, explosives supplies are
always contractual, government or environmentally constrained for safety reasons. The
quality of explosives, including in-hole density and sensitivity must be maintained for
good blast performance and this becomes one of the key blasting cost drivers.
Figure 7: Total blasting Costs Model GGM
Labour,
Technical
Consultant and
Training,
Explosives
costs- fixed and
variable costs
Tear and wear of
excavator bucket
teeth due to poor
fragmented rock
Ore loss due
poor floor
control and hard
toes
Geotechnical
costs due to
high wall failure/
rock falls
Tyre
management
cost – cuts due
to sharp rocks
Cost Drivers-
Blasting

The Southern African Institute of Mining and Metallurgy Surface Mining 2008
A Ndibalema
________________________________________________________________
Page 110
As with most operations, labour costs makes up a significant proportion of the total cost
of breaking rock. It is therefore necessary that productivity is maximised and labour is
fully utilised. Blasting requires suitably qualified and experienced personnel and should
not be treated as a training ground.
Eliminating ore loss and preventing dilution at GGM can prove difficult particularly
along the highwall as blasting techniques do conflict with geotechnical consideration.
5. CONCLUSION
The process of optimising blasting must be done in a controlled manner so that the
influence of changes on blast performance can be measured and evaluated. It is most
important that changes are made independent of other variables and that thorough
analyses of the total cost and the performance of blasts are undertaken to enable any
benefits to be identified and quantified. It should be acknowledged that even minor fine
tunning of blast geometry to suit changing operating conditions in multi-pit operations
has a significant impact on blasting economics.
In addition to blast cost savings there are a number of issues that need to be addressed to
significantly improve the efficiency of downstream activities. These include:
1. Fragmentation measurements are required so that the effect of blast performance
on loading efficiency and fragmentation can be tracked.
2. On-bench quality control checks to achieve design and required Drill & Blast
results
3. The relationship between blasting, crushing and grinding performance is vital for
the operations.
4. Drill and Blast Engineers, shot firers and drill supervisors all need high levels of
training.
5. Operations team need to understand and support to achieve the necessary quality.
ACKNOWLEDGEMENTS
This paper describes economics associated with blasting by Alistides Ndibalema
employed as Mining Engineer and is presented with the permission of Geita Gold Mine.
The author would like to thank Geita Gold Mine’s management for their permission to
present this paper and also thank the members of the Mining Department at Geita who
contributed to the preparation of this paper.
The Southern African Institute of Mining and Metallurgy Surface Mining 2008
A Ndibalema
________________________________________________________________
Page 111
REFERENCES
Alistides Ndibalema, 2007 (Not published). Professional report, Engineers
Registration Board (ERB) Tanzania.
David Mc Mahon, 2006. Geita Drilling & Blasting Practise (Internal report);
Onsite Technical Audit.
D. McMahon, 2006. Personal Communication, 15 October.
D Cox, R W Pesch, D La Rosa and S S Kanchibotla, 2003. Implementation of
Mine to Mill Blast Optimisation at Porgera Gold Mine in proceedings 5th
Large Open pit Conference 2003, pp 79-87 (The Australian Institute of
Mining and Metallurgy; Kalgoorlie, Western Australia).
J R Grant, T N Little and D Bettess. Blast Driven Optimisation, Compilation
of Published ICI Technical Papers from 1993 to 1995 pp 23- 30.
Louis. S. Wells, Jr, 2000. The product life cycle and the International Trade.
Harvard University.
M J Cameron, 1996. Blasting Economics: do your home work and optimise
costs. Compilation of Published ICI Technical Papers from 1993 to 1995 pp
227-228.
Takis Katsabanis, Cam Thomas, Lyall Workman, Tom Palangio and Jack
Eloranta, 2005. From Drill to Mill for Mines and Quarries, Newsletter of
Advanced Optimisation Group (AOG) Vol 4, Issue 1 Feb 15, 2005.
The Southern African Institute of Mining and Metallurgy Surface Mining 2008
A Ndibalema
________________________________________________________________
Page 112
2 APPENDICES
Appendix1: Cost Reports
Blasting Cost Trend
0
500,000
1,000,000
1,500,000
2,000,000
2,500,000
January-06
February-06
March-06
April-06
May-06
June-06
July-06
August-06
September-06
October-06
November-06
December-06
Month
To
ta
l B
la
ste
d B
CM
$-
$0.10
$0.20
$0.30
$0.40
$0.50
$0.60
$0.70
$0.80
Cost/Bcm
Total Cost
BCM
Cost/BCM