carbon capture use & storage (ccus) - inagendo.com · source: inagendo update of sbc 2011,...
TRANSCRIPT

Carbon Capture Use & Storage (CCUS) 1
Carbon Capture Use & Storage (CCUS)Potential of Carbon Dioxide Reuse in Enhanced Oil Recovery & Industrial Applications
CCS is the single most important technology in the International Energy Agency's 2DS scenario,designed to attain the 2°C climate goal: CCS contributes one-sixth - or 7.8 GtCO2 - of CO2emissions reductions required in 2050, and one-fifth - or 123 GtCO2 - of the cumulative emis-sions reductions between 2015 and 2050. If CCS were not available, the investment for reachingthe climate target would increase by a further 40%, with an extra cost of US$ 2 trillion [IEA2012b]. In 2013, the IEA warned that “progress [in CCS] is far too slow to achieve the wide-spread commercial deployment” [IEA 2013c]. CCS has not delivered in the EU as well,prompting CCS rapporteur Chris Davies to demand a restart of EU CCS policy. The bulk ofCCS investments to date has been in projects that utilise CO2 as a resource, offsetting some ofthe costs that come with CCS. Thus, venues that use and store CO2 are gaining importance.
1. The dimension of CO2 Reuse
While Carbon Capture and Storage (CCS) treats CO2 as a waste product that needs to be costlystored away, CO2 Reuse, running under the umbrella term Carbon Capture & Use (CCU),transforms CO2 into a resource or commodity. Commercial utilisation of CO2 is considered apossible mitigation option, complementary to geologic storage of CO2 (CCS).
At present, 110-120 Megatons of CO2 p.a. (MtCO2pa) are sold commercially for a diverseportfolio of applications [Fig. 1]. CO2 is used as a chemical solvent in decaffeination and wine-making, for the carbonation of soft drinks, and for modified atmosphere packing (MAP) in thefood industry. Smaller amounts of CO2 are used in dry-cleaning, fire-protection, for the manu-facture of fire-protective insulation materials and as a nutrient for greenhouse vegetables. Theseapplications will remain small scale, taking up no more than 15-20 MtCO2pa.
Mature large scale applications to date include manufacture of fertilisers (UREA) and enhancedoil recovery (EOR). UREA production takes up 30 MtCO2pa. The largest single use of CO2 isin enhanced oil recovery, which consumes 70-75 MtCO2pa, and counting. While the UREACO2 demand is limited to some 100 MtCO2pa, the EOR market could take up well in excess of600 MtCO2pa [see Fig. 3].
Fig. 1: Existing applications for CO2 Reuse
Enhanced Oil Recovery Enhanced Gas Recovery
Urea Fertiliser Horticulture
Food Processing Food Preservation
Pharmaceuticals Fire Suppression
Beverage Carbonation Decaffeination
Source: GCCSI 2011
In addition, there is a number of emerging uses that are still small scale and require extensiveresearch & development, before they reach technical maturity [Fig. 4]. CO2 might serve as achemical feedstock for the production of carbon based polymers or polyurethanes, or as a nu-
Carbon Capture Use & Storage (CCUS) 2
trient for algae cultivation: Methanol from algae can be used as a primary product for chemicalsor refined into fuel for the transport sector. Other uses include enhanced coal bed methane(ECBM), enhanced geothermal systems (EGS), concrete curing, and renewable methanol. Min-eral carbonation provides for a specific case, since it uses CO2 neither as a resource nor an in-termediate, but is rather a permanent storage solution and alternative or complement to CCS.
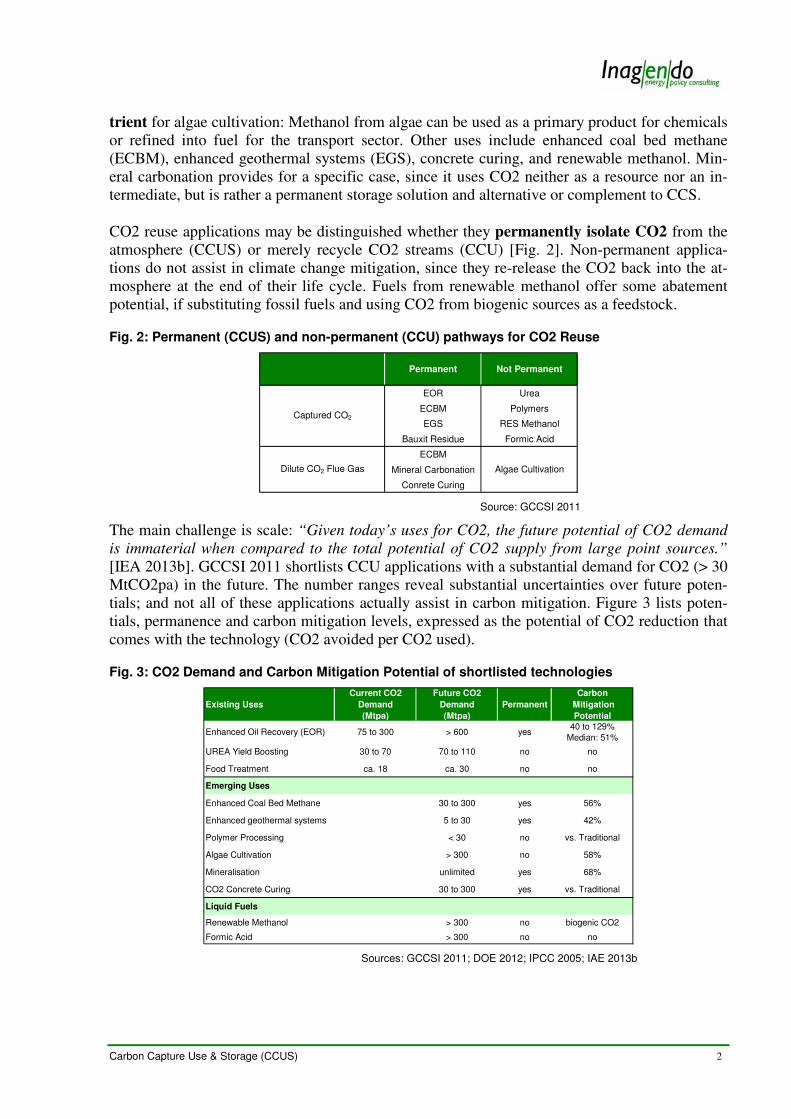
CO2 reuse applications may be distinguished whether they permanently isolate CO2 from theatmosphere (CCUS) or merely recycle CO2 streams (CCU) [Fig. 2]. Non-permanent applica-tions do not assist in climate change mitigation, since they re-release the CO2 back into the at-mosphere at the end of their life cycle. Fuels from renewable methanol offer some abatementpotential, if substituting fossil fuels and using CO2 from biogenic sources as a feedstock.
Fig. 2: Permanent (CCUS) and non-permanent (CCU) pathways for CO2 Reuse
Permanent Not Permanent
EOR Urea
ECBM Polymers
EGS RES Methanol
Bauxit Residue Formic Acid
ECBM
Mineral Carbonation
Conrete Curing
Captured CO2
Dilute CO2 Flue Gas Algae Cultivation
Source: GCCSI 2011
The main challenge is scale: “Given today’s uses for CO2, the future potential of CO2 demandis immaterial when compared to the total potential of CO2 supply from large point sources.”[IEA 2013b]. GCCSI 2011 shortlists CCU applications with a substantial demand for CO2 (> 30MtCO2pa) in the future. The number ranges reveal substantial uncertainties over future poten-tials; and not all of these applications actually assist in carbon mitigation. Figure 3 lists poten-tials, permanence and carbon mitigation levels, expressed as the potential of CO2 reduction thatcomes with the technology (CO2 avoided per CO2 used).
Fig. 3: CO2 Demand and Carbon Mitigation Potential of shortlisted technologies
Existing Uses
Current CO2
Demand
(Mtpa)
Future CO2
Demand
(Mtpa)
Permanent
Carbon
Mitigation
Potential
Enhanced Oil Recovery (EOR) 75 to 300 > 600 yes40 to 129%
Median: 51%
UREA Yield Boosting 30 to 70 70 to 110 no no
Food Treatment ca. 18 ca. 30 no no
Emerging Uses
Enhanced Coal Bed Methane 30 to 300 yes 56%
Enhanced geothermal systems 5 to 30 yes 42%
Polymer Processing < 30 no vs. Traditional
Algae Cultivation > 300 no 58%
Mineralisation unlimited yes 68%
CO2 Concrete Curing 30 to 300 yes vs. Traditional
Liquid Fuels
Renewable Methanol > 300 no biogenic CO2
Formic Acid > 300 no no
Sources: GCCSI 2011; DOE 2012; IPCC 2005; IAE 2013b

Carbon Capture Use & Storage (CCUS) 3
Many applications are yet immature and require years of research & development. Some comewith huge energy debts, like renewable methanol or mineralisation, and seem feasible only un-der excess renewable energy scenarios. Algae cultivation and mineralisation occupy significantamounts of land. Most emerging uses come with high technology risks and capital requirements.In the CCU portfolio, only UREA yield boosting and enhanced oil recovery may be consideredmature technologies, with known cost characteristics, capital requirements and moderate tech-nological risks [Fig. 4].
Fig. 4: Maturity and Investment Risk Curve
Research Development Demonstration Deployment Mature Technology
Athmospheric Capture
Cement & SteelMineralisation
ECBM
Power PlantCapture
Industrial Hydrogen
Passive Storage
Gas Processing w/ CCS
UREA
EOR
Time Axis
Polymers
RESMethanolAlgae
CO2Pipe-
lines
Lab Work Bench Scale Pilot Scale Large Widely Commercial deployed
EGS
Cap
ita
l R
eq
uir
em
en
t / T
ech
no
log
y R
isk
Source: Inagendo Update of SBC 2011, GCCSI 2011, CFLCF 2011
2. Mature CCU Technologies
2.1 Enhanced oil recovery (EOR)
2.1.1. Definition and Scope
Contrary to widespread perception, oil fields are no underground caverns “filled” with oil. Theoil is rather contained in porous geologic formations - limestone, dolomite, and sandstone. Pri-mary recovery, using natural reservoir pressure, typically releases 10 to 15 percent of the Origi-nal Oil in Place (OOIP), leaving 85 to 90 percent of the oil trapped in the underground.
Second phase recovery involves the injection of fluids, typically water or hot water, to repres-sure the well and extract an additional 8 to 28 percent of the remaining oil [API 2007; ARI2010]. Water flooding has been the technique applied in the North Sea Graben (NSG) oil fieldsof Norway and the United Kingdom since 1979. NSG light oil lends itself to water flooding,eventually releasing about 40 percent of the OOIP [SCCS 2009, DIW 2013].
Since water does not mix with oil, 57 to 82 percent of the OOIP yet remain unrecovered. Start-ing in the 1970s, exploration companies deployed third phase recovery techniques (enhancedoil recovery), to extend lifetime and yield of the fields. 3rd phase techniques seek to alter thephysical commodity of the remaining oil, such as viscosity. They involve low saline water,polymers, surfactants (surface active agents), microbials, nanoparticles, and hot steam 1. Euro-pean EOR projects in Emlichheim/Germany and Schoonebeek/The Netherlands utilise hot steamof 350°C to enhance oil production; five projects with hydrocarbon injection are underway in theNorth Sea Graben fields of UK and Norway. Bockstedt/Germany intends to use bio polymers toincrease oil viscosity [Koottungal 2012]. To date there are no CO2 EOR activities in the NSG.
1 For an overview of EOR techniques and fluids see Alvarado 2010

Carbon Capture Use & Storage (CCUS) 4
Among concurring EOR techniques, CO2 EOR has become the preferred EOR process globally:At high pressure and reservoir temperature CO2 mixes with the oil to form a low viscosity, lowsurface tension fluid, thus causing the oil to flow more freely (Miscible CO2). The CO2 mixedwith the incremental oil is separated and re-injected. As a side effect, 96 to 100 percent of theCO2 will eventually stay in the reservoir, providing for incidental geologic storage of CO2[GCCSI 2013b]. Due to its chemical properties, CO2 is superior to water-flooding: CO2 mayinvade zones not previously invaded by water, releasing 53 to 82 percent more incremental oilthan best-case water flood techniques [API 2007; Melzer 2012][Fig. 5].
Fig. 5: Incremental Oil Recovery by Recovery Mechanism
Stage Technology / FluidsOOIP Recovery
(in % of OOIP)
Primary Natural Reservoir Pressure 10 - 15 %
SecondaryRepressure Fluids (Water flooding, Hot
Water, Hydrocarbons)8 - 28 %
ThirdMiscible CO2 EOR, Hot Steam,
Polymers, Microbial8 - 23 %
74 - 36 % Remaining OOIP
Sources: API 2007, ARI 2011
The CO2 EOR technology was patented to Atlantic Refining Company in 1952. In 1972, thefirst commercial CO2 EOR project was initiated at SACROC Unit of Kelly-Snyder field in thePermian Basin 2. CO2 for the first projects came from natural gas processing facilities. In the1980s, the construction of CO2 pipelines - connecting natural CO2 source domes in New Mex-ico and Colorado to wells in Texas - opened up significant amounts of inexpensive CO2 andjump-started wide deployment of CO2 EOR. This sparked a 3,000 mile Texas-wide CO2 net-work, with hubs and spokes that allow for low-cost extensions “within striking distance” (up to200km), providing for significant economies of scale. As of 2013, 70 MtCO2pa are used in 126CO2 EOR projects in the USA, with CO2 pipelines extending 4,000 miles and cumulated CO2net injections amounted to 800-900 MtCO2 [Fig. 6]. 68 EOR projects are amassed in the Per-mian Basin, accounting for two thirds of the world oil production from EOR [ARI 2010].
Fig. 6: EOR Projects, CO2 Sources and Pipelines in the US (2010)
Source: NEORI 2012, ARI 2010
In 2012, CO2 EOR produced 309,000 bbl/day and accounted for 5 percent of US crude oil pro-duction [Koottungal 2012, USCSC 2012]. A third of the CO2 originates from anthropogenic
2 SACROC is still operative, with an enhanced oil production of 26.530 bbl/ day

Carbon Capture Use & Storage (CCUS) 5
sources, with natural gas processing providing two thirds [Fig. 7]. It should be noted that CO2from anthropogenic sources (23.5 MtCO2pa) compares to 1.3 percent of the annual power plantCO2 emissions in the US, which amount to 2 GtCO2pa.
Fig. 7: Source of CO2 for EOR in the US
Natural
CO2
Anthropogenic
CO2
Total
CO2
Texas
Utah
Oklahoma Fertilizer
New Mexico Gas Processing
Colorado
Kansas
Wyoming
Mississippi
Louisiana
Oklahoma Fertilizer 1.0 1.0
Michigan Ammonia Plant 0.1 0.1
Saskatchewan Coal Gasification 3,0 0,0
Total 47.0 23.5 70.5
17.0Geologic 17.0
Gas Processing 8.0 8.0
Storage Site Source TypeCO2 Supply (Mtpa)
Geologic
30.0 11.4 41.4
Source: Inagendo Update of ARI 2011, based on GCCSI 2013c data
Outside the US, Koottungal 2012 lists six commercial CO2 EOR projects in Canada, three inBrazil - with a fourth project commencing operations in 2013 [GCCSI 2013cd] -, five in Trini-dad, and one in Turkey. Alvarado 2010 reports CO2 pilot injection at Ivanić Field in Croatiaand Hungarian pilots at Budafa and Lovvaszi fields. Szank Field in Hungary utilised CO2 froma sweetening plant. In China, EOR technology is applied in two CCUS projects: Tianjin DagangCCS Project, a 330 MW power unit, and SINOPEC’s CO2 Capture & EOR pilot in the Shenglioil field, with six additional EOR projects underway [Gu 2013, GCCSI 2013cd].
2.1.2 CO2 EOR: Cost Economics
The deployment of CO2 EOR in the US was driven by low drilling costs onshore, availability ofcheap CO2, and tax incentives at State and Federal level. Tax rates on conventional oil in Texasare at 4.6 percent, with a reduced rate of 1.15 percent for use of anthropogenic CO2. By contrast,oil royalties in Europe (DK, UK, NOR) amount to 33 to 50 percent, in addition to corporatetaxes: Overall oil tax in the UK amounts to 81 percent [SCCS 2013; NEORI 2012].
Unlike in offshore operations, where brine for 2nd phase recovery is a free resource, waterflooding in onshore environments comes with considerable water costs: In half the CO2 EORprojects, the CO2 cost per barrel of incremental oil – given a 53 to 82 percent yield superiorityover water-flooding – caused projects to move directly from primary to 3rd phase EOR produc-tion, and bypass 2nd phase water-flooding altogether [Koottungal 2012].
In the absence of a carbon price signal for incidental CO2 storage, the commercial viability ofCO2 EOR has traditionally been a function of CO2 cost and oil price [Fig. 8], weighted offagainst the amenability for EOR: Amenability is expressed by the EOR recovery efficiency, asthe amount of the incremental OOIP that may be redeemed, and the share of CO2 injected perbarrel of incremental oil. Incremental recovery is driven by
• the prevalent lithology of the geologic formation - in terms of porosity and permeability,
Carbon Capture Use & Storage (CCUS) 6
• the depletion efficiency of second phase recovery, if any, and thus the remaining OOIP, and
• the expectation whether capital costs associated with EOR refurbishment and pipelinesmight be recovered over the duration of the project.
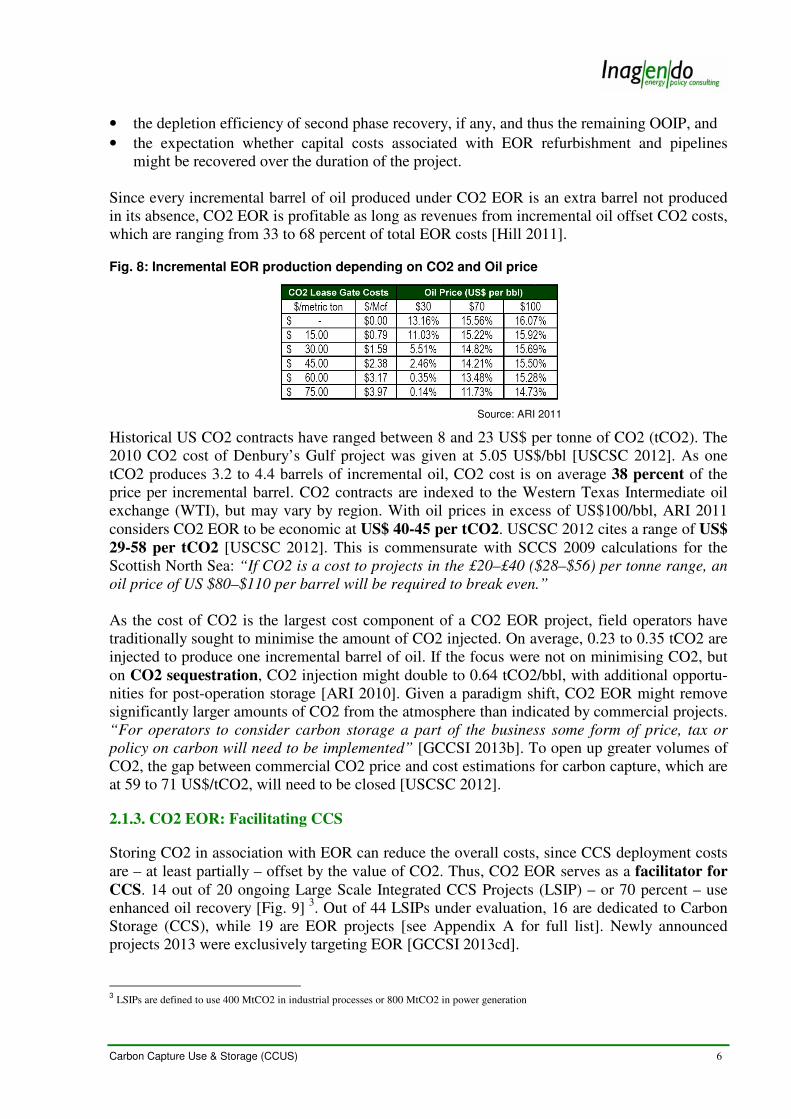
Since every incremental barrel of oil produced under CO2 EOR is an extra barrel not producedin its absence, CO2 EOR is profitable as long as revenues from incremental oil offset CO2 costs,which are ranging from 33 to 68 percent of total EOR costs [Hill 2011].
Fig. 8: Incremental EOR production depending on CO2 and Oil price
Source: ARI 2011
Historical US CO2 contracts have ranged between 8 and 23 US$ per tonne of CO2 (tCO2). The2010 CO2 cost of Denbury’s Gulf project was given at 5.05 US$/bbl [USCSC 2012]. As onetCO2 produces 3.2 to 4.4 barrels of incremental oil, CO2 cost is on average 38 percent of theprice per incremental barrel. CO2 contracts are indexed to the Western Texas Intermediate oilexchange (WTI), but may vary by region. With oil prices in excess of US$100/bbl, ARI 2011considers CO2 EOR to be economic at US$ 40-45 per tCO2. USCSC 2012 cites a range of US$29-58 per tCO2 [USCSC 2012]. This is commensurate with SCCS 2009 calculations for theScottish North Sea: “If CO2 is a cost to projects in the £20–£40 ($28–$56) per tonne range, anoil price of US $80–$110 per barrel will be required to break even.”
As the cost of CO2 is the largest cost component of a CO2 EOR project, field operators havetraditionally sought to minimise the amount of CO2 injected. On average, 0.23 to 0.35 tCO2 areinjected to produce one incremental barrel of oil. If the focus were not on minimising CO2, buton CO2 sequestration, CO2 injection might double to 0.64 tCO2/bbl, with additional opportu-nities for post-operation storage [ARI 2010]. Given a paradigm shift, CO2 EOR might removesignificantly larger amounts of CO2 from the atmosphere than indicated by commercial projects.“For operators to consider carbon storage a part of the business some form of price, tax orpolicy on carbon will need to be implemented” [GCCSI 2013b]. To open up greater volumes ofCO2, the gap between commercial CO2 price and cost estimations for carbon capture, which areat 59 to 71 US$/tCO2, will need to be closed [USCSC 2012].
2.1.3. CO2 EOR: Facilitating CCS
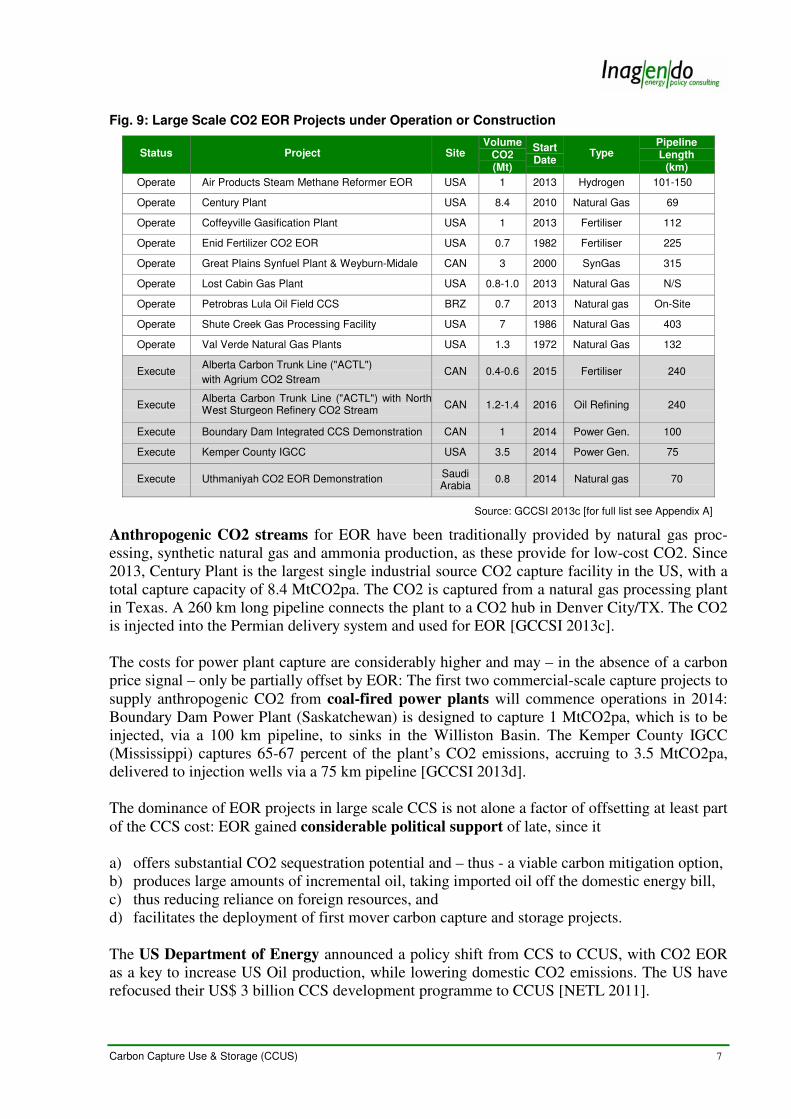
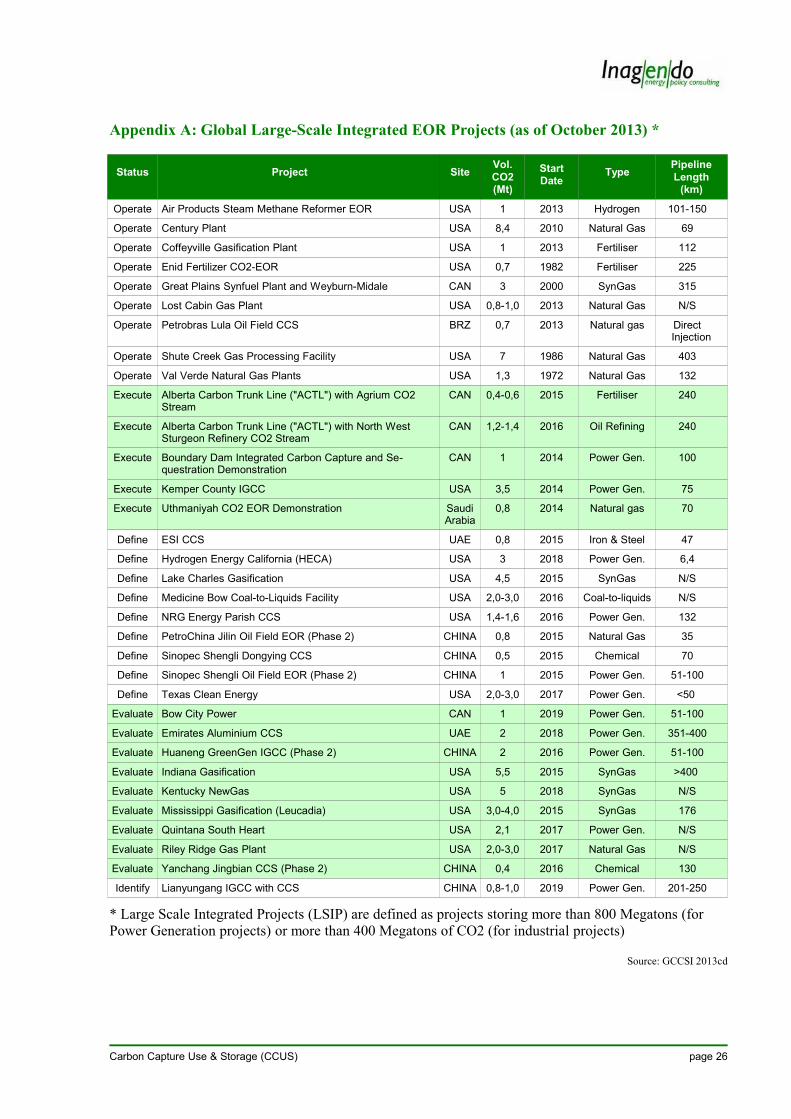
Storing CO2 in association with EOR can reduce the overall costs, since CCS deployment costsare – at least partially – offset by the value of CO2. Thus, CO2 EOR serves as a facilitator forCCS. 14 out of 20 ongoing Large Scale Integrated CCS Projects (LSIP) – or 70 percent – useenhanced oil recovery [Fig. 9] 3. Out of 44 LSIPs under evaluation, 16 are dedicated to CarbonStorage (CCS), while 19 are EOR projects [see Appendix A for full list]. Newly announcedprojects 2013 were exclusively targeting EOR [GCCSI 2013cd].
3 LSIPs are defined to use 400 MtCO2 in industrial processes or 800 MtCO2 in power generation
Carbon Capture Use & Storage (CCUS) 7
Fig. 9: Large Scale CO2 EOR Projects under Operation or Construction
Status Project SiteVolume
CO2(Mt)
StartDate
TypePipelineLength
(km)
Operate Air Products Steam Methane Reformer EOR USA 1 2013 Hydrogen 101-150
Operate Century Plant USA 8.4 2010 Natural Gas 69
Operate Coffeyville Gasification Plant USA 1 2013 Fertiliser 112
Operate Enid Fertilizer CO2 EOR USA 0.7 1982 Fertiliser 225
Operate Great Plains Synfuel Plant & Weyburn-Midale CAN 3 2000 SynGas 315
Operate Lost Cabin Gas Plant USA 0.8-1.0 2013 Natural Gas N/S
Operate Petrobras Lula Oil Field CCS BRZ 0.7 2013 Natural gas On-Site
Operate Shute Creek Gas Processing Facility USA 7 1986 Natural Gas 403
Operate Val Verde Natural Gas Plants USA 1.3 1972 Natural Gas 132
ExecuteAlberta Carbon Trunk Line ("ACTL")
with Agrium CO2 StreamCAN 0.4-0.6 2015 Fertiliser 240
ExecuteAlberta Carbon Trunk Line ("ACTL") with NorthWest Sturgeon Refinery CO2 Stream
CAN 1.2-1.4 2016 Oil Refining 240
Execute Boundary Dam Integrated CCS Demonstration CAN 1 2014 Power Gen. 100
Execute Kemper County IGCC USA 3.5 2014 Power Gen. 75
Execute Uthmaniyah CO2 EOR Demonstration SaudiArabia
0.8 2014 Natural gas 70
Source: GCCSI 2013c [for full list see Appendix A]
Anthropogenic CO2 streams for EOR have been traditionally provided by natural gas proc-essing, synthetic natural gas and ammonia production, as these provide for low-cost CO2. Since2013, Century Plant is the largest single industrial source CO2 capture facility in the US, with atotal capture capacity of 8.4 MtCO2pa. The CO2 is captured from a natural gas processing plantin Texas. A 260 km long pipeline connects the plant to a CO2 hub in Denver City/TX. The CO2is injected into the Permian delivery system and used for EOR [GCCSI 2013c].
The costs for power plant capture are considerably higher and may – in the absence of a carbonprice signal – only be partially offset by EOR: The first two commercial-scale capture projects tosupply anthropogenic CO2 from coal-fired power plants will commence operations in 2014:Boundary Dam Power Plant (Saskatchewan) is designed to capture 1 MtCO2pa, which is to beinjected, via a 100 km pipeline, to sinks in the Williston Basin. The Kemper County IGCC(Mississippi) captures 65-67 percent of the plant’s CO2 emissions, accruing to 3.5 MtCO2pa,delivered to injection wells via a 75 km pipeline [GCCSI 2013d].
The dominance of EOR projects in large scale CCS is not alone a factor of offsetting at least partof the CCS cost: EOR gained considerable political support of late, since it
a) offers substantial CO2 sequestration potential and – thus - a viable carbon mitigation option,b) produces large amounts of incremental oil, taking imported oil off the domestic energy bill,c) thus reducing reliance on foreign resources, andd) facilitates the deployment of first mover carbon capture and storage projects.
The US Department of Energy announced a policy shift from CCS to CCUS, with CO2 EORas a key to increase US Oil production, while lowering domestic CO2 emissions. The US haverefocused their US$ 3 billion CCS development programme to CCUS [NETL 2011].
Carbon Capture Use & Storage (CCUS) 8
China included CO2 EOR in its 12th Fifth Year Plan 2011. In 2013, the National Developmentand Reform Commission (NDRC) issued a note on promoting CCUS pilots. NDRC is China’sgovernmental body responsible for addressing climate change. NDRC Director General Su Wiecontended: “CCS still faces some challenges including the high cost and energy penalty andwhile costs are likely to come down as we improve our understanding and optimisation of thetechnology, the utilisation of CO2 for EOR and other industrial purposes will be important toour development pathway” 4. All six of China’s newly added CCS projects to the GCCSI data-base are designed to use CO2 EOR [see Annex A].
The United Kingdom “recognise that CO2 Enhanced Oil Recovery (EOR) could play an im-portant role in the development of some CCS projects” [DECC 2013a]. The UK Oil and GasIndustrial Strategy expects EOR to improve the oil production within the UK by 4 percent overthe next 35 years: “DECC believe that there is significant miscible gas EOR potential remainingin the North Sea, both for hydrocarbon gas and CO2 EOR, if suitable supplies of injection gascan be identified” [DECC 2013b].
2.1.4. CO2 EOR: US & Global Potentials
CO2 EOR potential is a function of wells amenable to EOR and low-cost CO2 sources “instriking distance” to injection wells. Most EOR projects to date are within a 250 km diameterfrom CO2 sources, but diameters of 750-800 km remain an economic option, if pipeline costsmight be redeemed. The availability of anthropogenic CO2 is key to explore EOR potential.
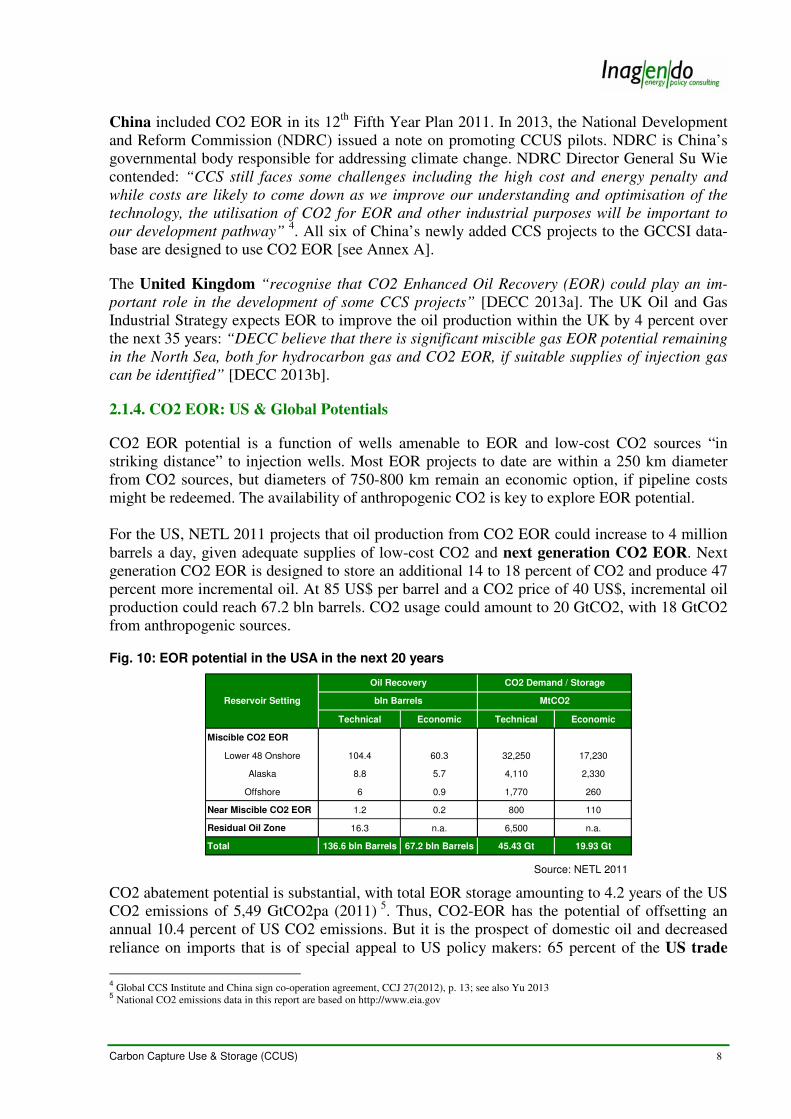
For the US, NETL 2011 projects that oil production from CO2 EOR could increase to 4 millionbarrels a day, given adequate supplies of low-cost CO2 and next generation CO2 EOR. Nextgeneration CO2 EOR is designed to store an additional 14 to 18 percent of CO2 and produce 47percent more incremental oil. At 85 US$ per barrel and a CO2 price of 40 US$, incremental oilproduction could reach 67.2 bln barrels. CO2 usage could amount to 20 GtCO2, with 18 GtCO2from anthropogenic sources.
Fig. 10: EOR potential in the USA in the next 20 years
Technical Economic Technical Economic
Miscible CO2 EOR
Lower 48 Onshore 104.4 60.3 32,250 17,230
Alaska 8.8 5.7 4,110 2,330
Offshore 6 0.9 1,770 260
Near Miscible CO2 EOR 1.2 0.2 800 110
Residual Oil Zone 16.3 n.a. 6,500 n.a.
Total 136.6 bln Barrels 67.2 bln Barrels 45.43 Gt 19.93 Gt
Reservoir Setting
Oil Recovery CO2 Demand / Storage
bln Barrels MtCO2
Source: NETL 2011
CO2 abatement potential is substantial, with total EOR storage amounting to 4.2 years of the USCO2 emissions of 5,49 GtCO2pa (2011) 5. Thus, CO2-EOR has the potential of offsetting anannual 10.4 percent of US CO2 emissions. But it is the prospect of domestic oil and decreasedreliance on imports that is of special appeal to US policy makers: 65 percent of the US trade
4 Global CCS Institute and China sign co-operation agreement, CCJ 27(2012), p. 13; see also Yu 2013
5 National CO2 emissions data in this report are based on http://www.eia.gov
Carbon Capture Use & Storage (CCUS) 9
deficit are attributed to oil imports, amounting to US$ 324 billion in 2010. CO2 EOR has thepotential to decrease US import dependency by 30-40 percent and take an annual US$ 100 bil-lion off the energy bill [ARI 2011; USCSC 2012].
In 2009, ARI estimated the global potential of CO2 EOR for the International EnergyAgency’s Greenhouse Gas R&D Programme (IEA-GHG 2009). The study identified 51 majoroil basins world-wide amenable to EOR and used US analogues to estimate incremental oil pro-duction from EOR operations and the amount of CO2 stored [IEA-GHG 2009].
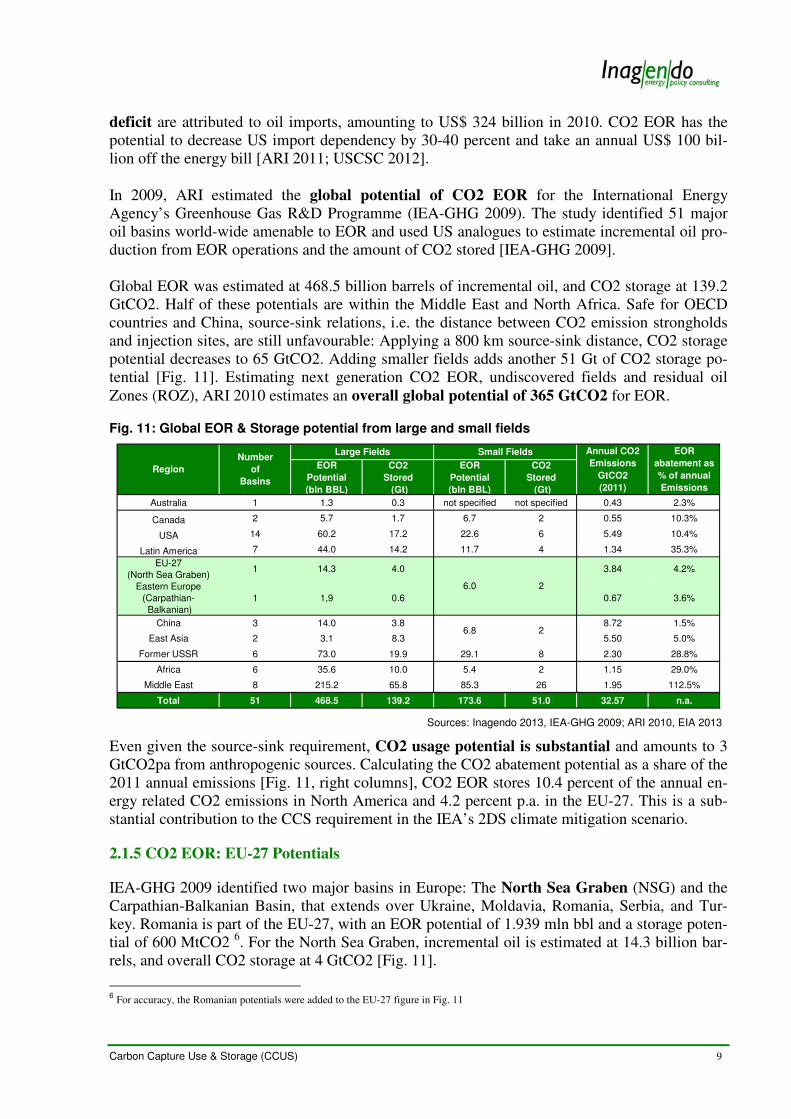
Global EOR was estimated at 468.5 billion barrels of incremental oil, and CO2 storage at 139.2GtCO2. Half of these potentials are within the Middle East and North Africa. Safe for OECDcountries and China, source-sink relations, i.e. the distance between CO2 emission strongholdsand injection sites, are still unfavourable: Applying a 800 km source-sink distance, CO2 storagepotential decreases to 65 GtCO2. Adding smaller fields adds another 51 Gt of CO2 storage po-tential [Fig. 11]. Estimating next generation CO2 EOR, undiscovered fields and residual oilZones (ROZ), ARI 2010 estimates an overall global potential of 365 GtCO2 for EOR.
Fig. 11: Global EOR & Storage potential from large and small fields
EOR
Potential
(bln BBL)
CO2
Stored
(Gt)
EOR
Potential
(bln BBL)
CO2
Stored
(Gt)
Australia 1 1.3 0.3 not specified not specified 0.43 2.3%
Canada 2 5.7 1.7 6.7 2 0.55 10.3%
USA 14 60.2 17.2 22.6 6 5.49 10.4%
Latin America 7 44.0 14.2 11.7 4 1.34 35.3%
EU-27
(North Sea Graben)1 14.3 4.0 3.84 4.2%
Eastern Europe
(Carpathian-
Balkanian)
1 1,9 0.6 0.67 3.6%
China 3 14.0 3.8 8.72 1.5%
East Asia 2 3.1 8.3 5.50 5.0%
Former USSR 6 73.0 19.9 29.1 8 2.30 28.8%
Africa 6 35.6 10.0 5.4 2 1.15 29.0%
Middle East 8 215.2 65.8 85.3 26 1.95 112.5%
Total 51 468.5 139.2 173.6 51.0 32.57 n.a.
2
Annual CO2
Emissions
GtCO2
(2011)
EOR
abatement as
% of annual
Emissions
Region
Number
of
Basins
Large Fields Small Fields
6.0 2
6.8
Sources: Inagendo 2013, IEA-GHG 2009; ARI 2010, EIA 2013
Even given the source-sink requirement, CO2 usage potential is substantial and amounts to 3GtCO2pa from anthropogenic sources. Calculating the CO2 abatement potential as a share of the2011 annual emissions [Fig. 11, right columns], CO2 EOR stores 10.4 percent of the annual en-ergy related CO2 emissions in North America and 4.2 percent p.a. in the EU-27. This is a sub-stantial contribution to the CCS requirement in the IEA’s 2DS climate mitigation scenario.
2.1.5 CO2 EOR: EU-27 Potentials
IEA-GHG 2009 identified two major basins in Europe: The North Sea Graben (NSG) and theCarpathian-Balkanian Basin, that extends over Ukraine, Moldavia, Romania, Serbia, and Tur-key. Romania is part of the EU-27, with an EOR potential of 1.939 mln bbl and a storage poten-tial of 600 MtCO2 6. For the North Sea Graben, incremental oil is estimated at 14.3 billion bar-rels, and overall CO2 storage at 4 GtCO2 [Fig. 11].
6 For accuracy, the Romanian potentials were added to the EU-27 figure in Fig. 11

Carbon Capture Use & Storage (CCUS) 10
Despite these potentials, the European Commission remains low key on CO2 EOR: EnergyCommissioner Günther Oettinger had contended that “the only existing and short term realisticuse for large amounts of CO2 is Enhanced Oil Recovery” [GCSSI 2013a]. The ongoing consul-tation on the future of carbon capture and storage considers CO2 EOR potentials to be limited:“Enhanced Oil Recovery (EOR) may help some projects, but unlike in the US and China, EORhas not been a driver for CCS deployment in Europe” [European Commission 2013]. The con-sultation paper’s reluctant outlook is based on a selective appropriation of an eight year oldstudy that precedes both, the ETS era and the IEA-GHG survey [Tzimas 2005].
Tzimas selected 59 candidate fields in the North Sea Graben, amenable to CO2 EOR. Incre-mental oil was estimated at 7.4 billion barrels, with a CO2 storage of about 1.8 to 3.1 GtCO2.Under a carbon price system, CO2 storage capacity in the UK increased to 3.5 GtCO2, and inNorway to 6.2 GtCO2. The economic potentials were considered considerably lower, but – at thetime of the study – oil prices were on a low.
In the mid-2000s, a number of European EOR proposals failed as well: 2006, Shell and Statoilannounced to develop a large scale CO2 EOR project on Draugen and Heidrun, with 2.5 MtCO2delivered by Tjeldbergodden gas power station. The project was cancelled due to unfavourableeconomics and lack of CO2 supply. CO2 EOR potentials at Gullfaks and Ekofisk fields in theNorwegian shelf have been explored, but none has been pursued. In order to develop CO2 EORinfrastructure for the Norwegian North Sea oil fields, large volumes of CO2 are needed.
CO2 from Norwegian capture plants is not sufficient to meet demand and would likely require apipeline to deliver German, Benelux and French CO2 to support Norwegian CO2 operations[NPD 2010, ElementEnergy 2012, Holt 2009]. In the UK, BP had proposed to use CO2 EOR forDF1 Miller, but the proposal collapsed due to unfavourable economics [ElementEnergy 2012].
These proposals failed possibly due to their early mover status: The window of opportunity forCO2 EOR is tied to an oil price level of about 100 US$/bbl [SCCS 2009, Holt 2009]. 2012DECC forecasts estimate future oil prices at US$135/barrel, with a low oil price scenario atU$75/bbl. Current oil prices hover around 105 US$/bbl. Hence, the window of opportunity isnow open, but may close by 2020, when some NSG oil fields are about to be decommissioned.
There are two proposals including CO2 EOR in the North Sea in the EU’s New Entrant Reserveprogramme for CCS demonstration (NER300): 2Co’s Don Valley CCS Project in South York-shire intends to capture up to 5 MtCO2pa from an IGCC power plant. The CO2 will be trans-ported over a 400km CO2 pipeline to two North Sea Oil fields, short of decommissioning. EORoperations are expected to yield an additional 15 percent of OOIP and extend production for an-other 20 years. The project failed to make the first NER-300 award in December 2012, but maybe considered for the 2nd call in 2014.
Outlooks of recent studies, based on contemporary oil prices, are favourable: SCCS 2009 sug-gests that “CO2-EOR may act as a stimulus for CCS especially if developers come to expect thatthe price of oil will remain over US$100 per barrel for the period of their investment.” Like-wise, Holt 2009 contends that, for oil prices in the range of US$ 100, the CO2 price is close tothe cost of CO2 capture [Fig. 12].

Carbon Capture Use & Storage (CCUS) 11
Fig. 12: Range of Carbon Capture Costs over the value chain
Componentt/CO2
min
t/CO2
max
Capture at Power Plant 11.00 € 55.00 €
Capture from Flue Gas 3.70 € 41.00 €
Industrial Capture 18.75 € 86.25 €
Transport 0.70 € 8.00 €
Geological Storage 0.30 € 9.00 €
Monitoring 0.10 € 0.30 €
Source: IPCC 2005, IEA 2008
A number of 2009ff studies on a national and regional scale have provided up-to date estima-tions on North Sea EOR potentials. They found substantial potential for CCUS and associatedbenefits, especially in incremental oil and for EOR as an accelerant for CCS [Fig. 13].
Fig. 13: Peer Review on Incremental Oil and CO2 Storage in the North Sea
SourceCandidate
Fields
High Oil
Price
Scenario
Increment Oil
[billion barrels]
EOR CO2
Storage [Gt]
EOR & Stacked
Storage [Gt]
Mattiassen 2003 128 Candidate Fields n.a. 2.0 0.65 n.a.
Tzimas 2005 59 Fields (UK,NOR,DK) 35 US$/bbl 7.4 3.10 9.7
SINTEF 200719 NOR Fields
30 UK Fieldsvariable 4.3 2.30 7.3
Holt 2009Select Norwegian and
UK Oil Fields90-160 US$ 4.1 to 4.4 2.28 7.3
IEA-GHG 2009 North Sea Graben 70 US$/bbl 14.3 4.00 8.0
SCCS 200914 Fields (Scottish North
Sea)100 US$/bbl 3.0 0.99 n.a.
Godec 2011 North Sea Graben 70 US$/bbl 16.2 4.70 n.a.
ElementEnergy 201219 Fields (UK
Continental Shelf)90 US$ 6.8 2.10 n.a.
54 UK Fields 1.7 0.57
7 NOR Fields 1.0 0.31
13 DK Fields 1.1 0.35
DIW 2013 92 - 135 US$/bbl n.a.
Inagendo 2013
In general, regional estimates on the North Sea Graben EOR potential yield more cautious re-sults than IEA-GHG 2009, for two reasons:
• First, the IEA-GHG data is based on US analogues, with favourable specifics that do notmirror NSG offshore environments. Offshore operations are high-cost operating areas.NETL 2010b analysed offshore potentials in the Gulf of Mexico. Albeit technical potentialsamounted to 5.8 billion barrels and 1.7 GtCO2 storage, only 730 million barrels and 200MtCO2 were economic at an oil price of US$70/bbl and a CO2 price of US$45/t. NETL2010b, thus, contends that offshore operations require higher oil prices of 100 US$/bbl,lower CO2 costs (35 US$/tCO2) and reduced royalties or credits for the storage of CO2.
This is commensurate with recent North Sea studies which put the threshold for an economicapplication of CO2 EOR in the North Sea Graben at an oil price of US$ 100 [Holt 2009,SCCS 2009, ElementEnergy 2012]. This is due to the fact that storage costs in offshore envi-ronments tend to be two to three times as high as onshore storage [Fig 14].

Carbon Capture Use & Storage (CCUS) 12
Fig. 14: Storage Costs On/Offshore
RegionOn-Shore /
Off-Shore
t/CO2
min
t/CO2
max
USA onshore 0.30 € 3.40 €
Europe onshore 1.40 € 4.60 €
Europe offshore 3.50 € 9.00 €
Source: IAE 2008; IPCC 2005
• Second, many NSG fields have already been extensively water flooded. On average, primaryand secondary oil recovery by water flood from NSG oil fields accounts for 45% to 55% ofthe OOIP [SCCS 2009, DIW 2013]. Thus, incremental oil production from CO2 EOR mightbe lower than assumed by IEA-GHG 2009 [Fig. 15].
Fig. 15: Incremental Recovery Factor of CO2 EOR in the North Sea Graben
Source
Incremental Recovery Factor
from CO2 EOR
In Percent of OOIP
Godec et al (2011) 11 percent (average Europe)
IEA-GHG (2009) 23 percent (Next Generation CO2 EOR)
Scottish Center for Carbon Storage (2009) 5 to 15 percent (Scotland)
ElementEnergy et al (2012) 7 to 11 percent (UK,NOR)
Holt et al (2009) 8.8 percent
Tzimas et al. (2005) 4 to 12 percent
Source: Inagendo Update of DIW 2013
Still, NSG estimates provide for substantial potentials in incremental oil and CO2 storage:SCCS 2009 identified 14 candidate fields amenable to EOR for the Scottish part of the NSG.EOR potential, including Statfjord field (UK/Norway), was estimated at 3,018 mln barrels ofincremental oil and CO2 storage at 994 MtCO2. SCCS contends that – at CO prices from 28 to56 US$ - CO2 EOR needs an oil price level above 100 US$/bbl. Eunomia 2011 identifiedsmaller EOR opportunities in the East Irish Sea. Three producing oil fields in the LiverpoolBay are amenable to CO2 EOR, with a total CO2 storage capacity of about 150 MtCO2.
ElementEnergy 2012 identified 19 oil fields in the UK Continental Shelf (UKCS) as ‘anchor’projects for CO2 EOR. Incremental oil recovery was estimated at 6.8 billion barrels, with a CO2storage of 2.1 GtCO2. A cluster of CO2 EOR projects could contribute 15 percent of UKCS oilproduction in 2030. Holt 2009 estimated EOR potentials of 19 UK and 30 Norwegian fields,with a 70 percent overlap with the fields considered by ElementEnergy 2012. Holt estimationsdeliver conservative results, assuming average recovery efficiency at 8.8 percent of OOIP, whilefield-by-field assessment of ElementEnergy result in an average 10 percent of OOIP.
Holt 2009 gives EOR potential at 4.1 to 4.4 billion barrels and CO2 storage at 2.28 GtCO2, plusan additional 5.1 GtCO2 in stacked storage: Holt, thus, estimates an annual injection of 178MtCO2pa, to support EOR production over a lifetime of 15 to 20 years. In the remaining years,CO2 injection is targeted to incremental storage. Calculating CO2 costs at 27 US$/tCO2, the oilprice level for economic operation was found to be at 70 US$/bbl. If the CO2 price were at alevel to support power plant capture, i.e. above 57 US$ per tCO2, an oil price level of 100US$/bbl were necessary to support EOR operations. In that case, Emden/Germany and Aber-deen/UK could be used as export terminals, collecting CO2 streams from West Europe and the
Carbon Capture Use & Storage (CCUS) 13
UK to injection wells in the North Sea fields under consideration. Average transport costs viapipeline amount to 6 US$/tCO2, with sequestration costs of 4.0 US$/tCO2.
DIW 2013 analysed CO2 EOR potentials in 74 oil fields in the UK, Norwegian and Danishparts of the North Sea. For UK and Norway, DIW 2013 assumed a rather conservative recov-ery factor of 4 percent of the OOIP. Recovery factor for DK fields was set at 8 percent, as Dan-ish fields have not been extensively water flooded. EOR potentials were calculated at 3.8 billionbarrels of incremental oil and CO2 storage at 1.23 GtCO2. These potentials seem conservative,since EOR recovery factors from the Heriot Watt database for the UK and Norwegian fields arealigned around 10 percent of the OOIP [ElementEnergy 2012].
DIW 2013 also estimated the costs of CO2 delivered to well-head. Costs range between 67€ and83€ per tCO2. DIW concedes that CO2 costs are possibly overestimated. US analogues assumea CO2 price in the range of US$ 29 to 58, given an oil price level of about US$ 100 [USCSC2012]. DIW indicates that investments in CO2 EOR operations in the NSG are beneficial in allscenarios, especially so under a high oil price scenario: In such a scenario, CO2 EOR wouldserve to initiate investments in a pipeline infrastructure in the North Sea for the first 25 years.Upon cessation of EOR operations, the infrastructure might then be used for CCS.
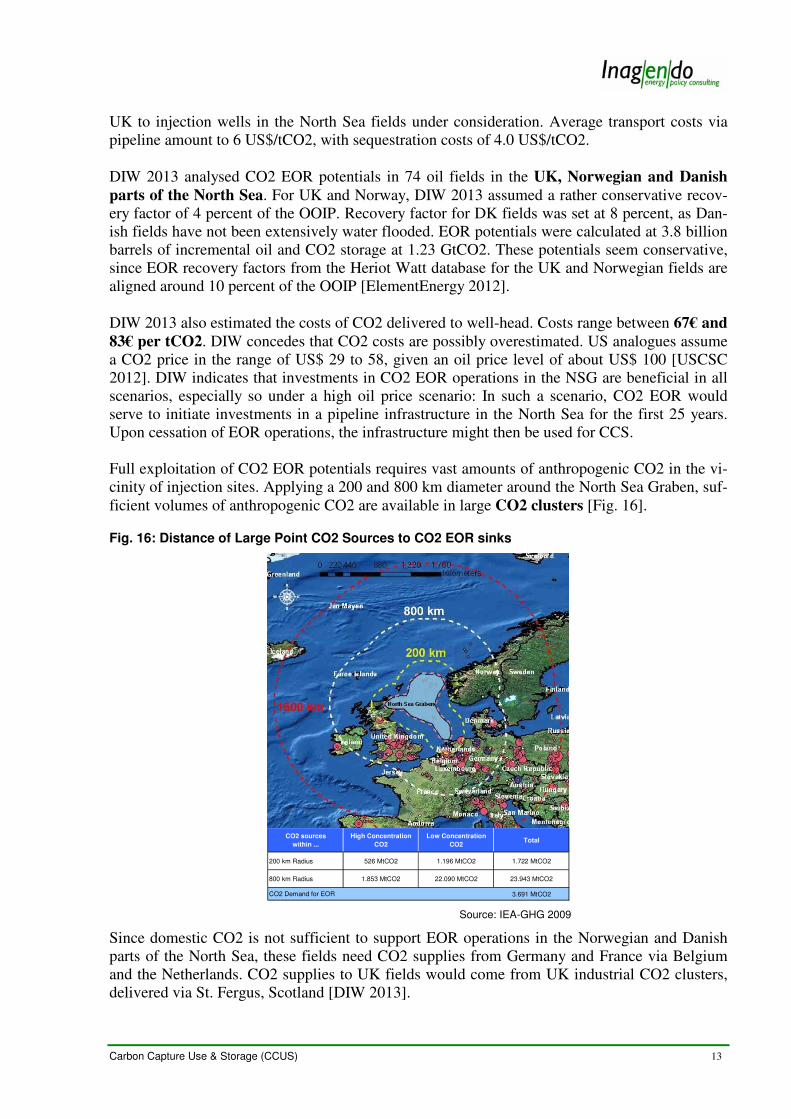
Full exploitation of CO2 EOR potentials requires vast amounts of anthropogenic CO2 in the vi-cinity of injection sites. Applying a 200 and 800 km diameter around the North Sea Graben, suf-ficient volumes of anthropogenic CO2 are available in large CO2 clusters [Fig. 16].
Fig. 16: Distance of Large Point CO2 Sources to CO2 EOR sinks
CO2 sources
within ...
High Concentration
CO2
Low Concentration
CO2Total
200 km Radius 526 MtCO2 1.196 MtCO2 1.722 MtCO2
800 km Radius 1.853 MtCO2 22.090 MtCO2 23.943 MtCO2
3.691 MtCO2CO2 Demand for EOR
Source: IEA-GHG 2009
Since domestic CO2 is not sufficient to support EOR operations in the Norwegian and Danishparts of the North Sea, these fields need CO2 supplies from Germany and France via Belgiumand the Netherlands. CO2 supplies to UK fields would come from UK industrial CO2 clusters,delivered via St. Fergus, Scotland [DIW 2013].

Carbon Capture Use & Storage (CCUS) 14
SCCS 2013 cites the lack of available high-purity CO2 as an essential hurdle and suggests theprioritised use of CO2 released from Ammonia. CO2 from Ammonia has already been separatedduring production, making 5.42 Mt of high purity CO2 available in less than 200km distanceoff available storage fields off the coast of the Netherlands and North England.
The principal beneficiaries of CO2 EOR clusters in the North Sea would be the governments ofthe UK, Norway and Denmark, as a result of the taxes applied to the offshore industry. Taxreceipts could in principle be offset against public subsidies for CCS. CO2 EOR could, thus, bean enabler for CCS [ElementEnergy 2012]. UK, DK, and NOR governments should also con-sider to introduce a reduced oil tax rate for the use of anthropogenic CO2, as exemplified byTexas. Moreover, CO2 EOR could take 300-544 billion € off the EU-27 energy bill and de-crease reliance on imported oil from politically unstable regions. Countries with no onshore-CCS storage, like France, or onshore storage moratoriums, like the Netherlands and Germany,might profit from the sale of CO2 to NSG EOR oil fields in Norway and Denmark.
2.1.6 European CO2 Abatement Potential of CO2 EOR
There is quite some debate – if not to say highly polarised controversy – around CO2 EOR asan accredited mitigation strategy to combat climate change. Concerns are whether CO2 EORmay be considered a genuine GHG abatement option at all, and the sequestered CO2 will bepermanently removed from the atmosphere, regarding CO2 leakage and long-term retention.
Opponents claim that CO2 EOR is not a GHG abatement option, but, on the contrary, results inmore, not less, CO2 emissions. Their case is that CO2 EOR produces significant amounts of“additional oil” that will eventually be combusted. Proponents hold that incremental oil fromEOR displaces oil that would otherwise be produced by conventional means. Traditional oil ex-ploration produces twice the amount of CO2 than attributable to EOR. Edge 2011 conducted alife cycle assessment on the Weyburn-Midale EOR project and assessed CO2 emissions over thevalue chain at 0.51 tCOe per 1 tCO2 stored. Compared to traditional oil, 49 percent of overallemissions were saved. Individual oil fields will have greater capacity to store CO2 than resultsfrom an EOR operation. Hence, next generation EOR and post-operation storage might removesignificant larger amounts of CO2 from the atmosphere, than generated by the incremental oil,ranging between 74 and 129 percent of the CO2 emitted during EOR operations [Fig. 17].
Fig. 17: Life Cycle Analysis of Next Generation CO2 EOR (US Gulf Coast Case Study)
Next Generation Second Generation CO2 EOR & Storage
CO2 EOR CO2 EOR Storage Total
CO2 Storage 32 MtCO2 76 MtCO2 33 MtCO2 109 MtCO2
Storage Capacity Utilisation 22 percent 53 percent 23 percent 76 percent
Oil Recovery 92 mln bbl 180 mln bbl - 180 mln bbl
% Carbon Neutral 74% 90% - 129%
Source: ARI 2010
It is safe to say that CO2 EOR increases the amount of technically recoverable reserves: As re-serves and oil prices are a system of communicating vessels, CO2 EOR inevitably increases theamount of oil available to a carbon hungry world, taking some pressure off the need to developalternative solutions. Thus, CO2 EOR is buying time away from following more risky oil ex-
Carbon Capture Use & Storage (CCUS) 15
ploration venues, such as deep-water drilling and sub-seabed oil production. It also reduces theneed to explore new sources and associated land use.
NGOs fear that CO2 EOR will extend the fossil fuel age. This is only so in a carbon unrestrainedworld. With binding climate targets in place - such as in the European Union - it is not oil pricelevel but carbon intensity that matters. Carbon intensity of North Sea EOR oil, which is aug-mented by CO2 during EOR operations, is estimated at an average 54 kgCO2e/bbl. It will mostlikely replace Saudi oil imports, with an average 40 kgCO2e/bbl, that come with no CO2 se-questration at all. Therefore, CO2 emissions reduction of NSG EOR oil, in comparison to a non-EOR scenario, amounts to 40 percent [SCCS 2013]. With incentives that account for additionalCO2 sequestered, abatement could double to 70-80 percent, with post-operation storage ex-ceeding 100 percent.
Thus, under binding European ETS targets, CO2 EOR offers a substantial carbon abatementpotential. North Sea EOR oil would likely displace imported oil in the transport sector, not yetcovered by the ETS. Here, NSG EOR oil could substitute Saudi oil, reducing CO2 emissions by40 percent and taking an annual 17 to 28 billion € off the EU energy bill.
Opponents still hold that the EOR potential of 7.3 to 8 GtCO2 for sequestration is insignificant,when compared to annual EU CO2 emissions of about 3.8 GtCO2 (2011). This is a somewhatawkward comparison: There is no single abatement technology held responsible for tackling 100percent of Europe’s CO2 emissions. Carbon abatement of CO2 EOR should be assessed relativeto the required CO2 reduction, mandated by the 30 percent reduction target of the EU: If the2030 target requires to reduce EU emissions to 2.8 GtCO2, then CO2 EOR has the potential tooffset 178 MtCO2pa – or 17.8 percent – towards that goal. This is anything but insignificant,and on par with contributions from energy efficiency and renewable energies.
Retention - that is: securing the permanent storage of the injected CO2 - is another issue: Typi-cally, during EOR operations, 40 percent of the initially injected CO2 stays within the reservoir.The CO2 returning with the produced oil is separated and reinjected. Ultimately, CO2 EOR is aloop cycle, with 94.0 to 100.0 percent of the injected CO2 finally residing in the reservoir, afterclosure of EOR operations. As oil companies have traditionally focused on incremental recov-ery, not on CO2 storage, they have implied that the injected CO2 resides permanently in the res-ervoir, since the original oil had been contained there for millions of years.
A number of projects, such as CO2SINK in Ketzin/Germany and the Weyburn IEA-GHG proj-ect, have confirmed that resilience. To identify possible risks through leakage of the CO storagereservoir, Zimmer 2011 monitored the natural CO2 emanation at the surface of Ketzin test site.Comparing the specifics of natural CO2 emanating from the soil - which can be substantial: 38tCO2/ha at Ketzin site -, and the injected CO2 allows for identifying leakage, if any, upfront.
Evidence from large scale EOR operations comes from the Weyburn-Midale EOR Project.Weyburn has been dubbed the “Poster Child” for large scale CO2 EOR operations, since it com-bines both, EOR operations and carbon mitigation: The project intends to inject 23 MtCO2 forEOR purposes, and after depletion and closure of EOR operations, another 32 MtCO2 solely forpurposes of storage (CCS), thus permanently removing 55 MtCO2 from the atmosphere. Onthe US side, the project captures about 2.8 MtCO2pa at the Great Plains Synfuels Plant in Beu-lah/North Dakota, a coal gasification plant. The CO2 is transported by a 344 km pipeline and
Carbon Capture Use & Storage (CCUS) 16
injected into two depleting oil fields in Weyburn/Canada. The project has been extensivelystudied and includes monitoring of the underground behaviour of CO2.
In 2011, there were allegations about CO2 leakage in the vicinity of Weyburn. Using isotopedating, the CO2 emanating from the ground was found to be of younger and biogenic origin,since its Carbon-14 content is absent from the isotopes of the Dakota plant CO2, used for injec-tion. Extensive samples showed no trace of CO2 of the injected kind (PTRC 2011).
Recognition of CO2 EOR as an abatement technology thus requires a) that anthropogenic CO2emissions are utilised, which would otherwise be vented into the atmosphere, b) the displace-ment of traditional oil in terms of volume (“additionality”) and c) the constant monitoring andverification of CO2 EOR operations during and after operations.
2.2. Enhanced Gas Recovery (EGR)
Enhanced gas recovery is still in its infancy and mentioned for the sake of completeness. EGRtechniques are similar to CO2 EOR. With primary production already releasing 70 to 95 percentof the original gas in place, CO2 injection rather serves to maintain reservoir pressure and in-crease the rate of gas production. Gaz de France has tested CO2 EGR on a pilot scale at itsK12B project in the Netherlands. Germany’s CLEAN project was stopped before actual opera-tions. The costs associated with separating the CO2 from the produced gas will “most likely notjustify enhanced gas recovery operations” [CSLF 2011]. CO2 separation from gas is either usedfor direct CO2 sequestration, as in the large scale In Salah, Snøhvit and Sleipner projects, or re-directed to CO2 EOR, as in the US [GCSSI 2013cd].
2.3. UREA Yield Boosting
UREA accounts for 50 percent of the global nitrogen fertiliser production. It is produced by acombination of ammonia and carbon dioxide at high pressure and temperature. CO2 captureplants for urea yield boosting have been installed since the late 1990’s. Production of UREAamounted to 151.9 Mtpa in 2009, and is growing strongly in China (65 Mtpa) and India (25Mtpa). Global CO2 demand for UREA amounts to 100 MtCO2pa [GCSSI 2011]. For everytonne of urea produced, 0.73 to 0.75 tCO2 are utilised, but production results in 2.27 tCO2emitted per 1 tCO2 supplied [Edge 2011].
The production results in negative carbon abatement, with fertilisers being the major source ofagricultural CO2e-Emissions. UREA yield boosting, thus, may be considered a modest CO2 re-use application, but not a viable carbon abatement option.
3. Emerging Uses
3.1. Enhanced Coal Bed Methane (ECBM)
CO2 ECBM technology is similar to EOR. Carbon dioxide is injected into the coal seam, even-tually releasing incremental methane (CH4). CO2 ECBM has the potential to increase methaneproduction to 90 percent of the gas in place, compared to conventional recovery of 50 percent byreservoir pressure [DOE 2012]. Unmineable coal beds also provide for a large CO2 sequestra-tion potential, as the CO2 is absorbed and permanently retained by the coal.

Carbon Capture Use & Storage (CCUS) 17
CO2 ECBM is associated with some hindrances that have hitherto prevented its wide applica-tion: Coal may swell with the adsorption of CO2, which will reduce the permeability, thus re-stricting application to depths between 800 and 1000m [Bachu 2008]. This explains the limitedsuccess of pilot operations for CO2 storage in coal beds run in Canada, Poland, China and Japan[IPCC 2005]. The US Department of Energy foresees large scale application of ECBM for thetime past 2025 [DOE 2010]. Incremental recovery efficiency of CO2 ECBM depends on res-ervoir characteristics, with 1.5 to 10 cubic meter of CO2 injected for every cubic meter of CH4released, and a base case of 2 units CO2 per unit CH4 [IPCC 2005].
Albeit yet small in application, the theoretical potential of ECBM is significant: Incrementalmethane is estimated at 18 trillion cubic metres (Tm3), with a global sequestration potential of345 GtCO2. DOE 2012 estimates the US potential at 60 to 117 GtCO2. CO2 ECBM is consid-ered to be economic at natural gas prices of US$ 62 to US$ 71 per cubic meter, with capture,transport, and sequestration costs under US$50/tCO2 [NCC 2012]. Given the boom of US shalegas, which also impedes the economics of US EOR, it is unlikely that ECBM will reach an eco-nomic scale before the medium to long term, if not carbon price incentives for the associatedCO2 storage offset some of the costs that come with its application.
ECBM is of special appeal to countries with a) large coal resources, b) increasing energy de-mand and c) ensuing CO2 emissions, such as China and India. Estimations of China potentialshold that 143 GtCO2 may be stored, sequestering 16 years of Chinas 2011 CO2 emissions (8.17GtCO2). The production of methane from ECBM is estimated at 3.4 to 3.8 Tm3, with the addi-tional benefit of substituting coal as a major energy source. CO2 emissions from methane com-bustion are at average 60 to 70 percent lower than from coal fired power plants. Thus, a fuelswitch from coal to methane would significantly reduce China’s coal-based CO2 emissions,thereby providing some climate mitigation potential [CSLF 2011; GCCSI 2011].
3.2. Enhanced Geothermal Systems (CO2 EGS)
CO2 EGS is a novel technology that enables energy production from formations that would oth-erwise not be suitable as a geothermal energy source. CO2 mobility in micro-porous environ-ments is five times superior to water and 10 times superior to brine, thus exploiting heat fromlow-permeable zones, previously not accessible [IEA 2013c]. The CO2 is injected into geologicformations at depths of 0.8 to 5.0 km, where it circulates as a working fluid to recover the geo-thermal heat. The heat is either transferred to a power cycle fluid or generates power through asupercritical CO2 turbine. The CO2 is then separated from any remaining water or hydrocar-bons, condensed in a heat exchanger and reinjected, closing the loop, so that no CO2 is releasedinto the atmosphere.
CO2 EGS is not only superior to traditional water/brine injections, since it reduces the need forclean water, but also avoids “parasitic” pumping of heat, which comes with a large energy pen-alty. CO2 EGS at 2.5 km depth with moderate permeability operates at 11.8 percent energy con-version efficiency; traditional water/brine operations attain only 3.4 percent, since they areplagued with energy losses due to pumping and friction 7.
Geothermal energy provides for a reliable source of baseload electricity, albeit it is the mostexpensive technology in the renewable portfolio [Fig. 18]. CO2 EGS stores substantial amounts
7 CO2 storage with geothermal energy production, CCJ 27 (2012), pp. 16ff

Carbon Capture Use & Storage (CCUS) 18
of CO2 in the underground, with a carbon abatement potential of about 56 percent. Estimationssuggest that a 10 MW power system might store around 100 ktCO2 [DOE 2012]. Commensu-rate, the Australian Geodynamics EGS project expects an annual use of 4.4 MtCO2pa for its 500MW EGS, expected by 2018.
EGS is of special appeal to countries with high geothermal activity, such as Iceland, NewZealand, Australia, and the East African Graben: Australian geothermal potential is estimated at22,000 Exajoule. EGS may provide up to 5 GW or 10 percent of Australian electricity by 2030.There is currently no information about EGS potential in Europe.
Fig. 18: Cost assumptions for renewable electricity generation
2010 2050 2010 2050
Baseload Technology
Biomass Steam Turbine 2,500 1,950 111 90
Geothermal 2,400 - 5,500 2,150 - 3,600 220 136
Large Hydro 2,000 2,000 40 40
Intermittent Renewables
Solar PV 3,500 - 5,600 1,000 - 1,600 50 13
Ocean 3,000 - 5,000 2,000 - 2,450 120 66
Wind onshore 1,450 - 2,200 1,200 - 1,600 51 39
Wind Offshore 3,000 - 3,700 2,100 - 2,600 96 68
Investment
US$/kW
O&M Cost
US$/kW p.a.
Source: IEA 2010
The most significant drawback of the technology is high cost, low maturity: The technology isnot yet proven, with a first CO2 EGS project planned for 2013 [GCCSI 2011]. IEA 2012b ex-pects significant EGS deployment in the phase past 2050: EGS is then thought to double geo-thermal electricity production from 1 500 TWh in 2050 to 3 000 TWh in 2075. For the time be-ing, EGS is not a near-term CCUS option.
3.3. CO2 as a Chemical Feedstock
As many chemicals use petrochemical feedstock for production, there are some venues to sub-stitute the carbon backbone with the carbon component of CO2 [Fig. 19].
Fig. 19: Venues for Chemicals produced from Carbon Dioxide
Source: CFLCF 2011

Carbon Capture Use & Storage (CCUS) 19
Technologies are currently in their infancy, with major drawbacks: Due to its low energy state,conversion of CO2 either requires large amounts of clean energy or better catalysts thanavailable to date [Bennet, Essen 2013].
Interesting venues, in terms of market size, are polycarbonates, polypropylene carbonates (PPC)and polymers. Traditional monomers can be combined with CO2 to produce polycarbonates,such as polyethylene carbonate and polypropylene carbonate. Polymers are traditionally pro-duced by using petroleum derived products, such as ethylene or propylene, to form polyethylene(PE) or polypropylene (PP) [DOE 2012]. CO2 may be used to synthesise polymers by trans-forming carbon dioxide, using zinc based catalysts, which react with the CO2 at low temperatureand pressure, This would provide a low energy pathway for plastics, which contain up to 50 per-cent of carbon dioxide.
Bayer of Germany announced to produce “some thousand tonnes” of polyurethane from CO2and renewable energies at its Dormagen demonstration facility from 2015, with batch-scale pro-duction envisioned for 2020. Bayer uses a zinc based catalyst and CO2 provided by an RWEpower plant to produce polyol, one of two intermediates of polyurethane. For the second inter-mediate, isocyanate, Bayer produces hydrogen from CO2, using renewable energies. The hydro-gen will in turn produce carbon monoxide, and ultimately isocyanates [Guertler, Brussels 2012].RWTH Aachen is conducting a life cycle assessment of the process, resulting in a net abatementof about 20 percent, compared to traditional production 8. As the global market for polyure-thanes is estimated at 13 Mt, replacing all fuel-based by CO2 based polyurethanes would amountto 2.6 MtCO2pa, with future potentials estimated at 3.3 MtCO2pa.
The global markets for polyethylene and polypropylene are 80Mt and 45Mt respectively, repre-senting the two largest polymer markets. Overall CO2 usage potential of chemical applicationsremains difficult to assess, due to the vast product portfolio. VDI 2009 estimated the annual po-tential at 84 MtCO2pa, with remaining insecurity about abatement. Bennet [Essen 2013] givesglobal future CO2 demand for polymers at 30 MtCO2pa and for plastics “well below” 50MtCO2pa.
These are neither substantial amounts, if compared to global emissions, nor do chemicals pro-vide for significant abatement. Abatement would require the use of excess renewable energiesand the use of CO2 of biogenic origin. Considering permanence, the CO2 content would be re-released into the atmosphere at the end of the product’s life cycle. While polycarbonates can es-sentially retain CO2 forever, the persistence of plastics is rather seen as an environmental haz-ard, not as a valuable CO2 sink.
3.4. Concrete Curing and Bauxite Residue
Global cement production amounted to 2.9 Gt in 2009, with corresponding concrete productionat 10 Gt, and substantial growth envisioned for the next decades (3.69-4.40 Gt in 2050). Theproduction of 1 tonne of cement releases 0.73 tCO2, making cement a major source of anthro-pogenic CO2 emissions, providing for 2.14 GtCO2 in 2009, amounting to 7 percent the worldtotal. The industry is, thus, attempting to reduce the carbon intensity of the product. Concretecuring is a – yet immature – technology that uses CO2 from onsite flue gases and local combus-tion sources to cure precast concrete products, replacing the traditional energy intensive steam
8 Essen Conference 2013; Welt am Sonntag, 25 Aug 2013
Carbon Capture Use & Storage (CCUS) 20
curing approach. When concrete is cured using CO2, the CO2 is converted to calcium carbonate.A US R&D programme seeks to improve the CO2 curing of precast concrete to acceleratestrength gain, reduce energy consumption, and increase durability [DOE 2012].
The technology may only be applied to precast concrete, roughly 10 percent of total concrete: Ifall concrete were carbonation treated, curing might take 0.12 tCO2 per unit or a total of60 MtCO2pa off the global emissions [GCCSI 2011]. This would but serve to offset the signifi-cant growth of the cement market until 2050; so CCS remains the only viable venue to reduceCO2 emissions from cement production.
Other CO2 abatement technologies for cement and concrete include CO2-consuming inorganicbinders as a substitute for Portland cement and the Calera process that directly mineralises CO2in flue gas to carbonates, similar to mineral carbonation [see section 3.5] 9. All technologies arein their infancy and yet unproven on a batch scale. China Huaneng & Peabody have announcedto use Calera at Xiliguole 1.2GWe supercritical coal plant to provide local building constructionmaterials [Priestnall, Essen 2013].
Treating bauxite residue with CO2 provides for another permanent CO2 storage solution. Thetechnology treats high alkaline residues from alumina production, known as “red mud”, withCO2, providing for direct carbonation. Bauxite residue is essentially a hazardous by-product,that, when treated with CO2, transforms into a harmless residue and may be used for construc-tion or soil improvement. Alcoa’s proprietary technology uses 35 kg of CO2 per tonne of resi-due. Application in the global aluminium industry, producing an annual 70Mt of red mud, wouldsequester 2.45 MtCO2pa. If focus were on storing CO2 instead of merely neutralising alkalinity,potential CO2 storage could amount to up to 0.7tCO2 per tonne of red mud, or 49 MtCO2pa.
3.5 Mineral carbonation (MC)
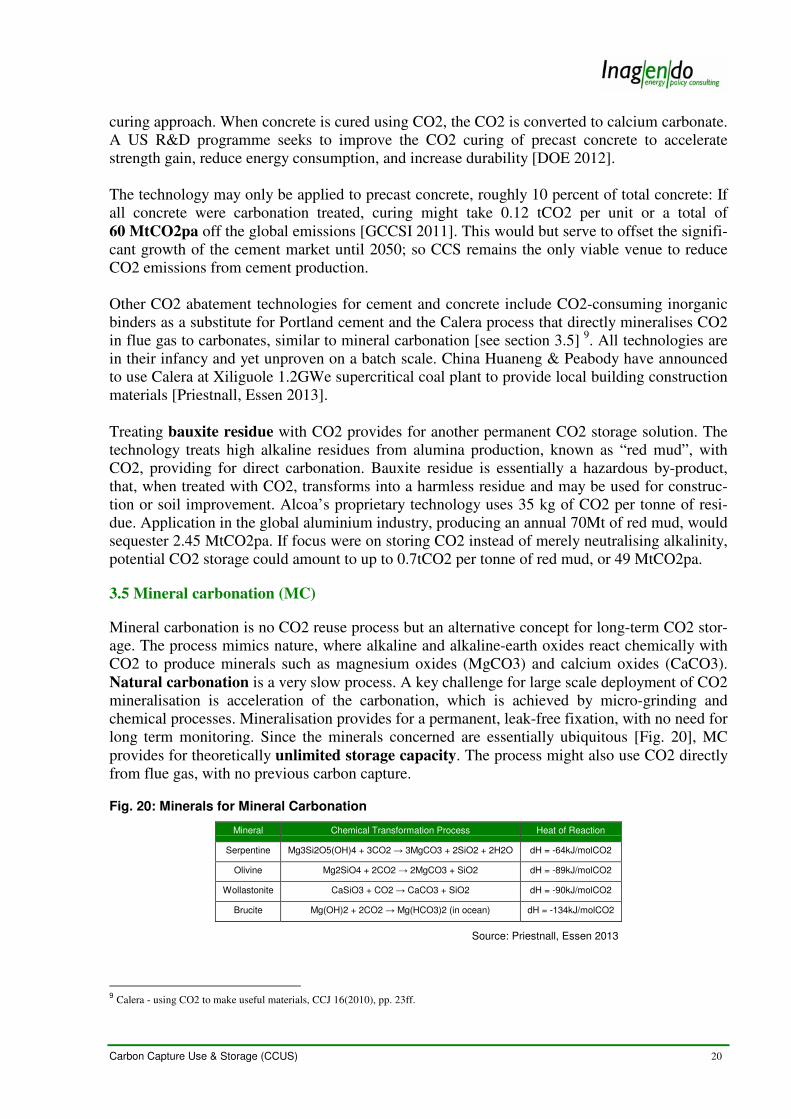
Mineral carbonation is no CO2 reuse process but an alternative concept for long-term CO2 stor-age. The process mimics nature, where alkaline and alkaline-earth oxides react chemically withCO2 to produce minerals such as magnesium oxides (MgCO3) and calcium oxides (CaCO3).Natural carbonation is a very slow process. A key challenge for large scale deployment of CO2mineralisation is acceleration of the carbonation, which is achieved by micro-grinding andchemical processes. Mineralisation provides for a permanent, leak-free fixation, with no need forlong term monitoring. Since the minerals concerned are essentially ubiquitous [Fig. 20], MCprovides for theoretically unlimited storage capacity. The process might also use CO2 directlyfrom flue gas, with no previous carbon capture.
Fig. 20: Minerals for Mineral Carbonation
Mineral Chemical Transformation Process Heat of Reaction
Serpentine Mg3Si2O5(OH)4 + 3CO2 → 3MgCO3 + 2SiO2 + 2H2O dH = -64kJ/molCO2
Olivine Mg2SiO4 + 2CO2 → 2MgCO3 + SiO2 dH = -89kJ/molCO2
Wollastonite CaSiO3 + CO2 → CaCO3 + SiO2 dH = -90kJ/molCO2
Brucite Mg(OH)2 + 2CO2 → Mg(HCO3)2 (in ocean) dH = -134kJ/molCO2
Source: Priestnall, Essen 2013
9 Calera - using CO2 to make useful materials, CCJ 16(2010), pp. 23ff.
Carbon Capture Use & Storage (CCUS) 21
Albeit mineral carbonation is an exothermic process, releasing energy, there is a substantial en-ergy penalty for crushing and milling the mineral to around 100 microns and heating forspeeding up the chemical process. Transportation of vast amounts of rock may also use substan-tial energy, if carbonation plants are not sited at mining sites.
Mineral carbonation requires 1.6 to 3.7 tonnes of rock to fix 1 tonne of CO2 and produces 2.6–4.7 t of carbonate rock per tonne of CO2. This comes with a significant land requirement, forboth, the initial mining and landfills for the final deposal, plus associated transportation costs.The environmental impact is similar to large scale surface mining operations (coal, copper).
The technology is not yet mature enough to allow for a proper assessment of costs and per-formance. IPCC 2005 indicates that CO2 abatement costs could range between 50 and 100 US$per tonne of CO2 avoided. The access to rocks for mineral carbonation, the high energy penaltyand environmental impact, and the high cost make large scale implementation unlikely before2025 [Bachu 2008].
4. Liquid Fuels
4.1. Algae Cultivation
Biological mitigation of CO2 is based on photosynthesis: Algae use CO2 and water, with energyprovided by sunlight. The resulting biomass can be used for electricity generation or as raw ma-terial for the production of transportation fuels and bio-based chemicals. Microalgae have a highbiomass productivity compared to terrestrial crops, and can be cultivated on non-arable landand in brackish water. Flue gases serve as the CO2 source and as a nutrient supply. On average,algae will absorb 1.8 tCO2 per tonne of biomass, with a carbon content of 0.5 tonnes, releasingoxygen in the process.
Microalgae are cultivated in open-pond systems or in (semi) closed photobioreactors, that aresupplied with water, nutrients and CO2. The process requires moderate amounts of energy formixing, as the biomass needs to be constantly “paddled”, to expose all algae cells to light, andsubstantial energy (10 times the energy for conventional crops) for the drying of the biomass.High Rate Algal Ponds (HRAP) are the most common method for commercial algae production,with an average cost of 10 US$/m2. Large scale open systems come with some risks, especiallycontamination issues and the associated risk of CO2 outgassing.
Semi-closed or closed photobioreactors offer a controlled environment: They may also cultivatealgae species with higher productivity, unviable in open systems. Bioreactors can be used onnon-arable land or in deserts, provided sufficient CO2 supplies. Major drawbacks are associatedcosts, which is 10 times the cost of open pond systems (> US$ 100/m2), and limited scalability.
Current global fuel production from microalgae is at 10,000 tonnes p.a., indicating the very in-fancy of the technology. Production efficiency is limited to 80 tonnes of dry biomass per hectareand year, with an energy conversion efficiency of around 1 percent. Cost estimations for micro-algae production depend on scale: At 1 ha scale the cost per kg biomass is given at 10 €/kg, at100 ha scale at 4€/kg. It is expected that learning curves will possible result in 0.60 €/kg [Bar-bosa, Essen 2013]. Prices for algae based fuels are not considered to be competitive with crudeoil equivalents until costs of algae cultivation and processing significantly decrease [GCCSI2011].

Carbon Capture Use & Storage (CCUS) 22
Albeit land requirement for algae cultivation is considerably lower than for traditional biofuelcrops [Fig 21], it is still significant, possibly prohibitive to large scale deployment in denselypopulated countries.
Fig. 21: Land Requirement for covering 50 Percent of US Fuel
CropOil yield
(L/ha)
Land Area
needed (Mha)
% of US
cropping area
Corn 172 1,540 846.0%
Soybean 446 594 326.0%
Oil Palm 5,950 45 24.0%
Microalgae 136,900 2 1.1%
Source: CFLCF 2011
The fixation of the CO2 emitted by a 600 MWe coal fired power plant with 4.38 Gt of CO2emissions p.a. would require an algae cultivation space of about 200-300 km2 [CFLCF 2011].Commercial scale systems are typically sized about 10 to 100 hectare, absorbing anywhere be-tween 500 tCO2pa to 55,000 tCO2pa. As algae production comes with substantial land require-ments, the technology is most suited to regions with high solar resource and large areas of mar-ginal land, surrounding point CO2 sources. Commensurate, the Microalgae Bio-Energy andCarbon Sequestration Project in Dalate (Inner Mongolia) is the largest pilot to date: The projectuses microalgae to absorb an annual 320 ktCO2 from coal-based flue gas to produce bio dieselas well as feed-stock.
Algae based fuels provide for no permanent CO2 abatement, as the contained CO2 is returned tothe atmosphere upon combustion. But they still offer significant abatement potential as theysubstitute fossil fuels, with a CO2 reduction of 58 percent over the life cycle [Edge 2011]. Al-beit land requirement is huge, it is still small compared to alternative crops, used for bio fuels[Fig. 21]. Moreover, algae may be grown on non-arable land and in saline-water conditions,avoiding much of the food-fuel controversy surrounding traditional energy crops, such as corn,or deforestation issues, associated with the conversion of (coastal) forests to oil palm planta-tions. Thus, algae fuels may provide a viable venue to substitute conventional bio fuels, con-sidering the growing debate over environmental and societal impacts of energy crops.
4.2. Renewable Methanol
Renewable Methanol provides for an intriguing venue for CO2 recycling that is essentially car-bon neutral. (Excess) electricity from renewable energy sources (RES) is used for the electroly-sis of water into hydrogen (H2), with subsequent catalytic conversion of H2 and CO2, resultingin methanol and water:
CO2 + 3 H2 → CH3OH + H2O
On average, 1 MWh of methane utilise 200 kg of CO2. The concept has been broadly discussedin Germany, as a possible option to store and converse excess electricity from volatile wind[IWES 2011, DVGW 2013]. With electricity storage options from pumped storage or batterybuffering limited, renewable methanol may be a venue to buffer excess RES electricity. The en-ergy efficiency of the process is still poor: Energy conversion efficiency of power to gas is 49to 64 percent, when used for electricity generation 30 to 38 percent. But if the alternative wereload-shedding, utilising excess RES electricity would preserve a third to a half of the RES value.
Carbon Capture Use & Storage (CCUS) 23
RES methanol also provides for a “bridge” from the electricity sector to the transport and heat-ing sector. RES methanol may be blended with natural gas, up to 5.0 – 6.5 percent of overallgas, using the gas pipeline grid for storage. It might also be refined into CNG fuels for the CNGautomotive market. Low efficiency and limited CNG infrastructure are a barrier to using RESmethanol in the transport sector, and electricity vehicles might offer a more energy efficient usefor RES electricity: “It is possible that in the longer-term electric vehicles will prove to be sig-nificantly cheaper.” [GCCSI 2013]
To be a commercial carbon capture and recycling option, renewable methanol requires the use ofzero cost excess renewable energy and essentially zero cost CO2: The only environment, cur-rently amenable for commercial application on a batch scale, is in geothermal systems with largeamounts of excess energy and CO2 streams, such as Iceland or New Zealand: CRI produces 5million litres of RES fuel at Iceland’s 76.5MW Svartsengi Geothermal Power Station: The plantprovides for the required power and volcanic CO2, resulting in methanol that is blended withunleaded petrol and sold at gasoline stations around Reykjavik.
Renewable methanol does not provide for permanent CO2 abatement: Upon combustion, theCO2 is returned to the atmosphere. The usage of CO2 streams from biomass CCS would resultin negative carbon emissions, as the CO2 were removed from the atmosphere by the biomass infirst place, with CCS storing the CO2 safely underground. DVGW 2013 contends that biogasplant emissions in Germany were sufficient to provide for the biogenic CO2. Still, the technol-ogy is competitive only in the absence of CCS, as CCS provides for lower CO2 abatement costs.DVGW assumes renewable methanol to be cost efficient, if production costs are on par withnatural gas and CO2 certificate costs. 2020 production costs are estimated at 0.12 €/kWh, de-creasing to about 0.07/kWh in 2050. Given the current US shale gas boom, RES methanol costswill possibly not be on par with natural gas well into the 2020s.
5. Abatement Potential of Industrial Applications
Industrial CO2 use is estimated at 115 MtCO2pa, with urea production accounting for 60% ofthat total. This represents 0.4% of the global anthropogenic CO2 emissions, amounting to 31.2Gt [IEA 2012b]. Most of the chemical applications are in nearly saturated markets, with only amodest market growth expected in the next decades.
The abatement potential of the above total is lower: Most applications do not permanently re-move the CO2 from the atmosphere, but only for the lifetime of the product, which can rangefrom days (methanol), months (Urea), to centuries for carbonates and polyurethanes. At the endof the product’s lifecycle, - which in construction could well extend 100 years -, the containedCO2 would be re-released into the atmosphere [Fig. 22].
Moreover, the use of CO2 as a carbon feedstock does not always replace fossil fuels. Due to itslow energy state, CO2 fails to provide the energy necessary for most chemical processes. Fossilreplacement energy will leave the CO2 emissions almost unchanged. Evaluated over the wholelife cycle of production, some applications cause more CO2 emissions than is saved by the ini-tial CO2 used, thus providing no carbon abatement option (such as UREA). Edge 2011 analysedthe life cycle for specific CO2 Reuse technologies to estimate their carbon mitigation potential.Figure 23 amends Edge 2011 findings with an estimation on both, the scalability of CO2 reuseand resulting abatement costs. Scalability refers to an application’s potential to uptake great

Carbon Capture Use & Storage (CCUS) 24
amounts of anthropogenic CO2. Abatement costs are an estimation of the position of a technol-ogy in a CO2 per tonne mitigation curve.
Fig. 22: Volumes and Lifetimes of industrial CO2 Use
Chemical ApplicationAnnual Market
(Mtpa)CO2 used Lifetime
UREA 129 Mt 65-70 Mt 6 months
Methanol 40 Mt 14 Mt 6 months
Inorganic Carbonates 8 Mt 3 Mt decades to centuries
Organic Carbonates 2,6 Mt 0,2 Mt decades to centuries
Polyurethanes 10 Mt < 10 Mt decades to centuries
Technological 10 Mt 10 Mt days to years
Food 8 Mt 8 Mt months to years
Sources: IPCC 2005
There is a clear indication that mineral carbonation and algae cultivation provide for substantialCO2 usage potentials, but for large scale application, the cost of applying these techniqueswould need to be considerably lowered.
Fig. 23: Volumes and Lifetimes of industrial CO2 Use (Case Studies)
CO2 Reuse Application
CO2 emitted
per CO2 used
(tCO2)
Carbon
Abatement
Potential
ScalabilityAbatement
Cost
Resulting in negative CO2 emissions (Carbon abatement option)
Carbonate Mineralisation 0.32 68% highest high
Algae Cultivation 0.42 58% high high
Enhanced Geothermal 0.44 56% low medium
Enhanced Oil Recovery (EOR) 0.51 49% high low
Bauxite Residue Carbonation 0.53 47% low medium
Renewable Methanol (biogenic CO2) 1.00medium, vs.
Traditional fuellow to medium highest
Resulting in additional CO2 emissions (no Carbon abatement)
Renewable Methanol (fossil CO2) 1.71some, vs.
traditional fuelhigh high
Concrete Curing 2.20vs. traditional
concretehigh medium
UREA Yield Boosting 2.27 no low n.a.
Formic Acid 3.96 no high n.a.
Polymers 5.52 no low n.a.
Source: Inagendo Update of Edge 2011
As Edge 2011 is based on individual case studies, Figure 23 may only give a crude approxima-tion of carbon abatement potentials. Renewable methanol and concrete curing lead to positiveemissions, but are valid CO2 abatement venues, if compared to traditional non-captive produc-tion. In order to assess these potentials, the life cycle emissions from traditional vs. CO2 Reusetechniques would have to be analysed. Concrete curing can be considered a permanent CO2 se-questration option, as it firmly removes CO2 from the atmosphere. Significant CO2 abatement,thus, requires
• the use of CO2 provided by biogenic sources (such as biomass CCS),
• the reformation of CO2 to replace fossil fuels with a lower abatement potential, and
• the use of excess renewable energy to replace fossil fuels for the necessary process energy.

Carbon Capture Use & Storage (CCUS) 25
This being said, the abatement potential of industrial CO2 use is closely linked to using CO2 ofbiogenic origin and renewable energies. The IPCC’s Special Report on CCS comes to a cautiousassessment: „The scale of the use of captured CO2 in industrial processes is too small, the stor-age times too short and the energy balance too unfavourable for industrial uses of CO2 to be-come significant as a means of mitigating climate change“ [IPCC 2005].
6. Conclusion
Carbon Capture and Use (CCU) and Carbon Capture and Cycling (CCC) are characterised by abroad portfolio of applications that do not provide for permanent storage, but may contribute toclimate change mitigation by either offsetting CO2 from traditional production or by substitutingfossil fuels. Carbon Capture, Use and Storage (CCUS) – in contrast - constitutes a viable carbonabatement option, since the CO2 is permanently removed from the atmosphere.
Most industrial uses, such as food treatment and chemical products, will remain low in scale,thus not processing significant amounts of CO2. UREA production is associated with additionalCO2 emissions. Concrete curing and bauxite residue treatment offer considerable CO2 abate-ment potential, compared to traditional production. They also provide for permanent sequestra-tion of CO2.
Enhanced oil recovery, enhanced coal bed methane, mineralisation, algae cultivation, and re-newable methanol each could use significant amounts of CO2, in excess of 300 MtCO2pa. Ofthese applications, algae and renewable methanol come with no permanent abatement, unlessthey utilise CO2 from biomass. Mineralisation is the only application virtually unlimited in scaleand retaining 100 percent of the CO2, but is associated with vast land use and high energy pen-alties, thus feasible only under excess renewable energy scenarios. Algae cultivation and renew-able methane offer the potential to recycle large amounts of CO2 and substitute fossil fuels, butare yet immature techniques, associated with high costs. Algae cultivation may have some addi-tional value in displacing traditional energy crops that are associated with detrimental environ-mental and societal by-effects.
Enhanced coal bed methane, enhanced oil recovery, and enhanced geothermal offer the addi-tional benefit of releasing otherwise unrecoverable amounts of incremental oil and methane,providing for economic benefits in the range of several trillion US$. Of these applications, en-hanced oil recovery is the only mature technology, proven in large scale commercial projects todate. Enhanced oil recovery also serves as a facilitator for large scale carbon capture and storage,at least offsetting some of the additional costs of CCS.
Given European applications, enhanced oil recovery offers significant benefits, both for Euro-pean climate targets and for decreasing dependency on imported fuels. EOR has the potential to
• contribute 17.8 percent towards the EU-27 climate mitigation goal of 30 percent in 2030;
• increase domestic oil production to substitute foreign imports, thus taking 300-544 billion €off the EU’s energy bill;
• facilitate the construction of a European CCS infrastructure, offsetting part of the CCS costs;
• develop offshore storage infrastructure, thereby decreasing public acceptance issues thatcome with onshore storage.
������������� �������������������������������������������������� ���� !∀#�∃
������ ����� ��� ����
�������
��������
����������
������� �
������� ������ �������������������������� ��� � ���� �������� ��� �!�
������� ∀��� ��#��� ��� ∃%& ���� ∋�� ��#(�� )∗
������� ∀�����+�##�(�����������#��� ��� � ���� ,����#���� ���
������� ����,����#�−��∀�� ��� ��� �%. �∗∃� ,����#���� ��!
������� (����#�������� �##������/��0 �� ����#� ∀�∋ � ���� ���(�� ��!
������� 1���∀�0��(��#��� ��� �%∃ �%� ���� ∋�� ��#(�� ∋2�
������� ����0���1 #���#,��#�∀∀� 3�4 �%. ���� ∋�� ��#��� 5�����6�7������
������� �� ��∀���8(�����������,���#��� ��� . �∗∃) ∋�� ��#(�� &��
������� 9�#9����∋�� ��#(��#���� ��� �%� �∗.� ∋�� ��#(�� ���
�:�� �� �#0����∀��0��;� �81���<=�∀;1=>?������� �∀��������
∀�∋ �%& �%) ���! ,����#���� �&�
�:�� �� �#0����∀��0��;� �81���<=�∀;1=>?���∋����/����� �������������∀��������
∀�∋ �%� �%& ���) ��#�������� �&�
�:�� �� 3� �����5��6���������∀��0��∀��� ������� ≅ ���������5������������
∀�∋ � ���& �?��(��Α ���
�:�� �� Β�����∀� ���6(∀∀ ��� �%! ���& �?��(��Α .!
�:�� �� ����������∀�����5������������ �� �����0��
�%∃ ���& ∋�� ��#��� .�
5����� ��6∀∀� ��� �%∃ ���! 6���Χ����# &.
5����� ��������������∀�#�������<��∀�> ��� � ���∃ �?��(��Α )%&
5����� 1�8�∀���#��(����������� ��� &%! ���! ���(�� ∋2�
5����� ��������3�?∀��# �� 1�≅ ���,���#��� ��� �%� �%� ���) ∀��# �� #�≅ ��� ∋2�
5����� ∋�(�����������∀∀� ��� �%& �%) ���) �?��(��Α ���
5����� ����∀����∆�#����#,��#����<�����> ∀�6∋� �%∃ ���! ∋�� ��#(�� �!
5����� ������������#�5�������∀∀� ∀�6∋� �%! ���! ∀������# .�
5����� ������������#���#,��#����<�����> ∀�6∋� � ���! �?��(��Α !� ���
5����� ;�:��∀#��������� ��� �%� �%� ���. �?��(��Α Ε!�
�+�# ��� 3�?∀����?�� ∀�∋ � ���∗ �?��(��Α !� ���
�+�# ��� ���������# ���� �∀∀� ��� � ���∃ �?��(��Α �!� &��
�+�# ��� � �����(����(��6(∀∀<�����> ∀�6∋� � ���) �?��(��Α !� ���
�+�# ��� 6������(����������� ��� !%! ���! ���(�� Φ&��
�+�# ��� Β��� �8�∋�?(�� ��� ! ���∃ ���(�� ∋2�
�+�# ��� �����������(�����������<1� �����> ��� �%� &%� ���! ���(�� �.)
�+�# ��� Γ �������� ������� ��� �%� ���. �?��(��Α ∋2�
�+�# ��� ��#�������(��#��� ��� �%� �%� ���. ∋�� ��#(�� ∋2�
�+�# ��� Η�������∆���0���∀∀�<�����> ∀�6∋� �%& ���) ∀������# ���
6������� 1���� �����6(∀∀?���∀∀� ∀�6∋� �%∃ �%� ���∗ �?��(��Α ��� �!�
�������������� ���� �������� ����������������������������� ��� ����������� ������������ ���������
������������ ��������� ����������� ������������ ������� !∀���������#� ��������� ��
��#��∃�� ���∀�%&�
∀��0��∀��� �����Χ�������<∀∀��> �����)

���������%�� ��&�������
∋∋ (����
(!�) (���������!��������∗
(� ���(����� ����
��∋��� �� #������� ∗���
� ��∋��� �� #�������� �����
+� ��∋��� �� #��,�+������� ������ �����
− ��∋��� �� #�������−��
−� ��∋��� �� #��,�−�������� �����
.� �� ����
!∀ ��∋���)��/���
!∀� ��∋���)��/����01#�2���
!∀�0 (� 0������� ���(����� �����#����� ��∋���)��/���
!∀�0�3 0�����������3��2��∗�#����� ��∋���)��/���
!∀�0!3 0�������!��3��2��∗�#����� ��∋���)��/���
+� ��4 �4��1#���
�. .�� ����3�� ���
0 (� 0������� ���(����� ����
0�3 0�����������3��2��∗
0�� 0���������� �������∗� ���
0!3 0�������!��3��2��∗
0+� �0#��������0��������+��������∗� ��
�.� �������#������
� ���� ��
� !∀ ���� ��� ��∋���)��/���
� �� ���� ������������
�� �� �����%�,�����1#������ ����
�� �� ���� ���������� ���� ��∋����� ∗�
567�� !∀ 8����#������������ ��∋���)��/���
5 !∀ 8�� ��� ��∋���)��/���
� 9 ����� ∗��9��������
���� �����4������ ���� ��������
�9� ���������9 �����������5���
� ������� ��∋��� ���
�� +��#�����#∋�����
��∋∋ ������(�����
� ���� ����
� �� ���� ������������
� !∀ ���� ����� ��∋���)��/���
� !∀�� ���� ����� ��∋���)��/������������
:�! :�����2������ ��!������� ���
:�� :�� ���������∋��
!!�� !�������!��������
3;) 3�����������)�2������
30� 3�����∋��0����∗���#���
3!< 3����#��!��<���
�∗���� �∗� �� ��:� #������
!∀ +����� ��∋���)��/���
+�& +������ #∋���� ���
=+� =�� ����+�/����� ������� ���!�����������/�
∀��0��∀��� �����Χ�������<∀∀��> �����.
���������∋���(����
92�����,�>?�� ��?��∀�%��∃�0�������!��3��2��∗∃�9��−��� ��3�2���,���∃�0��������∀�%�,�&,�%≅∀Α4
%≅Β≅,����?����?��7%ΑΑΧ4%�Β&7&7Α7%≅∀Α7���
9����∀��Β�∃��#����∗���� ��∋���)��/����0�������!��3��2��∗�� !∀0!3������ ����=��+����4
��∗,�� �∃77���?���?���7��2������� 4��� �4���4���� ∗7��2������� �4
����������7∆7�����7�Χ���%Α≅�∋���Α�≅�ΑΧ%≅Β∀∋&�Β�ΑΧΒ�?���/
93���∀�%��∃�!� ���Ε� ������� !∀�� ��������� !∀�0�������!��3��2��∗������ �,��������������� ���
�������������������������������������� �������� ����� ������ ���
93���∀�%%�∃���∋��+������∗�3�������Φ��� ��������#� �∗?��� ����9�������� � !�∀�0�������
!��3��2��∗,�
����������������������� ������� ��� ��� ��� ��!� ��∀���������� ������ �!� ��∀�!����
�� ��∀��� �!�#���
9 �� �� �#����∀�%∀��∃�−�����∗����� � �� ��∋��� �� #��,�− ��Ε� ���,������ ������)��2���∋∗� ��∋���
)��/����0�������!��3��2��∗,�� �∃77���?�#�?���7����7�#∋�� ���Γ����7��&7 −�40!3
Η∀���(%�Η∀�%�4∀∀?���
9 �� �� �#����∀�%∀∋�∃�+���(#������� �������� ��∋��� �� #��,�− ��Ε� ��������� �����,�� �∃77���?�4
#�?���7����7�#∋�� ���Γ����7��&7��%∀%�∀∀#�?���
��Φ!3−���∀�%∀�∃�+������∗�3�������∀�%%,�
� �∃77���?����#�?���7�#∋�� ����7��#��� �7 ��ΦΓ+������∗Γ3������Γ∀�%%?���
Φ� Φ��∀�%%�∃� ��∋��� �� #�������− ���� ������� ���������0����∗,�����������������∀����������
������� ��������∀���∃���∀������������� ���%���&�� ����∋���
��∀�%∀�∃���� ���� ��� ��∋���(#��� ��Ι�∀�%∀����������3���� � ���������� ,������������� ��� ��
��������(���������)��∗���� ����+,+�����∗���� ��)��# �)�������−�� ����� ���
)0 ��∀�%∀�∃� ��3������∃����������∋∗�)�����Ι���#������ ��� �� ���������� �������������,�
����������������(��� ��� �����������∀�� ���������������� ���������� �.,/�0�.,11��� ����
�����������
)0 ��∀�%&�∃�−8�!���������?�(#�������������2������ �9 ���,�� ��∃77���?��2?#57��2������ 7#�4
����7�∗� ��7#�����7� ����� Γ�� �7���7%Β≅���7∋��4%&4Β��4#54��4���4���4���#� ���4� �� ��∗?���
)�=��∀�%&�∃�+���3������ !∀40!3����� ���)�2������ ������ +�������� �# #������ ���:�� ������3�4
����?�9�+����40���������������9���� ���,�
� �∃77���?���?��7��#��� �7�#∋�5� �����7Β&7���Γ�%??�∀&≅�Β?��7��%&��?���
)!0��∀�%��∃�3���� ���� ����� ������∗�+��5�Φ������� ��∋��� �� #�������� �����,������������� ��
� ���
)>�=��∀�%&�∃�9��∗�������8�����# Ε�� �� ��������:# Ε#���2�������#��∋�����=������ ����#�����4
���,�� �∃77���?�2��4
����2� ���?��7��������7�2��7����∋� �7�����#��7����2� ���7���7��Γ�%Γ%%?���
)#��� �� ��?��∀�%∀�∃�9��������� ���0�2������� ���� �� ������ ��∋���)��/����− ��Ε� ���∃�9�������4
��+���� ����9������,��������������� ���%% ���� ���� ������∗�����#�������������∗� ����0����4
������,�%≅4%Α�6#∗�∀�%∀,����������,�
� �∃77��∋�?#�?�?∋�7∋� � ����7∀∀Χ�7%%&�Χ%7%7)#��� 0 9Γ��0∀�%∀Γ0�2������� ��� �� ����4
!∀− ��Ε� ���?���
0����0�2������� ��∀�%%�∃������ ∗��9�������� ���� ��∋���)��/����3�4−���+���������,�9������/�
�� ��� ����∀�%%,�� �∃77��?��∋����� � # �?��7�� ��7����# 7����7��#∋�� ����7%��∀Χ7����� 4
���4#� �5�4�4���#� ���4#��4�� #���4��∋��4���/���?���
0���� �0����∗�� ��?��∀�%∀�∃�0���������� ����� !∀40�������!��3��2��∗������� ���,�
� �∃77���?�� ���4�� �������?��7∆7�����7�073���#���7)�#��� �7)0Φ70�����Η∀��� �� ��
Η∀���Η∀� !∀Η∀�0!3Η∀���Η∀��� ���?���
∀��0��∀��� �����Χ�������<∀∀��> �����∃
0#������� �����������∀�%%�∃�0����∗�3�������∀�≅�,� !��∀�%%����≅�����,�� �∃77�#�4
�/?�#����?�#7��/−�����27��/−�����2?��ϑ#��Κ !�∃∀�%%∃���≅∃Φ�:∃0:∃�)Φ
0#������� �����������∀�%&�∃��#∋�� ���# � ������∃�+���Φ# #������ ��∋��� �� #�������� ���������
0#����,� !��∀�%&��%�������,�������� �� ������ �� � ��∀����������������/���,������ ����
����,��?�� ����∀�%%�∃� !∀�� ���������)��� ���!��Φ����∃�+���=���������� �� ������� ��∋���)��/4
����0�������!��3��2��∗,�0����∗������������∀�%%��∀%Χ∀Ι∀%ΧΑ,�
� �∃77�/?���?���7%�?%�%Χ7�?��∗���?∀�%%?�∀?%�∀
� ����∀�%%�∃�9���� ���� ���−� �5����� �∃����#� ����−������ �� #���� ��∋���)��/���,����������
�����∃������������� �������� �� ��������� �����∃�����������.������� � �����������( �������������
����� ������� ����∃�����2� ���
� ����∀�%&��∃�(�������� ������∃�9��9��∗�������� ����������������������3��#� ��∗�Φ�������5��
���� !∀Ι0!3����� !∀Ι �,�
� �∃77��?��∋����� � # �?��7�� ��7����# 7����7�#∋�� ����7%%�Α≅%7���4����� 4∀�%&4�4��2?���
� ����∀�%&∋�∃�+������9��� �����0������� !∀�!��3��2��∗�����9����� ��� ��∋���� �����,�
� �∃77��?��∋����� � # �?��7�� ��7����# 7����7�#∋�� ����7%%�Α�Χ7 �����4���� �4�∀4��4
�����4��4���2��∗4���4������ ��4��∋��4� �?���
� ����∀�%&�∃�� � #����� ������� ��−��� �,�! �∋���∀�%&,�
� �∃77��?��∋����� � # �?��7�� ��7����# 7����7�����7�%�%Χ7����4���4�� ���� ��4�4����� �4%�4
� �∋��4∀�%&?/�
� ����∀�%&��∃�+�����∋��� � #����� ��∀�%&,�
� �∃77��?��∋����� � # �?��7�� ��7����# 7����7�#∋�� ����7%%Χ∀%%7��∋�4� � #�4�4∀�%&?���
�#,�Λ����∀�%&�∃� ��∋��� �� #���;�� ���������∗���� ����,�
� ��∃77��∋?��?�#�∋��?��#7�� ��7����# 7����7������ ��7��� �4
�����7����7�#∋�� ����7� #��� �7Λ��Η∀��#Η∀� �Η∀������Η∀�Φ���?���
.��� ��?��∀�%&�∃�������� ��∋���� ������ ���#���0�������!��3��2��∗,�0����∗���������∀�%&,�
��� ������,�� �∃77���?� �?#�7����#���7�#∋�� ����7����7∀�%&�%4
������Γ��∋��Γ� �����Γ ���#��ΓΓ�������Γ��Γ���2��∗?���
.� ,�+?�� ��?��∀��Α�∃�0!3����� !∀���������Μ�0���������� ���� ∗��� �� ������ ���:�� �����,�0�4
���∗��������,��%��∀��Α,���?��%≅ΑΙ�%ΧΧ,�� �∃77�/?���?���7%�?%�%Χ7�?��∗���?∀��Α?�∀?∀∀≅
� !∀:��∀�%&�∃�:� ��������#����������� ����� ������ !∀� ���#���0�������!��3��2��∗��0!3�,�
� �∃77���?��∀�?��7��4�� �� 7#�����7∀�%&7�Χ7��∀�Γ0!34Φ���43���� ?���
�09��∀����∃� !∀� �� #�������� �����?�9�8�∗� ��∋���9∋� ���� �!� �����0����∗�+������∗�9��∗����,�
� �∃77���?���?���7�#∋�� ����7�����#∋�� ����7�#∋�� ���7 �Γ∀���?���
�09��∀�%��∃�0����∗�+������∗������� �2���∀�%�?����������;�� �� ������ ��∀�≅�,�
� �∃77���?���?���7�#∋�� ����7�����#∋�� ����7�#∋�� ���7� �∀�%�?���
�09��∀�%∀��∃� ��∋��� �� #�������� ���������������3��#� ��∗�3�2���,�� �∃77���?���?���7�#∋��4
����7�����#∋�� ����7�#∋�� ���7 �Γ3�2���Γ&����� ���ΓΦ�:9�?���?
�09��∀�%∀∋�∃�0����∗�+������∗������� �2���∀�%∀?��� ���∗�� ���� ����0����∗��∗� ��
�09��∀�%∀�∃�=����0����∗�!# ��5�∀�%∀
�09��∀�%&��∃�3��������� ���0����∗4 ��� �����?�=����0����∗�!# ��5�������3���� ,�
� �∃77���?���?���7�#∋�� ����7�����#∋�� ����7�#∋�� ���73��������0����∗ ��� ����Γ∀≅�Χ?���
�09��∀�%&∋�∃�+������∗�3������∃� ��∋��� �� #�������� �����,�� �∃77���?���?���7�#∋�� ����7����4
�#∋�� ����7�#∋�� ���7 �Γ3������?���
�09��∀�%&�∃�+��5���� ����0����∗���������?��09����# � �� ��� ����0����∗������ ����,�
� �∃77���?���?���7�#∋�� ����7�����#∋�� ����7�#∋�� ���7+ 0�Γ��∋?���
∀��0��∀��� �����Χ�������<∀∀��> �����∗
�09��.���∀��Α�∃� !∀�� ���������)��� ���!������∃���∋��9���� ���� �� �����Φ��� ��∋���)��/����
0�������!��3��2��∗,������������� �������������3 � ����4����# ���������1������
�09��.���∀�%∀�∃� !∀� �� #���� �����Φ�������������� �,�
������������ �������������3 � ����4����# ������������,���
����������∀��Α�∃� ��∋��� �� #�������� ������� ��?� ������#���3���5�������8�������/���∋����4
�#���#���4�������#��,�� �∃77���?�������4��5 ��?��7���7�4��������42%�?���
�� ��∀��≅�∃�������3���� ���� ��∋���)��/���� �� #�������� �����,������������������������� �
������ ���������������������� � �������
−5! 67����8�6!� ��� �������������� 6��69(�������� 6: � �����6 �� �65������;�� ∃�� �6����������
���� �� �� � � ��∀� ���� ���������������� ��3� �� �� �!� ��∀�3������ ��5������&�������
� �� � �� ����
8���,�9?�?�� ��?��∀�%∀�∃�+���0���������� !∀40!3� #� ���)�2������ ����� ���−8� �� ���:�� ��
���7�!# �������∗�Φ�� ��Ν�:�� ������� #�∗�!�������������,���?�%∀&,�� �∃77��?�����?�� 7∀%Χ�7∀&ΒΑ
8##�5���,�>?9?��∀�%∀�∃−����� ���0������>�#����� !∀40!3� ��9���� �� ���)���∗��� ���� !∀�
�� #��,�− ��Ε� ��������� ������� −��,�� �∃77���?��∋����� � # �?��7�#∋�� ����7������4
����4∀�%∀4�� 4���5����7�����7%%Χ��Χ
8�� #���,����∀�%∀�∃�������3���� �∀�%∀∃�=��������0!3��#�2�∗,�!����������6�#���,�9����∀,�
∀�%∀�,�� �∃77���?���?��7�� ���7���� 72�4%%�7���#�4�7������4�� ���� 7�����4����� 4���4���2∗4��4
�#�2�∗7∀�%∀4��������4���4�#�2�∗?� �
����,�9?�� ��?��∀�%��∃� �4�� ���Ε� �������0!3����� ��∋�����1#�� �� ���Ο,���� �������=��5������4
�������������≅,�������������������������2�����(�������� ������������������<���������� ���
��Ε��,��?��?��∀�%∀�Π� ��∋���)��/����0�������!��3��2��∗�� !∀�0!3�∃�Φ� ������2�2������9������
��∋��� �� #��,�− ��Ε� ��������� ������� −��� ��0�������!��3��2��∗,�
� �∃77�����?���7��Ε��Γ !∀0!3Γ −�ΓΦ�∋∀�%∀?���
��+0���∀�%��∃�3������0�������!��3��2��∗����9���� ���� ���)���∗��� ���� ��∋��� �� #�������
��1#�� �� ���,����������� ������ ���∀�� ����� �����+���!�#�# ���������
: ��∀�%∀�∃�.���������� ��Θ�� ��∋��� �� �� � ��9�2���� ���0����∗,�0�2������� ,�����0����∗�
��#�� ∗,������������������������������������� �������0�������
=���>��� ���������������∃������� ������;��� �!�����∀�!������ ���!� ��∀ �����∀���
:)3 ��∀�%&�∃�:� ������:� �����)�2������ �����3������ �����������:)3 ���������� ���� ��4
∋��� �� #��,�− ���� ��������� ��������� �����)����� �� ���,�:�?���Α,�� �∃77��?��∋����� � # �?4
��7�� ��7����# 7����7�#∋�� ����7%�∀%�Χ7�� ��4�� ����4��2������ 4������4���������4���?���
:0!3���∀�%∀�∃� ��∋������/������������������2��∗∃�9��� �������� �������∗,��������������2��4
����� ������� #�� ∗,������������� ��������=!�#−�# �������
:0+���∀�%���∃� ��∋���)��/����0�������!��3��2��∗?�−� ������)���� ��0����∗��#��∗����������
+���� ��∋���� ��������# ���,�� �∃77���?�� ?���?��27 ���������7��4
���7�#∋�� ����70�7���Γ !∀Γ0!3Γ������?���
:0+���∀�%�∋�∃�� ������ !∀���������#����)���� �� �#���!���� ��:�/ ������� ���� !∀40!3�+��4
����∗∃�9��−��� �,�� �∃77���?�� ?���?��27�����∗4���∗���7�#∋�7� ����� !∀:�/���0!3%�?���
:0+���∀�%%�∃������2����)���� ��0����∗���#�� ∗�������������� !�∀�0����������� ��Ρ:�/ �������4
���Ο� !∀40�������!��3��2��∗�� !∀40!3�,�� �∃77���?�� ?���?��27�����∗4���∗���7�#∋�7:�/ 4
���Γ !∀Γ0!3Γ�Χ%�∀�%%?���
!��,��?Λ?�� ��?��∀�%&�∃�)�2������ ���������������� !∀������� �# #���:� ���5����0#����,�
� �∃77���?#��4
�� ����?��7��������7����� �7����7�����5 Γ3�7=�Γ3�Γ&ΧΓ!��Γ������2� �Γ∀�%&Γ !∀Γ�����4
� �# #��Γ0#����?���
∀��0��∀��� �����Χ�������<∀∀��> ������

�+3 ��∀�%%�∃������3�2��������������� ����� �∗�3���� ,�
� �∃77���?���2#�?��7����� ����7��7���7�+3 ?���
� ���∀��Α�∃�!���� #�� �������� !∀�� ���������#����� ���,�
� �∃77���?�� ���?��2?#573���#��7)�7∀Β�Β&Β7����≅ΑΒ?���
� ���∀�%&�∃�−��5����:�� ������ !∀�� ����������0#����∃���� ���9 ��������� ���:�/ �Φ�2��Λ����,�
� �∃77���?��?���?#57�/��� ���7� � ��������∀�%&3���� ?���
�( ��∀�%%�∃��������� ���0����∗�+����� ���?�(�������� ��∋��� �� #���;�� ������ �����5� ,�
������������∃����∃����� :�−������� �∗�∃����������?�� ���&�� �� :�)��!� ��∀)��−������� � :�
)��!� ��∀)��−������� �:�������)���� )����)��<��( ������2
+Ε����,�0?�� ��?��∀��≅�∃�0�������!��3��2��∗�#����� ��∋���)��/������� ���0#�������0����∗��∗� ��,�
� �∃77�����?#�� ����?�7∆��#����7��� �ΧΑ%4�#��7 !∀Γ������Η∀� !∀Η∀���1#�� �� ���
Η∀��� �����7 !∀Γ0!3Γ����∋���Η∀�0#����∀%�Α≅0:?���
+Ε����,�0?�� ��?��∀��Χ�?� !∀�� �������� �� ������ ���:�� ������2���0�������!��3��2��∗,�
����������������������������≅4;&−4%++Α4;;−4%.
−� � ��∀�%∀�∃�9��0��∗�)���∗��� �� �� ��∗�����0��∗� ��∋��� �� #��,�− ��Ε� ���,������ ������
� −���+���������,�� �∃77���?#��?���7Φ���79����70�#� ����Γ������7∀�%∀�Χ��Γ0��∗
Η∀�)���∗��� Η∀�� �� ��∗Η∀����Η∀� −�Η∀�+���������ΓΦ�:9�?���
<�����,��?�� ��?��∀�%%�∃�����4 �����#����� ��∋���)��/����Φ#/����� ������� � ���8� Ε��� ��∋���)�4
�/����� ������+�� ��� �,�0�2������� �����������,�∀�∀�%%�,���?�%%Α4%&�,�
� �∃77�/?���?���7%�?%&�Χ7��?%%%�%�%��%Β
)� �����(����
(������∀�%&�∃�&?�� � #�5�������Ε�Ε#��(�(Φ4ΦΣ������Τ������Υ+�����������ς��:���� ��5�� �#���
8�����# Ε�4� �����������Ε�����#���� �������:# Ε#���2��� !∀Υ,�(����,�Α4%��9����∀�%&,�
������������� �� ������ � �/�0����
(�#������∀�%∀�∃� !∀�3�#���+���������?�=��5������������2� �������� ��� �����∗,�(�#����,�∀��
! �∋���∀�%∀,�� �∃77���?�∀��#��?�#7���5����?� �
0������∀�%&�∃�∀��� ������������ ��∋���)��/���������Φ���� �5����� ����� �∗�������∗����,�0����,�Β4
Α�! �∋���∀�%&,�������������� �����∀� ��� ����������� ��������/����
−��0����∗�������� ����9������ �� ���∃��� ���� �����0����∗�� � �� ��,�� �∃77���?���?��27�����7���∋4
����� 7�0)����/&?��ϑ ��ΚΑ�;���Κ��;���Κ�
∀��0��∀��� �����Χ�������<∀∀��> ������