carbon dioxide emission reduction opportunities for …
TRANSCRIPT
CARBON DIOXIDE EMISSION REDUCTION
OPPORTUNITIES FOR THE WEST VIRGINIA
POWER SECTOR
DISCUSSION PAPER
James Van Nostrand, Evan Hansen, Beren Argetsinger,
Jeff Simcoe, Joseph James
Evan Hansen, Joseph James
Photos: Evan Hansen
James Van Nostrand, J.D., LL.M., M.A., Associate Professor and Director, Center for Energy & Sustainable Development, WVU College of Law. Mr. Van Nostrand is the founding director of the Center. Before coming to West Virginia University in 2011, he had a successful career in private law practice, directed a New York–based environmental non-governmental organization, and served as senior advisory staff at a state utility regulatory agency.
Evan Hansen, M.S., President, Downstream Strategies. Mr. Hansen founded Downstream Strategies, an environmental consulting company in West Virginia, in 1997. He explores resource and environmental problems and solutions in three areas: energy, water, and land.
Beren Argetsinger, J.D., M.E.M., Fellow for Energy and Environmental Law & Policy, Center for Energy & Sustainable Development, WVU College of Law. Mr. Argetsinger provides legal and policy analysis on state and federal energy and climate policies.
Jeff Simcoe, M.S., Energy Program Project Manager, Downstream Strategies. Mr. Simcoe has diverse experience in the private and government sectors focusing on environmental analysis and solutions. He has held senior executive positions with companies focused on renewable energy, emerging carbon markets, and forest technology.
Joseph James, B.A., Staff Scientist, Downstream Strategies. Mr. James collects and analyzes energy and emissions data and performs policy analyses.
Center for Energy & Sustainable Development
The Center is an energy and environmental public policy and research organization focusing on promoting practices that will balance the continuing demand for energy resources—and the associated economic benefits—alongside the need to reduce the environmental impacts of developing the earth’s natural resources. The Center’s 2014 annual national energy conference examined the impacts of regulation of power plant CO2 emissions on coal-dependent states.
James Van Nostrand [email protected]
energy.law.wvu.edu/about
Appalachian Stewardship Foundation
The Appalachian Stewardship Foundation was founded to mitigate the damage to the environment caused by energy development and use, to reduce greenhouse gas emissions, and to protect freshwater streams and tributaries. Its vision is for environmental values to lead our energy future, with the least amount of energy necessary to provide the goods and services we need.
www.appalachianstewards.org
Downstream Strategies
Downstream Strategies is a West Virginia–based environmental consulting firm with a core belief in the importance of protecting the environment and linking economic development with natural resource stewardship. Our projects fit within one or more of our program areas—energy, water, and land—and most projects also utilize one or more of our tools, which include geographic information systems, monitoring and remediation, and stakeholder involvement and participation.
Jeff Simcoe [email protected]
www.downstreamstrategies.com
This discussion paper reviews EPA’s proposed rules to limit carbon dioxide emissions from existing power plants and presents policy recommendations on steps West Virginia could take to comply with these rules while also capturing the economic, social, and environmental benefits of expanding the state’s energy economy. This paper is part of a Center for Energy & Sustainable Development initiative to develop sustainable solutions for the economic, energy, and climate challenges facing West Virginia. The initiative is supported through a grant from the Appalachian Stewardship Foundation.
1
INTRODUCTION
On June 2, 2014, pursuant to Section 111(d) of the Clean Air Act, the U.S. Environmental Protection Agency (EPA) proposed the Clean Power Plan to limit carbon dioxide (CO2) emissions from existing electric power plants.
1 The proposed rule would establish state-specific CO2 emission limits based on the emission-
reduction potential of a combination of measures that can be implemented at individual generating units and across the broader electric system.
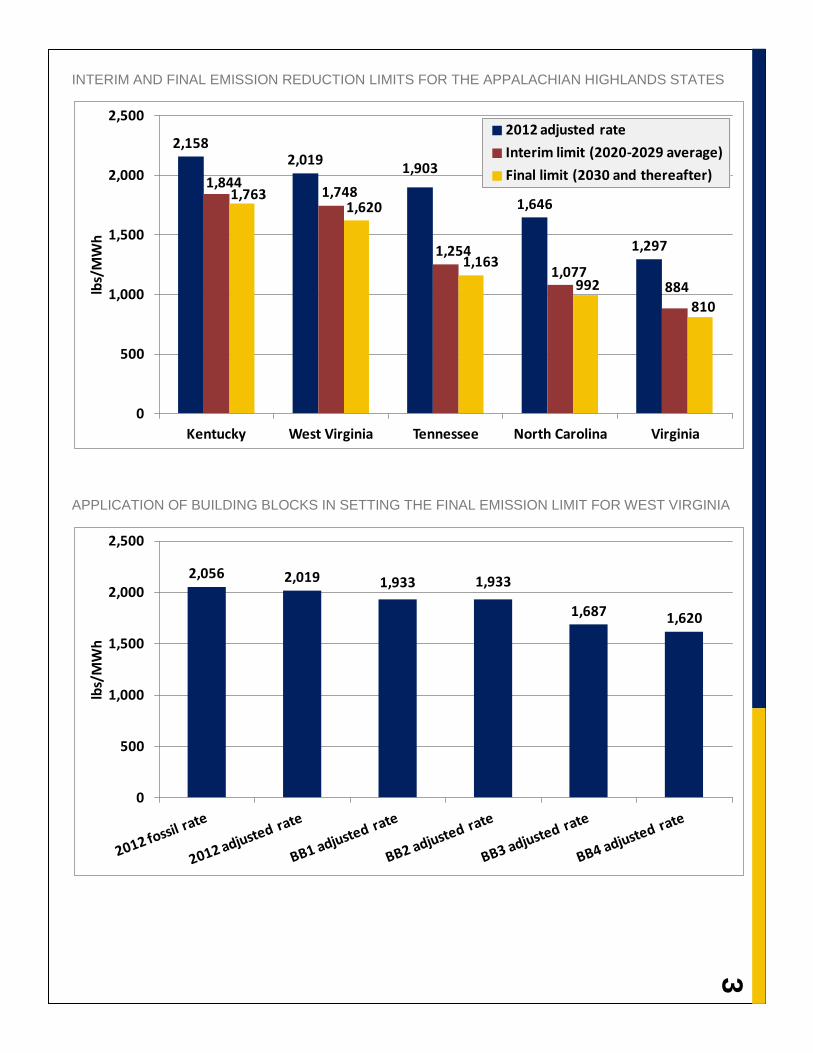
As proposed,2 the Clean Power Plan would phase in emission reductions over time by allowing states to
meet specified emission levels over two compliance periods. The interim compliance period would require states to meet an average emission limit from 2020 to 2029. The final compliance period would require states to meet a final limit by 2030 and maintain (or further reduce) that level of emissions thereafter. The rule proposes each state’s emission limit in the form of an emission rate—pounds of CO2 per megawatt hour of net electricity produced (lbs/MWh)—but provides the option for states to translate their rate-based limits into a mass-based limits (total emissions in tons). Under the rule, West Virginia would be required to reduce its CO2 emission intensity from 2,019 lbs/MWh to 1,620 lbs/MWh by 2030.
Coal, which releases more CO2 when burned than other fossil fuels, is used at 16 major power plants in West Virginia and fuels 96% of the electricity produced in the state. Almost three-fifths of the electricity generated in West Virginia is exported to surrounding states. Meeting the emission reduction limits proposed under the Clean Power Plan will require West Virginia to incorporate other energy resources to reduce CO2 emissions from its power sector. West Virginia is the second-largest coal-producing state in the country and coal mining supports thousands of West Virginia families and contributes hundreds of millions of dollars to the state budget every year. Less reliance on coal-fired power plants will reduce demand for West Virginia coal, and this has important implications for the state. While the Clean Power Plan presents a number of challenges for West Virginia, it provides states a high degree of flexibility in designing state plans (as required under the rule) and determining which emission reduction measures best suit that state. EPA does not dictate which measures states must use or the level of reduction level any particular measure must achieve, so long as the state achieves the required level of emission reductions within the designated timeframe.
This flexible approach recognizes that each state is in the best position to identify the right mix of emission reduction strategies that fit its resource mix and electric sector structure. It also provides states with the opportunity to consider other policy objectives when developing a state plan. Given this flexibility, West Virginia can develop a state plan that puts the state on track to meet its emission limits while at the same time enhancing the social, economic, and environmental benefits of further integrating its energy efficiency, renewable energy, and natural gas resources into the state’s electricity sector.
In this discussion paper, we:
1. summarize the Clean Power Plan emission guidelines for West Virginia; 2. review West Virginia’s power sector and resource mix targeted under the proposed rule; 3. identify emission reduction opportunities related to energy efficiency, renewable energy, and
expanded use of the state’s natural gas resources; 4. discuss preliminary results from an initial modeling scenario (Compliance Scenario) that
demonstrates the feasibility of reaching the final state limit by implementing these opportunities; and 5. present four policy recommendations that would promote economic growth by expanding the state’s
energy sector, provide energy savings benefits to consumers, and put West Virginia on track to achieve significant CO2 emission reductions under the Clean Power Plan.
2
THE CLEAN POWER PLAN EMISSION REDUCTION LIMITS FOR WEST VIRGINIA
Section 111(d) of the Clean Air Act requires EPA to develop emission guidelines based on the “best system of emission reduction” (BSER) adequately demonstrated. EPA must also establish a procedure for states to submit plans to EPA that establish performance standards. EPA defined the BSER for CO2 emissions from existing power plants as four categories of measures (“building blocks”) that states and utilities across the country are already using to reduce emissions.
3 The building blocks include both “inside the fence-line” and
“outside the fence-line” measures that can be implemented at individual power plants and across the broader electricity system.
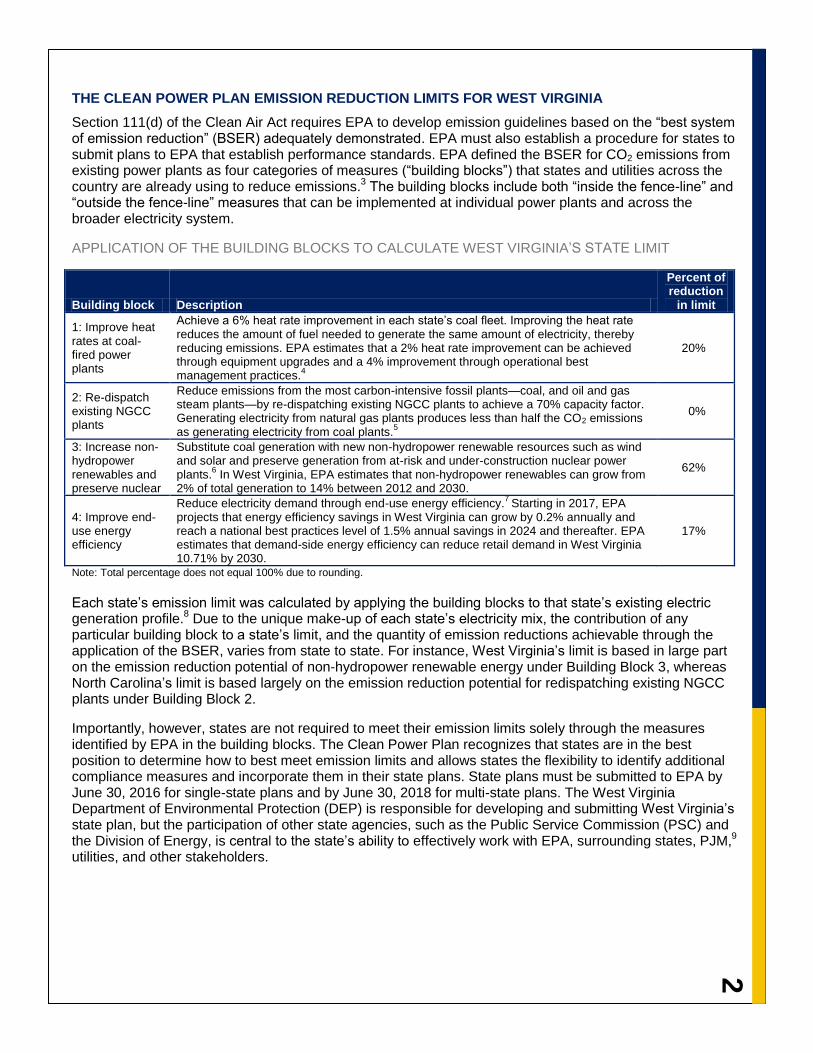
APPLICATION OF THE BUILDING BLOCKS TO CALCULATE WEST VIRGINIA’S STATE LIMIT
Building block Description
Percent of reduction
in limit
1: Improve heat rates at coal-fired power plants
Achieve a 6% heat rate improvement in each state’s coal fleet. Improving the heat rate reduces the amount of fuel needed to generate the same amount of electricity, thereby reducing emissions. EPA estimates that a 2% heat rate improvement can be achieved through equipment upgrades and a 4% improvement through operational best management practices.
4
20%
2: Re-dispatch existing NGCC plants
Reduce emissions from the most carbon-intensive fossil plants—coal, and oil and gas steam plants—by re-dispatching existing NGCC plants to achieve a 70% capacity factor. Generating electricity from natural gas plants produces less than half the CO2 emissions as generating electricity from coal plants.
5
0%
3: Increase non-hydropower renewables and preserve nuclear
Substitute coal generation with new non-hydropower renewable resources such as wind and solar and preserve generation from at-risk and under-construction nuclear power plants.
6 In West Virginia, EPA estimates that non-hydropower renewables can grow from
2% of total generation to 14% between 2012 and 2030.
62%
4: Improve end-use energy efficiency
Reduce electricity demand through end-use energy efficiency.7
Starting in 2017, EPA projects that energy efficiency savings in West Virginia can grow by 0.2% annually and reach a national best practices level of 1.5% annual savings in 2024 and thereafter. EPA estimates that demand-side energy efficiency can reduce retail demand in West Virginia 10.71% by 2030.
17%
Note: Total percentage does not equal 100% due to rounding.
Each state’s emission limit was calculated by applying the building blocks to that state’s existing electric generation profile.
8 Due to the unique make-up of each state’s electricity mix, the contribution of any
particular building block to a state’s limit, and the quantity of emission reductions achievable through the application of the BSER, varies from state to state. For instance, West Virginia’s limit is based in large part on the emission reduction potential of non-hydropower renewable energy under Building Block 3, whereas North Carolina’s limit is based largely on the emission reduction potential for redispatching existing NGCC plants under Building Block 2.
Importantly, however, states are not required to meet their emission limits solely through the measures identified by EPA in the building blocks. The Clean Power Plan recognizes that states are in the best position to determine how to best meet emission limits and allows states the flexibility to identify additional compliance measures and incorporate them in their state plans. State plans must be submitted to EPA by June 30, 2016 for single-state plans and by June 30, 2018 for multi-state plans. The West Virginia Department of Environmental Protection (DEP) is responsible for developing and submitting West Virginia’s state plan, but the participation of other state agencies, such as the Public Service Commission (PSC) and the Division of Energy, is central to the state’s ability to effectively work with EPA, surrounding states, PJM,
9
utilities, and other stakeholders.
3
INTERIM AND FINAL EMISSION REDUCTION LIMITS FOR THE APPALACHIAN HIGHLANDS STATES
APPLICATION OF BUILDING BLOCKS IN SETTING THE FINAL EMISSION LIMIT FOR WEST VIRGINIA
2,1582,019
1,903
1,646
1,297
1,8441,748
1,254
1,077884
1,7631,620
1,163
992
810
0
500
1,000
1,500
2,000
2,500
Kentucky West Virginia Tennessee North Carolina Virginia
lbs/
MW
h
2012 adjusted rate
Interim limit (2020-2029 average)
Final limit (2030 and thereafter)
2,056 2,019 1,933 1,933
1,687 1,620
0
500
1,000
1,500
2,000
2,500
lbs/
MW
h
4
OVERVIEW OF THE WEST VIRGINIA POWER SECTOR
West Virginia electric customers are served by six utilities—Appalachian Power Company and Wheeling Power Company (both of which are subsidiaries of American Electric Power); Monongahela Power and The Potomac Edison Company (both of which are subsidiaries of FirstEnergy); Black Diamond Power Company; and the Harrison Rural Electrification Association.
10
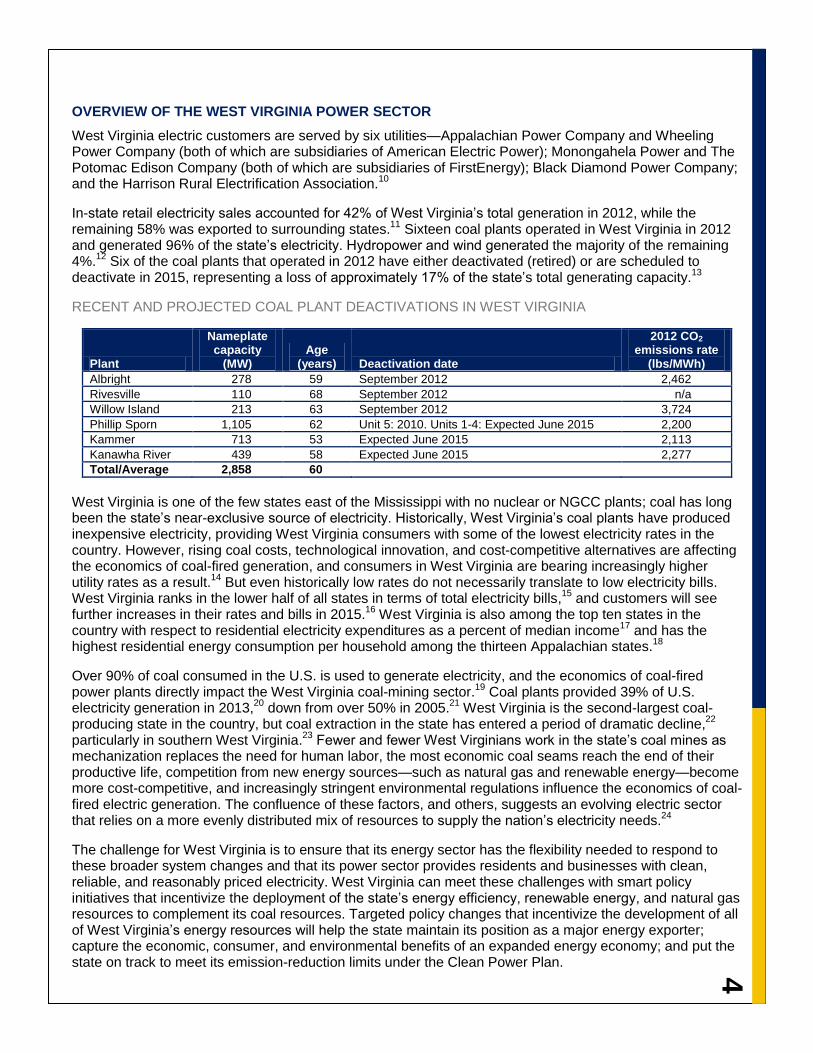
In-state retail electricity sales accounted for 42% of West Virginia’s total generation in 2012, while the remaining 58% was exported to surrounding states.
11 Sixteen coal plants operated in West Virginia in 2012
and generated 96% of the state’s electricity. Hydropower and wind generated the majority of the remaining 4%.
12 Six of the coal plants that operated in 2012 have either deactivated (retired) or are scheduled to
deactivate in 2015, representing a loss of approximately 17% of the state’s total generating capacity.13
RECENT AND PROJECTED COAL PLANT DEACTIVATIONS IN WEST VIRGINIA
Plant
Nameplate capacity
(MW) Age
(years) Deactivation date
2012 CO2 emissions rate
(lbs/MWh)
Albright 278 59 September 2012 2,462
Rivesville 110 68 September 2012 n/a
Willow Island 213 63 September 2012 3,724
Phillip Sporn 1,105 62 Unit 5: 2010. Units 1-4: Expected June 2015 2,200
Kammer 713 53 Expected June 2015 2,113
Kanawha River 439 58 Expected June 2015 2,277
Total/Average 2,858 60
West Virginia is one of the few states east of the Mississippi with no nuclear or NGCC plants; coal has long been the state’s near-exclusive source of electricity. Historically, West Virginia’s coal plants have produced inexpensive electricity, providing West Virginia consumers with some of the lowest electricity rates in the country. However, rising coal costs, technological innovation, and cost-competitive alternatives are affecting the economics of coal-fired generation, and consumers in West Virginia are bearing increasingly higher utility rates as a result.
14 But even historically low rates do not necessarily translate to low electricity bills.
West Virginia ranks in the lower half of all states in terms of total electricity bills,15
and customers will see further increases in their rates and bills in 2015.
16 West Virginia is also among the top ten states in the
country with respect to residential electricity expenditures as a percent of median income17
and has the highest residential energy consumption per household among the thirteen Appalachian states.
18
Over 90% of coal consumed in the U.S. is used to generate electricity, and the economics of coal-fired power plants directly impact the West Virginia coal-mining sector.
19 Coal plants provided 39% of U.S.
electricity generation in 2013,20
down from over 50% in 2005.21
West Virginia is the second-largest coal-producing state in the country, but coal extraction in the state has entered a period of dramatic decline,
22
particularly in southern West Virginia.23
Fewer and fewer West Virginians work in the state’s coal mines as mechanization replaces the need for human labor, the most economic coal seams reach the end of their productive life, competition from new energy sources—such as natural gas and renewable energy—become more cost-competitive, and increasingly stringent environmental regulations influence the economics of coal-fired electric generation. The confluence of these factors, and others, suggests an evolving electric sector that relies on a more evenly distributed mix of resources to supply the nation’s electricity needs.
24
The challenge for West Virginia is to ensure that its energy sector has the flexibility needed to respond to these broader system changes and that its power sector provides residents and businesses with clean, reliable, and reasonably priced electricity. West Virginia can meet these challenges with smart policy initiatives that incentivize the deployment of the state’s energy efficiency, renewable energy, and natural gas resources to complement its coal resources. Targeted policy changes that incentivize the development of all of West Virginia’s energy resources will help the state maintain its position as a major energy exporter; capture the economic, consumer, and environmental benefits of an expanded energy economy; and put the state on track to meet its emission-reduction limits under the Clean Power Plan.
5
EMISSION-REDUCTION OPPORTUNITIES FOR THE WEST VIRGINIA POWER SECTOR
Under the proposed rule, West Virginia would be required to reduce its emission intensity from 2,019 lbs/MWh to 1,620 lbs/MWh by 2030. There are many opportunities available in West Virginia to make this reduction. This paper presents one scenario, the “Compliance Scenario,” to demonstrate how one mix of emission reduction measures can help West Virginia reduce emissions under the proposed rule.
25 The
Compliance Scenario exercises the flexibility of the proposed rule and considers abatement measures used by EPA when calculating state limits as well as other measures that EPA proposes states may use to reduce emissions. The Compliance Scenario was developed based on achieving the final 2030 emission rate. Refinements to this scenario, as well as additional scenarios that consider compliance under a rate-based or mass-based standard will be presented in a future report.
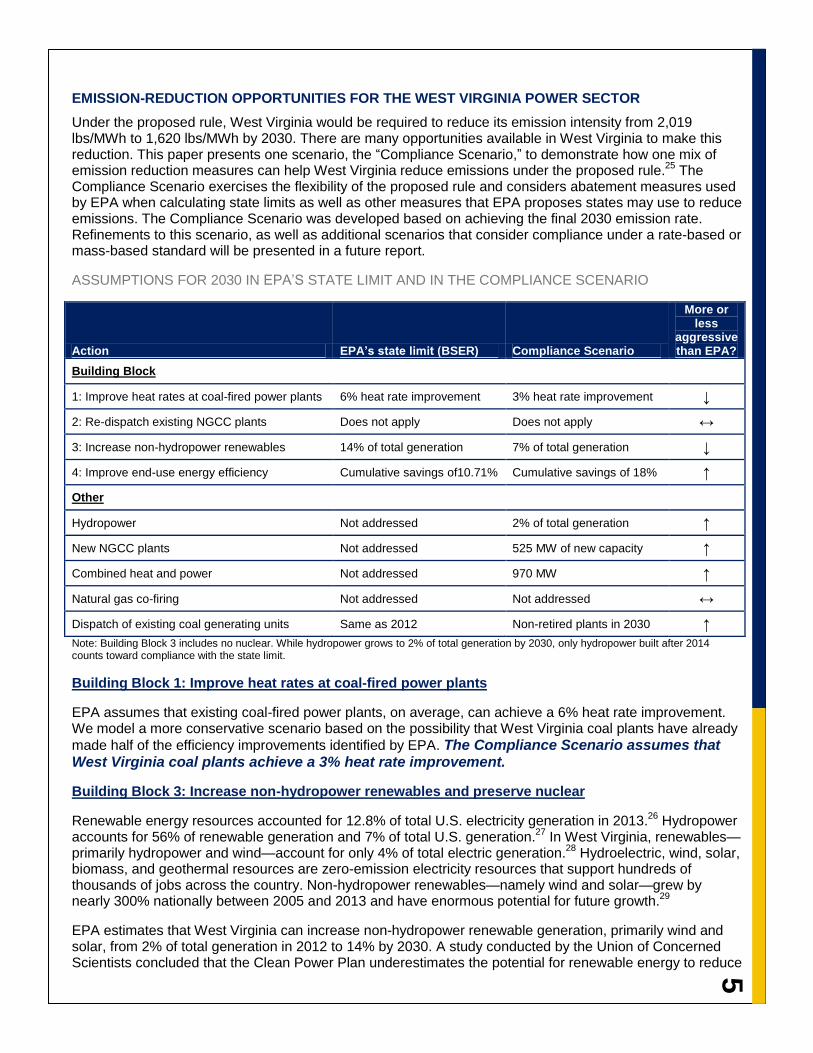
ASSUMPTIONS FOR 2030 IN EPA’S STATE LIMIT AND IN THE COMPLIANCE SCENARIO
Action EPA’s state limit (BSER) Compliance Scenario
More or less
aggressive than EPA?
Building Block
1: Improve heat rates at coal-fired power plants 6% heat rate improvement 3% heat rate improvement ↓
2: Re-dispatch existing NGCC plants Does not apply Does not apply ↔
3: Increase non-hydropower renewables 14% of total generation 7% of total generation ↓
4: Improve end-use energy efficiency Cumulative savings of10.71% Cumulative savings of 18% ↑
Other
Hydropower Not addressed 2% of total generation ↑
New NGCC plants Not addressed 525 MW of new capacity ↑
Combined heat and power Not addressed 970 MW ↑
Natural gas co-firing Not addressed Not addressed ↔
Dispatch of existing coal generating units Same as 2012 Non-retired plants in 2030 ↑
Note: Building Block 3 includes no nuclear. While hydropower grows to 2% of total generation by 2030, only hydropower built after 2014 counts toward compliance with the state limit.
Building Block 1: Improve heat rates at coal-fired power plants
EPA assumes that existing coal-fired power plants, on average, can achieve a 6% heat rate improvement. We model a more conservative scenario based on the possibility that West Virginia coal plants have already
made half of the efficiency improvements identified by EPA. The Compliance Scenario assumes that West Virginia coal plants achieve a 3% heat rate improvement.
Building Block 3: Increase non-hydropower renewables and preserve nuclear
Renewable energy resources accounted for 12.8% of total U.S. electricity generation in 2013.26
Hydropower accounts for 56% of renewable generation and 7% of total U.S. generation.
27 In West Virginia, renewables—
primarily hydropower and wind—account for only 4% of total electric generation.28
Hydroelectric, wind, solar, biomass, and geothermal resources are zero-emission electricity resources that support hundreds of thousands of jobs across the country. Non-hydropower renewables—namely wind and solar—grew by nearly 300% nationally between 2005 and 2013 and have enormous potential for future growth.
29
EPA estimates that West Virginia can increase non-hydropower renewable generation, primarily wind and solar, from 2% of total generation in 2012 to 14% by 2030. A study conducted by the Union of Concerned Scientists concluded that the Clean Power Plan underestimates the potential for renewable energy to reduce
6
power sector emissions on a national level, but that EPA projections for renewable growth within West Virginia may be higher than what is likely economically achievable by 2030.
30 In-state renewable
development limitations do not, however, necessarily limit the potential for renewable energy to reduce West Virginia’s emission intensity. EPA proposes in the Clean Power Plan that a state may take credit for the emission reductions that are achieved from renewable energy projects located in that state, or in another state, so long as that project is implemented in response to that state's renewable portfolio standard or other
measures requiring the development renewable energy.31
The Compliance Scenario assumes that non-hydropower renewables grow to achieve 7% of West Virginia’s total generation by 2030—half of the EPA goal.
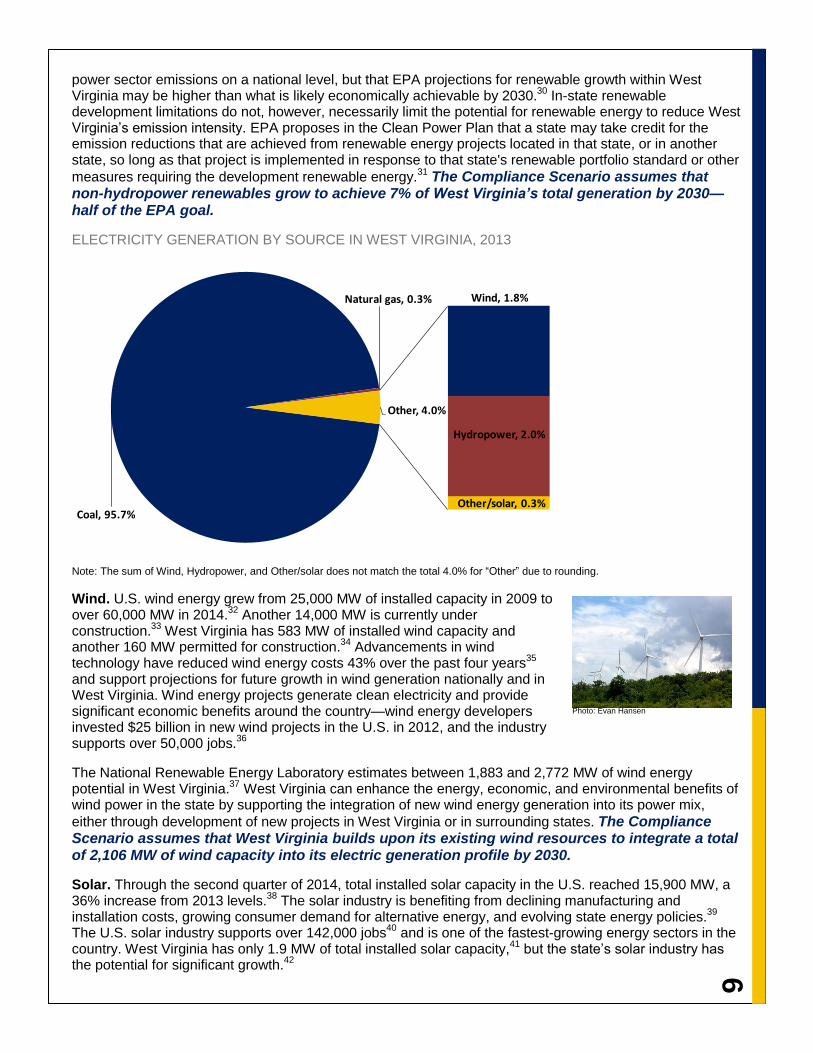
ELECTRICITY GENERATION BY SOURCE IN WEST VIRGINIA, 2013
Note: The sum of Wind, Hydropower, and Other/solar does not match the total 4.0% for “Other” due to rounding.
Wind. U.S. wind energy grew from 25,000 MW of installed capacity in 2009 to over 60,000 MW in 2014.
32 Another 14,000 MW is currently under
construction.33
West Virginia has 583 MW of installed wind capacity and another 160 MW permitted for construction.
34 Advancements in wind
technology have reduced wind energy costs 43% over the past four years35
and support projections for future growth in wind generation nationally and in West Virginia. Wind energy projects generate clean electricity and provide significant economic benefits around the country—wind energy developers invested $25 billion in new wind projects in the U.S. in 2012, and the industry supports over 50,000 jobs.
36
The National Renewable Energy Laboratory estimates between 1,883 and 2,772 MW of wind energy potential in West Virginia.
37 West Virginia can enhance the energy, economic, and environmental benefits of
wind power in the state by supporting the integration of new wind energy generation into its power mix,
either through development of new projects in West Virginia or in surrounding states. The Compliance Scenario assumes that West Virginia builds upon its existing wind resources to integrate a total of 2,106 MW of wind capacity into its electric generation profile by 2030.
Solar. Through the second quarter of 2014, total installed solar capacity in the U.S. reached 15,900 MW, a 36% increase from 2013 levels.
38 The solar industry is benefiting from declining manufacturing and
installation costs, growing consumer demand for alternative energy, and evolving state energy policies.39
The U.S. solar industry supports over 142,000 jobs
40 and is one of the fastest-growing energy sectors in the
country. West Virginia has only 1.9 MW of total installed solar capacity,41
but the state’s solar industry has the potential for significant growth.
42
Coal, 95.7%
Natural gas, 0.3% Wind, 1.8%
Hydropower, 2.0%
Other/solar, 0.3%
Other, 4.0%
Photo: Evan Hansen
7
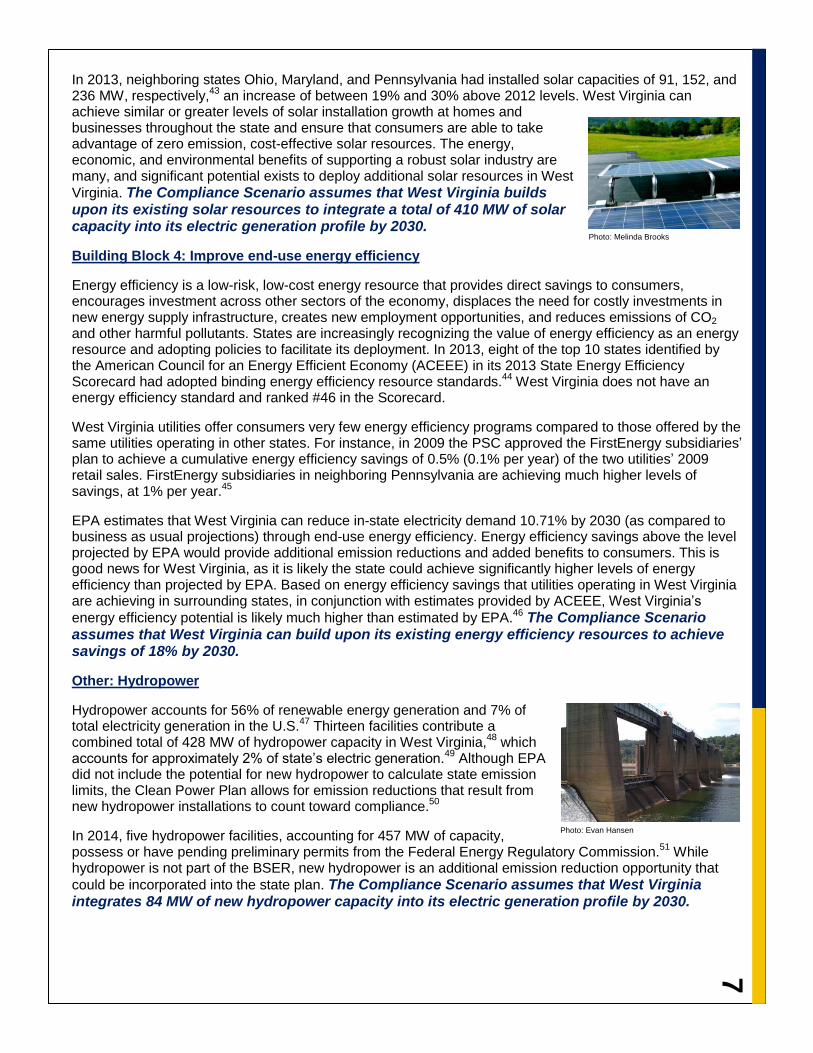
In 2013, neighboring states Ohio, Maryland, and Pennsylvania had installed solar capacities of 91, 152, and 236 MW, respectively,
43 an increase of between 19% and 30% above 2012 levels. West Virginia can
achieve similar or greater levels of solar installation growth at homes and businesses throughout the state and ensure that consumers are able to take advantage of zero emission, cost-effective solar resources. The energy, economic, and environmental benefits of supporting a robust solar industry are many, and significant potential exists to deploy additional solar resources in West
Virginia. The Compliance Scenario assumes that West Virginia builds upon its existing solar resources to integrate a total of 410 MW of solar capacity into its electric generation profile by 2030.
Building Block 4: Improve end-use energy efficiency
Energy efficiency is a low-risk, low-cost energy resource that provides direct savings to consumers, encourages investment across other sectors of the economy, displaces the need for costly investments in new energy supply infrastructure, creates new employment opportunities, and reduces emissions of CO2 and other harmful pollutants. States are increasingly recognizing the value of energy efficiency as an energy resource and adopting policies to facilitate its deployment. In 2013, eight of the top 10 states identified by the American Council for an Energy Efficient Economy (ACEEE) in its 2013 State Energy Efficiency Scorecard had adopted binding energy efficiency resource standards.
44 West Virginia does not have an
energy efficiency standard and ranked #46 in the Scorecard.
West Virginia utilities offer consumers very few energy efficiency programs compared to those offered by the same utilities operating in other states. For instance, in 2009 the PSC approved the FirstEnergy subsidiaries’ plan to achieve a cumulative energy efficiency savings of 0.5% (0.1% per year) of the two utilities’ 2009 retail sales. FirstEnergy subsidiaries in neighboring Pennsylvania are achieving much higher levels of savings, at 1% per year.
45
EPA estimates that West Virginia can reduce in-state electricity demand 10.71% by 2030 (as compared to business as usual projections) through end-use energy efficiency. Energy efficiency savings above the level projected by EPA would provide additional emission reductions and added benefits to consumers. This is good news for West Virginia, as it is likely the state could achieve significantly higher levels of energy efficiency than projected by EPA. Based on energy efficiency savings that utilities operating in West Virginia are achieving in surrounding states, in conjunction with estimates provided by ACEEE, West Virginia’s
energy efficiency potential is likely much higher than estimated by EPA.46
The Compliance Scenario assumes that West Virginia can build upon its existing energy efficiency resources to achieve savings of 18% by 2030.
Other: Hydropower
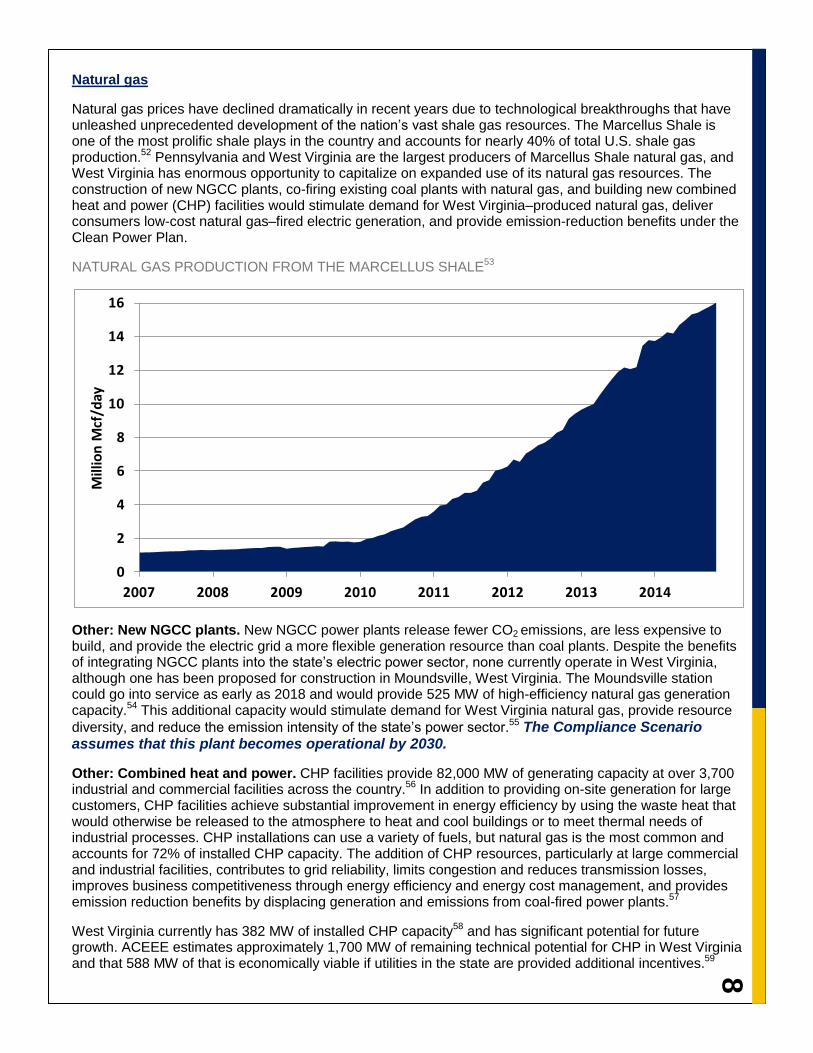
Hydropower accounts for 56% of renewable energy generation and 7% of total electricity generation in the U.S.
47 Thirteen facilities contribute a
combined total of 428 MW of hydropower capacity in West Virginia,48
which accounts for approximately 2% of state’s electric generation.
49 Although EPA
did not include the potential for new hydropower to calculate state emission limits, the Clean Power Plan allows for emission reductions that result from new hydropower installations to count toward compliance.
50
In 2014, five hydropower facilities, accounting for 457 MW of capacity, possess or have pending preliminary permits from the Federal Energy Regulatory Commission.
51 While
hydropower is not part of the BSER, new hydropower is an additional emission reduction opportunity that
could be incorporated into the state plan. The Compliance Scenario assumes that West Virginia integrates 84 MW of new hydropower capacity into its electric generation profile by 2030.
Photo: Evan Hansen
Photo: Melinda Brooks
8
Natural gas
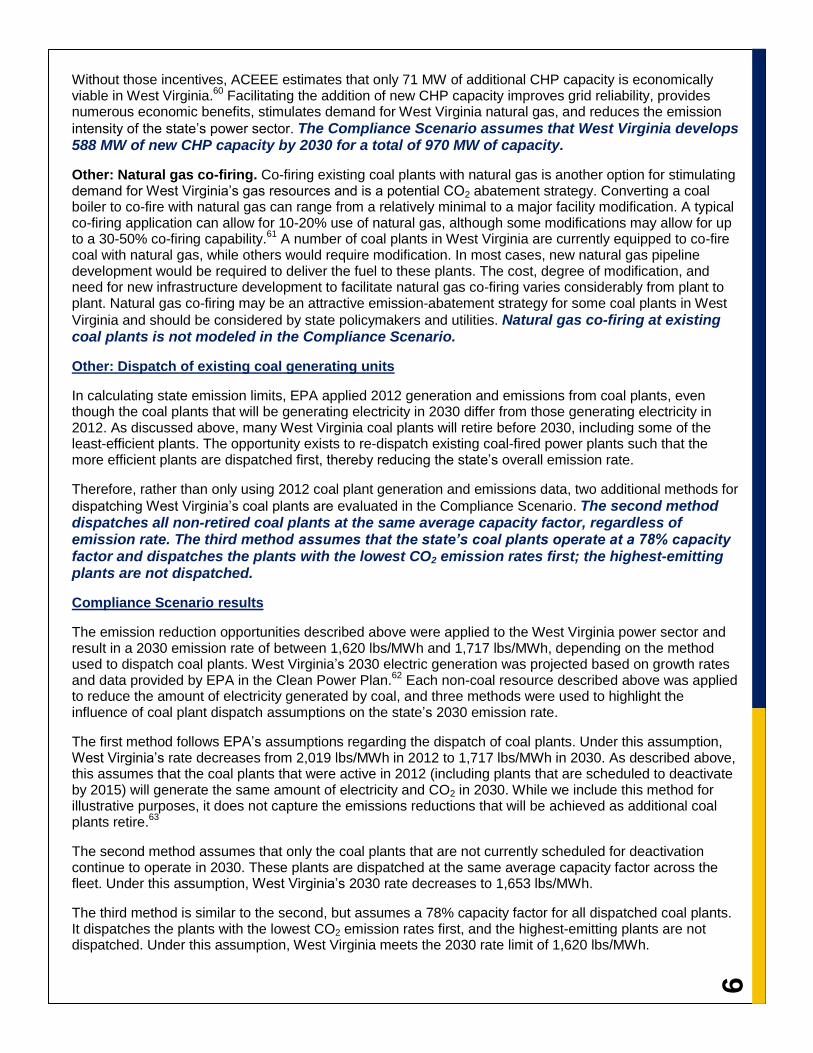
Natural gas prices have declined dramatically in recent years due to technological breakthroughs that have unleashed unprecedented development of the nation’s vast shale gas resources. The Marcellus Shale is one of the most prolific shale plays in the country and accounts for nearly 40% of total U.S. shale gas production.
52 Pennsylvania and West Virginia are the largest producers of Marcellus Shale natural gas, and
West Virginia has enormous opportunity to capitalize on expanded use of its natural gas resources. The construction of new NGCC plants, co-firing existing coal plants with natural gas, and building new combined heat and power (CHP) facilities would stimulate demand for West Virginia–produced natural gas, deliver consumers low-cost natural gas–fired electric generation, and provide emission-reduction benefits under the Clean Power Plan.
NATURAL GAS PRODUCTION FROM THE MARCELLUS SHALE53
Other: New NGCC plants. New NGCC power plants release fewer CO2 emissions, are less expensive to build, and provide the electric grid a more flexible generation resource than coal plants. Despite the benefits of integrating NGCC plants into the state’s electric power sector, none currently operate in West Virginia, although one has been proposed for construction in Moundsville, West Virginia. The Moundsville station could go into service as early as 2018 and would provide 525 MW of high-efficiency natural gas generation capacity.
54 This additional capacity would stimulate demand for West Virginia natural gas, provide resource
diversity, and reduce the emission intensity of the state’s power sector.55
The Compliance Scenario assumes that this plant becomes operational by 2030.
Other: Combined heat and power. CHP facilities provide 82,000 MW of generating capacity at over 3,700 industrial and commercial facilities across the country.
56 In addition to providing on-site generation for large
customers, CHP facilities achieve substantial improvement in energy efficiency by using the waste heat that would otherwise be released to the atmosphere to heat and cool buildings or to meet thermal needs of industrial processes. CHP installations can use a variety of fuels, but natural gas is the most common and accounts for 72% of installed CHP capacity. The addition of CHP resources, particularly at large commercial and industrial facilities, contributes to grid reliability, limits congestion and reduces transmission losses, improves business competitiveness through energy efficiency and energy cost management, and provides emission reduction benefits by displacing generation and emissions from coal-fired power plants.
57
West Virginia currently has 382 MW of installed CHP capacity58
and has significant potential for future growth. ACEEE estimates approximately 1,700 MW of remaining technical potential for CHP in West Virginia and that 588 MW of that is economically viable if utilities in the state are provided additional incentives.
59
0
2
4
6
8
10
12
14
16
2007 2008 2009 2010 2011 2012 2013 2014
Mill
ion
Mcf
/day
9
Without those incentives, ACEEE estimates that only 71 MW of additional CHP capacity is economically viable in West Virginia.
60 Facilitating the addition of new CHP capacity improves grid reliability, provides
numerous economic benefits, stimulates demand for West Virginia natural gas, and reduces the emission
intensity of the state’s power sector. The Compliance Scenario assumes that West Virginia develops 588 MW of new CHP capacity by 2030 for a total of 970 MW of capacity.
Other: Natural gas co-firing. Co-firing existing coal plants with natural gas is another option for stimulating demand for West Virginia’s gas resources and is a potential CO2 abatement strategy. Converting a coal boiler to co-fire with natural gas can range from a relatively minimal to a major facility modification. A typical co-firing application can allow for 10-20% use of natural gas, although some modifications may allow for up to a 30-50% co-firing capability.
61 A number of coal plants in West Virginia are currently equipped to co-fire
coal with natural gas, while others would require modification. In most cases, new natural gas pipeline development would be required to deliver the fuel to these plants. The cost, degree of modification, and need for new infrastructure development to facilitate natural gas co-firing varies considerably from plant to plant. Natural gas co-firing may be an attractive emission-abatement strategy for some coal plants in West
Virginia and should be considered by state policymakers and utilities. Natural gas co-firing at existing coal plants is not modeled in the Compliance Scenario.
Other: Dispatch of existing coal generating units
In calculating state emission limits, EPA applied 2012 generation and emissions from coal plants, even though the coal plants that will be generating electricity in 2030 differ from those generating electricity in 2012. As discussed above, many West Virginia coal plants will retire before 2030, including some of the least-efficient plants. The opportunity exists to re-dispatch existing coal-fired power plants such that the more efficient plants are dispatched first, thereby reducing the state’s overall emission rate.
Therefore, rather than only using 2012 coal plant generation and emissions data, two additional methods for
dispatching West Virginia’s coal plants are evaluated in the Compliance Scenario. The second method dispatches all non-retired coal plants at the same average capacity factor, regardless of emission rate. The third method assumes that the state’s coal plants operate at a 78% capacity factor and dispatches the plants with the lowest CO2 emission rates first; the highest-emitting plants are not dispatched.
Compliance Scenario results
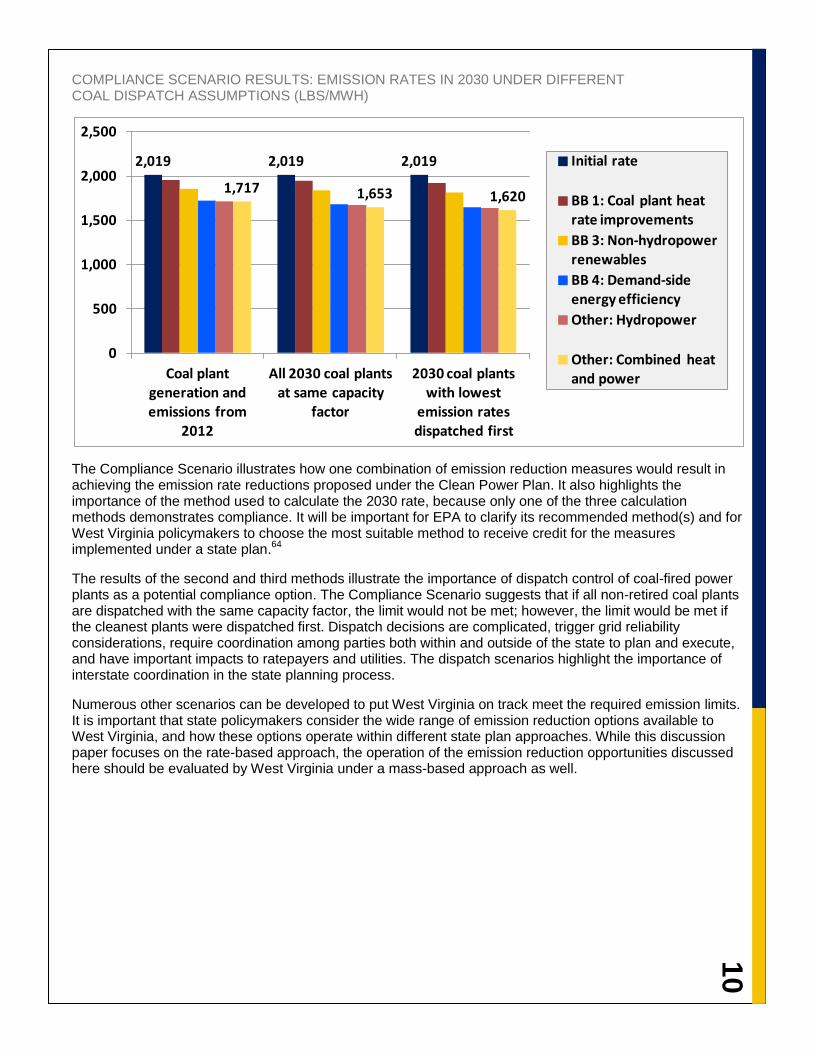
The emission reduction opportunities described above were applied to the West Virginia power sector and result in a 2030 emission rate of between 1,620 lbs/MWh and 1,717 lbs/MWh, depending on the method used to dispatch coal plants. West Virginia’s 2030 electric generation was projected based on growth rates and data provided by EPA in the Clean Power Plan.
62 Each non-coal resource described above was applied
to reduce the amount of electricity generated by coal, and three methods were used to highlight the influence of coal plant dispatch assumptions on the state’s 2030 emission rate.
The first method follows EPA’s assumptions regarding the dispatch of coal plants. Under this assumption, West Virginia’s rate decreases from 2,019 lbs/MWh in 2012 to 1,717 lbs/MWh in 2030. As described above, this assumes that the coal plants that were active in 2012 (including plants that are scheduled to deactivate by 2015) will generate the same amount of electricity and CO2 in 2030. While we include this method for illustrative purposes, it does not capture the emissions reductions that will be achieved as additional coal plants retire.
63
The second method assumes that only the coal plants that are not currently scheduled for deactivation continue to operate in 2030. These plants are dispatched at the same average capacity factor across the fleet. Under this assumption, West Virginia’s 2030 rate decreases to 1,653 lbs/MWh.
The third method is similar to the second, but assumes a 78% capacity factor for all dispatched coal plants. It dispatches the plants with the lowest CO2 emission rates first, and the highest-emitting plants are not dispatched. Under this assumption, West Virginia meets the 2030 rate limit of 1,620 lbs/MWh.
10
COMPLIANCE SCENARIO RESULTS: EMISSION RATES IN 2030 UNDER DIFFERENT COAL DISPATCH ASSUMPTIONS (LBS/MWH)
The Compliance Scenario illustrates how one combination of emission reduction measures would result in achieving the emission rate reductions proposed under the Clean Power Plan. It also highlights the importance of the method used to calculate the 2030 rate, because only one of the three calculation methods demonstrates compliance. It will be important for EPA to clarify its recommended method(s) and for West Virginia policymakers to choose the most suitable method to receive credit for the measures implemented under a state plan.
64
The results of the second and third methods illustrate the importance of dispatch control of coal-fired power plants as a potential compliance option. The Compliance Scenario suggests that if all non-retired coal plants are dispatched with the same capacity factor, the limit would not be met; however, the limit would be met if the cleanest plants were dispatched first. Dispatch decisions are complicated, trigger grid reliability considerations, require coordination among parties both within and outside of the state to plan and execute, and have important impacts to ratepayers and utilities. The dispatch scenarios highlight the importance of interstate coordination in the state planning process.
Numerous other scenarios can be developed to put West Virginia on track meet the required emission limits. It is important that state policymakers consider the wide range of emission reduction options available to West Virginia, and how these options operate within different state plan approaches. While this discussion paper focuses on the rate-based approach, the operation of the emission reduction opportunities discussed here should be evaluated by West Virginia under a mass-based approach as well.
2,019 2,019 2,019
1,717 1,653 1,620
0
500
1,000
1,500
2,000
2,500
Coal plant generation and emissions from
2012
All 2030 coal plants at same capacity
factor
2030 coal plants with lowest
emission rates dispatched first
Initial rate
BB 1: Coal plant heat rate improvements
BB 3: Non-hydropower renewables
BB 4: Demand-side energy efficiency
Other: Hydropower
Other: Combined heat and power
11
POLICY RECOMMENDATIONS
State plans must, among other things, demonstrate how the state will achieve emission performance levels that comply with the limits set in the Clean Power Plan. The emission reduction opportunities summarized above are some of the options that West Virginia should evaluate and include in its state plan, regardless of whether it adopts a rate- or mass-based approach. The policy framework needed to capture some of these opportunities, such as renewable energy standards and energy efficiency, can be achieved through legislation or regulatory changes made by the PSC using its existing authority. Other opportunities, such as power plant dispatch schedules or availability limits, involve complex pricing, reliability, environmental compliance (including compliance with CO2 limits), and other issues that require additional consultation between the DEP and PSC as well as those agencies’ counterparts in other states, PJM and the utilities, power producers, and other entities affected by the state plan.
The following policy recommendations outline four steps that West Virginia should take as part of a comprehensive energy strategy to put the state on a path toward compliance with the Clean Power Plan, while at the same time providing consumers reliable electricity service at reasonable costs, growing the state’s energy economy, and reducing the impact of energy production on the environment.
Policy Recommendation 1: Adopt an Energy Efficiency Resource Standard
West Virginia residents pay higher electricity bills than residents in most states and will see even higher bills next year following new rate increases requested by the state’s utilities. Unfortunately, West Virginia’s utilities do not offer customers in West Virginia the same level of energy efficiency service those same utilities offer customers in neighboring states. West Virginia should adopt an energy efficiency resource standard (EERS) that requires the state’s utilities to deliver more energy efficiency service in West Virginia.
In 2013, the Legislature considered, but failed to pass, House Bill (H.B.) 2210, the West Virginia Energy Efficiency Act. As proposed, the Act would set energy efficiency savings goals and direct the PSC to oversee the implementation of energy efficiency programs by the state’s utilities. H.B. 2210 would establish an EERS target of saving 15% of 2011 electricity sales by 2027 and saving 15% of 2011 peak demand by 2027.
65 To implement these targets, the bill would, among other things, direct the PSC to:
1. adopt ratemaking policies that provide direct cost recovery, decoupling, or other lost revenue recovery mechanisms and performance incentives;
2. require electric utilities to develop and implement energy efficiency and conservation programs that achieve verifiable electricity savings and peak demand reductions; and
3. require electric utilities to consult with the PSC regarding the design and adequacy of their electricity savings and demand reduction targets.
The Legislature should pass a revised version of H.B. 2210 that requires the state’s utilities to meet an energy efficiency goal of at least 15% by 2030. By adopting an EERS, West Virginia would join 24 other states (including neighbors Ohio, Maryland, Pennsylvania, and Virginia) that are already reaping the economic and energy benefits of energy efficiency. The adoption of an EERS in West Virginia would provide tangible economic benefits and a low-cost emission reduction measure that could be demonstrated in a state plan to help the state meet its CO2 emission reduction requirements under the Clean Power Plan.
12
Policy Recommendation 2: Revise the Current Energy Portfolio Standard to Include Binding Renewable Energy Targets
Renewable energy is a rapidly growing sector in the U.S. economy with strong potential for future growth in West Virginia. Twenty-nine states, including Maryland, Ohio, and Pennsylvania, have adopted renewable energy requirements
66 to capitalize on the energy and economic benefits of diversifying their energy
portfolios with these resources. West Virginia should revise the state’s Alternative and Renewable Energy Portfolio Standard (AREPS) to include binding targets for the development of new renewable energy resources.
The current AREPS was passed in 2010 and requires utilities and retail electric providers with over 30,000 residential customers to supply 10% of their retail electric supply with alternative and renewable sources between 2015 and 2019, 15% between 2020 and 2024, and 25% by 2025.
67 Alternative energy sources
include supercritical coal technology, coal bed methane, natural gas, fuel produced from coal gasification, waste coal, tire-derived fuel, and pumped storage hydroelectric. Renewable energy resources include solar photovoltaic or other solar-electric energy, solar thermal energy, wind, run-of-river hydroelectric, geothermal, biomass, fuel cell technology, and recycled energy (including exhaust heat from industrial or commercial processes, waste gas, or fuel that would otherwise be flared or vented).
68 The AREPS requirements can be
met entirely with fossil fuel–derived alternative energy sources; however, meaning the renewable energy portion of the standard is non-binding.
69 With non-binding renewable energy targets, the current AREPS is
not sufficient to demonstrate in a state plan the role renewable energy sources can play in achieving West Virginia’s required emission reductions under the Clean Power Plan.
The Legislature should revise the AREPS to require that a percentage of the state’s total electricity supply be met with electricity generated from renewable sources (such as wind, solar, hydropower, and biomass) by 2030.
70 The revised AREPS should retain the provision that out-of-state renewable energy projects may
satisfy the state’s renewable energy targets. The Legislature should also expand the “alternative” category to include the use of natural gas to co-fire with coal in existing coal plants. It should also consider carving out recycled energy as a separate category to encourage the expansion of CHP resources. Incorporating these revisions to the AREPS would expand West Virginia’s energy economy and help put the state on target to meet its CO2 emission reduction requirement under the Clean Power Plan.
Policy Recommendation 3: Encourage Greater Use of the State’s Natural Gas Resources
The Marcellus Shale is one of the largest shale gas deposits in the world and underlies nearly all of West Virginia and a significant part of three other states. Marcellus Shale gas production has grown steadily over the past five years, and estimates for continued growth in the Marcellus are a major driver of projections for low natural gas prices in the U.S. over the long-term. Low natural gas prices are driving down wholesale electricity prices, and West Virginia could benefit from expanded use of its natural gas resources in the electric sector. The state should explore opportunities to integrate more natural gas into its electricity mix by building new NGCC plants, building new CHP facilities, and co-firing existing coal plants with natural gas where feasible.
The DEP and PSC should work with West Virginia utilities to evaluate the costs, technical feasibility, and emission benefits of co-firing or repowering existing coal plants with natural gas through integrated resource planning (discussed below). The Legislature should facilitate the development of high-efficiency natural gas–fired CHP systems by updating net metering rules, providing financial incentives for CHP investment, and including a specific provision for CHP resources in a revised AREPS. The PSC could provide additional incentives by developing a standard offer program to streamline the terms and conditions under which the state’s electric utilities purchase electricity from customer-sited CHP facilities.
71
Greater integration of natural gas resources in West Virginia’s electric system would diversify the state’s electric sector, create additional demand for West Virginia–produced natural gas, and play an important role in helping the state meet its CO2 emission limits under the Clean Power Plan.
13
Policy Recommendation 4: Implement Integrated Resource Planning Requirements for Electric Utilities
Integrated resource planning is a process that requires utilities to evaluate a full range of supply- and demand-side resource alternatives for meeting projected electric power demand in order to provide adequate and reliable service to customers at the lowest system cost.
72 This full range of alternatives
includes, among other things, new generating capacity, power purchases, energy conservation and efficiency, cogeneration and district heating and cooling applications, and renewable energy resources.
73
The “integrated” aspect of integrated resource planning ensures that a utility considers demand-side resources (conservation and energy efficiency) on the same footing as the addition of supply-side resources when it evaluates options for meeting its future system needs.
74
The West Virginia Legislature passed H.B. 2803 in 2014, requiring the state’s utilities to engage in integrated resource planning.
75 Pursuant to the statute, the PSC must issue an order by March 31, 2015 directing the
state’s electric utilities to submit integrated resource plans that consider both supply-side and demand-side resources.
76 The PSC order should:
1. require utilities to evaluate supply- and demand-side resources on a consistent and integrated basis; 2. ensure that utility plans result in the selection of a portfolio of resources that represents a reasonable
balance of costs and risks for the utility and its customers; 3. require utility plans to evaluate resources over a long-term planning horizon; 4. require periodic plan updates; 5. include a transparent stakeholder process; and 6. provide clarity on how plans will be used subsequently for evaluating the prudence of the utility’s
resource acquisitions.77
A robust integrated resource planning requirement will ensure that energy efficiency, renewables, natural gas, coal, and other resources are evaluated on equal footing so that West Virginia consumers receive the benefits of a reliable energy system at the lowest system cost over the long term. Well-designed integrated resource planning rules will also provide an important framework for evaluating and securing the lowest-cost compliance options under the Clean Power Plan.
14
CONCLUSIONS
Achieving compliance with the Clean Power Plan presents significant challenges for West Virginia. Given the state’s heavy reliance on coal-fired electric generation and the portion of the state’s economy that depends on the coal extraction industry, West Virginia will likely bear a heavy burden associated with implementation of the Clean Power Plan. In order to minimize the impact of the proposed rule on the state, policymakers will need to take advantage of the flexibility provided by EPA to shape a strategy for West Virginia that reflects its unique circumstances and leverages its strengths. West Virginia is fortunate in that it has tremendous energy resources in addition to coal, and these other resources—including natural gas, renewable energy (wind, solar, hydropower), and energy efficiency—are relatively untapped.
Developing a compliance strategy for the Clean Power Plan will require tapping into these other energy resources and crafting a comprehensive energy plan that will build upon the state’s coal resources—through co-firing natural gas with coal, for example—while stimulating investments in energy efficiency that will help West Virginians manage their energy costs in addition to reducing CO2 emissions.
A successful strategy will also require the cooperation of the state Legislature, the DEP, and the PSC. Only by working together can the state ensure that the requirements of the Clean Power Plan are met in a timely and cost-effective manner. Although DEP can be expected to take the lead in developing West Virginia’s compliance strategy, a compliance option based on scaling up renewable resources and energy efficiency programs, for example, would involve matters within the purview of the PSC, which also has the capability to calculate the impacts on electricity rates associated with various compliance options. Navigating a path forward for West Virginia will require a comprehensive approach, both in terms of the energy resources deployed and the involvement of policymakers throughout state government.
The Center for Energy and Sustainable Development at the West Virginia University College of Law is a resource for West Virginia policymakers, the energy industry, and other stakeholders navigating the Clean Power Plan. Downstream Strategies provides expertise in compliance, modeling, and policy analysis on the Clean Power Plan and other energy and environmental matters. This discussion paper is intended to generate feedback to help inform future analysis and stimulate dialogue between policymakers and stakeholders in West Virginia as the EPA rulemaking process moves forward. In the coming months, the Center and Downstream Strategies will release additional analyses on options available in West Virginia to meet emission limits under the Clean Power Plan.
15
ENDNOTES
1 The proposed rule was published in the Federal Register on June 18, 2014. Carbon Pollution Emission Guidelines for Existing Stationary
Sources: Electric Utility Generating Units, 79 Fed. Reg. 34830 (proposed June 18, 2014) (to be codified at 40 C.F.R. pt. 60) available at
http://www.gpo.gov/fdsys/pkg/FR-2014-06-18/pdf/2014-13726.pdf. [hereinafter Clean Power Plan]. Page references to the Clean Power Plan
are to the June 2, 2014 pre-Federal Register publication version.
2 This discussion paper was written before the proposed rule was finalized. The state goal calculations and other aspects of the proposed rule
may be changed in the final rule.
3 Power plants covered by the rules are referred to as “affected electric generating units” (EGU) and the terms “power plant” and “EGU” are
used interchangeably in this document. EPA defines an affected EGU as a stationary combustion turbine, steam generating turbine unit or
integrated gasification combustion turbine that is (1) capable of combusting more than 250 MMbtu/MWh heat input of fossil fuel and (2)
constructed for the purpose of supplying 1/3 or more of its potential net-electric output capacity and more than 219,000 MWh to any utility
distribution system. See Clean Power Plan, Goal Computation Technical Support Document 5 available at
http://www2.epa.gov/sites/production/files/2014-06/documents/20140602tsd-goal-computation.pdf [hereinafter Goal Computation Technical
Support Document].
4 Clean Power Plan 155-71.
5 Clean Power Plan 171-95.
6 Clean Power Plan 195-207.
7 Clean Power Plan 219-31.
8 This formula omits building blocks that do not apply in West Virginia: at-risk and under-construction nuclear and existing NGCC.
9 PJM is the regional transmission organization that coordinates wholesale electricity movement in West Virginia, 12 other states and the
District of Columbia. See PJM, http://www.pjm.com/.
10 West Virginia Public Service Commission, http://www.psc.state.wv.us/utilities/default.htm.
11 State Electricity Profiles, West Virginia Electricity Profile 2012, U.S. ENERGY INFORMATION ADMINISTRATION,
http://www.eia.gov/electricity/state/westvirginia.
12 Id.
13 PJM Generator Deactivation Summary Sheets, PJM (as of July 18, 2014), http://www.pjm.com/planning/generation-deactivation/gd-
summaries.aspx.
14 See, e.g., Why the Rate Hikes?, ENERGY EFFICIENT WEST VIRGINIA, http://www.eewv.org/why-the-rate-hikes (noting that the average
customer of APCo and WPCo saw their electricity bill increase nearly 60% between 2007 and 2011 and the average customer of Mon Power
and PE saw their bills increase over 30% since 2008).
15 Max Neubauer, et al., A Guide to Growing an Energy Efficient Economy in Mississippi, AMERICAN COUNCIL FOR AN ENERGY EFFICIENT
ECONOMY 2 (Nov. 2013) available at http://www.aceee.org/research-report/e13m [hereinafter Neubauer, Energy Efficient Mississippi]
16 In June 2014, APCo and WPCo filed for a 17% overall rate increase and Mon Power and PE filed for a 16.5% increase in residential rates.
Under the requested increases, APCo and WPCo residential customers using 1000 kWh per month would see bills rise from $94.00 to
$115.77 while Mon Power and PE residential customers using 1000 kWh per month would see bills rise from $92.62 to $107.98. See, News
Release, Appalachian Power, Wheeling Power seek increase in West Virginia to cover growing operating costs, APPALACHIAN POWER (June
30, 2014) https://www.appalachianpower.com/info/news/viewRelease.aspx?releaseID=1589; News Release, Mon Power and Potomac Edison
Amend West Virginia Public Service Commission Rate Case, FIRSTENERGY (June 13, 2014)
https://www.firstenergycorp.com/content/fecorp/newsroom/news_releases/mon-power-and-potomac-edison-amend-west-virginia-public-
service-.html.
17 Neubauer Energy Efficient Mississippi supra note 15 at 2.
18 Energy Efficiency Policy Outlook for West Virginia, MARSHALL UNIVERSITY CENTER FOR BUSINESS AND ECONOMIC RESEARCH (Aug. 15, 2012)
available at http://wvcommerce.org/App_Media/assets/doc/energy/EOD_Recommendations_-_Energy_Efficiency.pdf.
19 Coal, CENTER FOR CLIMATE AND ENERGY SOLUTIONS, http://www.c2es.org/energy/source/coal.
20 Frequently Asked Questions, What is U.S. Electricity Generation by Fuel Source?, U.S. ENERGY INFORMATION ADMINISTRATION,
http://www.eia.gov/tools/faqs/faq.cfm?id=427&t=3 [hereinafter Frequently Asked Questions].
21 Today in Energy, Coal Regains Some Electric Generation Market Share from Natural Gas, U.S. ENERGY INFORMATION ADMINISTRATION (May
23, 2014), http://www.eia.gov/todayinenergy/detail.cfm?id=11391.
22 Fossil Energy Opportunities for West Virginia, WEST VIRGINIA UNIVERSITY BBER 23 (2012) available at
http://be.wvu.edu/bber/pdfs/Fossil_Fuels_Energy_Opportunities_WV.pdf.
23 McIlmoil R, Hansen E, Askins N, Betcher M., The Continuing Decline in Demand for Central Appalachian Coal: Market and Regulatory
Influences, DOWNSTREAM STRATEGIES, (May 2013) available at http://www.downstreamstrategies.com/documents/reports_publication/the-
continuing-decline-in-demand-for-capp-coal.pdf
24 In 2013, coal provided 39% of U.S. electric generation, natural gas 27%, Nuclear 19%, hydropower 7%, other renewable 6%, petroleum 1%,
other gases <1%. See, Frequently Asked Questions, supra note 20.
16
25
This report does not address compliance with the interim target.
26 Electric Power Monthly, U.S. ENERGY INFORMATION ADMINISTRATION (Aug. 25, 2014) available at
http://www.eia.gov/electricity/monthly/pdf/epm.pdf [hereinafter Electric Power Monthly 1]
27 Hydropower is Available, NATIONAL HYDROPOWER ASSOCIATION, http://www.hydro.org/why-hydro/available/.
28 West Virginia State Energy Profile, U.S. ENERGY INFORMATION ADMINISTRATION (March 27, 2014) http://www.eia.gov/state/print.cfm?sid=WV.
29 Electric Power Monthly 1 supra note 26.
30 Strengthening the EPA’s Clean Power Plan, UNION OF CONCERNED SCIENTISTS (Oct. 2014) available at
http://www.ucsusa.org/sites/default/files/attach/2014/10/Strengthening-the-EPA-Clean-Power-Plan.pdf.
31 This approach recognizes that a given state's RPS often allow for renewable energy projects developed in one state to satisfy the RPS
requirements of another state and acknowledges the existence of renewable energy certificates for interstate trading of renewable energy
attributes. Renewable energy projections modeled in the Compliance Scenario assume the final rule allows for in and out-of-state renewable
generation to count toward compliance with West Virginia's 2030 emission limit. EPA is taking comment on this approach, as well as an
alternative approach that would allow states to claim credit only for renewable energy projects located within that state. See Clean Power Plan
495-96.
32 Press Release, Wind Turbine Technology Played Key Role in Wind Energy’s Record Breaking Growth and Cost Decline, AMERICAN WIND
ENERGY ASSOCIATION (March 14, 2014) http://www.awea.org/MediaCenter/pressrelease.aspx?ItemNumber=6218.
33 U.S. Wind Industry Second Quarter 2014 Market Report, AMERICAN WIND ENERGY ASSOCIATION (July 31, 2014) http://awea.files.cms-
plus.com/FileDownloads/pdfs/2Q2014%20AWEA%20Market%20Report%20Public%20Version%20.pdf
34 Renewable Energy in the State of West Virginia, WEST VIRGINIA DIVISION OF ENERGY (June 2014)
http://www.wvcommerce.org/App_Media/assets/doc/energy/june2014-presentations/01_-_Herholdt_Renewable_Energy_Conference.pdf
35 Press Release, American Wind Power Sees Unprecedented Growth Entering 2014, AMERICAN WIND ENERGY ASSOCIATION (January 2014)
http://www.awea.org/MediaCenter/pressrelease.aspx?ItemNumber=6044
36 Wind 101 the Basics of Wind Energy, AMERICAN WIND ENERGY ASSOCIATION,
http://www.awea.org/Resources/Content.aspx?ItemNumber=900&navItemNumber=587.
37 Estimates of Windy Land Area and Wind Energy Potential, NATIONAL RENEWABLE ENERGY LABORATORY (2011) available at
http://apps2.eere.energy.gov/wind/windexchange/pdfs/wind_maps/wind_potential_80m_30percent.pdf
38 Solar Energy Facts: Q2 2014, SOLAR ENERGY INDUSTRIES ASSOCIATION,
http://www.seia.org/sites/default/files/Q2%202014%20SMI%20Fact%20Sheet_0.pdf
39 Today in Energy, Natural Gas, Solar and Wind Lead Power Plant Capacity Additions in First Half of 2014, U.S. ENERGY INFORMATION
ADMINISTRATION (Sept. 9, 2014) http://www.eia.gov/todayinenergy/detail.cfm?id=17891
40 National Solar Jobs Census 2013, THE SOLAR FOUNDATION, available at
http://www.thesolarfoundation.org/sites/thesolarfoundation.org/files/TSF%20Solar%20Jobs%20Census%202013.pdf.
41 2014 Alternative and Renewable Energy Resource Planning Assessment, WEST VIRGINIA PUBLIC SERVICE COMMISSION (2014) available at
http://www.psc.state.wv.us/Special_Reports/Alternative_and_Renewable_Report_2014.pdf [hereinafter 2014 AREPS Assessment].
42 U.S. Renewable Energy Technical Potentials: A GIS-Based Analysis, NATIONAL RENEWABLE ENERGY LABORATORY (July 2012) available at
http://www.nrel.gov/docs/fy12osti/51946.pdf
43 State Solar Policy, SOLAR ENERGY INDUSTRIES ASSOCIATION, http://www.seia.org/policy/state-solar-policy
44 Energy Efficiency Resource Standards, DATABASE FOR STATE INCENTIVES FOR RENEWABLES & EFFICIENCY (Feb. 2013) available at
http://www.dsireusa.org/documents/summarymaps/EERS_map.pdf; Annie Downs, et al., The 2013 State Energy Efficiency Scorecard
AMERICAN COUNCIL FOR AN ENERGY EFFICIENT ECONOMY (2013) available at
http://www.aceee.org/sites/default/files/publications/researchreports/e13k.pdf.
45 James Van Nostrand, The Case for Energy Efficiency Investments in West Virginia, CENTER FOR ENERGY AND SUSTAINABLE DEVELOPMENT
(March 2013) available at http://energy.law.wvu.edu/r/download/155988.
46 See, e.g., Sara Hayes, et al. Change Is in the Air: How States Can Harness Energy Efficiency to Strengthen the Economy and Reduce
Pollution, AMERICAN COUNCIL FOR AN ENERGY EFFICIENT ECONOMY (April 2014) available at http://www.aceee.org/research-report/e1401.
47 Hydropower is Available, NATIONAL HYDROPOWER ASSOCIATION, http://www.hydro.org/why-hydro/available/.
48 2014 AREPS Assessment, supra note 41 at 10.
49 State Electricity Profiles, West Virginia Electricity Profile 2012, U.S. ENERGY INFORMATION ADMINISTRATION
http://www.eia.gov/electricity/state/westvirginia/.
50 Emily Holden, The Case of the Missing Hydropower Credit, THE MORNING CONSULT (Aug. 17, 2014)
http://themorningconsult.com/2014/08/case-missing-hydropower-credit/
51 2014 AREPS Assessment, supra note 41 at 12, 13.
52 Today in Energy, Marcellus Region Production Continues Growth, U.S. ENERGY INFORMATION ADMINISTRATION (Aug. 5, 2014)
http://www.eia.gov/todayinenergy/detail.cfm?id=17411.
53 Drilling Productivity Report, U.S. ENERGY INFORMATION ADMINISTRATION, http://www.eia.gov/petroleum/drilling/xls/dpr-data.xlsx.
17
54
Generation Interconnection System Impact Study Report for PJM Interconnection Request Queue Position Y3-068, Washington 138 kV
(June 2014) available at http://www.pjm.com/pub/planning/project-queues/impact_studies/y3068_imp.pdf.
55 For the purpose of calculating West Virginia’s 2030 rate, new NGCC capacity is assumed to operate at a 70% capacity factor and displace
and equal amount of coal generation. The generation and emissions from new NGCC are not included in the Compliance Scenario rate
calculation. EPA, however, requests comment on whether generation and emissions from new NGCC should be included in calculations for
compliance under the Clean Power Plan or whether the calculation should only include generation and emissions reductions from affected
EGUs that result from new NGCC. See Clean Power Plan 505.
56 Combined Heat and Power: A Clean Energy Solution 11, U.S. DEPARTMENT OF ENERGY AND U.S. ENVIRONMENTAL PROTECTION AGENCY
(Aug. 2012) available at http://www1.eere.energy.gov/manufacturing/distributedenergy/pdfs/chp_clean_energy_solution.pdf.
57 The Compliance Scenario assumes that new CHP displaces generation from affected coal plants. The emissions and generation from new
CHP are not included in the rate calculation.
58 Combined Heat and Power Units Located in West Virginia, U.S. DEPARTMENT OF ENERGY AND ICF INTERNATIONAL, http://www.eea-
inc.com/chpdata/States/WV.html.
59 Anna Chittum & Terry Sullivan, Coal Retirements and CHP Investment Opportunity 54, AMERICAN COUNCIL FOR AN ENERGY EFFICIENT
ECONOMY (Sept. 2012) available at http://www.aceee.org/research-report/ie123.
60 Id.
61 Brian Reinhart, P.E. et al. Paper of the Year, A Case Study on Coal to Natural Gas Fuel Switch, BLACK & VEATCH (Dec. 2012) available at
http://bv.com/Home/news/solutions/energy/paper-of-the-year-a-case-study-on-coal-to-natural-gas-fuel-switch.
62 Clean Power Plan, Technical Support Document, GHG Abatement Measures, Data File: GHG Abatement Measures, Scenario 1 available at
http://www2.epa.gov/carbon-pollution-standards/clean-power-plan-proposed-rule-technical-documents.
63 This is an especially important consideration under a mass-based approach, as planned coal plant retirements represent significant total
emission reductions that may favor the selection of a mass-based compliance program over a rate-based compliance program.
64 This paper considers a state plan demonstrating compliance under a rate-based approach. Considerations under a mass based approach
will be presented in future analyses.
65 W.Va. Code § 24-2G-1.
66 See, e.g., DATABASE FOR STATE INCENTIVES FOR RENEWABLES AND EFFICIENCY, http://www.dsireusa.org/.
67 W.Va. Code § 24-2F-1 et seq.; see also, West Virginia Incentives/Policies for Renewable & Efficiency, DATABASE FOR STATE INCENTIVES FOR
RENEWABLES & EFFICIENCY, http://www.dsireusa.org/incentives/incentive.cfm?Incentive_Code=WV05R&re=0&ee=0.
68 W.Va. Code § 24-2F-1 et seq.
69 Id.
70 Expanding the definition of “renewable” to encourage co-firing biomass with coal would take advantage of the state’s considerable biomass
potential and reduce CO2 emissions from existing coal plants. EPA solicits comment on how biomass co-firing should be treated under section
111(d). See Clean Power Plan 509-11.
71 James Van Nostrand, An Energy and Sustainability Roadmap for West Virginia, 115 WEST VIRGINIA LAW REVIEW 885 (2013); James Van
Nostrand, The Case for Promoting Utilization of West Virginia’s Vast Natural Gas Resources: Combined Heat and Power (CHP) Facilities,
CENTER FOR ENERGY AND SUSTAINABLE DEVELOPMENT (Sept. 2013) available at http://energy.law.wvu.edu/r/download/169790.
72 Energy Policy Act of 1992, § 111(d)(19), 16 U.S.C. § 2602(19).
73 Id.
74 James Van Nostrand, The Case for Integrated Resource Planning in West Virginia, CENTER FOR ENERGY AN D SUSTAINABLE DEVELOPMENT
(Dec. 2012) available at http://energy.law.wvu.edu/r/download/148340 [hereinafter Van Nostrand, The Case for Integrated Resource Planning
in West Virginia].
75 W.Va. Code § 24-2-19.
76 W.Va. Code § 24-2-19 (e).
77 See, e.g., Van Nostrand, The Case for Integrated Resource Planning in West Virginia, supra note 73.