carbon dioxide reforming of methane on …etd.lib.metu.edu.tr/upload/12618204/index.pdf ·...
TRANSCRIPT

CARBON DIOXIDE REFORMING OF METHANE
ON NI-BASED BIMETALLIC CATALYSTS
A THESIS SUBMITTED TO
THE GRADUATE SCHOOL OF NATURAL AND APPLIED SCIENCES
OF
MIDDLE EAST TECHNICAL UNIVERSITY
BY
HALE AY
IN PARTIAL FULFILLMENT OF THE REQUIREMENTS
FOR
THE DEGREE OF DOCTOR OF PHILOSOPHY
IN
CHEMICAL ENGINEERING
JUNE 2014


Approval of the thesis:
CARBON DIOXIDE REFORMING OF METHANE
ON NI-BASED BIMETALLIC CATALYSTS
submitted by HALE AY in partial fulfillment of the requirements for the degree of
Doctor of Philosophy in Chemical Engineering Department, Middle East
Technical University by,
Prof. Dr. Canan Özgen _____________________
Dean, Graduate School of Natural and Applied Sciences
Prof. Dr. Halil Kalıpçılar _____________________
Head of Department, Chemical Engineering
Prof. Dr. Deniz Üner _____________________
Supervisor, Chemical Engineering Dept., METU
Examining Committee Members:
Prof. Dr. Saim Özkar _____________________
Chemistry Dept., METU
Prof. Dr. Deniz Üner _____________________
Chemical Engineering Dept., METU
Prof. Dr. Timur Doğu _____________________
Chemical Engineering Dept., METU
Prof. Dr. Zeynep İlsen Önsan _____________________
Chemical Engineering Dept., Boğaziçi University
Assist. Prof. Dr. Harun Koku _____________________
Chemical Engineering Dept., METU
Date: 04.06.2014

iv
I hereby declare that all information in this document has been obtained and
presented in accordance with academic rules and ethical conduct. I also declare
that, as required by these rules and conduct, I have fully cited and referenced
all material and results that are not original to this work.
Name, Last name: Hale AY
Signature:

v
ABSTRACT
CARBON DIOXIDE REFORMING OF METHANE
ON NI-BASED BIMETALLIC CATALYTS
Ay, Hale
Ph.D., Department of Chemical Engineering
Supervisor: Prof. Dr. Deniz Üner
June 2014, 201 Pages
Carbon dioxide reforming of methane is a promising process for the utilization of
two important greenhouse gases and the production of synthesis gas with a lower
H2/CO ratio which is preferred in Fischer–Tropsch synthesis. Ni catalysts have taken
great interest in dry reforming of methane due to their high catalytic activity, easy
availability and low cost. However, the main restriction of Ni-based catalysts is the
formation of carbon which causes catalyst deactivation. The objective of this thesis
was to reduce carbon formation and improve the life time of Ni based catalysts.
Al2O3 supported and CeO2 supported Ni, Co and Ni-Co catalysts were prepared via
incipient wetness impregnation method. Al2O3 was used as support material due to
its high thermal stability. CeO2 was used as another support material due to its redox
Ce4+/Ce3+ sites and ability to exchange oxygen. Co was introduced to the Ni-based
catalyst in order to understand the effect of bimetallic catalysts in dry reforming of
methane. The catalysts prepared by incipient wetness impregnation method were
calcined at two different temperatures (700°C and 900°C) to elucidate the effect of
calcination temperature. As an alternative to conventional preparation methods,
Ni/Al2O3 catalysts were also prepared by polyol method.

vi
Ni/Al2O3 and Ni-Co/Al2O3 catalysts exhibitied comparable activities in terms of
CH4 and CO2 conversion; H2 and CO yield. While doing the calcination at 700°C or
900°C did not really affect the catalytic performances of Ni/Al2O3 and Ni-Co/Al2O3,
it had significant influence on the performance of Co/Al2O3. Carrying out the
calcination at higher temperatures was found to be more preferable in terms of
carbon deposition. Higher amount of coke was deposited on Ni-Co/Al2O3 compared
to Ni/Al2O3 when the calcination was done at 700°C. DRIFTS and microcalorimetry
studies showed that CO2 activation took place on Al2O3 for both Ni/Al2O3 and Ni-
Co/Al2O3 catalysts. 13C NMR characterization of deposited coke demonstrated that
it not only originated from CH4, but CO2 had also significant role in coke formation.
Polyol process was employed to obtain Ni/Al2O3 catalysts in the presence of PVP as
stabilizer and ethylene glycol as both solvent and reducing agent. The effect of
PVP/Ni ratio was studied. Ni/Al2O3-without-PVP and Ni/Al2O3-PVP/Ni=2.5
catalysts exhibited quite high performance at 600°C and 700°C without making a
reduction step before the reaction.
The activities of CeO2 supported catalysts decreased with increasing calcination
temperature. While Ni/CeO2 and Ni-Co/CeO2 provided comparable high activities,
Co/CeO2 was shown to be an inactive catalyst for dry reforming of methane reaction
at the specified operating conditions.
O2 and CO pulse experiments were done to get information about the redox
properties of different kinds of ceria samples, including commercial ceria,
coprecipitated ceria and ceria fibers. The ceria fibers having the lowest surface area
was shown to have the highest oxygen uptake value. This phenomenon
demonstrated that the oxygen storage capacity of the ceria samples depended
strongly on the morphology.
Keywords: dry reforming of methane, carbon dioxide, coke, 13C NMR, Ni, Co,
Al2O3, CeO2

vii
ÖZ
Nİ-BAZLI BİMETALİK KATALİZÖRLERDE
METANIN KARBONDİOKSİT REFORMASYONU
Ay, Hale
Doktora, Kimya Mühendisliği Bölümü
Tez Yöneticisi: Prof. Dr. Deniz Üner
Haziran 2014, 201 sayfa
Metanın karbon dioksit reformasyonu, iki önemli sera gazının kullanımı ve Fischer–
Tropsch sentezinde tercih edilen düşük H2/CO oranlı sentez gazı üretimi için ümit
verici bir prosestir. Yüksek katalitik aktivitesi, elde edilmesindeki kolaylığı ve düşük
maliyeti nedeniyle Ni katalizörleri metanın kuru reformasyonunda büyük ilgi
çekmiştir. Ancak, Ni bazlı katalizörlerin başlıca kısıtlaması katalizör
deaktivasyonuna sebep olan karbon oluşumudur. Bu tezin amacı, Ni bazlı
katalizörlerin karbon oluşumunu azaltmak ve yaşam süresini artırmaktır.
Al2O3 destekli ve CeO2 destekli Ni, Co ve Ni-Co katalizörleri ıslaklık başlangıcı
emdirme metoduyla hazırlanmıştır. Yüksek ısıl kararlılığı nedeniyle Al2O3, destek
maddesi olarak kullanılmıştır. Ce4+/Ce3+ redoks siteleri ve oksijen alıp verebilme
yeteneğinden dolayı CeO2, diğer bir destek maddesi olarak kullanılmıştır. Çift
metalli katalizörlerin metanın kuru reformasyonundaki etkisini anlayabilmek için
Ni-bazlı katalizöre Co eklenmiştir. Kalsinasyon sıcaklığının etkisini açıklamak için
ıslaklık başlangıcı emdirme metoduyla hazırlanan katalizörler iki farklı sıcaklıkta
(700°C ve 900°C) kalsine edilmiştir. Geleneksel hazırlama metotlarınına alternatif
olarak Ni/Al2O3 katalizörleri, poliol metodu ile de hazırlanmıştır.

viii
Ni/Al2O3 ve Ni-Co/Al2O3 katalizörleri CH4 ve CO2 dönüşümü; H2 ve CO verimi
bakımından karşılaştırılabilir aktivite sergilemiştir. Kalsinasyonun 700°C ya da
900°C’de yapılması Ni/Al2O3 ve Ni-Co/Al2O3’ün katalitik performansını ciddi
şekilde etkilemezken, Co/Al2O3’ün performansı üzerinde önemli etkisi olmuştur.
Karbon birikimi açısından kalsinasyonunun yüksek sıcaklıkta yapılması daha tercih
edilir bulunmuştur. Kalsinasyon 700°C’de gerçekleştirildiğinde, Ni/Al2O3’e kıylasla
Ni-Co/Al2O3 üzerinde daha fazla miktarda kok birikmiştir. DRIFTS ve
mikrokalorimetri çalışmaları, hem Ni/Al2O3 hem de Ni-Co/Al2O3 katalizörü için
CO2 aktivasyonunun Al2O3 üzerinde gerçekleştiğini göstermiştir. Biriken kokun 13C
NMR karakterizasyonu, kokun sadece CH4’ten kaynaklanmadığını, CO2’nin de kok
oluşumunda önemli rolü olduğunu göstermiştir.
Ni/Al2O3 katalizörleri, bağlayıcı olarak PVP, çözücü ve indirgen madde olarak etilen
glikol varlığında poliol prosesi kullanılarak elde edilmiştir. PVP/Ni oranı etkisi
çalışılmıştır. Ni/Al2O3-PVP-içermeyen and Ni/Al2O3-PVP/Ni=2.5 katalizörleri
600°C ve 700°C’de tepkime öncesinde indirgeme yapmaksızın oldukça yüksek
performans sergilemiştir.
CeO2 destekli katalizörlerin aktiviteleri artan kalsinasyon sıcaklığıyla beraber
düşmüştür. Ni/CeO2 ve Ni-Co/CeO2 karşılaştırılabilir yüksek aktivite gösterirken,
Co/CeO2’nin belirlenen çalışma koşullarında metanın kuru reform reaksiyonu için
aktif bir katalizör olmadığı gösterilmiştir.
Ticari seryum, beraber çökeltilen seryum ve seryum liflerini kapsayan farklı seryum
örneklerinin redoks özellikleri hakkında bilgi sahibi olmak için O2 ve CO vurum
deneyleri yapılmıştır. En düşük yüzey alanına sahip seryum liflerinin en yüksek
oksijen alma değerine sahip olduğu gösterilmiştir. Bu olay seryum örneklerinin
oksijen depolama özelliklerinin ciddi şekilde morfolojiye bağlı olduğunu ortaya
koymuştur.
Anahtar kelimeler: metanın kuru reformasyonu, karbon dioksit, kok, 13C NMR, Ni,
Co, Al2O3, CeO2

ix
To my beloved mother and father…

x
ACKNOWLEDGEMENTS
I would like to thank my thesis supervisor Prof. Dr. Deniz Üner for her support,
advice and guidance throughout the study. Not only I developed strong academic
skills, but also deep insight in research equipment as a result of her uncompromising
do-it-yourself philosophy in the laboratory.
My brief visits to Prof. Dr. Joerg Schneider’s laboratory at Technical University of
Darmstadt and Prof. Dr. Martin Mühler’s laboratory at Ruhr University Bochum
broadened my perspective both academically and personally. I am thankful to Prof.
Dr. Joerg Schneider and Prof. Dr. Martin Mühler for giving me the opportunity to
work in their laboratories.
Thanks are due to Prof. Dr. Jeffry A. Reimer and his team from University of
California, Berkeley for NMR measurements.
I would like to thank former and present CACTUS research group members for their
companionship and help.
I would like to present my thanks to the technical staff of Chemical Engineering
Department.
Special thanks are due to METU Central Laboratory for TEM characterizations.
Project grant of TUBITAK 112M561 and TUBITAK Inten-C-107M447 are
gratefully acknowledged.
Most importantly I would like to express my endless thanks to my beloved mother
and father for their continuous love, encouragement and support through my life.

xi
TABLE OF CONTENTS
ABSTRACT ................................................................................................................ v
ÖZ ............................................................................................................................. vii
ACKNOWLEDGEMENTS ........................................................................................ x
TABLE OF CONTENTS ........................................................................................... xi
LIST OF TABLES .................................................................................................... xv
LIST OF FIGURES ................................................................................................. xvi
CHAPTERS
1. INTRODUCTION................................................................................................... 1
1.1 Energy and Synthesis Gas ................................................................................. 1
1.2 Greenhouse Gases and Global Warming ........................................................... 3
1.3 Objectives .......................................................................................................... 4
2. REFORMING OF METHANE TO SYTHESIS GAS............................................ 7
2.1 Steam Reforming of Methane .......................................................................... 7
2.2 Partial Oxidation of Methane ........................................................................... 8
2.3 Carbon dioxide Reforming of Methane ............................................................ 9
2.3.1 Thermodynamic Analysis of Carbon dioxide Reforming of Methane .... 10
2.3.2 Mechanism of Carbon dioxide Reforming of Methane ........................... 14
2.3.3 Deactivation due to Carbon Deposition ................................................... 19
3. EXPERIMENTAL ................................................................................................ 25
3.1 Catalyst preparation ........................................................................................ 25
3.1.1 Preparation of Ni/Al2O3, Co/Al2O3 and Ni-Co/Al2O3 by incipient wetness
impregnation method ....................................................................................... 25
3.1.2 Preparation of Ni/Al2O3 by polyol method .............................................. 26
3.1.3 Preparation of Ni/CeO2, Co/CeO2 and Ni-Co/CeO2 by incipient wetness
impregnation method ....................................................................................... 27
3.1.4 Preparation of CeO2 by exotemplating method ....................................... 27
3.2 Catalyst characterization ................................................................................ 29

xii
3.2.1 X-Ray Diffraction (XRD) Analysis ......................................................... 29
3.2.2 Surface Area, Pore Size Distribution and Adsorption-Desorption
Isotherms ............................................................................................................ 29
3.2.3 Temperature Programmed Reduction (TPR) Analysis ............................ 29
3.2.4 DRIFTS .................................................................................................... 30
3.2.5 Microcalorimetry ..................................................................................... 31
3.2.6 Thermal Gravimetric Analysis (TGA) ...................................................... 33
3.2.7 Transmission Electron Microscopy (TEM) ............................................. 33
3.2.7.1 High Resolution Transmission Electron Microscopy(HRTEM ) ....... 33
3.2.7.2 High Contrast Transmission Electron Microscopy (HCTEM) .......... 33
3.2.8 Scanning Electron Microscopy (SEM ) .................................................... 34
3.2.9 Nuclear Magnetic Resonance (NMR) ...................................................... 34
3.3 Dry Reforming Reaction Tests ....................................................................... 34
3.4 Redox Experiments on Ceria Samples ........................................................... 37
4. DRY REFORMING OF METHANE ON Al2O3 SUPPORTED Ni, Co and Ni-Co
CATALYSTS PREPARED BY INCIPIENT WETNESS IMPREGNATION
METHOD ................................................................................................................. 39
4.1 Introduction ..................................................................................................... 39
4.2 Results and Discussion ................................................................................... 45
4.2.1 Characterization of commercial Al2O3 ..................................................... 45
4.2.1.1 X-Ray Diffraction (XRD) Analysis ................................................... 45
4.2.1.2 Surface Area, Pore Size Distribution and Adsorption-Desorption
Isotherms ......................................................................................................... 46
4.2.2 Characterization of fresh catalysts ........................................................... 48
4.2.2.1 X-Ray Diffraction (XRD) Analysis ................................................... 48
4.2.2.2 Surface Area, Pore Size Distribution and Adsorption-Desorption
Isotherms ....................................................................................................... 50
4.2.2.3 High Resolution Transmission Electron Microscopy (HRTEM) ...... 54
4.2.2.4 Temperature Programmed Reduction (TPR) Analysis ...................... 57
4.2.2.5 DRIFTS ............................................................................................... 61
4.2.2.6 Microcalorimetry ................................................................................ 67
4.2.3 Dry reforming reaction results .................................................................. 69
4.2.4 Characterization of spent catalysts ........................................................... 84

xiii
4.2.4.1 Thermal Gravimetric Analysis (TGA) ............................................... 84
4.2.4.2 High Contrast Transmission Electron Microscopy (HCTEM) .......... 86
4.2.5 Source of Coke Determination Reactions and Characterization Results . 89
4.3 Conclusions .................................................................................................... 97
5. DRY REFORMING OF METHANE ON Al2O3 SUPPORTED Ni CATALYSTS
PREPARED BY POLYOL METHOD .................................................................... 99
5.1 Introduction .................................................................................................... 99
5.2 Results and Discussion ................................................................................. 103
5.2.1 Characterization of fresh catalysts .......................................................... 103
5.2.1.1 X-Ray Diffraction (XRD) Analysis ................................................. 103
5.2.1.2 Surface Area, Pore Size Distribution and Adsorption-Desorption
Isotherms ...................................................................................................... 105
5.2.1.3 Thermal Gravimetric Analysis (TGA) ............................................. 106
5.2.1.4 High Contrast Transmission Electron Microscopy (HCTEM) ........ 108
5.2.2 Dry reforming reaction results ............................................................... 113
5.2.3 Characterization of spent catalysts ......................................................... 117
5.2.3.1 Thermal Gravimetric Analysis (TGA) ............................................. 117
5.2.3.2 High Contrast Transmission Electron Microscopy (HCTEM) ........ 119
5.3 Conclusions .................................................................................................. 122
6. DRY REFORMING OF METHANE ON CeO2 SUPPORTED Ni, Co and Ni-Co
CATALYSTS PREPARED BY INCIPIENT WETNESS IMPREGNATION
METHOD ............................................................................................................... 123
6.1 Introduction .................................................................................................. 123
6.2 Results and Discussion ................................................................................. 128
6.2.1 Characterization of fresh catalysts .......................................................... 128
6.2.1.1 X-Ray Diffraction (XRD) Analysis ................................................. 128
6.2.1.2 Surface Area, Pore Size Distribution and Adsorption-Desorption
Isotherms ...................................................................................................... 131
6.2.1.3 Temperature Programmed Reduction (TPR) Analysis .................... 135
6.2.2 Dry reforming reaction results ............................................................... 138
6.2.3 Characterization of spent catalysts ........................................................ 145
6.2.3.1 Thermal Gravimetric Analysis (TGA) ............................................. 145
xiv
6.2.3.2 High Contrast Transmission Electron Microscopy (HCTEM) ......... 146
6.3 Conclusions ................................................................................................... 149
7. MORPHOLOGY DEPENDENT REDOX PROPERTIES OF CeO2 ................. 151
7.1 Introduction ................................................................................................... 151
7.2 Results and Discussion ................................................................................. 154
7.2.1 Characterization of fresh catalysts ......................................................... 154
7.2.2 Redox Properties of CeO2 samples ........................................................ 155
7.3 Conclusions ................................................................................................... 161
8. CONCLUSIONS ................................................................................................. 163
REFERENCES ....................................................................................................... 165
APPENDICES
A. EFFLUENT MOLE FRACTIONS DURING REDOX EXPERIMENTS ON
COC, ESC AND CPC .......................................................................................... 187
B. TESTING FOR TRANSPORT LIMITATIONS ............................................ 197
CURRICULUM VITAE ........................................................................................ 199

xv
LIST OF TABLES
TABLES
Table 1. Structure sensitivity of CO2 adsorption [28] ............................................. 16 Table 2. Reaction steps for CO2 reforming of CH4 over Ru/SiO2 [48] ..................... 17
Table 3. Reaction steps for CO2 reforming of CH4 over Ru/Al2O3 [48] ................... 18
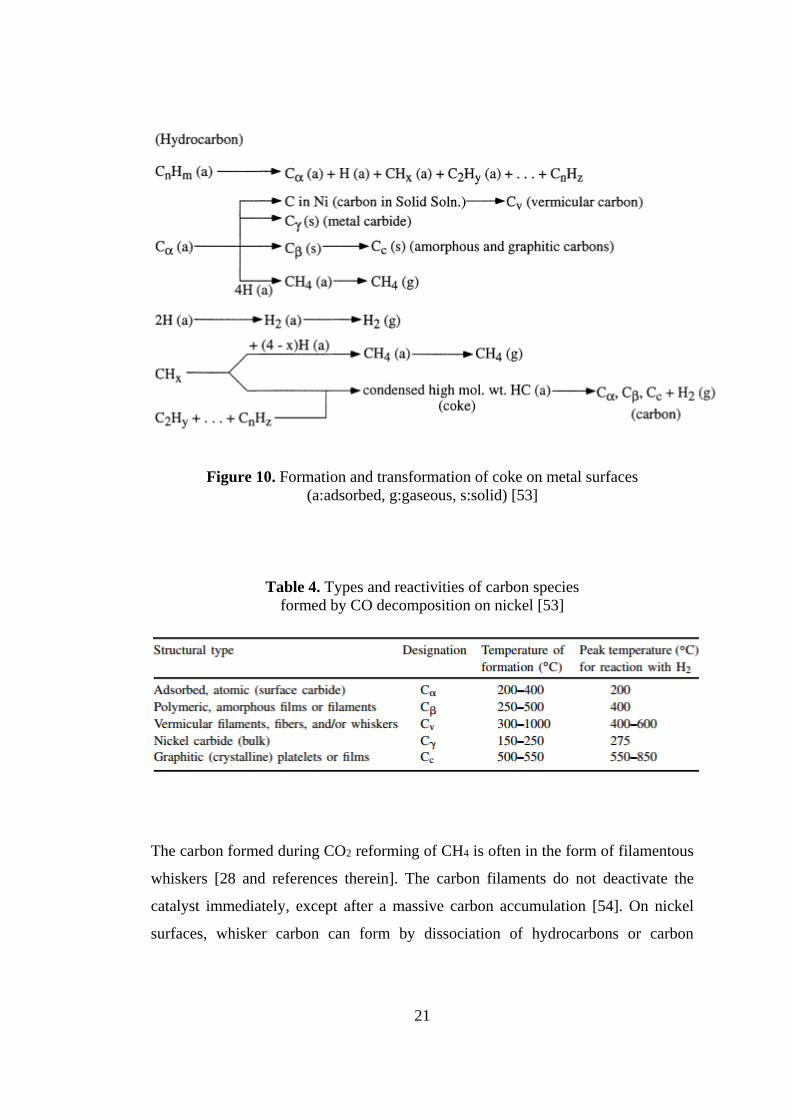
Table 4. Types and reactivities of carbon species formed by CO decomposition on
nickel [53] ................................................................................................................. 21
Table 5. Operating conditions of gas chromatograph ............................................. 36
Table 6. Textural properties of commercial Al2O3 powder ..................................... 46
Table 7. Textural properties of pure Al2O3, Ni/Al2O3, Co/Al2O3 and Ni-Co/Al2O3
calcined at 700oC ..................................................................................................... 51
Table 8. Textural properties of pure Al2O3, Ni/Al2O3, Co/Al2O3 and Ni-Co/Al2O3
calcined at 900oC ..................................................................................................... 51
Table 9. The weight gain of Al2O3 supported powder catalysts after being used in
the reaction at 600oC for 10 minutes under 30 sccm CO2 and 30 sccm CH4 ........... 90
Table 10. Comparison of textural properties of pure Al2O3 with the catalysts
prepared by polyol method ..................................................................................... 105 Table 11. Textural properties of pure CeO2, Ni/CeO2, Co/CeO2 and Ni-Co/CeO2
calcined at 700oC ................................................................................................... 131 Table 12. Textural properties of pure CeO2, Ni/CeO2, Co/CeO2 and Ni-Co/CeO2
calcined at 900oC .................................................................................................... 131
Table 13. Oxygen storage of ceria samples at 600oC during Step 3 ...................... 156 Table 14. Oxygen release of ceria samples at 600oC during Step 4 ....................... 158 Table 15. Oxygen storage of ceria samples at 600oC during Step 5 ...................... 159 Table 16. Oxygen release of ceria samples at 600oC during Step 6 ....................... 161 Table 17. The influence of flow rate on conversion at constant contact time ....... 198

xvi
LIST OF FIGURES
FIGURES
Figure 1. Estimated contribution of various energy resources in total primary
energy, expressed as % [1] .......................................................................................... 1
Figure 2. Main usage areas of synthesis gas [adapted from 6] .................................. 2
Figure 3. Globally averaged a) CO2 and b) CH4 mole fractions from 1984 to 2012
[12] .............................................................................................................................. 4
Figure 4. Equilibrium constants of reactions involved in dry reforming of methane
as a function of temperature ..................................................................................... 11
Figure 5. Variation of standard Gibbs free energies of reactions involved in dry
reforming of methane as a function of temperature ................................................. 12
Figure 6. Equilibrium conversions of CH4 and CO2 for dry reforming of methane as
a function of temperature at P=1 atm and CH4/CO2/Ar=1/1/3 .................................. 13
Figure 7. Equilibrium conversions of CH4 and CO2 for simultaneous dry reforming
of methane and RWGS reaction as a function of temperature at P=1 atm and
CH4/CO2/Ar=1/1/3 ................................................................................................... 14
Figure 8. Possible coordination geometries of adsorbed CO2- [adapted from 42] ... 16
Figure 9. Formation, transformation and gasification of carbon on nickel
(a:adsorbed, g:gaseous, s:solid) [53] ......................................................................... 20
Figure 10. Formation and transformation of coke on metal surfaces (a:adsorbed,
g:gaseous, s:solid) [53] ............................................................................................. 21
Figure 11. a) HRTEM of carbon nanofiber growth, b) Illustration of growth
mechanism [57] ......................................................................................................... 22
Figure 12. Carbon limit diagram (principle of equilibrated gas) Curve 1: graphite
data, Curve 2: whisker carbon [adapted from 52] ..................................................... 24
Figure 13. Electrospinning set-up ............................................................................. 28
Figure 14. Experimental set up of DRIFTS measurements ..................................... 31

xvii
Figure 15. Experimental set up of microcalorimetry measurements ...................... 32
Figure 16. Experimental set up for the catalytic reaction tests ............................... 35
Figure 17. XRD pattern of commercial Al2O3 powder ........................................... 46
Figure 18. Nitrogen adsorption-desorption isotherms of commercial Al2O3 powder
................................................................................................................................... 47
Figure 19. BJH pore size distribution of commercial Al2O3 powder ...................... 47
Figure 20. XRD pattern of pure Al2O3, Ni/Al2O3, Co/Al2O3 and Ni-Co/Al2O3
calcined at 700oC ..................................................................................................... 48
Figure 21. XRD pattern of pure Al2O3, Ni/Al2O3, Co/Al2O3 and Ni-Co/Al2O3
calcined at 900oC ..................................................................................................... 49
Figure 22. Nitrogen adsorption-desorption isotherms of pure Al2O3, Ni/Al2O3,
Co/Al2O3 and Ni-Co/Al2O3 calcined at 700oC ......................................................... 52
Figure 23. Nitrogen adsorption-desorption isotherms of pure Al2O3, Ni/Al2O3,
Co/Al2O3 and Ni-Co/Al2O3 calcined at 900oC ......................................................... 53
Figure 24. BJH pore size distribution of pure Al2O3, Ni/Al2O3, Co/Al2O3 and Ni-
Co/Al2O3 calcined at 700oC ..................................................................................... 53
Figure 25. BJH pore size distribution of pure Al2O3, Ni/Al2O3, Co/Al2O3 and Ni-
Co/Al2O3 calcined at 900oC ..................................................................................... 54
Figure 26. HRTEM images of fresh Ni/Al2O3-I-900 .............................................. 55
Figure 27. HRTEM images of fresh Ni-Co/Al2O3-I-900 ........................................ 56
Figure 28. TPR profiles of Ni/Al2O3, Co/Al2O3 and Ni-Co/Al2O3 calcined at 700oC
................................................................................................................................... 57
Figure 29. TPR profiles of Ni/Al2O3, Co/Al2O3 and Ni-Co/Al2O3 calcined at 900oC
................................................................................................................................... 58
Figure 30. TGA profiles of Co/Al2O3-I-700 and Co/Al2O3-I-900 under N2
environment ............................................................................................................. 60
Figure 31. DRIFT spectra of CO2 adsorption on Ni/Al2O3-900 with increasing CO2
dosage ....................................................................................................................... 61

xviii
Figure 32. DRIFT spectra of CO2 adsorption on Ni/Al2O3-900 with increasing
temperature at 500 torr ............................................................................................. 63
Figure 33. DRIFT spectra of CO2 adsorption on Ni-Co/Al2O3-900 with increasing
temperature at 500 torr ............................................................................................. 64
Figure 34. Comparison between the DRIFT spectra of CO2 adsorption on
Ni/Al2O3-900 and Ni-Co/Al2O3-900 at 500 torr ....................................................... 65
Figure 35. DRIFT spectra of CH4 adsorption on Ni/Al2O3-900 with increasing
temperature at 500 torr ............................................................................................. 66
Figure 36. Differential heat of CO2 adsorption on commercial Al2O3, Al2O3-900,
Ni/Al2O3-900 and Ni-Co/Al2O3-900 ........................................................................ 68
Figure 37. Coverage as a function of pressure for CO2 adsorption on commercial
Al2O3, Al2O3-900, Ni/Al2O3-900 and Ni-Co/Al2O3-900 .......................................... 68
Figure 38. Comparison of CH4 and CO2 conversion versus time on stream over the
catalysts calcined at 700oC, Ni/Al2O3-I-700-pellet , Co/Al2O3-I-700-pellet , Ni-
Co/Al2O3-I-700-pellet , (Reaction conditions: 700oC, 1 atm) ............................... 70
Figure 39. Comparison of H2 and CO yield versus time on stream over the catalysts
calcined at 700oC, Ni/Al2O3-I-700-pellet , Co/Al2O3-I-700-pellet , Ni-
Co/Al2O3-I-700-pellet , (Reaction conditions: 700oC, 1 atm) ............................... 71
Figure 40. Comparison of H2/CO ratio versus time on stream over the catalysts
calcined at 700oC, Ni/Al2O3-I-700-pellet , Co/Al2O3-I-700-pellet , Ni-
Co/Al2O3-I-700-pellet , (Reaction conditions: 700oC, 1 atm) ............................... 72
Figure 41. Comparison of CH4 and CO2 conversion versus time on stream over the
catalysts calcined at 900oC, Ni/Al2O3-I-900-pellet , Co/Al2O3-I-900-pellet , Ni-
Co/Al2O3-I-900-pellet , (Reaction conditions: 700oC, 1 atm) .............................. 74
Figure 42. Comparison of H2 and CO yield versus time on stream over Ni/Al2O3-I-
900-pellet and Ni-Co/Al2O3-I-900-pellet , (Reaction conditions: 700oC, 1 atm)
................................................................................................................................... 75
Figure 43. Comparison of H2/CO ratio versus time on stream over Ni/Al2O3-I-700-
pellet and Ni-Co/Al2O3-I-900-pellet , (Reaction conditions: 700oC, 1 atm) .... 76
Figure 44. Comparison of CH4 and CO2 conversion versus time on stream over the
catalysts calcined at 900oC, Ni/Al2O3-I-900-powder , Ni-Co/Al2O3-I-900-powder
, (Reaction conditions: 700oC, 1 atm) ................................................................... 77

xix
Figure 45. Comparison of H2 and CO yield versus time on stream over Ni/Al2O3-I-
900-powder , Ni-Co/Al2O3-I-900-powder , (Reaction conditions: 700oC, 1 atm)
................................................................................................................................... 78
Figure 46. Comparison of H2/CO ratio versus time on stream over Ni/Al2O3-I-900-
powder , Ni-Co/Al2O3-I-900-powder , (Reaction conditions: 700oC, 1 atm) ...... 79
Figure 47. Comparison of CH4 and CO2 conversion versus time on stream over the
catalysts calcined at 700oC, Ni/Al2O3-I-700-powder , Ni-Co/Al2O3-I-700-powder
, (Reaction conditions: 700oC, 1 atm) ................................................................... 80
Figure 48. Comparison of H2 and CO yield versus time on stream over the catalysts
calcined at 700oC, Ni/Al2O3-I-700-powder , Ni-Co/Al2O3-I-700-powder ,
(Reaction conditions: 700oC, 1 atm) ......................................................................... 81
Figure 49. Comparison of CH4 and CO2 conversion versus time on stream over the
catalysts calcined at 900oC, Ni/Al2O3-I-900-powder , Ni-Co/Al2O3-I-900-powder
, (Reaction conditions: 600°C, 1 atm) ....................................................................... 82
Figure 50. Comparison of H2 and CO yield versus time on stream over the catalysts
calcined at 900oC, Ni/Al2O3-I-900-powder , Ni-Co/Al2O3-I-900-powder ,
(Reaction conditions: 600°C, 1 atm) ......................................................................... 83
Figure 51. Comparison of H2/CO ratio versus time on stream over Ni/Al2O3-I-900-
powder , Ni-Co/Al2O3-I-900-powder , (Reaction conditions: 600°C, 1 atm) ...... 84
Figure 52. TGA curves in air atmosphere for Ni/Al2O3-I-700-pellet, Co/Al2O3-I-
700-pellet and Ni-Co/Al2O3-I-700-pellet after being used in reaction at 700oC for 5
hours ......................................................................................................................... 85
Figure 53. TGA curves in air atmosphere for Ni/Al2O3-I-900-pellet, Co/Al2O3-I-
900-pellet and Ni-Co/Al2O3-I-900-pellet after being used in reaction at 700oC for 5
hours ......................................................................................................................... 85
Figure 54. HCTEM of Ni/Al2O3-I-900-powder after being used in reaction at 600oC
for 5 hours ................................................................................................................ 87
Figure 55. HCTEM of Ni-Co/Al2O3-I-900-powder after being used in reaction at
600oC for 5 hours ..................................................................................................... 88
Figure 56. The effect of CH4/CO2 ratio in the input stream on a) amount of carbon
deposition b) type of carbon deposition over Ni/Al2O3-700-powder after being used
in the reaction at 600°C for 10 minutes ................................................................... 90

xx
Figure 57. Effect of CH4/CO2 ratio in the input stream on a) CH4 conversion and b)
H2/CO ratio .............................................................................................................. 92
Figure 58. 13C NMR spectra of the coke deposited on Ni/Al2O3-I-700-powder after
being used in the reaction at 600°C for 10 minutes under 30 sccm 13CO2 and 30
sccm CH4 .................................................................................................................. 93
Figure 59. HCTEM of Ni/Al2O3-I-700-powder catalyst after being used in the
reaction at 600oC for 10 minutes with 13CO2/12CH4 ratio of 10/50 .......................... 95
Figure 60. HCTEM of Ni/Al2O3-I-700-powder catalyst after being used in the
reaction at 600oC for 10 minutes with 13CO2/12CH4 ratio of 30/30 .......................... 96
Figure 61. HCTEM of Ni/Al2O3-I-700-powder catalyst after being used in the
reaction at 600oC for 10 minutes with 13CO2/12CH4 ratio of 50/10 .......................... 97
Figure 62. Comparison of the XRD pattern of pure alumina with those of catalysts
prepared by polyol method ..................................................................................... 104
Figure 63. Comparison of nitrogen adsorption-desorption isotherms of pure Al2O3
with the catalysts prepared by polyol method ........................................................ 106
Figure 64. Comparison of BJH pore size distribution of pure Al2O3 with the
catalysts prepared by polyol method ...................................................................... 107
Figure 65. TG analysis of pure ethylene glycol, pure PVP and the catalysts prepared
by polyol method .................................................................................................... 107
Figure 66. Derivative weight loss analysis of pure ethylene glycol, pure PVP and
the catalysts prepared by polyol method ................................................................ 108
Figure 67. TEM of fresh Ni/Alumina-without-PVP catalyst ................................ 109
Figure 68. TEM of fresh Ni/Alumina-PVP/Ni=2.5 catalyst ................................. 111
Figure 69. TEM of fresh Ni/Alumina-PVP/Ni=5.0 catalyst ................................. 112
Figure 70. Comparison of CH4 and CO2 conversion versus time on stream over the
catalysts prepared by polyol method, Ni/Al2O3-without PVP , Ni/Al2O3-
PVP/Ni=2.5 , Ni/Al2O3-PVP/Ni=5.0 , (Reaction conditions: 700oC, 1 atm, no
reduction ................................................................................................................. 113
Figure 71. Comparison of H2 and CO yield versus time on stream over the catalysts
prepared by polyol method, Ni/Al2O3-without PVP , Ni/Al2O3-PVP/Ni=2.5 ,
Ni/Al2O3-PVP/Ni=5.0 , (Reaction conditions: 700oC, 1 atm, no reduction) ...... 114
xxi
Figure 72. Comparison of H2/CO ratio versus time on stream over the catalysts
prepared by polyol method, Ni/Al2O3-without PVP , Ni/Al2O3-PVP/Ni=2.5 ,
Ni/Al2O3-PVP/Ni=5.0 , (Reaction conditions: 700oC, 1 atm, no reduction ........ 115
Figure 73. Comparison of CH4 and CO2 conversion versus time on stream over the
catalysts prepared by polyol method, Ni/Al2O3-without PVP , Ni/Al2O3-
PVP/Ni=2.5 , Ni/Al2O3-PVP/Ni=5.0 , (Reaction conditions: 600oC, 1 atm, no
reduction ................................................................................................................. 116
Figure 74. Comparison of H2 and CO yield versus time on stream over the catalysts
prepared by polyol method, Ni/Al2O3-without PVP , Ni/Al2O3-PVP/Ni=2.5 ,
Ni/Al2O3-PVP/Ni=5.0 , (Reaction conditions: 600oC, 1 atm, no reduction) ...... 116
Figure 75. Comparison of time dependent H2/CO ratio over the catalysts prepared
by polyol method, Ni/Al2O3-without PVP , Ni/Al2O3-PVP/Ni=2.5 , Ni/Al2O3-
PVP/Ni=5.0 , (Reaction conditions: 600oC, 1 atm, no reduction) ...................... 117
Figure 76. Comparison of weight losses between the fresh and the used polyol
catalysts in the reaction at a) 600oC and b) 700oC ................................................. 118
Figure 77. Comparison of derivative weight losses between the fresh and the used
polyol catalysts in the reaction at 600oC and 700oC ............................................ 119
Figure 78. HCTEM of Ni/Al2O3-without PVP catalyst after being used in reaction at
600oC for 5 hours ................................................................................................... 120
Figure 79. HCTEM of Ni/Al2O3-PVP/Ni=2.5 catalyst after being used in reaction at
600oC for 5 hours ................................................................................................... 121
Figure 80. Standard Gibbs free energy as a function of temperature for CeO2 based
nickel catalyst .......................................................................................................... 124
Figure 81. XRD pattern of pure CeO2, Ni/CeO2, Co/CeO2 and Ni-Co/CeO2 calcined
at 700oC .................................................................................................................. 129
Figure 82. XRD pattern of pure CeO2, Ni/CeO2, Co/CeO2 and Ni-Co/CeO2 calcined
at 900oC .................................................................................................................. 130
Figure 83. Nitrogen adsorption-desorption isotherms of pure CeO2, Ni/CeO2,
Co/CeO2 and Ni-Co/CeO2 calcined at 700oC ......................................................... 132
Figure 84. Nitrogen adsorption-desorption isotherms of pure CeO2, Ni/CeO2,
Co/CeO2 and Ni-Co/CeO2 calcined at 900oC ......................................................... 133

xxii
Figure 85. BJH pore size distribution of pure CeO2, Ni/CeO2, Co/CeO2 and Ni-
Co/CeO2 calcined at 700oC .................................................................................... 134
Figure 86. BJH pore size distribution of pure CeO2, Ni/CeO2, Co/CeO2 and Ni-
Co/CeO2 calcined at 900oC .................................................................................... 134
Figure 87. TPR profiles of pure CeO2, Ni/CeO2, Co/CeO2 and Ni-Co/CeO2 calcined
at 700oC .................................................................................................................. 135
Figure 88. TPR profiles of pure CeO2, Ni/CeO2, Co/CeO2 and Ni-Co/CeO2 calcined
at 900oC .................................................................................................................. 137
Figure 89. Comparison of CH4 and CO2 conversion versus time on stream over the
catalysts calcined at 700oC, Ni/CeO2-I-700-pellet , Co/CeO2-I-700-pellet , Ni-
Co/CeO2-I-700-pellet , (Reaction conditions: 700°C, 1 atm) ............................... 139
Figure 90. Comparison of H2 and CO yield versus time on stream over the catalysts
calcined at 700oC, Ni/CeO2-I-700-pellet , Co/CeO2-I-700-pellet , Ni-Co/CeO2-I-
700-pellet , (Reaction conditions: 700°C, 1 atm) ................................................. 140
Figure 91. Comparison of H2/CO ratio versus time on stream over the catalysts
calcined at 700oC, Ni/CeO2-I-700-pellet , Co/CeO2-I-700-pellet , Ni-Co/CeO2-I-
700-pellet , (Reaction conditions: 700°C, 1 atm) ................................................. 141
Figure 92. Comparison of CH4 and CO2 conversion versus time on stream over the
catalysts calcined at 900oC, Ni/CeO2-I-900-pellet , Co/CeO2-I-900-pellet , Ni-
Co/CeO2-I-900-pellet , (Reaction conditions: 700°C, 1 atm) ............................... 142
Figure 93. Comparison of H2 and CO yield versus time on stream over the catalysts
calcined at 900oC, Ni/CeO2-I-900-pellet , Co/CeO2-I-900-pellet , Ni-Co/CeO2-I-
900-pellet , (Reaction conditions: 700°C, 1 atm) ................................................. 143
Figure 94. Comparison of H2/CO ratio versus time on stream over the catalysts
calcined at 900oC, Ni/CeO2-I-900-pellet , Co/CeO2-I-900-pellet , Ni-Co/CeO2-I-
900-pellet , (Reaction conditions: 700°C, 1 atm) ................................................. 144
Figure 95. TGA curves in air atmosphere after being used in reaction at 700oC for 5
hours for the catalysts calcined at a) 700oC, b) 900oC ........................................... 145
Figure 96. Derivative weight losses after being used in reaction at 700oC for 5 hours
for the catalysts calcined at a) 700oC, b) 900oC ..................................................... 146
Figure 97. HCTEM of Ni/CeO2-I-700 catalyst after being used in reaction at 700oC
for 5 hours .............................................................................................................. 147

xxiii
Figure 98. HCTEM of Ni-Co/CeO2-I-700 catalyst after being used in reaction at
700oC for 5 hours ................................................................................................... 148
Figure 99. Scanning electron micrographs of ceria fiber mats ............................. 155
Figure 100. O2 consumption during Step 3 ........................................................... 156
Figure 101. CO consumption during Step 4 ........................................................... 157
Figure 102. CO2 production during Step 4 ............................................................ 157
Figure 103. O2 consumption during Step 5 ............................................................ 159
Figure 104. CO consumption during Step 6 .......................................................... 160
Figure 105. CO2 production during Step 6 ............................................................ 160
Figure 106. Effluent mole fraction of O2 during O2 pulse experiment on COC at
600oC (Step 3) ........................................................................................................ 187
Figure 107. Effluent mole fraction of O2 during O2 pulse experiment on ESC at
600oC (Step 3) ........................................................................................................ 188
Figure 108. Effluent mole fraction of O2 during O2 pulse experiment on CPC at
600oC (Step 3 ......................................................................................................... 188
Figure 109. Effluent mole fraction of CO during CO pulse experiment on COC at
600oC (Step 4) ...................................................................................................... 189
Figure 110. Effluent mole fraction of CO during CO pulse experiment on ESC at
600oC (Step 4) ....................................................................................................... 189
Figure 111. Effluent mole fraction of CO during CO pulse experiment on CPC at
600oC (Step 4) ........................................................................................................ 190
Figure 112. Effluent mole fraction of CO2 during CO pulse experiment on COC at
600oC (Step 4) ........................................................................................................ 190
Figure 113. Effluent mole fraction of CO2 during CO pulse experiment on ESC at
600oC (Step 4) ........................................................................................................ 191
Figure 114. Effluent mole fraction of CO2 during CO pulse experiment on CPC at
600oC (Step 4) ........................................................................................................ 191

xxiv
Figure 115. Effluent mole fraction of O2 during O2 pulse experiment on COC at
600oC (Step 5) ........................................................................................................ 192
Figure 116. Effluent mole fraction of O2 during O2 pulse experiment on ESC at
600oC (Step 5) ........................................................................................................ 192
Figure 117. Effluent mole fraction of O2 during O2 pulse experiment on CPC at
600oC (Step 5) ......................................................................................................... 193
Figure 118. Effluent mole fraction of CO during CO pulse experiment on COC at
600oC (Step 6) ........................................................................................................ 193
Figure 119. Effluent mole fraction of CO during CO pulse experiment on ESC at
600oC (Step 6) ......................................................................................................... 194
Figure 120. Effluent mole fraction of CO during CO pulse experiment on CPC at
600oC (Step 6) ......................................................................................................... 194
Figure 121. Effluent mole fraction of CO2 during CO pulse experiment on COC at
600oC (Step 6) ......................................................................................................... 195
Figure 122. Effluent mole fraction of CO2 during CO pulse experiment on ESC at
600oC (Step 6) ......................................................................................................... 195
Figure 123. Effluent mole fraction of CO2 during CO pulse experiment on CPC at
600oC (Step 6) ......................................................................................................... 196
Figure 124. The effect of catalyst particle size on CH4 and CO2 conversion, :
Ni/Al2O3-700-pellet, : Ni/Al2O3-700-powder ....................................................... 197
Figure 125. Experimental evaluation of the effect of interphase mass transport :
W=0.1 g and F=50 sccm, : W=0.15 g and F=75 sccm, : W=0.2 g and F=100
sccm ......................................................................................................................... 198

1
CHAPTER 1
INTRODUCTION
1.1 ENERGY AND SYNTHESIS GAS
Energy demand is quickly increasing worldwide, especially due to growing
economies, mainly in Asia. Production of energy is still based primarily on
combustion processes using fossil fuels, a fact which is improbable to change in the
near future (Figure 1) [1 and references therein]. In the twentieth century oil played
the most essential role [2]. However, the finite and readily accessible oil reserves are
being rapidly depleted. One alternative is natural gas, which is composed mainly of
methane [2 and references therein].
Figure 1. Estimated contribution of various energy resources
in total primary energy, expressed as % [1]
The chemical usage of natural gas for the production of basic chemicals is one of the
desirable purposes in the present chemical industry. Nevertheless, it is very difficult
to transform natural gas directly into useful chemicals due to the chemical inertness
of methane. The conversion of methane into useful chemicals has taken great

2
attention recently and several technologies and methods have been reported. Even
though the direct conversion of CH4 to very useful chemicals is the most fascinating
way, no feasible catalyst or process has been developed. Nowadays, indirect
transformation of CH4 via synthesis gas is still the most competitive method [3 and
references therein]. Synthesis gas is a mixture of carbon monoxide and hydrogen
[4]. It serves as the feedstock for several important industrial processes such as
ammonia synthesis, methanol synthesis, Fischer Tropsch synthesis and H2
production, etc [2,4-6] (Figure 2).
Figure 2. Main usage areas of synthesis gas [adapted from 6]
The effective commercial production of synthesis gas is taking important attention
due to the growing worldwide interest in synthetic fuels and chemicals [7]. There are
basically three different types of processes that can be employed to convert natural

3
gas into synthesis gas: steam reforming of methane, partial oxidation of methane and
carbon dioxide reforming of methane (or dry reforming of methane) [8]. Carbon
dioxide reforming of methane becomes industrially advantageous compared to
partial oxidation and steam reforming in synthesis gas production due to the fact that
the H2/CO product ratio in dry reforming is close to one, which is appropriate for
further use in the production of oxygenated compounds as well as Fischer Tropsch
synthesis for liquid hydrocarbons production [9 and references therein]. In addition,
dry reforming of methane provides the opportunity of using natural gas resources
with high carbon dioxide content, avoiding the costly and complicated gas
separation process [10]. Dry reforming of methane is also an attractive way of
utilizing biogas, a clean and environment friendly fuel that is produced typically
from anaerobic degradation of biomass and mainly composed of CO2 and CH4 [11
and references therein].
1.2 GREENHOUSE GASES AND GLOBAL WARMING
The World Meteorological Organization Global Atmosphere Watch Programme
reveals that the globally averaged mole fractions of CO2 and CH4 reached new highs
in 2012, with CO2 at 393.1±0.1 ppm (Figure 3-a) and CH4 at 1819±1 ppb (Figure 3-
b) constituting 141% and 260% of pre-industrial (before 1750) levels, respectively.
The National Oceanic and Atmospheric Administration Annual Greenhouse Gas
Index reveals that radiative forcing by long-lived greenhouse gases increased by
32% from 1990 to 2012. CO2, being the most important anthropogenic greenhouse
gas in the atmosphere, contributes ~64% to radiative forcing by long-lived
greenhouse gases. It is responsible for ~82% of the rise in radiative forcing over the
previous five years and ~84% over the previous decade. Atmospheric CO2 mainly
comes from emissions due to the combustion of fossil fuels, deforestation and other
land-use change. Methane contributes ~18% to radiative forcing by long-lived
greenhouse gases. While about 40% of CH4 emits to the atmosphere by natural
sources such as termites and wetlands, approximately 60% of it originates from

4
anthropogenic sources such as fossil fuel exploitation, biomass burning and landfills
[12].
Figure 3. Globally averaged a) CO2 and
b) CH4 mole fractions from 1984 to 2012 [12]
Global climate changes associated with the emission of greenhouse gases are of
great concern around the world. Consuming two major greenhouse gases (CO2 and
CH4) simultaneously to convert them into valuable feedstock, dry reforming of
methane has taken great interest for environmental protection.
1.3 OBJECTIVES
Carbon dioxide reforming of methane has been studied extensively in the last years
due to the following reasons:
i) converts two main greenhouse gases, CO2 and CH4, with high global warming
potential to precious synthesis gas [9]
ii) generates synthesis gas with a low H2/CO ratio which is favorable in the
production of liquid hydrocarbons in Fischer Tropsch synthesis network [13]

5
iii) enables the usage of natural gas resources with a high carbon dioxide content,
without the requirement of costly and complicated gas separation process [10]
iv) utilizes biogas as a promising raw material [1]
The major problem hindering the development of dry reforming of methane is the
lack of an effective catalyst that can able to operate without deactivation by coke
deposition. Although it is known that supported noble metals can provide good
catalytic performance in terms of activity, selectivity and resistance to carbon
deposition [14], Ni based catalysts have been preferred as good replacement due to
their comparable catalytic performance, low cost and wide availability [15].
Nevertheless, Ni-based catalysts are well known for their high tendency for carbon
deposition [15].
The most essential parameters influencing the activity, selectivity, and stability are
the nature and particle size of the supported metal; the nature, texture, and structure
of the support; and reaction conditions. Therefore, great efforts have been focused
on throwing light on the significance and the control of these parameters by proper
selection of metallic component and support, catalyst preparation method, and
addition of promoters–modifiers, in order to retain high activity while preventing
carbon formation [1].
For the aim of reducing carbon formation and improving the life time of Ni based
catalysts, this PhD dissertation covers the following studies:
In the first part of the study, the activity of Al2O3 supported Ni, Co and Ni-Co
catalyst by incipient wetness impregnation was investigated to elucidate the effect of
introducing a second metal to the Ni-based catalysts. To understand the influence of
calcination temperature, two different calcination temperatures were tested for each
catalyst. In order to find out the source of carbon deposition, reaction tests were
carried out with 13CO2 and the spent catalysts were characterized by 13C NMR.

6
In the second part of the study, a new synthesis method, the polyol method, was
tested for carbon dioxide reforming of methane reaction. In this study, it was aimed
to obtain metallic Ni during synthesis which would stop the necessity of reduction
prior to reaction. The effect of PVP/Ni ratio on the structure of the catalyst and the
performance of catalysts during reaction was investigated.
In the third part of the study, to find out the effect of support, CeO2 having excellent
redox properties, was tested for dry reforming of methane. The TPR characteristics
of CeO2 supported Ni, Co and Ni-Co catalyst synthesized by incipient wetness
impregnation and calcined at two different temperatures were investigated.
In the last part of the study, O2 and CO pulse experiments were done in order to
obtain information about the oxygen release/storage ability of different kinds of
ceria samples, including commercial ceria, coprecipitated ceria and ceria fibers
prepared by exotemplating method.
7
CHAPTER 2
REFORMING OF METHANE TO SYNTHESIS GAS
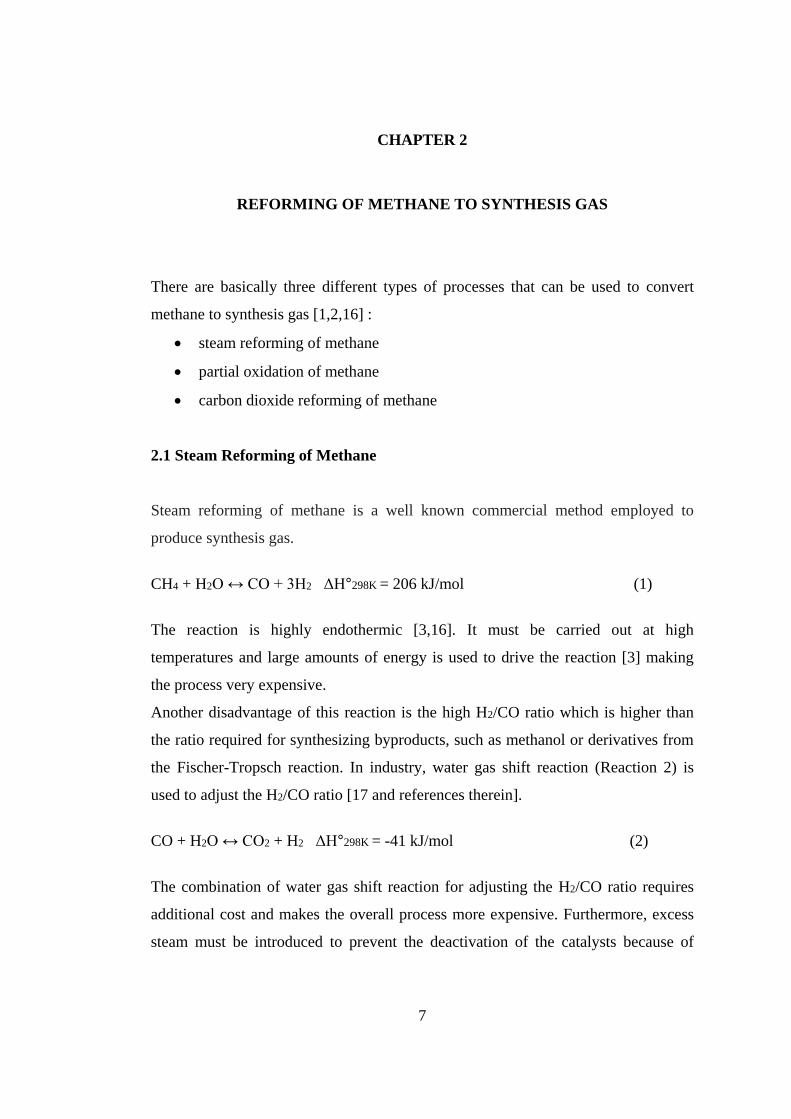
There are basically three different types of processes that can be used to convert
methane to synthesis gas [1,2,16] :
steam reforming of methane
partial oxidation of methane
carbon dioxide reforming of methane
2.1 Steam Reforming of Methane
Steam reforming of methane is a well known commercial method employed to
produce synthesis gas.
CH4 + H2O ↔ CO + 3H2 ΔH°298K = 206 kJ/mol (1)
The reaction is highly endothermic [3,16]. It must be carried out at high
temperatures and large amounts of energy is used to drive the reaction [3] making
the process very expensive.
Another disadvantage of this reaction is the high H2/CO ratio which is higher than
the ratio required for synthesizing byproducts, such as methanol or derivatives from
the Fischer-Tropsch reaction. In industry, water gas shift reaction (Reaction 2) is
used to adjust the H2/CO ratio [17 and references therein].
CO + H2O ↔ CO2 + H2 ΔH°298K = -41 kJ/mol (2)
The combination of water gas shift reaction for adjusting the H2/CO ratio requires
additional cost and makes the overall process more expensive. Furthermore, excess
steam must be introduced to prevent the deactivation of the catalysts because of

8
carbonaceous deposits. As a result operation expenses and consumption of energy
rises [17 and references therein]. The concern related with the economic viability
issue led to the investigation of alternative processes to steam reforming which are
partial oxidation and dry reforming.
2.2 Partial Oxidation of Methane
The partial oxidation of methane to produce synthesis gas is well established to take
place in a non-catalytic homogeneous reaction at very high temperatures (>1127°C).
The utilization of a catalyst could reduce the operating temperature. The first
investigation of the catalytic partial oxidation of methane was done with nickel
catalysts, and since then numerous transition metals such as cobalt and iron have
been reported in literature [2].
The main advantage of partial oxidation of methane is its slightly exothermic nature
making it much more energy efficient than steam reforming. It also produces H2/CO
ratio of two which is proper for methanol synthesis or Fischer Tropsch synthesis
without further adjustment [18]
CH4 + ½ O2 ↔ CO + 2H2 ΔH°298K = -35.7 kJ/mol (3)
One of the main drawbacks of partial oxidation of CH4 is the requirement of pure
oxygen which means additional cost for separating oxygen from air [19]. It is also
difficult to control the process due to the fact that it involves feeding CH4-O2
mixture together and reaction under flammable or even explosive conditions. Local
hot spots commonly form which can harm the active component in an irreversible
way [20].
In addition to the direct route shown in Equation 3, partial oxidation of methane can
also proceed via an indirect route which is a two-step mechanism. The first step is
the total oxidation of some CH4 to CO2 and H2O. The second step is the steam and

9
carbon dioxide reforming of the remaining unconverted methane to acquire
synthesis gas during which water gas shift reaction also occurs. The temperature of
the catalyst bed is considerably higher in the front section than in the latter section
due to the initial highly exothermic total oxidation reaction followed by endothermic
reforming reactions. Formations of hot spots usually take place at the front of the
catalyst bed. The huge amount of evolved heat can melt the supported metal and
split it from the support, which results in catalyst deactivation [21,22].
2.3 Carbon dioxide Reforming of Methane
Dry reforming of CH4 is an essential process that converts two of the most plentiful
greenhouse gases in the atmosphere, CO2 and CH4, into synthesis gas [23]. Since
fossil fuels are expected to remain as the dominant energy source through 2035,
efforts are directed to make strides in carbon management by developing the
infrastructure needed to capture and permanently store CO2 emissions [24]. Dry
reforming of methane is one of the most promising applications for the mitigation of
CO2.
Dry reforming of CH4 is a suitable way for the exploitation of biogas, consisting
mainly of CO2 and CH4 [1]. Biogas is obtained from wastewater and sewage
treatment plants, landfills, livestock and poultry manure, organic industrial waste,
biomass residues, etc [25-27]. The composition and features of biogas strongly
depend on the type of feedstock, the technical design of digester-fermenter and
operating conditions [1 and references therein]. Methane and carbon dioxide are
always the major components of the biogas. It can also contain hydrogen sulfide,
ammonia, water vapor, some higher hydrocarbons and aromatics as impurities [1
and references therein].
Due to its high heat of endothermic reaction (exceeding that of steam reforming of
methane) and reversibility, dry reforming of methane has “potential thermochemical

10
heat-pipe applications for the recovery, storage, and transmission of energy from
solar and other renewable sources in chemical energy storage and transmission
systems.” [1 and references therein]. Compared to partial oxidation of methane, it is
simpler to obtain higher selectivity to synthesis gas with lower safety risks [1].
Since no steam is used, dry reforming of methane can be applied in areas where
water is not available [28]. Easier installation is needed, decreasing both operational
and equipment expenses when compared to steam reforming [1]. Another advantage
of dry reforming compared to steam reforming is that it yields synthesis gas with a
lower H2/CO ratio, which is a preferable feedstock for the production of long-chain
hydrocarbons via Fischer–Tropsch synthesis and adequate for producing oxygenated
derivatives [17].
The major problem in dry reforming of methane is catalyst deactivation which can
be due to carbon formation [1,28,29], sintering at high temperature [30,31] and
oxidation of metallic sites [32,33]. Coke formation has been accepted as the primary
reason of deactivation [34].
2.3.1 Thermodynamic Analysis of Carbon dioxide Reforming of Methane
CO2 reforming of CH4 (Equation 4) is a strongly endothermic reaction [35]. In
general, it is affected by the simultaneous reverse water–gas shift reaction (RWGS)
(Equation 5) resulting in H2/CO ratio lower than unity [28]. In addition to RWGS,
some other side reactions may take place, having important effect on the target
reaction [36]:
CH4 + CO2 ↔ 2CO + 2H2 ΔH°298 K = 247 kJ/mol (4)
CO2 + H2 ↔ CO + H2O ΔH°298 K = 41 kJ/mol (5)
CH4 ↔ C + 2H2 ΔH°298 K = 75 kJ/mol (6)
2CO ↔ C + CO2 ΔH°298 K = −171 kJ/mol (7)
CO + H2 ↔ C + H2O ΔH°298 K = −131 kJ/mol (8)

11
Equilibrium constants of the reactions taking place during CO2 reforming of CH4
were calculated and shown in Figure 4 as a function of temperature.
Figure 4. Equilibrium constants of reactions involved in dry
reforming of methane as a function of temperature
Being highly endothermic, the equilibrium constant of dry reforming of methane
exhibits an excessive increase with an increase in temperature. Therefore, high
temperatures are preferred to obtain high conversions. Being moderately
endothermic, the equilibrium constants of RWGS reaction and methane
decomposition (Equation 6) reaction increase with increasing temperature. On the
other hand, Boudouard reaction (Equation 7) and reverse carbon gasification
reaction (Equation 8) are exothermic, the equilibrium constants of which decrease
with rising temperatures.
0.01
10
10000
500 600 700 800 900 1000
Ka
Temperature (oC)
CH4+CO2↔2CO+2H2
CO2+H2↔CO+H2O
CH4↔C+2H2
2CO↔C+CO2
CO+H2↔C+H2O

12
Standard Gibbs-free energy changes (ΔG°) of the reactions taking place during dry
reforming of methane were calculated at different temperatures and shown in Figure
5.
Figure 5. Variation of standard Gibbs free energies of reactions
involved in dry reforming of methane as a function of temperature
Standard free energy change was used to determine the lower limiting temperatures
for endothermic reactions and upper limiting temperatures for exothermic reactions.
Minimum operating temperatures were calculated as 643°C, 557°C and 830°C for
dry reforming of methane, methane decomposition and RWGS reaction,
respectively. While Boudouard reaction can not occur above 702°C, reverse carbon
gasification reaction is impeded above 675°C.
-100
-50
0
50
500 600 700 800 900 1000
ΔG
o(k
J/m
ol)
Temperature (oC)
CH4+CO2↔2CO+2H2
CO2+H2↔CO+H2O
CH4↔C+2H2
CO+H2↔C+H2O
2CO↔C+CO2

13
The equilibrium conversions of CO2 and CH4 in dry reforming of methane reaction
for an inlet stream composition of CH4/CO2/Ar=1/1/3 and 1 atm total pressure were
calculated and shown in Figure 6. The equilibrium conversions of CO2 and of CH4
by taking into consideration the simultaneous occurance of reverse water gas shift
reaction for an inlet stream composition of CH4/CO2/Ar=1/1/3 and 1 atm total
pressure were calculated and shown in Figure 7. When RWGS reaction takes place,
CO2 conversion becomes greater than that of CH4.
Figure 6. Equilibrium conversions of CH4 and CO2 for dry reforming
of methane as a function of temperature at P=1 atm and CH4/CO2/Ar=1/1/3
0.0
0.2
0.4
0.6
0.8
1.0
500 600 700 800 900 1000
Eq
uil
ibri
um
con
ver
sion
Temperature (oC)

14
Figure 7. Equilibrium conversions of CH4 and CO2 for simultaneous
dry reforming of methane and RWGS reaction as a function of
temperature at P=1 atm and CH4/CO2/Ar=1/1/3
2.3.2 Mechanism of Carbon dioxide Reforming of Methane
The major problem in dry reforming of methane which is carbon formation has been
regarded mainly originating from methane decomposition and carbon monoxide
disproportionation [1,28]. While the former is favorable at high temperatures and
low pressures, the latter is preferred at low temperatures and higher pressures [37].
An appropriate catalyst for dry reforming of methane reaction should exhibit not
only high activity but also high stability. A basic factor for the selection of a catalyst
is its capacity to kinetically impede coke deposition. For this aim, it is important to
consider the mechanism of the target and side reactions on different catalytic
systems [1].
The initial stage in dry reforming of methane reaction sequence is methane
adsorption [1]. While the predominating mechanism for methane adsorption and
desorption is precursor mediated at low temperatures, it is direct at high
0.0
0.2
0.4
0.6
0.8
1.0
500 600 700 800 900 1000
Eq
uil
ibri
um
con
ver
sion
Temperature (oC)
CO2
CH4

15
temperatures. According to the results of the study on the interaction between
methane and Ni(111) surface, it was proposed that for dissociation, methane has to
be distorted from its tetrahedral configuration to make a trigonal pyramidal shape
and then tunneling of a hydrogen atom takes place through the activation barrier
[19,28 and references therein]. On the other hand, in an another study it was asserted
that the activation barrier did not include molecular distortion for dissociation of
methane on nickel and that it subjected solely to the tunneling of a hydrogen atom
through the activation barrier for hydrogen abstraction [19,28 and references
therein].
In general, methane adsorbs in a dissociated form on metals to generate H and CHx
species where the numerical value of x ranges between zero and four which depends
on the metal substrate and temperature. When x is zero, this shows that coke
formation takes place on surface of metal. Both hydrogen atoms and CHx species
are connected to the active metal sites. The great part of the adsorbed hydrogen
atoms recombine and produce hydrogen molecules which afterwards desorbs into
the gas phase [19 and references therein].
Methane activation was reported to be structure sensitive [1,28 and references
therein]. Beebe et al. showed that methane dissociation on nickel surface took place
with activity increasing in the order of Ni(111)<Ni(100)<Ni(110) [38]. Abild-
Pedersen et al. showed that steps of Ni (111) surface exhibited better activity than
the terraces in methane dissociation [39]. Based on the results of DFT calculations
over a Ni(111) surface and a stepped Ni (211) surface, Bengaard et al. concluded
that the step sites were more reactive than the close-packed surface in the activation
of methane [40].
In general, carbon dioxide adsorption and dissociation on transition metal surfaces is
considered to be controlled by electron transfer and necessitates the creation of an

16
anionic CO2- precursor. Carbon dioxide adsorption was also reported to be structure
sensitive as in the case of methane activation (Table 1) [28 and references therein].
Table 1. Structure sensitivity of CO2 adsorption [28]
Solymosi [41] studied CO2 adsorption on various metal surfaces. While CO2
adsorbed weakly and moleculary on Pt at 100-300 K under UHV, the dissociation
was very limited on Cu. CO2 was reported to adsorb on Ni, Re, Fe, Mg and Al
dissociatively [41]. Bartos et al. showed that carbon dioxide adsorption on Ni
surface could take place through three various coordination geometries (Figure 8)
[42].
Figure 8. Possible coordination geometries of adsorbed CO2- [adapted from 42]

17
CO2 can adsorb on metal oxides [43-46] which usually serve as catalyst support in
dry reforming of methane [1]. Several spectroscopic studies showed that adsorption
of CO2 on metal oxide surfaces resulted in the formation of carbonates (bidentate,
monodentate or bridged), bicarbonates, carboxylates, formates as well as bent CO2
species [47 and references therein]. CO2 binding energies on oxides are typically
larger than those on metal surfaces [44].
Depending on the metal oxide employed as support, dissimilarities have been
observed on CO2 activation behavior for various catalytic systems: Ferreira-Aparicio
et al. [48] proposed that CO2 reforming of CH4 took place via Langmuir–
Hishelwood mechanism for SiO2 supported Ru catalyst, where both of the reactants
were activated on the metal (Table 2). On the other hand, a bifunctional mechanism
was proposed for Al2O3 supported Ru (Table 3). For this catalyst, CH4 was activated
on metal, while CO2 was hydrogenated on Al2O3 to produce formate species which
were eventually decomposed to yield CO.
Table 2. Reaction steps for CO2 reforming of CH4 over Ru/SiO2 [48]

18
Table 3. Reaction steps for CO2 reforming of CH4 over Ru/Al2O3 [48]

19
Nakamura et al. [49] observed that the activity of Rh/SiO2 in dry reforming of
methane reaction increased significicantly with the addition of metal oxides such as
TiO2, MgO and Al2O3 to the support. This was ascribed to the improved CO2
activation on the support, proposing a bifunctional mechanism where the support
contributed to CO2 activation.
Bitter et al. [50] proposed a bifunctional mechanism for dry reforming of methane
on Pt/ZrO2. They suggested that CH4 was activated on the metal while CO2 was
activated on the support and the activated species might give a reaction with each
other on the boundary of Pt-ZrO2.
2.3.3 Deactivation due to Carbon Deposition
The major problem in dry reforming of methane is catalyst deactivation which can
be due to carbon formation [1,28,29], sintering at high temperature [30,31] and
oxidation of metallic sites [32,33]. Coke formation has been accepted as the primary
reason of deactivation in dry reforming of methane [34]. It leads to loss in catalytic
activity and insufficient heat transfer between the catalyst and the gas phase. When
it becomes very severe, it blocks the open surface area resulting in an excessive
pressure drop within the reactor. Furthermore it can also lead to localized hot spots
which can cause runaway conditions for the reactor [51]. Carbon deposition during
dry reforming of methane can happen by one or more of the following reactions:
CH4 ↔ C + 2H2 ΔH°298 K = 75 kJ/mol (6)
2CO ↔ C + CO2 ΔH°298 K = −171 kJ/mol (7)
CO + H2 ↔ C + H2O ΔH°298 K = −131 kJ/mol (8)
In literature, carbon formation during dry reforming of methane has been regarded
mainly originating from methane decomposition (Equation 6) and carbon monoxide
disproportionation (Equation 7) [1,28].

20
Being the most ubiquitous form of catalyst deactivation, carbon deposition can
happen through various mechanisms, depending on factors such as the nature of the
hydrocarbon and the catalyst and reaction operating conditions [52]. Mechanisms of
carbon deposition from CO and coke formation from hydrocarbons are shown in
Figure 9 and Figure 10.
Figure 9. Formation, transformation and gasification of carbon on nickel
(a:adsorbed, g:gaseous, s:solid) [53]
Various forms of coke and carbon varying in reactivity and morphology are formed
in these reactions (Table 4). For instance, CO dissociation on metals results in
formation of Cα, an adsorbed atomic carbon which can react to Cβ, a polymeric
carbon. The more reactive, amorphous types of carbon formed at low temperature
transform into less reactive, graphitic form of carbon over a period of time at high
temperature [53].
21
Figure 10. Formation and transformation of coke on metal surfaces
(a:adsorbed, g:gaseous, s:solid) [53]
Table 4. Types and reactivities of carbon species
formed by CO decomposition on nickel [53]
The carbon formed during CO2 reforming of CH4 is often in the form of filamentous
whiskers [28 and references therein]. The carbon filaments do not deactivate the
catalyst immediately, except after a massive carbon accumulation [54]. On nickel
surfaces, whisker carbon can form by dissociation of hydrocarbons or carbon

22
monoxide [55]. According to the classical model, adsorbed carbon atoms dissolve in
the bulk of the metal, then carbon diffuses through the bulk of the metal and
nucleates into a fiber at the rear interface. The nickel crystal alters shape into a
pear-like particle, abandoning tiny fragments of nickel behind in the whisker
[56]. This mechanism was challenged recently by a study based on ab initio DFT
calculations to investigate different diffusion processes that can take place in
whisker carbon formation [57]. It was reasoned that carbon diffusion through the
bulk nickel is very improbable. On the other hand, carbon transport could take place
via surface or subsurface diffusion. They showed that nickel step edge sites behave
as the favorable centers for the growth of graphene layers [57]. These conclusions
are in accordance with the results obtained by Helveg et al. [58] who used in situ
HRTEM to investigate the formation of carbon nanofiber growth from CH4
decomposition over MgAl2O4 supported nickel nanocrystals (Figure 11)
Figure 11. a) HRTEM of carbon nanofiber growth,
b) Illustration of growth mechanism [57]

23
CH4 decomposition and CO disproportionation are reversible and the potential for
carbon formation can be assessed by thermodynamics. Rostrup-Nielsen showed that
‘the principle of equilibrated gas’ can be applied which states that carbon will be
formed if the gas exhibits affinity for carbon after the foundation of methane
reforming and shift equilibrium [55]. This suggests that the composition used to
compute the equilibrium corresponds to the composition after accounting for the
reforming and shift equilibrium [59].
In a carbon limit diagram (Figure 12), atomic ratios of O/C are plotted in the
abscissa and the atomic ratios of H/C are plotted in the ordinate. While the straight
line increasing from H/C=4, O/C=0 (CH4 component) represents all feed mixtures of
steam-CH4, the lower line represents all feed mixtures of CO2-CH4. The dotted lines
exhibits conditions (O/C and H/C) resulting in the indicated H2/CO ratio in the
reformer exit gas [52].
The thermodynamic data for carbon are affected by the morphology of it formed on
the catalyst [52]. Figure 12 shows the carbon limit curve for graphite (Curve 1) and
whisker carbon (Curve 2). H2/CO ratios correspond to equilibrated gas at the
reformer outlet temperature of 900°C and pressure of 5 bar. For O/C and H/C ratios
on the left side of the curves, there is thermodynamic potential for carbon formation
[52].
As Rostrup-Nielsen indicated “the principle of equilibrated gas is no law of nature”.
It is feasible to rupture the thermodynamic limit [55]. One solution is to perform the
reaction over noble metal catalysts, which exhibit little tendency for carbon
formation [60]. Another alternative for large scale applications is to use sulphur
passivated catalysts as practiced in SPARG process [60]. This process solves carbon
formation problem by "ensemble control" which purports that the active sites for
carbon formation are blocked while adequate sites are preserved for the reforming
reaction. This effect is acquired by the addition of sulphur to the process feed [52].

24
Figure 12. Carbon limit diagram (principle of equilibrated gas)
Curve 1: graphite data, Curve 2: whisker carbon [adapted from 52]

25
CHAPTER 3
EXPERIMENTAL
3.1 Catalyst preparation
3.1.1 Preparation of Ni/Al2O3, Co/Al2O3 and Ni-Co/Al2O3 by incipient wetness
impregnation method
γ-Al2O3 supported monometallic 8 wt % nickel and 8 wt % cobalt; bimetallic 8-4 wt
% nickel-cobalt and 4-4 wt % nickel-cobalt catalysts were synthesized by incipient
wetness impregnation technique. Commercial γ-Al2O3 supplied by Alfa Aesar was
used as catalyts support, Ni(NO3)26H2O (Merck) and Co(C2H3O2)2.4H2O (Merck)
were used as metal sources. The impregnation solution was prepared by dissolving
required amount of Ni(NO3)26H2O and Co(C2H3O2)2.4H2O in deoinized water (1-2
ml H2O/g support). Ni and Co were loaded onto the γ-Al2O3 supports by
impregnating the supports with metal precursor solution to bring about incipient
wetness. Ni-Co bimetallic catalysts were prepared by co-impregnation method. The
catalysts were dried overnight at room temperature and then for 30 minutes at 80°C.
Finally, the catalysts were calcined at 700°C as well as 900°C for 5 hours to remove
ligands from the nickel and cobalt precursors. The catalysts calcined at 700°C were
denoted as Ni/Al2O3-I-700, Co/Al2O3-I-700 and Ni-Co/Al2O3-I-700. The catalysts
calcined at 900°C were denoted as Ni/Al2O3-I-900, Co/Al2O3-I-900 and Ni-
Co/Al2O3-I-900.
4-4 wt % Ni-Co/Al2O3 bimetallic catalyst was only used in DRIFTS experiments.
The metal loading for the Al2O3 supported bimetallic catalyst is 8-4 wt % Ni-Co in
all other parts.

26
3.1.2 Preparation of Ni/Al2O3 by polyol method
Ni(NO3)26H2O (Merck) was dissolved in 100 mL ethylene glycol (Merck) to obtain
a solution having 0.05M metal concentration. PVP (polyvinylpyrrolidone,
Mw=40,000 g/mol, Merck) was added to this solution as the metal-protecting agent
and mixed with a magnetic stirrer until obtaining a clear solution. Then required
amount of Al2O3 (Alfa Aesar) was added under stirring to obtain 10 wt % (nominal)
Ni/Al2O3 and mixed at room temperature for 20 hours. The pH of the solution was
adjusted to 10-11 with dropwise addition of 1 M NaOH which was prepared by
dissolution of sodium hydroxide in ethylene glycol. The abovementioned solution
was heated to the boiling point of ethylene glycol (185-190°C) with a reflux
condenser and it was kept at this temperature under magnetic stirring until the
reduction of Ni2+ to metallic Ni was achieved. The progress of reduction was
observed by the change of the color of solution. While the color was green at the
beginning of heating, it turned to grey gradually with the start of reduction. It turned
to black when the reduction finished. Then, the solution was quickly cooled down to
room temperature in an ice-water bath. The catalyst was isolated via centrifuge, then
washed with ethanol and centrifuged again. Subsequently, the catalyst loaded with
metal was dried in a furnace at 80°C for 24 hour. No calcination procedure was
applied. Three different catalysts were synthesized according to this procedure,
changing the PVP/Ni ratio (weight /weight): 0.0, 2.5 and 5.0. The samples obtained
in this work were denoted as Ni/Al2O3-without-PVP, Ni/Al2O3-PVP/Ni=2.5 and
Ni/Al2O3-PVP/Ni=5.0 corresponding to the PVP/Ni(NO3)2.6H2O ratio described
before. To make a comparison, a sample was prepared without changing neither the
pH nor adding PVP according exactly to the same procedure.

27
3.1.3 Preparation of Ni/CeO2, Co/CeO2 and Ni-Co/CeO2 by incipient wetness
impregnation method
CeO2 supported monometallic 8 wt % nickel, 8 wt % cobalt and bimetallic 8-4 wt %
nickel-cobalt catalysts were prepared by incipient wetness impregnation technique.
Pure CeO2 support was obtained by calcination of Ce(C2H3O2).1.5H2O at 700°C as
well as 900°C for 3 hours. Ni(NO3)26H2O (Merck) and Co(C2H3O2)2.4H2O (Merck)
were used as metal sources. The impregnation solution was prepared by dissolving
required amount of Ni(NO3)26H2O and Co(C2H3O2)2.4H2O in deoinized water. Ni
and Co were loaded onto the CeO2 supports by impregnating the supports with metal
precursor solution to bring about incipient wetness. Ni-Co bimetallic catalysts were
prepared by co-impregnation method. The catalysts were dried overnight at room
temperature and then at 120°C for four hours. Finally, the resulting products were
calcined at 700°C as well as 900°C for 5 hours to remove ligands from the nickel
and cobalt precursors. The catalysts calcined at 700°C were denoted as Ni/CeO2-I-
700, Co/CeO2-I-700 and Ni-Co/CeO2-I-700. The catalysts calcined at 900°C were
denoted as Ni/CeO2-I-900, Co/CeO2-I-900 and Ni-Co/CeO2-I-900.
3.1.4 Preparation of CeO2 by exotemplating method 1
Ceria fibers were synthesized according to an exotemplating method using
electrospun PMMA polymer fibers, followed by spray coating of an inorganic ceria
sol [61]. A template solution of 15 wt % PMMA in a mixture of acetone and
dimethyl formamide (60/40 wt %) was electrospun via a glass syringe (5 mL) with
tip dimensions of 0.8x40 mm at an electrode distance of 20 cm and 26 kV to the
copper counter electrode (15x15 cm2) (Figure 13).
1.37 g Cerium (IV) ammonium nitrate salt was dissolved in 40 mL distilled water.
0.65 mL of aqueous solution of ammonia (25 wt %) was added so as to increase the
pH of the solution. This solution was kept under vigorous stirring for 30 minutes.
1 Preparation of CeO2 by exotemplating method was done at Technical University of Darmstadt.

28
About 1 gram of Pluronic P123 block copolymer was added as surfactant and the
solution was mixed at 50°C for 5 hours. This solution was spray coated onto the
prepared polymer fibers. The sol-gel transformation of the sample was accomplished
in a furnace at 80°C overnight.
Oxygen plasma etching was done by using a Diener Electronics PS Tech, Femto
machine for 18 h. Plasma was created by an inductively coupled RF generator with
the frequency of 13.56 MHz and the output power of 200 W. The flow rate of
oxygen sent to chamber was 4 mL/min. Finally, the sample was calcined at 350°C
for 3 h.
Figure 13. Electrospinning set-up

29
3.2 Catalyst Characterization
3.2.1 X-Ray Diffraction (XRD) Analysis
X-ray powder diffraction data were acquired with a Philips model PW1840 X-ray
diffractometer using Ni-filtered Cu Kα radiation source (λ=0.1542 nm) operated at
30kV and 24 mA. XRD patterns were measured between 2θ=10°-100° at a scan rate
of 0.01°/sec.
3.2.2 Surface Area, Pore Size Distribution and Adsorption-Desorption
Isotherms
Micromeritics TriStar II surface area and porosity analyzer was utilized to measure
the N2 adsorption-desorption isotherms of the samples at 77K. The samples were
degassed for 3 hours at 423K prior to measurements by means of Micromeritics
VacPrep 061 Sample Degas System for removing the moisture and other adsorbed
gases from the catalyst surface. The surface area was obtained from multipoint BET
(Brunauer–Emmett–Teller) method. The pore volume and average pore diameter
were estimated from adsorption branch of isotherms by the method of BJH (Barrett,
Joyner and Halenda).
3.2.3 Temperature Programmed Reduction (TPR) Analysis
The reducibility of the samples was investigated by H2 temperature programmed
reduction study. TPR experiments were performed by a home built system using a
fixed bed quartz reactor, the length of which was 35 cm and the inner diameter of
which was 4 mm. The quartz reactor was placed into a temperature controlled tube
oven. Gas flows were metered by mass flow controllers. 100 mg catalyst was heated
from room temperature to 850°C using 40 sccm H2:Ar (3:97) gas flow at a ramp rate
of 5°C/min. The temperature was kept constant at 850°C for half an hour. The outlet

30
H2 concentrations were recorded online by means of a Teledyne 2000 XTC model
TCD detector.
3.2.4 DRIFTS
In order to determine the adsorbed species and to investigate how the species are
adsorbed on the surface of the catalysts, DRIFTS experiments were performed.
DRIFTS measurements were carried out using a Perkin Elmer FTIR (Spectrum 100
series) which was equipped with a drift cell (Pike) and MCT detector. All spectra
were recorded with 4 cm-1 resolution in the range of 4000-400 cm-1 for a total scan
count of 128.
Experimental set up of DRIFTS measurements is shown in Figure 14. Feed gas (H2,
CO2 and CH4) lines were connected to a gas manifold, the outflow of which was
attached to the reaction cell. The feed gas was first accumulated in the manifold and
then sent to the reaction cell.
Prior to the CO2 and CH4 adsorption experiments, the following pretreatment
procedure was performed. First, the sample was outgassed at room temperature at a
pressure of 10-6 Torr. Then, the temperature of the samples was increased from room
temperature to 400°C incrementally. Reduction was done by sending 100 Torr H2
four times at 400°C and between each H2 treatment, the system was evacuated.
Finally, the system was outgassed and cooled down to room temperature. After the
pretreatment, background spectra was recorded and then the pressure of the
adsorbate gas was set to 97.5, 300, 500 Torr respectively. DRIFTS spectra were
recorded after the admission of each dosage of gas. Then the system was heated to
100, 200, 300 and 400°C incrementally in order to observe the change in adsorption
pattern with an increase in temperature by recording the DRIFTS spectra.
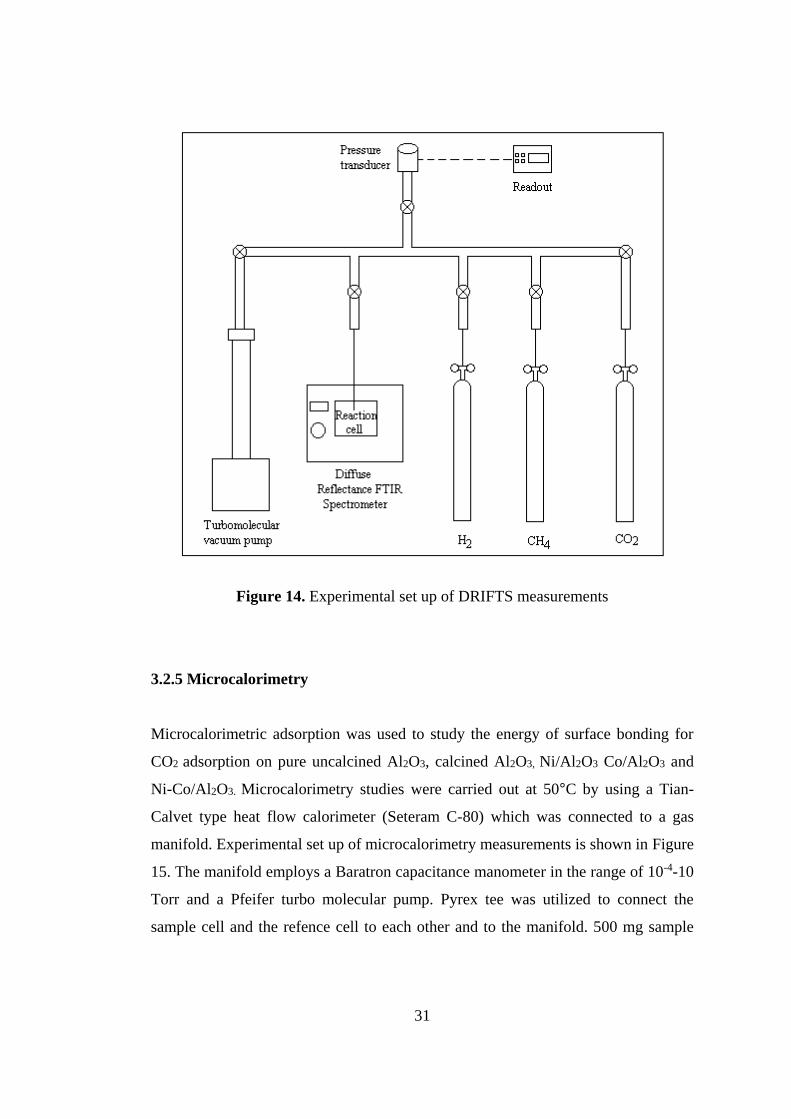
31
Figure 14. Experimental set up of DRIFTS measurements
3.2.5 Microcalorimetry
Microcalorimetric adsorption was used to study the energy of surface bonding for
CO2 adsorption on pure uncalcined Al2O3, calcined Al2O3, Ni/Al2O3 Co/Al2O3 and
Ni-Co/Al2O3. Microcalorimetry studies were carried out at 50°C by using a Tian-
Calvet type heat flow calorimeter (Seteram C-80) which was connected to a gas
manifold. Experimental set up of microcalorimetry measurements is shown in Figure
15. The manifold employs a Baratron capacitance manometer in the range of 10-4-10
Torr and a Pfeifer turbo molecular pump. Pyrex tee was utilized to connect the
sample cell and the refence cell to each other and to the manifold. 500 mg sample

32
was used for all experiments. The feed gas was first accumulated in the manifold
and then sent to the reaction cell.
Figure 15. Experimental set up of microcalorimetry measurements
Prior to the CO2 adsorption experiments, the following pretreatment procedure was
performed. First, the catalyst was heated to 523K at a ramp rate of 2K/min and kept
at this temperature under vacuum for 10 hours. After being cooled down to room
temperature it was again heated up to 523K and reduced in situ at this temperature by
repeatedly increasing the pressure to 10 torr of H2, followed by evacuation. Finally,
the system was outgassed and cooled down to 323 K. The differential heats of CO2
measurements were performed at 323 K by sending subsequent doses of gas onto the
samples. The heat response resulted from adorption was recorded as a function of

33
time. The equilibrium pressure was recorded when thermal equilibrium was reached.
The amount of adsorbed gas onto the sample was calculated volumetrically by using
the initial dosage of gas and the equilibrium pressure. The integration of the heat
curve yielded the heat evolved as a result of adsorption. The above procedure was
repeated until the surface of the sample was saturated with the adsorbate gas.
3.2.6 Thermal Gravimetric Analysis (TGA)
TGA was carried out to determine the amount of coke deposition on the samples
after being used in the CO2 reforming of CH4. In adddition to this, TGA was also
used to determine the amount of organics in the fresh samples prepared by polyol
process. The analyses were performed using a Shimadzu DTG 60-H instrument,
where each sample was introduced into an alumina microbalance pan that was
heated to 1173 K at a rate of 10 K/min in an oxygen/nitrogen mixture (21:79 vol/vol
with a total flow of 75 ml/min).
3.2.7 Transmission Electron Microscopy (TEM)
3.2.7.1 High Resolution Transmission Electron Microscopy (HRTEM)
The morphology of Al2O3 supported fresh samples which were prepared by incipient
wetness impregnation method were characterized by Jeol 2100F HRTEM machine
equipped with Orius SC1000 Model 832 11 Megapixel CCD camera. Before taking
the micrographs, the catalysts were dispersed ultrasonically in alcohol and a drop of
dispersion was deposited and dried on holey carbon film grid.
3.2.7.2 High Contrast Transmission Electron Microscopy (HCTEM)
The morphology of carbon deposited on the samples after dry reforming of methane
reaction and the morphology of the fresh samples prepared by polyol method were
34
characterized by FEI Tecnai G2 Spirit Bio (TWIN) HCTEM operated at 120 kV.
Before taking the micrographs, the samples were dispersed ultrasonically in alcohol
and a drop of dispersion was deposited and dried on a 400 mesh carbon-coated
copper grid.
3.2.8 Scanning Electron Microscopy (SEM) 2
SEM was done by FEI XL30 FEG operating at a voltage of 25 kV to characterize
the morphology of ceria sample prepared by an exotemplating method.
3.2.9 Nuclear Magnetic Resonance (NMR) 3
Room temperature 13C direct detection magic angle spinning (MAS) NMR
spectroscopy experiments were acquired at 7.05T with a 4 mm Chemagnetics probe
using a Tecmag Discovery Spectrometer and spinning speed of 10 kHz. The carbon
channel of the probe was tuned to 75.39 MHz.
3.3 Dry Reforming Reaction Tests
Carbon dioxide reforming of methane reactions were performed in a home built
reaction system. The reaction setup consists of a gas supply system, reaction part
and analyzer as shown in Figure 16.
2 SEM studies were done at Technical University of Darmstadt. 3 NMR measurents were done at UC Berkeley.

35
Figure 16. Experimental set up for the catalytic reaction tests
The gas supply system contains the feed gas cylinders (H2, Ar, CH4 and CO2) and
mass flow controllers (MKS 1179 B). The flow of inlet gas streams were controlled
by these mass flow controllers. The reaction part is composed of quartz reactor and a
temperature controlled tube oven. The length and inner diameter of reactor are 35
cm and 4 mm, respectively. The temperature of the reaction was controlled by
means of a thermocouple which was placed in the middle of tube oven. The product
gases were sent to a gas chromatograph (HP 5890 Series II) by means of a 6 way
valve (Vici valco) equipped with a 100μL sample loop. The gas chromatograph
contains a thermal conductivity detector and a Carboxen 1010 Plot column. Before
the analysis, the gas chromatograph was calibrated for H2, CO, CH4 and CO2 gases
in order to analyze the outlet stream of the reaction quantitatively. The calibration
curves were drawn as the volumetric flow rate of the gas (sccm) versus the
corresponding area under the peak. The operating conditions of gas chromatograph
are given in Table 5.

36
Table 5. Operating conditions of gas chromatograph
Column Carboxen 1010 Plot, 30 m x 0.53 mm I.D.
Detector Thermal conductivity detector (TCD)
Injection temperature 200°C
Detector temperature 210°C
Oven temperature 27°C (5.5 min)
30°C /min to 80°C (6 min)
30°C /min to 120°C (3 min)
Column pressure 100 kPa
Injection volume 100 μL valve injection
Reference gas Argon
In the reaction tests, both powder and particles in the size range of 0.5-1.0 mm were
used. For obtaining the particles in the size range of 0.5-1.0 mm, the powder
catalysts were first pressed, then crushed and finally sieved to a size of 0.5-1.0 mm.
The samples were placed in the center of the 4 mm-i.d. microreactor by quartz wool
at both ends. The reactions were carried out at 600°C or 700°C with 50 sccm
CH4:CO2:Ar (1:1:3) gas flow for 5 hours. Before the catalytic activity tests, the
samples prepared by incipient wetness impregnation method were reduced in 50
sccm H2:Ar (2:3) by heating from room temperature to 700°C with 10°C/min
heating rate and kept at this temperature for one hour. 30 sccm pure Argon was sent
to the reactor for half an hour before the reactant gases were sent. On the other hand,
the catalysts prepared by polyol process were not reduced before the reaction tests.
They were heated in 30 sccm Argon flow from room temperature to the reaction
temperature (600°C or 700°C) with 10°C/min. 50 sccm CH4:CO2:Ar (1:1:3) were
sent to the reactor immediately after reaching to the reaction temperature.
37
3.4 Redox Experiments on Ceria Samples 4
Ceria samples prepared by exotemplating (CeO2-ESC), coprecipitation (CeO2-CPC)
and commercial ceria (CeO2-COC) were first pressed, then crushed and finally
sieved with a size of 250-355 mesh. 50 mg of sample was placed in the U-tube
quartz reactor system. The product gases were analyzed by means of an on-line
quadrupole mass spectrometer.
One redox experiment consisted of six steps. The first two steps were flow
experiments and the remainings were transient pulse experiments while 500μL gas
was introduced at a frequency of 1 minute. For the pulse experiments, computer-
controlled switching valves were utilized. In each case, Helium was used as the
major component of the gas mixture. The total flow rate was set to 100 sccm. The
flow of the reactant gases CO and O2 was adjusted to be 1 % of the total flow rate.
Step 1. The sample was oxidized under 100 sccm O2/He by heating from room
temperature to 600°C with 10°C/min. The temperature was kept at 600°C for 25
minutes. The sample was cooled down in He atmosphere.
Step 2. The sample was reduced under 100 sccm CO/He by heating from room
temperature to 600°C with 10°C/min. The temperature was kept at 600°C for 25
minute. Then it was switched to He and kept under He atmosphere for 25 minutes.
Step 3. 100 sccm O2/He was sent to the sample loop. 100 oxygen pulses were
applied. After having finished oxygen pulses, the sample was kept under He for 25
minutes.
Step 4. 100 sccm CO/He was sent to the sample loop. 120 CO pulses were applied.
After having finished CO pulses, the sample was kept under He for 25 minutes.
4 Redox experiments on ceria samples were done at Ruhr University Bochum.

38
Step 5. 100 sccm O2/He was sent to the sample loop. 100 oxygen pulses were
applied. After having finished oxygen pulses, the sample was kept under He for 25
minutes.
Step 6. 100 sccm CO/He was sent to the sample loop. 120 CO pulses were applied.
After having finished CO pulses, the sample was kept under He for 25 minutes.

39
CHAPTER 4
DRY REFORMING OF METHANE ON Al2O3 SUPPORTED Ni, Co and
Ni-Co CATALYSTS SYNTHESIZED BY INCIPIENT WETNESS
IMPREGNATION METHOD
4.1 Introduction
Ni catalysts have taken great interest in dry reforming of CH4 due to their high
catalytic activity, wide availability and low cost [1,10,62]. However, the main
restriction of Ni-based catalysts is the formation of carbon which brings about
catalyst deactivation [1,10,62]. Several approaches have been proposed for
decreasing the carbon formation tendency of Ni-based catalysts: employing
appropriate catalyst preparation methods, using metal oxides as supports or
promoters, addition of a second metal to form bimetallic system, sulfur passivation,
introducing steam, changing reaction conditions [1,11,63,64].
The addition of a second metal is one of the methods applied for dry reforming
process with the objective of developing carbon resistance of Ni-based catalysts.
There are studies reported on the beneficial effect of noble metal addition such as Rh
[65,66], Pt [67,68], Pd [68] and Ru [69] to the Ni-based catalyst. From an economic
point of view, the addition of a non-noble metal is more preferable. In this respect
cobalt is of great interest.
Xu et al. [11] prepared Ni monometallic, Co monometallic and Ni-Co bimetallic
catalysts with varying compositions which were supported on commercial γ-Al2O3
doped with La2O3 for biogas reforming. For bimetallic samples, the ratio of nickel
and cobalt was changed by keeping the total metal loading at 10 % by weight. The
monometallic 10 Co/LaAl sample exhibited the lowest catalytic activity. On the
other hand, the monometallic 10 Ni/LaAl sample showed high activity. The

40
incorporation of cobalt to the nickel catalyst influenced the catalytic activity. The
catalyst having Ni/Co ratio of 7/3 exhibited the highest CH4 and CO2 conversion.
Nevertheless, the catalytic activity decreased considerably if the amount of cobalt
was increased further. Bimetallic catalysts having a Ni/Co ratio of 5/5 and 3/7
exhibited lower activity than monometallic Ni catalyst. The authors proposed that
the adjustment of nickel to cobalt ratio could enhance pore textural properties and
metal dispersion and hence improve the catalytic activity and resistance against
carbon formation.
Zhang et al. [36] prepared Ni–Me–Al–Mg–O catalysts by using coprecipitation
method where Me was cobalt, iron, copper or manganese. Ni-Co sample exhibited
excellent activity and stability compared to the other bimetallic catalysts in dry
reforming of methane. The CH4 conversion was in the order of Ni–Co>Ni–Mn>Ni–
Fe>Ni–Cu. Cobalt incorporated nickel sample was also shown to be the best one
due to its lowest coke deposition rate. By decreasing the nickel and cobalt loading to
approximately half of their initial amounts, coke formation was eliminated for up to
250 hours which was attributed to better metal dispersion and smaller particle size.
The authors suggested that “The high activity and excellent stability of Ni–Co
catalyst was closely related to its high metal dispersion, strong metal–support
interaction, and formation of stable solid solutions.”
Takanabe et al. [70] compared the catalytic activities of TiO2 supported Ni, Co and
Ni-Co catalysts for CO2 reforming of CH4. The monometallic Co/TiO2 sample
didn’t exhibit any activity when the temperature was lower than 750°C which was
ascribed to the oxidation of metallic Co. Although this catalyst started to exhibit
activity above 850°C, it was still less than the activity of Ni/TiO2 and Ni-Co/TiO2.
When the temperature was between 600°C and 750°C, CH4 conversion was
approximately same for Ni/TiO2 and Ni-Co(50-50)/TiO2. On the other hand, the
activity of Ni/TiO2 in terms of CH4 conversion was higher than that of Ni-Co(50-
50)/TiO2 when the temperature was higher than 750°C. While Ni/TiO2 sample

41
deposited considerable amount of coking particularly at lower temperatures,
Co/TiO2 sample exhibited tendency to be oxidized during dry reforming. On the
other hand, the combination of Ni-Co catalyst showed both high catalytic activity
and resistance to coke formation during the reaction. The authors suggested that the
composition of bimetallic Ni-Co catalyst could be adjusted to alter its catalytic
performance for dry reforming of methane.
Nagaoka et al. [32] studied the effect of replacing cobalt by nickel in a TiO2
supported Co catalyst for CO2 reforming of CH4. When cobalt was replaced by a
small quantity of nickel, the catalytic stability of Co/TiO2 improved. On the hand,
the catalytic stability decreased if cobalt was replaced by an excess amount of
nickel. Deactivation was attributed to metal oxidation when cobalt amount was too
high, whereas it was attributed to carbon deposition when nickel amount was too
high. As a result, replacement of cobalt by nickel aided to the retardation of metallic
cobalt oxidation; but, excess nickel caused carbon deposition. Co:Ni ratio of 90:10
was shown to be optimum presenting high stability with an unimportant amount of
carbon formation.
San-Jose´-Alonso et al. [10] prepared Al2O3 supported Ni, Co and Ni–Co catalysts
(having 9 % nominal metal content by weight) for CO2 reforming of CH4. The
catalysts containing the highest amount of cobalt (Co(9) and NiCo(1–8)) exhibited
the highest activity and stability. However, they produced much higher amount of
coke. Their higher activity was attributed to the higher activity of cobalt for CH4
decomposition. Their noteworthy stable behavior was ascribed to the existence of
big particles taking place in long-term conversion and producing non-deactivating
carbonaceous deposit. In this study, carbon deposition increased with increasing Co
content, while it decreased with increasing Ni content.
The literature indicates that there are discrepancies between the outcomes of
different researches dealing with Ni-Co supported bimetallic catalysts. In this part, a

42
comprehensive investigation on the effect of cobalt addition to the alumina
supported nickel catalyts for CO2 reforming of CH4 was carried out by studying
Ni/Al2O3, Co/Al2O3 and Ni-Co/Al2O3 catalysts comparatively. In order to see the
effect of calcination temperature on the activity of the catalyst during carbon dioxide
reforming of methane, they were calcined at two different temperatures, 700°C and
900°C.
The catalyst deactivation during dry reforming of methane is caused by carbon
formation [1,28,29], sintering at high temperature [30,31] and oxidation of metallic
sites [32,33]. Although in literature it is agreed that the primary cause of catalyst
deactivation is carbon formation, there are disagreements existing on the origin of
coke which can come from CH4 and CO2.
Wang and Lu [71] investigated how coking rate depended on partial pressures of
CO2 and CH4 over γ-Al2O3 supported nickel catalyst during dry reforming of
methane at 600°C. While coke formation had a positive relationship with CH4
partial pressure, it had a negative relationship with CO2 partial pressure, indicating
that CO2 in the feed inhibited coke formation. Therefore, the authors concluded that
decomposition of CH4 was the dominating way of coke formation in dry reforming
of methane reaction over Ni/γ-Al2O3.
Yang and Papp [72] used CO2-temperature programmed surface reaction (TPSR) to
determine the source of carbon deposition during dry reforming of methane. They
exposed fresh Pt/MgO catalyst to a mixture of CH4/N2 and CO/N2 separately at
800°C for 10 minutes. CO2-TPSR resulted in two CO peaks (one is at 820°C,
another is higher than 900°C) for the catalyst exposed to CH4/N2 mixture, indicating
two types of carbon deposition from methane decomposition. On the other hand, no
CO peak was detected for the catalyst exposed to CO/N2 mixture, indicating that CO
disproportionation did not occur under the applied reaction condition. CO2-TPSR
profile of the spent catalyst in severe dry reforming conditions also resulted in two
CO peaks where the main peak coincided very well with the high temperature peak

43
observed in the TPSR profile of the catalyst exposed to CH4/N2 mixture. The authors
concluded that carbon deposition in dry reforming reaction was resulted mainly from
methane decomposition.
Verykios [73] showed that dry reforming of methane over Rh/Al2O3 catalyst resulted
in the formation of three types of carbon species by using TPH and TPO techniques.
The relative and the total amounts of various kinds of carbonaceous species were
shown to depend on period of exposure and temperature. To investigate the source
of carbon species, Verykios conducted reaction experiments with 13CH4 and 12CO2
(13CH4/12CO2/He = 0.2/0.2/0.6) for 10 minutes over Rh/Al2O3 at 650°C. TPO results
of the spent catalyst revealed that the carbon deposited over Rh/Al2O3 mainly
originated from CO2 molecule with a little contribution of CH4 molecule.
Lemonideu et al. [74] investigated the source of carbon species deposited during dry
reforming of methane at 750°C by conducting isotopic experiments on 5 weigt % Ni
loaded calcium aluminate. They performed TPO experiments after conducting the
reaction at 750°C for 5 minutes by using 12CO2/13CH4/He=0.2/0.2/0.6 feed mixture.
TPO results indicated the formation of two types of carbonaceous species which
exhibited different reactivities towards oxidation. The coke was found to originate
from both reactants where the proportion of it resulting from carbon dioxide as
opposed to methane was found to be 2.1.
Kroll et al. [75] performed TPO experiments over 24.6 mg Ni/SiO2 after a 10
minute reaction at 700°C by using 12CO2 and 13CH4 feed mixture
(12CO2/13CH4/He=9.5/9.5/81) with a flow rate of 3 L/hour. Two kinds of
carbonaceous deposits were observed: a sharp oxidation peak at around 500°C and a
broad oxidation peak having a maximum at around 650°C. The low temperature
oxidation peak was mainly formed of 13Carbon (76%). On the other hand, the broad
high temperature oxidation peak exhibited a higher concentration in 12Carbon (60%).
The carbon species which could be oxidised easily were attributed to the reaction

44
intermediates. The less easily oxidised carbon deposits were attributed to slowly
depositing species which would convert progressively into carbon whiskers and
carbon veils with time-on stream. The authors concluded that these less reactive
carbon species could arise from both CO2 and CH4 activation on the catalyst.
Tsipouriari and Verykios [5] conducted isothermal oxidation followed by isothermal
hydrogenation of the carbon deposits accumated on 17 wt % Ni/La2O3 and 17 wt %
Ni/Al2O3 after 0.5 hour dry reforming reaction with 30 ml/min CO2/13CH4/He
(20/20/60 vol %) at 750°C. The results of isothermal oxidation and isothermal
hydrogenation together showed that most of the carbon deposited over Ni/La2O3 was
originated from the reaction pathway of methane rather than from carbon dioxide.
Approximately 80% of the coke was originated from methane cracking over
Ni/La2O3 catalyst. On the other hand, the majority of the carbon deposited over
Ni/Al2O3 was shown to come from carbon dioxide dissociation. While
approximately 85% of the deposited carbon derived from carbon dioxide
dissociation, only 15% of it came from methane cracking.
Recently, McFarlane et al. [76] performed reaction testing measurements over 10
mg Ni/Al2O3 (26 wt %) catalyst at 625°C for 90 minutes in the micro-reactor where
5.6 sccm/min 13CO2 and 5.6 sccm/min 12CH4 diluted in 40 sccm/min He were used
as reactants. The post reaction TPO profiles revealed that in the addition to the
12CO2 peak centered at 617°C, there was also a significant 13CO2 feature at the same
temperature. This result made the authors to conclude that both CH4 and CO2
contributed to carbon deposition over the catalyst surface during dry reforming
process, methane being the greater contributor.
The clarification of this issue is necessary in terms of understanding the mechanism
of carbon formation with the aim of reactor design and catalyst design which can
prevent accumulation of coke. For this aim, reaction tests were carried out with
13CO2 over Ni/Al2O3 and the used catalyst was characterized by solid 13C solid state

45
NMR spectrometer. This is the first study to the authors knowledge of characterizing
the spent catalyst by 13C solid state NMR to determine the coke origin in dry
reforming of methane reaction.
4.2 Results and Discussion
4.2.1 Characterization of commercial Al2O3
4.2.1.1 X-Ray Diffraction (XRD) Analysis
γ-Al2O3 powder from Alfa Aesar was used as support. Alumina has the property of
existing in different kinds of metastable structures, so-called transition aluminas
(such as к, γ, δ, θ) and also its stable α-Al2O3 phase [77]. When boehmite (AlOOH)
is heated up, all OH are eliminated and it transforms into different transition
aluminas with the sequence of γ→δ→θ→α-Al2O3 [77,78].
This polymorphism could be sorted according to the oxygen sublattice structure and
the distribution into this sublattice of aluminum ions in tetrahedral and octahedral
interstitial sites. In α-Al2O3, the oxygen sublattice is hexagonal-close-packed
structured with 2/3 of octahedral sites filled with cations. On the other hand, к, γ, δ,
θ phases have face-centered-cubic structure of oxygen atoms and cations existing in
different proportions in both octahedral and tetrahedral sites [77].
Le Coz et al. suggested the below mechanisms of dehydration and crystallisation
according to the TGA, DTA and XRD results [78].
25 < Temperature < 100°C Al(OH)3 + H2O(l) → Al(OH)3 + H2O(g) (9)
100 < Temperature < 400°C Al(OH)3 → AlOOH + H2O (10)
550 < Temperature < 800°C 2AlOOH → γ-Al2O3 + H2O (11)
800 < Temperature < 900°C γ-Al2O3 → δ-Al2O3 (12)
900 < Temperature < 1100°C δ-Al2O3 → θ-Al2O3 (13)
1300 < Temperature < 1400°C θ-Al2O3 → α-Al2O3 (14)

46
In the XRD pattern of the as received alumina powder (Figure 17) it is demonstrated
that boehmite, γ-Al2O3 and δ–Al2O3 phases coexist simultaneously by considering
the reference XRD patterns (Boehmite: 21-1307 JCPDS file, γ-Al2O3: 50-741
JCPDS file, δ –Al2O3: 46-1215 JCPDS file).
Figure 17. XRD pattern of commercial Al2O3 powder
4.2.1.2 Surface Area, Pore Size Distribution and Adsorption-Desorption
Isotherms
Properties of commercial Al2O3 powder obtained from nitrogen physisorption data is
summarized in Table 6.
Table 6. Textural properties of commercial Al2O3 powder
Sample BET Surface
area (m2/g)
Pore volume
(cm3/g)
Average pore
diameter (nm)
commercial Al2O3 73.19 0.37 19.69
N2 adsorption-desorption isotherm and pore size distribution of pure alumina is
shown in Figure 18 and Figure 19 respectively. According to the IUPAC
classification commercial pure Al2O3 exhibits type II adsorption isotherm which is

47
characteristic of macroporous materials and the H3-shape hysteresis loop of the
sample shows the presence of mesopores [79]. The presence of H3 hysteresis loop
indicates a broad pore size distribution (Figure 19) [80]. Pore size distribution of the
sample indicates that it is mainly composed of macropores (pore diameter>50 nm in
diameter) in addition to the mesopores (2nm<pore diameter<50 nm).
Figure 18. Nitrogen adsorption-desorption isotherms of commercial Al2O3 powder
Figure 19. BJH pore size distribution of commercial Al2O3 powder
0
50
100
150
200
250
0.0 0.2 0.4 0.6 0.8 1.0
Qu
an
tity
ad
sorb
ed (
cm3/g
ST
P)
P/Po
pure uncalcined Alumina Ads.
pure uncalcined Alumina Des.
0
2
4
6
1 10 100
dV
/dlo
gD
Pore diameter (nm)
pure uncalcined Alumina

48
4.2.2 Characterization of fresh catalysts
4.2.2.1 X-Ray Diffraction (XRD) Analysis
To see the influence of calcination temperature on dry reforming of methane
reaction, Al2O3 supported Ni, Co and Ni-Co catalyst were prepared by calcining at
both 700°C and 900°C. XRD patterns of pure Al2O3, Ni/Al2O3, Co/Al2O3 and Ni-
Co/Al2O3 calcined at 700°C and 900°C are given in Figure 20 and Figure 21
respectively.
Figure 20. XRD pattern of pure Al2O3, Ni/Al2O3,
Co/Al2O3 and Ni-Co/Al2O3 calcined at 700°C

49
Bulk phase property of the catalysts were identified by means of XRD. The species
generated during calcination were strongly dependent on calcination temperature. As
remembered, the diffraction peaks of boehmite, γ-Al2O3 and δ-Al2O3 were observed
in commercial pure alumina powder (Figure 17). When this alumina was calcined at
700°C and 900°C for 5 hours, boehmite diffraction peaks disappeared and peaks due
to δ-Al2O3 and γ-Al2O3 became more dominant (Figure 20 and Figure 21).
Figure 21. XRD pattern of pure Al2O3, Ni/Al2O3,
Co/Al2O3 and Ni-Co/Al2O3 calcined at 900°C

50
Due to the decomposition of the nitrates and subsequent oxidation, the following
oxides can be formed during calcination step [81]:
Ni(NO3)2 → NiO + N2O5 (15)
NiO + Al2O3 → NiAl2O4 (16)
CoO + Al2O3 → CoAl2O4 (17)
NiO + 2CoO + 0.5O2→ NiCo2O4 (18)
NiAl2O4, CoAl2O4 and NiCo2O4 spinel compounds might have been formed during
the high temperature calcination step [11,81]. From the diffractograms it is difficult
to make a discrimination between the distinct species due to the overlap of the
reflections of these phases. It is also hard to distinguish monometallic and bimetallic
catalysts from each other because of their similar morphology and characteristic
peaks. Ni2+, Co2+ , Mg2+ and Al3+ were thought to pertain to the identical lattice in
Ni/Co/Al/Mg composite catalyst [82]. Characteristic peaks of NiO were not
observed in the XRD patterns which indicated that the active metal species were
embodied into the spinel structure [83 and references therein].
When Figure 20 and Figure 21 is compared with each other, it is seen that the
intensity of the peaks which are considered to correspond to the spinel phases
become stronger with increasing temperature, suggesting an increased degree of
crystallization and particle size.
4.2.2.2 Surface Area, Pore Size Distribution and Adsorption-Desorption
Isotherms
BET surface area, pore volume and pore diameter of commercial pure Al2O3 were
73.19 m2/g, 0.37 cm3/g and 19.69 nm respectively (Table 6). When this Al2O3 was
calcined at 700°C and 900°C, its surface area, pore volume and pore diameter
decreased significantly as shown in Table 7 and 8. This could be attributed to the
sintering of the particles with increasing calcination temperature.

51
Table 7. Textural properties of pure Al2O3, Ni/Al2O3,
Co/Al2O3 and Ni-Co/Al2O3 calcined at 700°C
Catalyst BET surface
area (m2/g)
Pore volume
(cm3/g)
Average pore
diameter (nm)
Pure Al2O3 calc.
at 700°C
57.26 0.23 15.29
Ni/Al2O3
48.86 0.35 26.92
Co/Al2O3 49.50 0.31 23.66
Ni-Co/Al2O3 46.42 0.28 22.99
Table 8. Textural properties of pure Al2O3, Ni/Al2O3,
Co/Al2O3 and Ni-Co/Al2O3 calcined at 900°C
Catalyst BET surface
area (m2/g)
Pore volume
(cm3/g)
Average pore
diameter (nm)
Pure Al2O3 calc.
at 900°C
51.15 0.21 16.67
Ni/Al2O3
45.45 0.34 27.74
Co/Al2O3 42.91 0.31 27.71
Ni-Co/Al2O3 40.84 0.30 27.87
At a given metal loading (Ni, Co or Ni-Co), the surface area decreased with an
increase in calcination temperature. The particles agglomerate more with increasing
temperature which result in progressive reduction in surface area. While the total
pore volume of all catalysts were lower than that of the as received support (0.37
cm3/g), their average pore diameter were higher than that of the as received support
(19.69 nm).

52
N2 adsorption-desorption isotherms of the pure Al2O3, Ni/Al2O3, Co/Al2O3 and Ni-
Co/Al2O3 calcined at 700°C and 900°C are shown in Figure 22 and Figure 23
respectively. All samples exhibit type II adsorption isotherm which is characteristic
of macroporous materials. H3-shape hysteresis loop of the samples indicate the
existence of mesopores [79]. Broad pore size distribution of the catalysts mainly
dominated by macropores are shown in Figure 24 and 25. Mesoporosity is also seen
clearly for all the catalysts except Co/Al2O3 calcined at 900°C.
Figure 22. Nitrogen adsorption-desorption isotherms of pure Al2O3,
Ni/Al2O3, Co/Al2O3 and Ni-Co/Al2O3 calcined at 700°C
0
100
200
300
400
500
0.0 0.2 0.4 0.6 0.8 1.0
Qu
an
tity
ad
sorb
ed (
cm3/g
ST
P)
P/Po
Ni/Alumina-700 Ads.
Ni/Alumina-700 Des.
Co/Alumina-700 Ads.
Co/Alumina-700 Des.
Ni-Co/Alumina-700 Ads.
Ni-Co/Alumina-700 Des.
pureAlumina-700 Ads.pure Alumina-700 Des.

53
Figure 23. Nitrogen adsorption-desorption isotherms of pure Al2O3,
Ni/Al2O3, Co/Al2O3 and Ni-Co/Al2O3 calcined at 900°C
Figure 24. BJH pore size distribution of pure Al2O3,
Ni/Al2O3, Co/Al2O3 and Ni-Co/Al2O3 calcined at 700°C
0
100
200
300
400
500
0.0 0.2 0.4 0.6 0.8 1.0
Qu
an
tity
ad
sorb
ed (
cm3/g
ST
P)
P/Po
Ni/Alumina-900 Ads.
Ni/Alumina-900 Des.
Co/Alumina-900 Ads.
Co/Alumina-900 Des.
Ni-Co/Alumina-900 Ads.
Ni-Co/Alumina-900 Des.
pureAlumina-900 Ads.pure Alumina-900 Des.
0
2
4
6
8
10
1 10 100
dV
/dlo
gD
Pore diameter (nm)
Ni/Alumina-700Co/Alumina-700Ni-Co/Alumina-700pure Alumina-700

54
Figure 25. BJH pore size distribution of pure Al2O3,
Ni/Al2O3, Co/Al2O3 and Ni-Co/Al2O3 calcined at 900°C
4.2.2.3 High Resolution Transmission Electron Microscopy (HRTEM)
HRTEM was performed to examine the morphologies of the fresh catalysts.
HRTEM images of fresh Ni/Al2O3-I-900 and Ni-Co/Al2O3-I-900 are given in Figure
26 and Figure 27, respectively. The dark spots scattering in the ligher zone reveal
the nickel particles and alumina support, respectively [84]. In addition to the
spherical and rod-like particles, the TEM analysis shows that most of the particles
have an irregular shape. The nickel or cobalt particles are seen to be located over the
alumina support. Neither TEM nor XRD data could reveal any morphological
difference between Ni/Al2O3 and Ni-Co/Al2O3 catalysts.
0
5
10
15
20
1 10 100
dV
/dlo
gD
Pore diameter (nm)
Ni/Alumina-900Co/Alumina-900Ni-Co/Alumina-900pure Alumina-900

55
Figure 26. HRTEM images of fresh Ni/Al2O3-I-900

56
Figure 27. HRTEM images of fresh Ni-Co/Al2O3-I-900

57
4.2.2.4 Temperature Programmed Reduction (TPR) Analysis
Reducibility of the catalysts was investigated by TPR which can be discussed in
terms of two main subjects. The first one is the effect of calcination temperature and
the second one is the effect of Co addition to the Ni based catalysts.
Figure 28. TPR profiles of Ni/Al2O3, Co/Al2O3 and Ni-Co/Al2O3 calcined at 700°C
When Figure 28 and Figure 29 are compared with each other, it is seen that while
the catalysts calcined at 700°C have two reduction peaks, the ones calcined at 900°C
have only one peak. The small peaks appearing in the low temperature region,
465°C for Ni/Al2O3-I-700 and 480°C for Ni-Co/Al2O3-I-700 were attributed to the
reduction of NiO [85] and Co3O4 (or CoO) [86-87] respectively. The high

58
temperature reduction peaks for both the catalysts calcined at 700°C and 900°C were
attributed to the reduction of spinel oxides which could be NiAl2O4, CoAl2O4 and
NiCo2O4 [11,85-86,88-89]. While the high temperature reduction peak of Ni/Al2O3
was 828°C when it was calcined at 700°C, it increased to 840°C with the calcination
at 900°C. Similarly, the high temperature reduction peak of Ni-Co/Al2O3 increased
from 842°C to 850°C when the calcination temperature was increased from 700°C
to 900°C. It was concluded that increasing the calcination temperature from 700°C
to 900°C, caused an increase in the reduction temperature of Ni/Al2O3 and Ni-
Co/Al2O3 catalysts.
Figure 29. TPR profiles of Ni/Al2O3, Co/Al2O3 and Ni-Co/Al2O3 calcined at 900°C

59
The effect of Co addition to the Ni based catalyst on the reduction temperature can
be discussed by taking into consideration the shifts in the peak positions. The
position of the peak shifted towards higher temperature from Ni/Al2O3 to Ni-
Co/Al2O3 for both calcination temperatures, from 827°C to 842°C when calcination
was carried out at 700°C and from 840°C to 850°C when calcination was done at
900°C. This suggested the increased metal-support interaction with the addition of
cobalt. Similar trend was also observed for Co-Ni aerogel catalysts having 10 weight
% MgO and 10 weight % active metal with the Cobalt/Nickel ratio of 0:10, 3:7, 5:5,
7:3 and 10:0 where the reduction temperature increased with increasing the cobalt
amount in the catalyst [83]. Contrary to our results, Zhang et al. showed that the
reduction peak maximum of bimetallic nickel-cobalt catalyst occured at a lower
temperature (850°C) than those of monometallic nickel (868°C) and monometallic
cobalt catalyst (896°C) [36]. They attributed this decrease to the creation of nickel
and cobalt oxide species which were more easily approachable on the surface of the
bimetallic combination than those in the bulk structures. Furthermore, they
interpreted the presence of a single reduction peak at lower temperatures was due to
the formation of nickel-cobalt alloy during reduction.
One of the most striking results in TPR profiles was about monometallic Co
catalysts. They did not show any reduction peak. On the other hand, they exhibited
negative peak, beginning to occur at 815°C for Co/Al2O3-I-700 and 798°C for
Co/Al2O3-I-900 catalyst. Firstly, it was thought that this could be attributed to the
oxygen release ability of cobalt oxide. For this reason, thermogravimetric analysis of
Co/Al2O3-I-700 and Co/Al2O3-I-900 was done under inert gas (nitrogen) from room
temperature to 1100°C. As shown in Figure 30 below, there was not seen a
significant weight loss at around 800°C for both of the catalysts. The negative peak
might be ascribed to the evolution of hydrogen, resulting from the desorption of
hydrogen stored by the solid.

60
Figure 30. TGA profiles of Co/Al2O3-I-700
And Co/Al2O3-I-900 under N2 environment
Ewbank et al. [87] reported that the Co/Al2O3 catalyst prepared by dry impregnation
and calcined at 500°C for 3 hours exhibited a reduction peak centered at 850°C
which was ascribed to the reduction of CoAl2O4 species. Kim Nga and Kim Chi [90]
prepared CoAl2O4 spinels by sol-gel method with citric acid. When they calcined the
catalyst at 700°C, the TPR profile exhibited one main peak centered at 870°C which
was ascribed to the reduction of Co2+ ions in the lattice, except for a small peak at
540°C due to reduction of an impurity. Wang and Ruckenstein [88] investigated
the reducibility of γ-Al2O3-supported Co catalysts as a function of calcination
temperature using TPR. While Co3O4 was generated as a major phase at a
calcination temperature of 500°C, Co2AlO4 and CoAl2O4 were formed at 1000°C
calcination temperature. The peak temperatures observed during TPR were as
followings. For Co(O)/γ-Al2O3(700°C), two peaks, at 460°C and 830°C were
identified. For Co(O)/γ-Al2O3(800°C), three peaks at 485°C, 810°C and 1045°C
were noted. For Co(O)/γ-Al2O3(900°C), three peaks, at 480°C, 860°C and >1000°C
were observed.
95
96
97
98
99
100
0 100 200 300 400 500 600 700 800 900 1000 1100
Wei
gh
t lo
ss (
%)
Temperature (oC)
Co/Alumina-700
Co/Alumina-900

61
4.2.2.5 DRIFTS
In order to better comprehend the activation of reactants on the Al2O3 catalysts, CO2
and CH4 adsorption were studied in-situ using DRIFTS.
Prior to sending the reactant gases, the catalysts were reduced by sending 100 torr
H2 four times at 400°C. After the pretreatment, the pressure of CO2 was set to 97.5,
300, 500 torr respectively. DRIFTS spectra were recorded after the admission of
each dose of gas (Figure 31).
Figure 31. DRIFT spectra of CO2 adsorption on
Ni/Al2O3-900 with increasing CO2 dosage
1000150020002500300035004000
Ab
sorb
an
ce
Wavenumber (cm-1)
CO2 ads. (97.5 torr) at RT
CO2 ads. (300 torr) at RT
CO2 ads. (500 torr) at RT

62
When Ni/Al2O3-900 was exposed to CO2 at room temperature, the spectra showed a
strong band at 2344 which was attributed to physically adsorbed CO2 on alumina,
the intensity of which increased with increasing CO2 pressure. This agrees
substantially with the ones already reported in literature. Gregg and Ramsay studied
the infrared spectra of CO2 adsorption on an alumina prepared by calcination of
gibbsite (aluminum trihydrate) [91]. They attributed the band at 2365 cm-1 to the
physically adsorbed CO2. Manchado et al. studied adsorption of CO2 on γ-alumina
by carrying out volumetric and microcalorimetric measurements [92]. They assigned
the bands at 2358 and 2344 cm-1 to weakly adsorbed CO2. Ferreira-Aparicio et al.
attributed the band at 2349 cm-1 to gas phase CO2 upon the adsorption of CO2 on
Ru/Al2O3 at 723 K [48].
The bands seen at 1229, 1444, 1654 were attributed to chemically adsorbed CO2.
These bands are characteristic of the formation of adsorbed bicarbonate, HCO3- and
are attributed to the bending (δ4(COH)), symmetric stretching (ν3(OCO)s) and
asymmetric stretching (ν2(OCO)a) vibrational modes on γ-alumina [93]. Baltrusaitis
et al. studied FTIR spectroscopy of CO2 reaction with surface hydroxyl groups on γ-
Al2O3 [93]. They assigned the bands at 1231, 1438 and 1648 cm-1 to bicarbonate.
The infrared results of CO2 adsorption on γ-Al2O3 exhibited bands at 1652, 1446-
1450, and 1230 cm-l which were attributed to surface bicarbonates by Manchado et
al. [92]. Alumina, being an amphoteric oxide, not only possesses acidic sites but also
basic sites. CO2 adsorption on basic sites usually forms carbonate species, and CO2
adsorption on comparatively acidic sites forms bicarbonate species [94 and
references therein]. In the region 3750-3600 cm-1, bands due to the O-H stretching
mode of alumina hydroxyls are seen [95].
The changes in the adsorption profile of CO2 adsorption on Ni/Al2O3-900 with
increasing temperature at 500 torr was monitored via DRIFTS. As shown in Figure
32, the intensity of physisorbed CO2 decreased dramatically when the temperature
was increased to 200°C and then decreased slightly in intensity with an increasing
temperature up to 400°C.

63
Figure 32. DRIFT spectra of CO2 adsorption on
Ni/Al2O3-900 with increasing temperature at 500 torr
Same CO2 adsorption experiments were carried out with 4-4 wt% Ni-Co/Al2O3-9005
catalyst in order to see the effect of cobalt loading. Same adsorption behaviors were
observed as shown in Figure 33, suggesting that the type of metal loaded on the
catalyst did not show any significant effect on the CO2 adsorption behavior. It was
concluded that CO2 adsorbed mainly on the support of Ni/Al2O3-900 and Ni-
Co/Al2O3-900 catalyts prepared by incipient wetness impregnation.
5 4-4 wt % Ni-Co/Al2O3 bimetallic catalyst was only used in the DRIFTS experiments. The metal
loading for the Al2O3 supported bimetallic catalyst is 8-4 wt % Ni-Co in all other parts.
1000150020002500300035004000
Ab
sorb
an
ce
Wavenumber (cm-1)
CO2 ads. (500 torr) at RT
CO2 ads. (500 torr) at 100oC
CO2 ads. (500 torr) at 200oC
CO2 ads. (500 torr) at 300oC
CO2 ads. (500 torr) at 400oC

64
Figure 33. DRIFT spectra of CO2 adsorption on
Ni-Co/Al2O3-900 with increasing temperature at 500 torr
DRIFT spectra of CO2 adsorption on Ni/Al2O3-900 and Ni-Co/Al2O3-900 at 500 torr
with increasing temperature are given in larger scale in Figure 34 to better
understand the influence of temperature. As shown in the Figure, the intensity of all
bicarbonates (seen between 1228-1655 cm-1) decreased with increasing temperature.
When temperature reached to 400°C, the bands at 1229 cm-1 and 1654 cm-1 had
almost disappeared. On the other hand, the band at 1444 cm-1 was still much in
evidence. This suggests that the bands at 1229 and 1654 cm-1 corresponds to a
weaker form of bonding than the band at 1444 cm-1 which is in agreement with the
literature reported before [91].
1000150020002500300035004000
Ab
sorb
an
ce
Wavenumber (cm-1)
CO2 ads. (500 torr) at RT
CO2 ads. (500 torr) at 100oC
CO2 ads. (500 torr) at 200oC
CO2 ads. (500 torr) at 300oC
CO2 ads. (500 torr) at 400oC
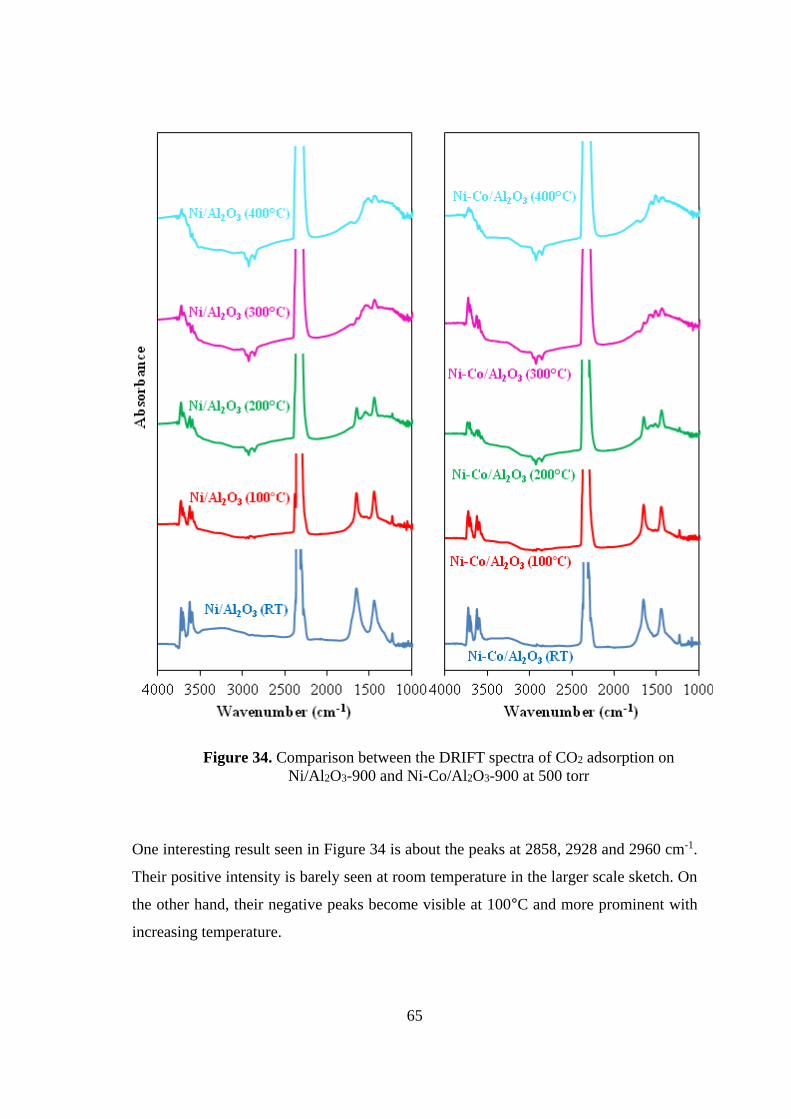
65
Figure 34. Comparison between the DRIFT spectra of CO2 adsorption on
Ni/Al2O3-900 and Ni-Co/Al2O3-900 at 500 torr
One interesting result seen in Figure 34 is about the peaks at 2858, 2928 and 2960 cm-1.
Their positive intensity is barely seen at room temperature in the larger scale sketch. On
the other hand, their negative peaks become visible at 100°C and more prominent with
increasing temperature.

66
Rege and Yang studied the adsorption of H2O on γ-Al2O3 [96]. They observed a
broad band in the region of 2800–3500 cm−1 and assigned as hydrogen-bonded OH
stretching vibrations. The nature of isolated OH groups on low index planes of
transition aluminas has been investigated by infrared spectroscopy in the past [97].
Casarin et al. [97] classified them as the followings by utilizing these studies: “(i)
OH groups coordinated to a single tetrahedral Al3+ site; (ii) OH groups coordinated
to a single octahedral Al3+ site; (iii) OH groups bridging a tetrahedral and an
octahedral site; (iv) OH groups bridging two octahedral sites; (v) capped OH groups,
that is, contemporary bridging three octahedral sites.” By taking into consideration
these studies, the peaks seen at 2858, 2928 and 2960 cm-1 were also attributed to OH
stretching vibrations of Al2O3. Since there are different kinds of surface OH groups,
their vibrations can also be seen at different wavenumbers.
Figure 35. DRIFT spectra of CH4 adsorption on Ni/Al2O3-900
with increasing temperature at 500 torr
1000150020002500300035004000
Ab
sorb
an
ce
Wavenumber (cm-1)
100oC
RT
200oC
300oC
400oC

67
DRIFTS study of CH4 adsorption on Ni/Al2O3-900 resulted in the spectra belonging
to only gas phase CH4 contribution centered at 1305 and 3015 cm-1 (Figure 35)
[48,98]. This was due to the fact that the catalyst could not be reduced at 400°C.
CH4 can be activated as long as the active component is in metallic state. Takenaka
et al. made a comparison between the performances of nickel catalysts supported on
various supports, such as SiO2, TiO2, MgO/SiO2, MgO, SiO2/Al2O3, Al2O3 and
graphite in methane catalytic decomposition [99]. While SiO2, TiO2 and graphite
supported catalysts exhibited high activity and stability, Al2O3, MgO and SiO2-MgO
supported ones were not active under the same conditions. They proved further by
means of XRD and Ni K-edge XANES/EXAFS that nickel was present in metallic
state in the active catalysts, while it formed oxide compounds with the components
of the support in the inactive catalysts.
4.2.2.6 Microcalorimetry
The energetics of carbon dioxide adsorption on commercial Al2O3, Al2O3-900,
Ni/Al2O3-900 and Ni-Co/Al2O3-900 was studied by means of microcalorimetry. As
shown in Figure 36, CO2 was strongly adsorbed on all of the samples. The
adsorption characteristics were not influenced by the metals indicating that CO2
adsorbed on alumina. Differential heat of CO2 adsorption displayed a sharp decrease
which could be ascribed to the saturation of high energy sites. Further differential
heat of carbon dioxide was observed until reaching the saturation coverage. Rosynek
assigned the surface of γ-Al2O3 to be heterogeneous in its interaction with CO2
which was shown by a decline in its heat of adsorption with increasing coverage and
by conformity of CO2 adsorption isotherms to the Freundlich equation at low
coverages [100]. The carbon dioxide adsorption capacity of commercial alumina
was higher than that of Al2O3-900, Ni/Al2O3-900 and Ni-Co/Al2O3-900 as seen in
Figure 36 and 37. High temperature heat treatment resulted in a decrease in carbon
dioxide adsorption capacity.

68
Figure 36. Differential heat of CO2 adsorption on commercial Al2O3,
Al2O3-900, Ni/Al2O3-900 and Ni-Co/Al2O3-900
Figure 37. Coverage as a function of pressure for CO2 adsorption on
commercial Al2O3, Al2O3-900, Ni/Al2O3-900 and Ni-Co/Al2O3-900
0
150
300
450
0 5 10 15 20 25 30 35
Dif
fere
nti
al
hea
t of
ad
sorp
tion
(kJ/m
ol)
Amount of CO2 adsorbed (μmol/g catalyst)
commercial Alumina
Ni/Alumina-900
Ni-Co/Alumina-900
pure Alumina-900
0
5
10
15
20
25
30
35
0.0 0.5 1.0 1.5 2.0
Cover
age
(μm
ol
of
gas
ad
sorb
ed/g
cata
lyst
)
Pressure (torr)
commercial Alumina
Ni/Alumina-900
Ni-Co/Alumina-900
pure Alumina-900

69
4.2.3 Dry reforming reaction results
Dry reforming of methane was performed with the synthesized catalysts as described
in Section 3.1.1. CO2 conversion, CH4 conversion, H2 yield and CO yield were
examined by using the following equations.
CH4 conversion: XCH4=
CH4in- CH4out
CH4in
(19)
CO2 conversion: XCO2 =
CO2 in – CO2 out
CO2 in
(20)
H2 yield: YH2
= H2out
2 x CH4in
(21)
CO yield: YCO
= COout
CO2in + CH4in
ç
(22)
Comparison of CH4 and CO2 conversion over the catalysts calcined at 700°C are
given in Figure 38. While Ni/Al2O3-I-700-pellet and Ni-Co/Al2O3-I-700-pellet
provided comparable activities during the first 90 minutes of the reaction, Ni-
Co/Al2O3-I-700-pellet started to lose its activity after then. On the other hand,
Ni/Al2O3-I-700-pellet preserved its stability during the five hour reaction period.
The activity of Co/Al2O3-I-700-pellet was lower than the other two catalysts.
Although a reduction peak for Co/Al2O3-I-700 could not be seen in TPR profile, it
showed quite a high activity and preserved its stability. As remembered, there was a
negative baseline shift in TPR profiles of all the samples investigated. There could
have been a small H2 consumption peak for Co/Al2O3-I-700 which could be
suppressed due to the negative baseline shift.

70
Figure 38. Comparison of CH4 and CO2 conversion versus time on stream over the
catalysts calcined at 700oC, Ni/Al2O3-I-700-pellet , Co/Al2O3-I-700-pellet ,
Ni-Co/Al2O3-I-700-pellet , (Reaction conditions: 700oC, 1 atm)
0.0
0.2
0.4
0.6
0.8
1.0
0 50 100 150 200 250 300
CH
4co
nver
sio
n
Time (min)
0.0
0.2
0.4
0.6
0.8
1.0
0 50 100 150 200 250 300
CO
2co
nver
sion
Time (min)
0.0
0.2
0.4
0.6
0.8
1.0
0 50 100 150 200 250 300
CH
4co
nver
sio
n
Time (min)
0.0
0.2
0.4
0.6
0.8
1.0
0 50 100 150 200 250 300
CO
2co
nver
sio
n
Time (min)
0.0
0.2
0.4
0.6
0.8
1.0
0 50 100 150 200 250 300
CH
4co
nver
sio
n
Time (min)
0.0
0.2
0.4
0.6
0.8
1.0
0 50 100 150 200 250 300
CO
2co
nver
sion
Time (min)

71
Figure 39. Comparison of H2 and CO yield versus time on stream over the catalysts
calcined at 700oC, Ni/Al2O3-I-700-pellet , Co/Al2O3-I-700-pellet ,
Ni-Co/Al2O3-I-700-pellet , (Reaction conditions: 700oC, 1 atm)
0.0
0.2
0.4
0.6
0.8
1.0
0 50 100 150 200 250 300
H2
yie
ld
Time (min)
0.0
0.2
0.4
0.6
0.8
1.0
0 50 100 150 200 250 300
CO
yie
ld
Time (min)
0.0
0.2
0.4
0.6
0.8
1.0
0 50 100 150 200 250 300
H2
yie
ld
Time (min)
0.0
0.2
0.4
0.6
0.8
1.0
0 50 100 150 200 250 300
CO
yie
ld
Time (min)
0.0
0.2
0.4
0.6
0.8
1.0
0 50 100 150 200 250 300
H2
yie
ld
Time (min)
0.0
0.2
0.4
0.6
0.8
1.0
0 50 100 150 200 250 300
CO
yie
ld
Time (min)

72
Figure 40. Comparison of H2/CO ratio versus time on stream over the catalysts
calcined at 700oC, Ni/Al2O3-I-700-pellet , Co/Al2O3-I-700-pellet ,
Ni-Co/Al2O3-I-700-pellet , (Reaction conditions: 700oC, 1 atm)
The time dependent H2 and CO yield of the catalysts calcined at 700°C are given in
Figure 39. Carbon monoxide yield was higher than hydrogen yield for all the
catalysts because of the RWGS reaction. While the H2 yield was comparable for
Ni/Al2O3-I-700-pellet and Ni-Co/Al2O3-I-700-pellet for the first 200 minutes of the
reaction, the latter started to lose performance after then. In terms of CO yield,
Ni/Al2O3-I-700-pellet showed the best performance and stability, while Ni-
Co/Al2O3-I-700-pellet exhibited a diminishing performance with some deviations.
As in the case of conversions, Co/Al2O3-I-700-pellet yielded lowest amount of H2
and CO.
0.0
0.2
0.4
0.6
0.8
1.0
0 50 100 150 200 250 300
H2/C
O
Time (min)
0.0
0.2
0.4
0.6
0.8
1.0
0 50 100 150 200 250 300
H2/C
O
Time (min)
0.0
0.2
0.4
0.6
0.8
1.0
0 50 100 150 200 250 300
H2/C
O
Time (min)

73
As for H2/CO ratio Ni/Al2O3-I-700-pellet exhibited the most stable performance. Ni-
Co/Al2O3-I-700-pellet also exhibited comparable behavior with the nickel loaded
catalyst except for the some higher points which resulted from the deviations seen in
the CO yield profile. H2/CO ratio was the lowest for Co/Al2O3-I-700-pellet as seen
in Figure 40. While H2/CO ratio was higher than 0.8 for Ni/Al2O3-I-700-pellet and
Ni-Co/Al2O3-I-700-pellet, it was lower than 0.8 for Co/Al2O3-I-700-pellet catalyst.
In order to understand the effect of calcination temperature, performances of the
catalysts calcined at 900°C were also investigated. The time dependent CH4 and
CO2 conversion over the catalysts calcined at 900°C are given in Figure 41.
Ni/Al2O3-I-900-pellet exhibited the best performance in terms of CH4 and CO2
conversion amongst the catalysts calcined at 900°C. While Ni-Co/Al2O3-I-900-pellet
showed almost the same stability with Ni/Al2O3-I-900-pellet during the first 70
minute of reaction, it exhibited a decrease after then, but preserved its stability up to
the end of the reaction. Co/Al2O3-I-900-pellet was almost inactive in carbon dioxide
reforming of methane reaction and the production of H2 and CO was insignificant.
The reducibility of the γ-Al2O3-supported Co catalysts decreased with increasing
calcination temperature due to the formation of the less reducible Co2AlO4 and
CoAl2O4 [88]. It was concluded that Co/Al2O3-I-900 was mostly in the form of
Co2AlO4 and CoAl2O4 which could not be reduced at the reduction temperature and
hence did not show activity in CO2 reforming of CH4 reaction. CO yield was higher
than that of H2 as in the case of 700°C calcination temperature which was again due
to the simultaneous RWGS reaction (Figure 42). As a result H2/CO ratio was below
one for Ni/Al2O3-I-900 and Ni-Co/Al2O3-I-900 (Figure 43). Except for Co/Al2O3-I,
Ni/Al2O3-I and Ni-Co/Al2O3-I catalysts provided comparable activities during the
entire period of study irrespective of the calcination temperature.

74
Figure 41. Comparison of CH4 and CO2 conversion versus time on stream over the
catalysts calcined at 900oC, Ni/Al2O3-I-900-pellet , Co/Al2O3-I-900-pellet ,
Ni-Co/Al2O3-I-900-pellet , (Reaction conditions: 700oC, 1 atm)
0.0
0.2
0.4
0.6
0.8
1.0
0 50 100 150 200 250 300
CH
4co
nver
sio
n
Time (min)
0.0
0.2
0.4
0.6
0.8
1.0
0 50 100 150 200 250 300
CO
2co
nver
sion
Time (min)
0.0
0.2
0.4
0.6
0.8
1.0
0 50 100 150 200 250 300
CH
4co
nver
sio
n
Time (min)
0.0
0.2
0.4
0.6
0.8
1.0
0 50 100 150 200 250 300
CO
2co
nver
sion
Time (min)
0.0
0.2
0.4
0.6
0.8
1.0
0 50 100 150 200 250 300
CH
4co
nver
sio
n
Time (min)
0.0
0.2
0.4
0.6
0.8
1.0
0 50 100 150 200 250 300
CO
2co
nver
sion
Time (min)

75
Figure 42. Comparison of H2 and CO yield versus time on stream over Ni/Al2O3-I-
900- pellet and Ni-Co/Al2O3-I-900-pellet , (Reaction conditions: 700oC, 1 atm)
0.0
0.2
0.4
0.6
0.8
1.0
0 50 100 150 200 250 300
H2
yie
ld
Time (min)
0.0
0.2
0.4
0.6
0.8
1.0
0 50 100 150 200 250 300
CO
yie
ld
Time (min)
0.0
0.2
0.4
0.6
0.8
1.0
0 50 100 150 200 250 300
H2
yie
ld
Time (min)
0.0
0.2
0.4
0.6
0.8
1.0
0 50 100 150 200 250 300
CO
yie
ld
Time (min)

76
Figure 43. Comparison of H2/CO ratio versus time on stream over Ni/Al2O3-I-700-
pellet and Ni-Co/Al2O3-I-700-pellet (Reaction conditions: 700oC, 1 atm)
In addition to the pellet form, the catalysts in powder form were also investigated in
dry reforming of methane reaction. Powder form of the catalysts calcined at 900°C
exhibited very high CH4 and CO2 conversion (Figure 44). Accordingly the H2 yield
and CO yield were very high, being the CO amount slightly higher than H2 amount
due to the RWGS reaction (Figure 45 and Figure 46). Although the catalysts were in
powder form, no instability or clogging were observed for the catalysts calcined at
900°C.
0.0
0.2
0.4
0.6
0.8
1.0
0 50 100 150 200 250 300
H2/C
O
Time (min)
0.0
0.2
0.4
0.6
0.8
1.0
0 50 100 150 200 250 300
H2/C
O
Time (min)

77
Figure 44. Comparison of CH4 and CO2 conversion versus time on
stream over the catalysts calcined at 900oC, Ni/Al2O3-I-900-powder ,
Ni-Co/Al2O3-I-900-powder , (Reaction conditions: 700oC, 1 atm)
0.0
0.2
0.4
0.6
0.8
1.0
0 50 100 150 200 250 300
CH
4co
nver
sion
Time (min)
0.0
0.2
0.4
0.6
0.8
1.0
0 50 100 150 200 250 300
CO
2co
nver
sio
n
Time (min)
0.0
0.2
0.4
0.6
0.8
1.0
0 50 100 150 200 250 300
CH
4co
nver
sion
Time (min)
0.0
0.2
0.4
0.6
0.8
1.0
0 50 100 150 200 250 300
CO
2co
nver
sio
n
Time (min)

78
Figure 45. Comparison of H2 and CO yield versus time on stream over
Ni/Al2O3-I-900-powder , Ni-Co/Al2O3-I-900-powder ,
(Reaction conditions: 700oC, 1 atm)
0.0
0.2
0.4
0.6
0.8
1.0
0 50 100 150 200 250 300
H2
yie
ld
Time (min)
0.0
0.2
0.4
0.6
0.8
1.0
0 50 100 150 200 250 300
CO
yie
ld
Time (min)
0.0
0.2
0.4
0.6
0.8
1.0
0 50 100 150 200 250 300
H2
yie
ld
Time (min)
0.0
0.2
0.4
0.6
0.8
1.0
0 50 100 150 200 250 300
CO
yie
ld
Time (min)

79
Figure 46. Comparison of H2/CO ratio versus time on stream over Ni/Al2O3-I-900-
powder , Ni-Co/Al2O3-I-900-powder , (Reaction conditions: 700oC, 1 atm)
In addition to the powder form of the catalysts calcined at 900°C, the powder
catalysts calcined at 700°C were also investigated in carbon dioxide reforming of
methane reaction. Ni/Al2O3-I-700-powder exhibited very high and stable
performance during the entire period of the study which was almost same with the
corresponding one in pellet form (Figure 38 and Figure 47).
Although Ni-Co/Al2O3-I-700-powder exhibited very high conversion in the first half
period of the study, clogging occured and a decrese in the flow rates of the reactants
were observed after 150 min. The CH4 and CO2 conversion could no be calculated
after the onset of clogging, because they were no longer the specified inlet flow
rates.
As remembered from Figure 44, both Ni/Al2O3-I and Ni-Co/Al2O3-I exhibited stable
behavior in powder form when they were calcined at 900°C. Figure 47 proved that
while Ni/Al2O3-I again preserved its stability during the entire period of reaction,
Ni-Co/Al2O3-I losed its stability when it was calcined at 700°C.
0.0
0.2
0.4
0.6
0.8
1.0
0 50 100 150 200 250 300
H2/C
O
Time (min)
0.0
0.2
0.4
0.6
0.8
1.0
0 50 100 150 200 250 300
H2/C
O
Time (min)
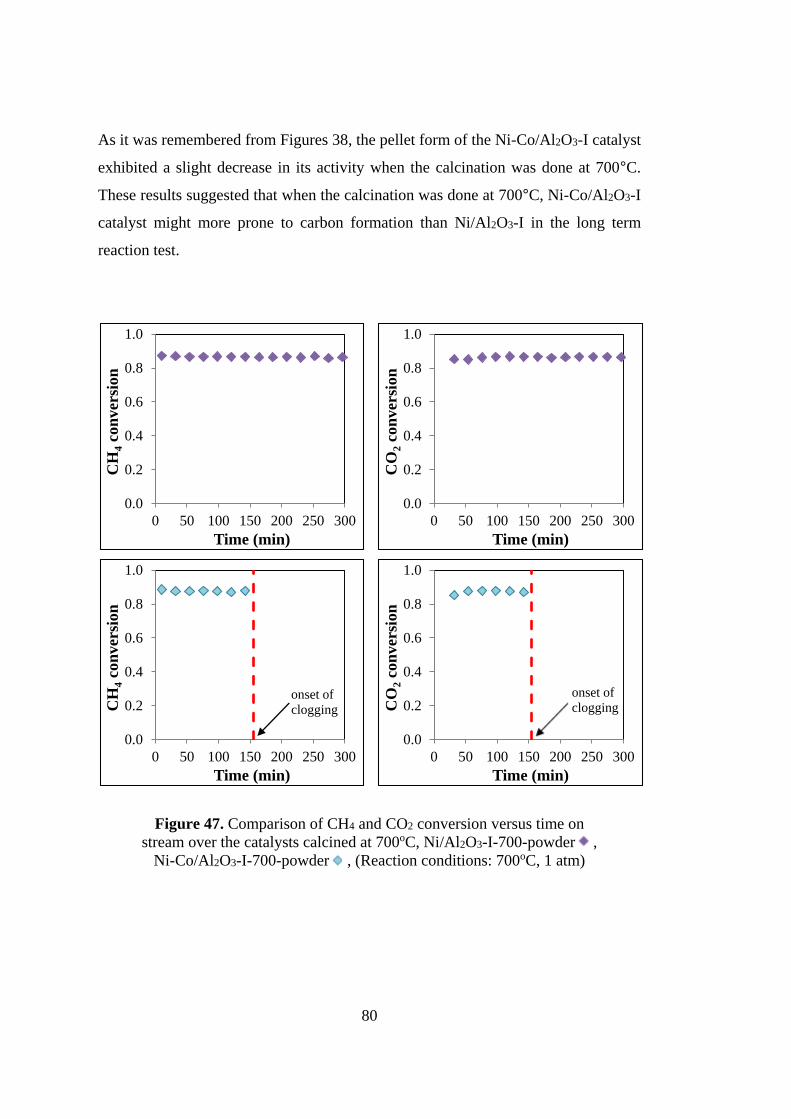
80
As it was remembered from Figures 38, the pellet form of the Ni-Co/Al2O3-I catalyst
exhibited a slight decrease in its activity when the calcination was done at 700°C.
These results suggested that when the calcination was done at 700°C, Ni-Co/Al2O3-I
catalyst might more prone to carbon formation than Ni/Al2O3-I in the long term
reaction test.
Figure 47. Comparison of CH4 and CO2 conversion versus time on
stream over the catalysts calcined at 700oC, Ni/Al2O3-I-700-powder ,
Ni-Co/Al2O3-I-700-powder , (Reaction conditions: 700oC, 1 atm)
0.0
0.2
0.4
0.6
0.8
1.0
0 50 100 150 200 250 300
CH
4co
nver
sio
n
Time (min)
0.0
0.2
0.4
0.6
0.8
1.0
0 50 100 150 200 250 300
CO
2co
nver
sion
Time (min)
0.0
0.2
0.4
0.6
0.8
1.0
0 50 100 150 200 250 300
CH
4co
nver
sio
n
Time (min)
onset of
clogging
0.0
0.2
0.4
0.6
0.8
1.0
0 50 100 150 200 250 300
CO
2co
nver
sion
Time (min)
onset of
clogging

81
Figure 48. Comparison of H2 and CO yield versus time on stream over the catalysts
calcined at 700oC, Ni/Al2O3-I-700-powder , Ni-Co/Al2O3-I-700-powder ,
(Reaction conditions: 700oC, 1 atm)
Dry reforming of methane reaction is a highly endothermic reaction. Some reactions
were also carried out at 600°C to see the effect of temperature. The conversion
decreased with a decrease in temperature over Ni/Al2O3-I-900-powder and Ni-
Co/Al2O3-I-900-powder as expected (Figure 49). It is also important to mention here
that the repeat experiments deviated by ±10 % conversion at 600oC reaction
temperature This is interpreted as the large sensitivity to minor deviations in reaction
or pretreatment conditions. As in the case of conversion, H2 yield and CO yield were
also decreased with decreasing temperature (Figure 50). H2/CO ratio was below one
at 600°C again due to the RWGS reaction (Figure 51).
0.0
0.2
0.4
0.6
0.8
1.0
0 50 100 150 200 250 300
H2
yie
ld
Time (min)
0.0
0.2
0.4
0.6
0.8
1.0
0 50 100 150 200 250 300
CO
yie
ld
Time (min)
0.0
0.2
0.4
0.6
0.8
1.0
0 50 100 150 200 250 300
H2
yie
ld
Time (min)
onset of
clogging
0.0
0.2
0.4
0.6
0.8
1.0
0 50 100 150 200 250 300
CO
yie
ld
Time (min)
onset of
clogging

82
Figure 49. Comparison of CH4 and CO2 conversion versus time on
stream over the catalysts calcined at 900°C, Ni/Al2O3-I-900-powder ,
Ni-Co/Al2O3-I-900-powder , (Reaction conditions: 600°C, 1 atm)
0.0
0.2
0.4
0.6
0.8
1.0
0 50 100 150 200 250 300
CH
4co
nver
sio
n
Time (min)
0.0
0.2
0.4
0.6
0.8
1.0
0 50 100 150 200 250 300
CO
2co
nver
sion
Time (min)
0.0
0.2
0.4
0.6
0.8
1.0
0 50 100 150 200 250 300
CH
4co
nver
sio
n
Time (min)
0.0
0.2
0.4
0.6
0.8
1.0
0 50 100 150 200 250 300
CO
2co
nver
sion
Time (min)

83
Figure 50. Comparison of H2 and CO yield versus time on stream over the catalysts
calcined at 900°C, Ni/Al2O3-I-900-powder , Ni-Co/Al2O3-I-900-powder ,
(Reaction conditions: 600°C, 1 atm)
0.0
0.2
0.4
0.6
0.8
1.0
0 50 100 150 200 250 300
H2
yie
ld
Time (min)
0.0
0.2
0.4
0.6
0.8
1.0
0 50 100 150 200 250 300
CO
yie
ld
Time (min)
0.0
0.2
0.4
0.6
0.8
1.0
0 50 100 150 200 250 300
H2
yie
ld
Time (min)
0.0
0.2
0.4
0.6
0.8
1.0
0 50 100 150 200 250 300
CO
yie
ld
Time (min)

84
Figure 51. Comparison of H2/CO ratio versus time on stream over Ni/Al2O3-I-900-
powder , Ni-Co/Al2O3-I-900-powder , (Reaction conditions: 600°C, 1 atm)
4.2.4 Characterization of spent catalysts
4.2.4.1 Thermal Gravimetric Analysis (TGA)
The amount of carbon deposited on the pellet-samples after being used in CO2
reforming of CH4 for five hour reaction period was determined by TGA. More
carbon was deposited when the calcination was done at 700°C.
Both Ni and Ni-Co catalysts had almost same amount of carbon deposition when
they were calcined at 900°C. On the other hand, much higher amount of coke was
deposited on Ni-Co than Ni catalyst when they were calcined at 700°C.
0.0
0.2
0.4
0.6
0.8
1.0
0 50 100 150 200 250 300
H2/C
O
Time (min)
0.0
0.2
0.4
0.6
0.8
1.0
0 50 100 150 200 250 300
H2/C
O
Time (min)

85
Figure 52. TGA curves in air atmosphere for Ni/Al2O3-I-700-pellet,
Co/Al2O3-I-700-pellet and Ni-Co/Al2O3-I-700-pellet after being
used in reaction at 700°C for 5 hours
Figure 53. TGA curves in air atmosphere for Ni/Al2O3-I-900-pellet,
Co/Al2O3-I-900-pellet and Ni-Co/Al2O3-I-900-pellet after being
used in reaction at 700°C for 5 hours
85
90
95
100
0 100 200 300 400 500 600 700 800 900
Wei
gh
t L
oss
(%
)
Temperature (oC)
Ni/Al2O3-I-700-pellet
Co/Al2O3-I-700-pellet
Ni-Co/Al2O3-I-700-pellet
95
96
97
98
99
100
0 100 200 300 400 500 600 700 800 900
Wei
gh
t L
oss
(%
)
Temperature (oC)
Ni/Al2O3-I-900-pellet
Co/Al2O3-I-900-pellet
Ni-Co/Al2O3-I-900-pellet

86
4.2.4.2 High Contrast Transmission Electron Microscopy (HCTEM)
The morphology of carbon formed on the surface of the catalysts after five hour
reaction at 600°C was investigated by CTEM. The electron micrographs of carbon
deposits over Ni/Al2O3-I-900 powder are shown in Figure 54. Octopus carbon
structure, where several fibers are growing from one nickel crystal are seen on large
nickel particles. Although very scarce, octopus type carbon formation was reported
in literature before. Bernardo et al. [101] reported that carbon formation on Ni-
Cu/SiO2 catalyst during methane decomposition was mostly in the form of whisker.
Copper content did not alter the form of carbon up to a threshold value,
corresponded to 80 %. On the other hand, the carbon deposited on 80% copper
sample showed an unusual structure having a variety of amorphous carbon filaments
connected to the identical metal particle which were called as octopus carbon.
Rostrup-Nielsen [102] also observed octopus carbon on Ni catalysts with high
sulphur coverage after being exposed to CH4/H2 mixtures. Ermakova [103] reported
octopus carbon nanotube growth formed on Fe/Al2O3 catalyst upon exposure to high
purity methane. Pham-Huu et al. [104] observed octopus-like formation of carbon
nanofibers over Ni catalyst supported on graphite microfibers upon decomposition
of ethane/hydrogen mixture. Rass-Hansen et al. [105] observed that large particles
around 100 nm in K-doped Ni/MgAl2O4 catalyst resulted in octopus carbon structure
during ethanol steam reforming. In addition to the octopus type of carbon,
filamentous carbon in the form of carbon nanotubes are seen on the small nickel
particles (Figure 54).
Figure 55 shows the filamentous carbons of nanotubes and nanofibers with varying
diameters over Ni-Co/Al2O3 catalyst. No octopus carbon was observed over this
catalyst. The surface properties and thus the catalytic performance of bimetallic
catalysts can be explained in terms of a change of the surface ensemble structures
[106]. The presence of cobalt may suppress octopus carbon growth by breaking
nickel ensembles.
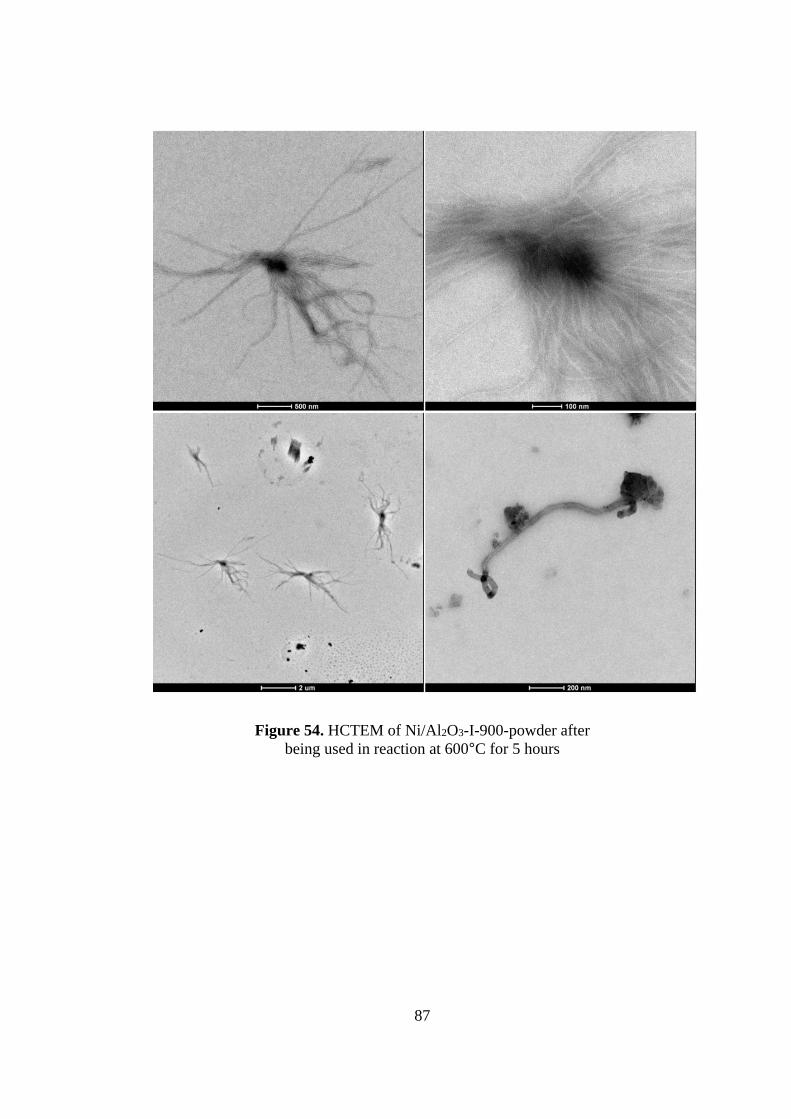
87
Figure 54. HCTEM of Ni/Al2O3-I-900-powder after
being used in reaction at 600°C for 5 hours

88
Figure 55. HCTEM of Ni-Co/Al2O3-I-900-powder after
being used in reaction at 600°C for 5 hours

89
4.2.5 Source of Coke Determination Reactions and Characterization Results
As mentioned before, the catalyst deactivation during dry reforming of methane is
caused by carbon formation [1,28,29], sintering at high temperature [30,31] and
oxidation of metallic sites [32,33]. Although in literature it is agreed that the primary
cause of catalyst deactivation is carbon formation, there are disagreements existing
on the origin of coke which can come from CH4 and CO2.
The clarification of this issue is necessary in terms of understanding the mechanism
of carbon formation with the aim of reactor design and catalyst design which can
prevent the accumulation of coke. For this aim, reaction tests were carried out with
13CO2 and 12CH4 over Ni/Al2O3-I-powder catalysts and the used catalyst was
characterized by 13C solid state NMR spectrometer. To the best of our knowledge,
there has been no study on the characterization of the used catalyst by 13C solid state
NMR for the determination of coke origin in dry reforming of methane reaction.
Since 13CO2 was limited, reaction conditions were first prepared with 12CO2 and
12CH4 to deposit carbon in short time. Before the reaction, the samples were reduced
with flowing 50 sccm H2/Argon (2/3) mixture at 700°C for 1h. The weight gain of
the catalysts after 10 minutes reaction at 600°C under 10 sccm CO2 and 10 sccm
CH4 diluted in 30 sccm Ar was determined as 1.9% for Ni/Al2O3-I-900-powder and
2.6% for Ni/Al2O3-I-700-powder. Since these quantities are low, it is difficult to
detect them in NMR. For this reason it was decided to change the flow rate of the
reactants which could result in considerable amount of coke in a small period of
reaction. This time the reaction was carried out at 600°C for 10 minutes under 30
sccm CO2 and 30 sccm CH4 without using diluting gas. The weight gain of the
Al2O3 supported catalysts after 10 minutes reactions at 600°C under 30 sccm CO2
and 30 sccm CH4 without using diluting gas are given in Table 9. It was determined
to continue with the catalysts calcined at 700°C in coke determination reactions due
to their higher carbon depositing tendency.

90
Table 9. The weight gain of Al2O3 supported powder catalysts after being used
in the reaction at 600°C for 10 minutes under 30 sccm CO2 and 30 sccm CH4
Catalyst Weight gain (%)
Ni/Al2O3-I-900-powder 3.5
Ni-Co/Al2O3-I-900-powder 1.1
Ni/Al2O3-I-700-powder 11.7
Ni-Co/Al2O3-I-700-powder 8.4
Reaction tests were done over Ni/Al2O3-I-700-powder catalyst with varying
CH4/CO2 ratios so as to determine the source of carbon. The carbon amount
increased with increasing CH4 ratio as seen in Figure 56, indicating that CH4 could
be the main source of carbon formation in dry reforming of methane reaction.
Figure 56. The effect of CH4/CO2 ratio in the input stream on
a) amount of carbon deposition b) type of carbon deposition
over Ni/Al2O3-700-powder after being used in the reaction at 600°C for 10 minutes
70
75
80
85
90
95
100
0 100 200 300 400 500 600 700 800 900
Wei
gh
t L
oss
(%
)
Temperature (oC)
CH4/CO2=10/50
CH4/CO2=20/40
CH4/CO2=30/30
CH4/CO2=40/20
CH4/CO2=50/10
0 100 200 300 400 500 600 700 800 900
Der
ivati
ve
Wei
gh
t L
oss
(m
g/o
C)
Temperature (oC)
CH4/CO2=10/50
CH4/CO2=20/40
CH4/CO2=30/30
CH4/CO2=40/20
CH4/CO2=50/10

91
The stoichiometry of dry reforming reaction is 1 to 1 for CO2 and CH4. A high
CH4/CO2 ratio in the feed mixture is regarded as a harsh state for this reaction.
When this ratio is higher than 1.0, CH4 becomes excess. If the reaction mixture does
not have sufficient oxidant (CO2), the produced carbon will deposit on the catalyst
surface and lead to deactivation. As a result, the higher the methane/carbon dioxide
ratio, the harsher the reaction conditions for dry reforming [72]. Yang and Papp
studied dry reforming of CH4 at 800°C over Pt/MgO with a feed ratio of CH4/CO2
1.0 and 2.0. Both the ESCA and the CO2-TPSR results of the spent catalysts
indicated that more carbon was formed on the catalyst having the higher CH4/CO2
ratio [72].
Amongst the potential coke depositing reactions, methane decomposition and carbon
monoxide disproportionation have generally been regarded as carbon deposition
reactions in literature. Methane decomposition is endothermic whereas carbon
monoxide disproportionation is exothermic. In the review article of Papadopoulou
[1], CH4 decomposition is reported to be predominating at temperatures higher than
700°C and CO disproportionation at temperatures lower than 600°C. The extent of
their contribution to carbon formation depends on operating conditions and catalyst
composition [1].
York et al. [2] studied the rate of carbon deposition from pure methane and carbon
monoxide over a supported nickel catalyst at different temperatures, showing that
both CO disproportionation and CH4 decomposition are catalysed by nickel, but to
changing extents depending on the reaction temperature.
Although the TGA results give the impression that CH4 decomposition is the
primary reason of carbon formation, the thermodynamics indicate that CO
disproportionation should also have an impact on carbon deposition at 600°C. The
methane conversion and H2/CO ratio were also calculated at the fifth minute of
reaction as shown in Figure 57.

92
Figure 57. Effect of the CH4/CO2 ratio in the input stream on
a) CH4 conversion and b) H2/CO ratio
It was observed that while methane conversion decreased steeply at CH4/CO2<1, it
did not change considerably at CH4/CO2>1 where CO2 is the limiting reactant. If
CH4 was the sole source of carbon by its decomposition, the conversion of CH4
would have increased steadily, but it did not. This gave the clue that CH4 was not
only component responsible for carbon formation.
In their thermodynamic equilibrium study on the multi-reaction system for CO2
reforming of CH4 regarding the reactions taking place in carbon formation based on
direct minimization of Gibbs free energy method, Nikoo and Amin [107] showed
that CH4 conversion increases with CO2/CH4 ratio suggesting that CO2 gas being a
soft oxidant has a beneficial influence on CH4 conversion in the temperature range
of interest. This beneficial influence is more noticeable at temperatures lower than
700°C; hence, addition of more CO2 to CH4 results in a higher activity for CH4
molecules.
y = 0.56x-0.21
R² = 0.87
0.0
0.2
0.4
0.6
0.8
1.0
0 1 2 3 4 5 6
CH
4co
nv
ersi
on
CH4/CO2 inlet
y = 0.31x + 0.40
R² = 1.00
0.0
0.5
1.0
1.5
2.0
0 1 2 3 4 5 6
H2
/CO
CH4/CO2 inlet

93
Braga et al. [108] investigated the effect of CH4/CO2 molar ratio (0.25, 2.125 and
4.0) on dry reforming of methane by using Ni/SiO2. While CH4 conversion
decreased with an increase in CH4/CO2 ratio at 700°C and 800°C, a maximum was
observed at a CH4/CO2 ratio of 2.125 at 600°C reaction temperature.
Although TGA results showed that the carbon deposition increased with an increase
in CH4, the reaction tests were carried out over Ni/Al2O3-700 with 13CO2 with the
idea of CO2 could also have a role in coke formation by taking into consideration the
CH4 conversion and the thermodynamics. The deposited coke was characterized by
solid state NMR in UC Berkeley, Department of Chemical and Biomolecular
Engineering. As shown in Figure 58, the deposited coke not only comes from CH4,
but CO2 has also a significant role in carbon formation.
13C ppm
Figure 58. 13C NMR spectra of the coke deposited on Ni/Al2O3-I-700-powder
after being used in the reaction at 600°C for 10 minutes under
30 sccm 13CO2 and 30 sccm CH4

94
Our conclusion is consistent with the deductions made by Tsipouriari and Verykios
[5], Lemonideu et al. [74], Kroll et. al. [75], and McFarlane et al. [76] in terms of
showing that both reactants take place in carbon formation during dry reforming of
methane. Further NMR studies are in progress to exhibit the quantitative role of CO2
in coke deposition over Ni/Al2O3-I-700-powder catalysts which were used in dry
reforming reaction with varying CH4/13CO2 ratios.
The effect of CH4/CO2 ratio on the morphology of the spent catalysts was
investigated by HCTEM. Figure 59, 60 and 61 shows the HCTEM of Ni/Al2O3-700
catalyst after being used in the reaction at 600°C for 10 minutes with 13CO2/12CH4
ratios of 10/50, 30/30 and 50/10 respectively. Besides scarce amount of long straight
filaments with elongated nickel particles inside, most of the deposited carbon is in
the form of short and thick filaments (thicker-walled tubes with narrow inner
channels) which are rolled up into shapeless tangles in Figure 59 where the CH4
ratio was highest. Carbon filaments entangled one another are again seen in Figure
60 but the intensity of which decreased compared to the ones seen in Figure 59. No
carbon filaments were observed over the sample treated with the lowest CH4 ratio
(Figure 61). Some carbon in the form of encapsulating type was detected in that
case.

95
Figure 59. HCTEM of Ni/Al2O3-I-700-powder catalyst after being used
in the reaction at 600°C for 10 minutes with 13CO2/12CH4 ratio of 10/50
As remembered, the electron micrographs of carbon deposits obtained after the
reaction at 600°C for 5 hours exhibited octopus carbon structure. On the other hand,
no octopus carbon was observed on any of the samples after 10 minutes reaction.

96
Figure 60. HCTEM of Ni/Al2O3-I-700-powder catalyst after being used
in the reaction at 600°C for 10 minutes with 13CO2/12CH4 ratio of 30/30

97
Figure 61. HCTEM of Ni/Al2O3-I-700-powder catalyst after being used
in the reaction at 600°C for 10 minutes with 13CO2/12CH4 ratio of 50/10
4.3 Conclusions
Al2O3 supported Ni, Co and Ni-Co catalysts were synthesized via incipient wetness
impregnation method for dry reforming of methane reaction. To see the influence of
calcination temperature, the catalysts were prepared by calcining at two different
temperatures, 700°C and 900°C. Addition of Co to the Ni-based catalyst resulted in
the increased metal-support interaction.
In situ-DRIFTS study of CO2 adsorption on the catalysts resulted in bicarbonate
formation and were assigned to the bending, symmetric stretching and asymmetric
stretching vibrational modes on γ-alumina. The energetics of carbon dioxide
adsorption was studied by means of microcalorimetry. The adsorption characteristics
were not influenced by the metals indicating that CO2 adsorbed on alumina.
Catalytic tests were conducted at 600°C and 700°C. The activity of Co/Al2O3-I was
lower than those of Ni/Al2O3-I and Ni-Co/Al2O3-I catalyst. While doing the

98
calcination at 700°C or 900°C did not really affect the catalytic performance of
Ni/Al2O3-I and Ni-Co/Al2O3-I catalysts, it had significant influence on the
performance of Co/Al2O3-I catalyst. Ni/Al2O3-I and Ni-Co/Al2O3-I catalysts
provided comparable activities. Both Ni and Ni-Co catalysts had almost same
amount of carbon deposition when they were calcined at 900°C. On the other hand,
much higher amount of coke was deposited on Ni-Co than Ni catalyst when they
were calcined at 700°C.
The electron micrographs of carbon deposits over Ni/Al2O3-I-900 exhibited octopus
carbon structure, where several fibers are growing from one nickel crystal. No
octopus carbon was observed over Ni-Co/Al2O3-I-900 catalyst. The presence of
cobalt may suppress octopus carbon growth by breaking nickel ensembles.
13C NMR characterization of the deposited coke revealed that coke not only came
from CH4, but CO2 had also significant role in carbon formation.
99
CHAPTER 5
DRY REFORMING OF METHANE ON Al2O3 SUPPORTED Ni
CATALYSTS PREPARED BY POLYOL METHOD
5.1 Introduction
Polyol method has gained great attention recently in preparation of Ni nanoparticles
[109-113]. It is an efficient, easy and cheap method for the reduction of a huge
amount of metallic powder with a uniform shape and size [111 and references
therein]. This process uses poly-alcohol as both solvent and reducing agent for the
production of nanoparticles from the metallic precursor [113 and references therein].
Different polyols, such as ethylene glycol, diethylene glycol, tetraethylene glycol,
propylene glycol, trimethylene glycol and butylene glycol can be used to achieve the
reduction process [111-112]. There are several factors affecting the properties of
nanoparticles acquired by the polyol method, as the type of precursor [111], the type
of polyol [112], the reaction time [110] and temperature [114], pH [115,116], the
presence of protective agent [113,117] and the utilization of an extra-reducing agent
[113].
Noble metals such as Au, Ag and Pd can be synthesized by polyol method under
neutral or even acidic conditions. On the other hand, enough alkalinity is required
for reducing Ni2+ because of its lower oxidation potential [115]. Bai et al. showed
the great effect of alkalinity on the morphology of the resulting Ni powders in polyol
process by obtaining metallic nickel powders with various morphologies including
microspheres, icosahedra and flowerlike clusters at different pHs [115].
Carroll et al. [112] studied the effect of polyol type in the nucleation and growth of
copper and nickel nanoparticles. The reduction of nickel and copper salt precursors
(acetate, hydroxide and chloride salts) dissolved in different polyols (propylene

100
glycol, ethylene glycol, tetraethylene glycol, diethylene glycol, and butylene glycol)
under both refluxing and distillation conditions were studied. With the exception of
NiCl2 in EG, the product was elemental nickel for all the nickel precursors under
distillation and refluxing conditions. NiCl2 could not be totally reduced to elemental
nickel even after 36 h at reflux which was most probably because of the improved
stability of Ni(EG)3 hydrated intermediate complex.
Ung et al. [118] synthesized Co-Ni and Co nanoparticles by reducing nickel and
cobalt acetate mixtures in NaOH solution in 1,2-propanediol. Co-Ni composition
and the basicity of the medium are shown to be two important parameters on which
the particle shape depended strongly. For the samples abundant in cobalt,
agglomerated rods, nanowires and platelets were seen when sodium hydroxide
concentration was increased in the range 0-0.2 M. For Co50Ni50 composition and
sodium hydroxide concentration in the range 0.1-0.18 M, nanodumbbells were
formed the shape of which strongly depended on the basicity. While long dumbbells
were observed for the lowest sodium hydroxide concentration, short dumbbells and
diabolos were obtained for the highest sodium hydroxide concentration
Couto et al. [113] synthesized nickel nanoparticles in air by a modified polyol
process, using nickel chloride as precursor, PVP as protective agent and sodium
borohydride as reducing agent. The presence of PVP was shown to be necessary to
inhibit the aggregation and growth of nanoparticles. High homogeneous and stable
dispersions of PVP-coated nickel nanoparticles were acquired by using ethylene
glycol.
Singh et al. [119] synthesized almost spherical nickel nanoparticles in non-aqueous
environment using PVP as a surfactant and hydrazine hydrate as reducing agent. The
nickel particles were fcc in their cystal structure and monodisperse within the PVP
matrix with an average size about three nm. The synthesized nickel nanoparticles
showed superparamagnetism behavior.

101
Chou and Huang [114] investigated the synthesis of nanosized nickel colloids by
using nickel chloride as precursor, hydrazine as reducing agent and palladium as
nucleation agent. Nickel with a high purity could be acquired when the temperature
was higher than 80°C. On the other hand, nickel hydroxide was also present in its
precipitate form at a lower temperature. The starting concentration of nickel ion was
shown to be the most important element influencing the crystallite size of
precipitates. On the other hand, the quantity of PVP and the reaction temperature
had only negligible effects. The presence of PVP could not prevent agglomeration of
Ni particles into micron sizes. However, if polyacrylic acid was supplemented
instantly after the reaction, nickel colloids could be stabilized in the nanometer
range.
Viau et al. [120] synthesized CoxNi100-x particles with tailored morphological
characteristics by reduction from metallic salts dissolved in 1,2-propanediol.
Heterogeneous nucleation using PtII as nucleating agent enabled them to synthesize
spherical, non agglomerated particles in the submicrometer to nanometer-size range
with a narrow size distribution. In the 200–500nm range, the XRD pattern of
CoxNi100-x particles only depended on composition: a fcc phase was always observed
either as a single phase for x<35 or as the main phase with a second hcp phase for
x>35.
Nouneh et al. [121] synthesized nickel nanoparticles successfully and attached them
on indium tin oxide substrate by two separate routes: from solution reduction
method by using NaBH4 as reducing agent in the presence of PVP as stabilizing and
protective agent and by polyol method under ethylene glycol as a solvent. While the
samples synthesized in aqueous solution exhibited the formation of fcc metallic
nickel nanoparticles with a medium diameter of ~31nm and good size dispersion,
the ones prepared in ethylene glycol displayed big size ~150 nm.
102
Roselina et al. [110] presented an easy and quick synthesis way of nickel
nanoparticles at nearly 180°C in a mixture containing ethylene glycol and hydrazine
as reducing agent. They studied the effect of reaction time on the Ni nanoparticles
that was produced with advantages of facile and rapid synthesis without using any
other protective agent such as polyvinylpyrrolidone, polyvinyl alcohol, oleic acid
and cetyltrimethyl ammonium bromide. XRD showed that the reduction of Ni2+ to
metallic Ni could be accomplished completely in 15 minutes. XRD also exhibited
that the synthesized nanoparticles were purely metallic nickel with fcc crystal
structure. Reaction time was shown to have a critical role in changing particle size.
Particles with a mean size ranging between 1 and 175 nm could be synthesized by
controlling the reaction time.
Instead of traditional methods requiring high calcination temperatures Bayrakdar et
al. [117] proposed an alternative way for the synthesis of nanosized Ni/Al2O3
catalysts. They prepared stable PVP-protected Ni/Al2O3 catalysts having nickel
amount ranging between 5.4 and 7.4 wt. % without doing calcination. Metallic
nickel was acquired with peaks at 44.3° (111), 51.6° (200), 76.4° (220). Any peaks
of NiO, NiAl2O4 or Ni(OH)2 were detected among the synthesized catalysts.
In this part of the study, polyol process as an alternative to conventional preparation
methods was employed to obtain 10 wt % (nominal) Ni/Al2O3 catalysts in the
presence of PVP (polyvinylpyrrolidone) as stabilizer and ethylene glycol as both
solvent and reducing agent. Catalysts with different PVP/Ni ratios were acquired.
Since literature survey showed that metalic nickel could be obtained during the
synthesis in polyol process, the performances of the as-prepared catalysts were
evaluated for carbon dioxide reforming of methane at 600°C and 700°C without
making a reduction step before the reaction.

103
5.2 Results and Discussion
5.2.1 Characterization of fresh catalysts
5.2.1.1 X-Ray Diffraction (XRD) Analysis
γ-Al2O3 powder from Alfa Aesar was used as support. As discussed in Section
4.2.1.1 XRD pattern of the as received alumina powder (Figure 17) demonstrates
that boehmite, γ-Al2O3 and δ–Al2O3 phases coexist simultaneously by considering
the reference XRD patterns (Boehmite: 21-1307 JCPDS file, γ-Al2O3: 50-741
JCPDS file, δ–Al2O3: 46-1215 JCPDS file).
X-ray diffraction patterns of the synthesized catalysts show the formation of metallic
Ni as long as alkaline condition is provided regardless of the PVP amount used.
Alkalinity is not only necessary for Ni reduction, it has also great effect on both
purity and the morphology of the resulting Ni powders [115,122]. XRD pattern
shown in Figure 62 exhibits four characteristic peaks at 44.6°, 51.8°, 76.4° and 93.1°
corresponding to (111), (200), (220) and (311) Miller index planes of fcc nickel.
Although nickel can easily oxidise, peaks belonging to the oxide phase were not
seen, which may be due to the fact that the reaction was performed at appropriate
temperature and pH [119].

104
Figure 62. Comparison of the XRD pattern of pure alumina
with those of catalysts prepared by polyol method

105
5.2.1.2 Surface Area, Pore Size Distribution and Adsorption-Desorption
Isotherms
The surface area of all the catalyts was reduced significantly compared to that of the
parent pure alumina support (Table 10). While the pore volume of Ni/Al2O3-
without-PVP and Ni/Al2O3-PVP/Ni=2.5 catalysts was similar to that of pure
alumina, pore volume of Ni/Al2O3-PVP/Ni=5.0 catalyst was considerably lower
which might be due to its highest PVP content.
Table 10. Comparison of textural properties of pure
Al2O3 with the catalysts prepared by polyol method
Catalyst BET Surface
area (m2/g)
Pore volume
(cm3/g)
Average pore
diameter (nm)
Pure Al2O3
73.2 0.37 19.7
Ni/Al2O3
without PVP
46.5 0.35 28.2
Ni/Al2O3
PVP/Ni=2.5
54.3 0.40 27.5
Ni/Al2O3
PVP/Ni=5.0
50.7 0.28 19.5
The nitrogen adsorption/desorption isotherm and pore size distribution of the pure
Al2O3 and the synthesized catalysts are shown in Figure 63 and Figure 64.
According to the IUPAC classification all samples exhibited type II adsorption
isotherm which is characteristic of macroporous materials and the H3-shape
hysteresis loop of the samples shows the presence of mesopores [79]. Pore size
distribution of the samples exhibits that they are mainly composed of macropores
(pore diameter>50 nm in diameter) in addition to the mesopores (2nm<pore
diameter<50 nm).

106
Figure 63. Comparison of nitrogen adsorption-desorption isotherms of
pure Al2O3 with the catalysts prepared by polyol method
5.2.1.3 Thermal Gravimetric Analysis (TGA)
The thermal analysis was performed to investigate the presence of organics on the
nanoparticles. The TGA analysis of pure ethylene glycol, pure PVP and synthesized
catalyst is shown in Figure 65. The weight loss is approximately 5%, 11% and 19%
for the catalysts Ni/Alumina-without PVP, Ni/Alumina-PVP/Ni=2.5 and
Ni/Alumina-PVP/Ni=5.0, respectively. As PVP amount was increased, the weight
loss also increased as expected.
0.0 0.2 0.4 0.6 0.8 1.0
Qu
an
tity
ad
sorb
ed (
cm3/g
ST
P)
P/Po
pure Alumina - Des.
pure Alumina - Ads.
Ni/Alumina-without PVP - Des.
Ni/Alumina-without PVP - Ads.
Ni/Alumina-PVP/Ni=2.5 - Des.
Ni/Alumina-PVP/Ni=2.5 - Ads.
Ni/Alumina-PVP/Ni=5.0 - Des.
Ni/Alumina-PVP/Ni=5.0 - Ads.

107
Figure 64. Comparison of BJH pore size distribution of pure Al2O3
with the catalysts prepared by polyol method
Figure 65. TG analysis of pure ethylene glycol, pure PVP
and the catalysts prepared by polyol method
1 10 100
dV
/dlo
gD
Pore diameter (nm)
Ni/Alumina-without PVP
Ni/Alumina-PVP/Ni=2.5
Ni/Alumina-PVP/Ni=5.0
pure Alumina
0
20
40
60
80
100
0 100 200 300 400 500 600 700 800 900
Wei
gh
t lo
ss (
%)
Temperature (oC)
pure
PVP
pure
EG
Ni/Alumina-without-PVP
Ni/Alumina-PVP/Ni=2.5
Ni/Alumina-PVP/Ni=5.0

108
The derivative weight loss analysis of pure ethylene glycol, pure PVP and the
catalysts prepared by polyol method is given in Figure 66, giving idea about the
presence and quantity of PVP and ethylene glycol on the synthesized samples. Shifts
are observed in the synthesized catalysts compared to the pure PVP and pure
ethylene glycol which are attributed to the interaction between the PVP molecules
and the Ni particles; between ethylene glycol molecules and the Ni particles.
Figure 66. Derivative weight loss analysis of pure ethylene glycol,
pure PVP and the catalysts prepared by polyol method
5.2.1.4 High Contrast Transmission Electron Microscopy (HCTEM)
The morphology and size of the synthesized catalysts were studied in more detail by
means of high contrast transmission electron microscopy. While the size and shape
of the Ni/Al2O3-without-PVP and Ni/Al2O3-PVP/Ni=2.5 are comparable to each
other, the size of Ni/Al2O3-PVP/Ni=5.0 is smaller than these two.
-0.18
-0.14
-0.10
-0.06
-0.02
0.02
0 100200300400500600700800900
Der
iva
tiv
e w
eig
ht
loss
(mg
/oC
)
Temperature (oC)
pure EG
pure PVP
-0.0045
-0.0035
-0.0025
-0.0015
-0.0005
0.0005
0 100200300400500600700800900
Der
ivati
ve
wei
gh
tlo
ss(m
g/o
C)
Temperature (oC)
fresh
Ni/Alumina
without PVP
fresh
Ni/Alumina
PVP/Ni=2.5
fresh
Ni/Alumina
PVP/Ni=5.0

109
Figure 67. TEM of fresh Ni/Alumina-without-PVP catalyst
There are studies in literature concerning the effect of PVP on the particle size.
Dinç et al. [123] synthesized water soluble polymer stabilized Feo nanoclusters from
the reduction of Fe(III) chloride by ammonia borane and sodium borohydride
mixture in the presence of polyethylene glycol (PEG) as stabilizer and ethylene

110
glycol as solvent. They showed that increasing the amount of PEG stabilizer resulted
in the formation of bigger particles embedded in the polymer matrix.
Bayrakdar et al. [117] synthesized PVP-protected Ni nanoparticles supported on γ-
Al2O3 by polyol method in ethylene glycol environment. They observed that particle
size decreased with increasing PVP/Ni ratio.
Couto et al. [113] reported that particle size decreased with increasing amount of
PVP for the samples prepared according to a modified polyol route, using nickel
chloride as precursor, sodium borohydride as reducing agent and PVP as protective
agent. In that study, the sytem was maintained at 140°C for 2 hour specified time
after NaBH4 was added. On the other hand, in our study each solution was kept at
the boiling point of ethylene glycol until total reduction was accomplished by
observing the color change.
Chou and Huang [114] reported that with the addition of PVP to the system, the
reduction of Ni(OH)2 to Ni metal took more time, implying that PVP molecules
could interact with nickel precursors
Reduction period is another crucial parameter in tuning the size of the particles. Nik
Roselina et al. [110] studied the effect of reaction time on the growth of Ni
nanoparticles when all the conditions except for the reaction time were kept
constant. They concluded that particle size increased significantly with prolong of
the reaction time.
In our study, since increasing PVP ratio made the reduction process difficult, both
PVP amount and the reduction period increased at the same time. For this reason, it
is not possible to make a conclusion about the sole effect of PVP amount on the
particle size.
As shown in Figure 67 and Figure 68, the Ni/Al2O3-without-PVP and Ni/Al2O3-
PVP/Ni=2.5 sample consist of spherical and cubooctahedral particles the size of
which range between 110-320 nm and 150-450 nm respectively.

111
Figure 68. TEM of fresh Ni/Alumina-PVP/Ni=2.5 catalyst

112
Figure 69. TEM of fresh Ni/Alumina-PVP/Ni=5.0 catalyst
The catalysts having the highest amount of PVP and longest reduction time has the
smallest particle size ranging between 40-120 nm. The morphology of the products
revealed that in addition to the cubooctahedral particles, Ni/Alumina-PVP/Ni=5.0
catalyst also contains rod-shaped particles (Figure 69).

113
5.2.2 Dry reforming reaction results
Dry reforming of methane reaction was tested over Ni/Al2O3-without-PVP,
Ni/Al2O3-PVP/Ni=2.5 and Ni/Al2O3-PVP/Ni=5.0 without making a reduction step
before the reaction. In Figure 70, comparison of time dependent CH4 and CO2
conversions at 700°C over the catalysts synthesized by polyol method are given.
Ni/Al2O3-PVP/Ni=5.0 catalyst showed superior initial catalytic performance to
Ni/Al2O3-without-PVP and Ni/Al2O3-PVP/Ni=2.5 catalyst. On the other hand it
deactivated fastest as seen in Figure 70. The PVP polymer in high concentration
may cover the particle surface and lead to a decrease in total pore volume of
Ni/Alumina-PVP/Ni=5.0. As dry reforming reaction proceeds, carbon deposits and
may block the pores and active sites on the surface resulting in the deactivation of
the catalyst.
Figure 70. Comparison of CH4 and CO2 conversion versus time on stream over the
catalysts prepared by polyol method, Ni/Al2O3-without PVP ,
Ni/Al2O3-PVP/Ni=2.5 , Ni/Al2O3-PVP/Ni=5.0 ,
(Reaction conditions: 700°C, 1 atm, no reduction)
0.0
0.2
0.4
0.6
0.8
1.0
0 50 100 150 200 250 300
CH
4co
nver
sion
Time (min)
onset of
clogging
sharp deactivation
0.0
0.2
0.4
0.6
0.8
1.0
0 50 100 150 200 250 300
CO
2co
nver
sio
n
Time (min)
onset of
clogging
sharp deactivation

114
Ni/Al2O3-without-PVP and Ni/Al2O3-PVP/Ni=2.5 showed a small decrease in their
activites in terms of CH4 conversion at the initial period of reaction, but exhibited
quite high performance during the whole reaction period.
The time dependent H2 and CO yield of the catalysts during the reaction at 700°C
are given in Figure 71. CO yield was higher than H2 yield for all the catalysts due to
the RWGS reaction. The H2 and CO yield also exhibited same behaviors as in the
case of conversion. Since CO yield was higher than H2 yield, the H2/CO ratio was
lower than one for all the catalysts examined (Figure 72).
Figure 71. Comparison of H2 and CO yield versus time on stream over the catalysts
prepared by polyol method, Ni/Al2O3-without PVP , Ni/Al2O3-PVP/Ni=2.5 ,
Ni/Al2O3-PVP/Ni=5.0 , (Reaction conditions: 700°C, 1 atm, no reduction)
0.0
0.2
0.4
0.6
0.8
1.0
0 50 100 150 200 250 300
H2
yie
ld
Time (min)
onset of
clogging
sharp deactivation
0.0
0.2
0.4
0.6
0.8
1.0
0 50 100 150 200 250 300
CO
yie
ld
Time (min)
onset of
clogging
sharp deactivation

115
Figure 72. Comparison of H2/CO ratio versus time on stream over the catalysts
prepared by polyol method, Ni/Al2O3-without PVP , Ni/Al2O3-PVP/Ni=2.5 ,
Ni/Al2O3-PVP/Ni=5.0 , (Reaction conditions: 700°C, 1 atm, no reduction)
As mentioned before, dry reforming of methane reaction is an endothermic reaction.
The reactions were carried out also at 600°C to see the effect of temperature. The
conversion of CH4 and CO2 decreased with a decrease in temperature, as expected
(Figure 73).
One of the most striking difference between the reaction results of 600°C and 700°C
was seen for Ni/Al2O3-PVP/Ni=5.0 catalyst. The severe deactivation of it started
much earlier at 600°C reaction temperature. As mentioned before, CH4
decomposition and CO disproportionation have been regarded as main coke
deposition reactions during dry reforming of methane. Being exothermic, the
equilibrium constant of CO disproportionation decreases with an increase in
temperature. On the other hand, being endothermic, the equilibrium constant of CH4
decomposition increases with an increase in temperature (Figure 4). The earlier
severe deactivation of the catalyst at 600°C suggests that the main contribution to
coke formation comes from CO disproportionation.
0.0
0.2
0.4
0.6
0.8
1.0
0 50 100 150 200 250 300
H2/C
O
Time (min)
onset of
clogging
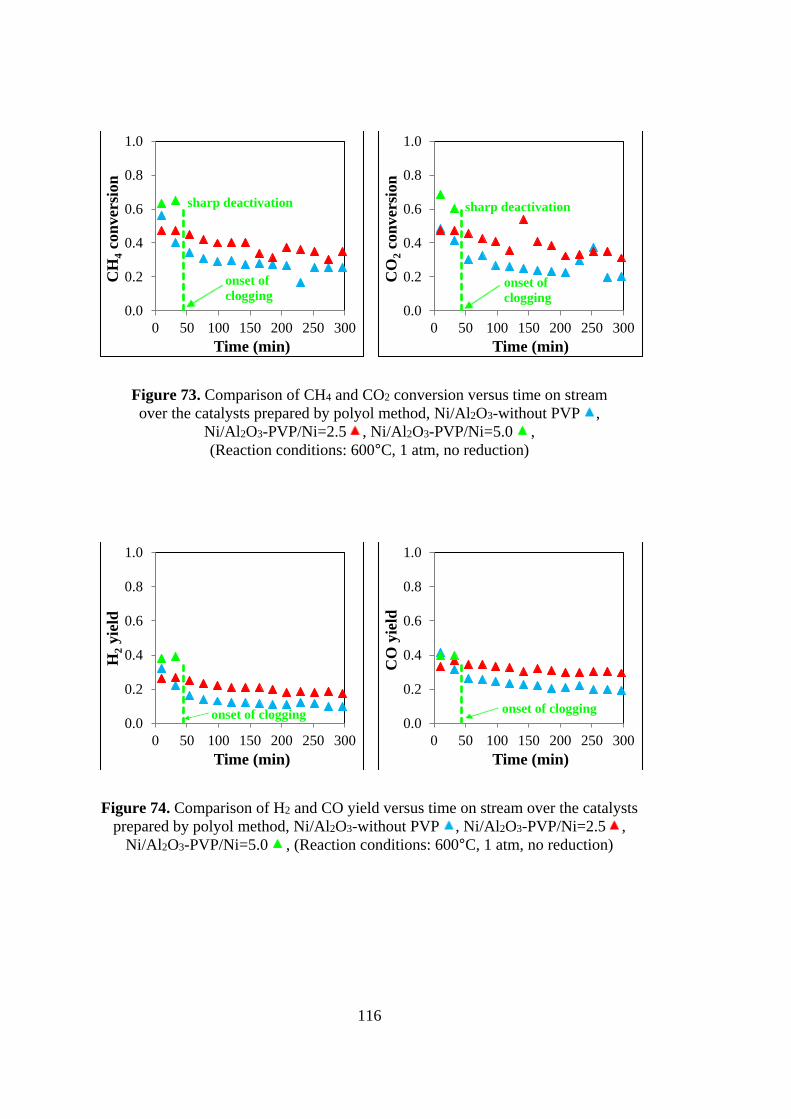
116
Figure 73. Comparison of CH4 and CO2 conversion versus time on stream
over the catalysts prepared by polyol method, Ni/Al2O3-without PVP ,
Ni/Al2O3-PVP/Ni=2.5 , Ni/Al2O3-PVP/Ni=5.0 ,
(Reaction conditions: 600°C, 1 atm, no reduction)
Figure 74. Comparison of H2 and CO yield versus time on stream over the catalysts
prepared by polyol method, Ni/Al2O3-without PVP , Ni/Al2O3-PVP/Ni=2.5 ,
Ni/Al2O3-PVP/Ni=5.0 , (Reaction conditions: 600°C, 1 atm, no reduction)
0.0
0.2
0.4
0.6
0.8
1.0
0 50 100 150 200 250 300
CH
4co
nver
sio
n
Time (min)
onset of
clogging
sharp deactivation
0.0
0.2
0.4
0.6
0.8
1.0
0 50 100 150 200 250 300
CO
2co
nver
sion
Time (min)
onset of
clogging
sharp deactivation
0.0
0.2
0.4
0.6
0.8
1.0
0 50 100 150 200 250 300
H2
yie
ld
Time (min)
onset of clogging0.0
0.2
0.4
0.6
0.8
1.0
0 50 100 150 200 250 300
CO
yie
ld
Time (min)
onset of clogging

117
H2 yield and CO yield also decreased with decreasing temperature from 700°C to
600°C (Figure 74), as expected.
H2/CO ratio was below one at 600°C again due to the RWGS reaction (Figure 75).
Figure 75. Comparison of time dependent H2/CO ratio over the catalysts prepared
by polyol method, Ni/Al2O3-without PVP , Ni/Al2O3-PVP/Ni=2.5 , Ni/Al2O3-
PVP/Ni=5.0 , (Reaction conditions: 600°C, 1 atm, no reduction)
5.2.3 Characterization of spent catalysts
5.2.3.1 Thermal Gravimetric Analysis (TGA)
Thermal analysis of the fresh and spent catalysts after five hour reaction at 600°C
and 700°C is shown comparatively in Figure 76. More coke was deposited on the
catalysts when the reaction was carried out at 600°C, suggesting that the major
contributor to coke formation is CO disproportionation. For both Ni/Al2O3-without-
PVP and Ni/Al2O3-PVP/Ni=2.5 catalysts, while the weight loss of the spent catalyst
at 600°C was higher than that of the fresh one, the weight loss of the spent catalyst
at 700°C was lower than that of the fresh one.
0.0
0.2
0.4
0.6
0.8
1.0
0 50 100 150 200 250 300
H2/C
O
Time (min)
onset of
clogging
sharp deactivation

118
(a) (b)
Figure 76. Comparison of weight losses between the fresh and the
used polyol catalysts in the reaction at a) 600°C and b) 700°C
The comparison of derivative weight losses between the fresh and the used polyol
catalysts in the reaction at 600°C and 700°C (Figure 77) shows that the weight loss
of the spent catalysts comes from oxidation of carbon deposits, the peak temperature
of which take place in a temperature range of 626 and 645°C. The presence of PVP
makes the oxidation of carbon deposits more difficult as understood from the
positive shift in the oxidation peak temperature of the spent catalyst containing PVP
compared to the ones without PVP (Figure 77-b).
75
80
85
90
95
100
0 100 200 300 400 500 600 700 800 900
Wei
gh
t lo
ss (
%)
Temperature (ºC)
fresh cat.
without PVP
spent cat.
without
PVPfresh cat.
PVP/Ni=2.5
spent cat.
PVP/Ni=2.5
75
80
85
90
95
100
0 100 200 300 400 500 600 700 800 900
Wei
gh
t lo
ss (
%)
Temperature (ºC)
fresh cat.
without PVP
spent cat.
without PVP
fresh cat.
PVP/Ni=2.5
spent cat.
PVP/Ni=2.5

119
(a) (b)
Figure 77. Comparison of derivative weight losses between the fresh and the used
polyol catalysts in the reaction at 600°C and 700°C
5.2.3.2 High Contrast Transmission Electron Microscopy (HCTEM)
The TEM images of spent Ni/Al2O3-without PVP and Ni/Al2O3-PVP/Ni=2.5
catalysts after five hour reaction at 600°C show abundant filamentous carbon
growing with varying dimensions (Figure 78 and 79). In addition to carbon
nanotubes and carbon nanofibers having hollow structure, there are some fibers
which do not have hollow inside them.
-0.0045
-0.0035
-0.0025
-0.0015
-0.0005
0.0005
0 100 200 300 400 500 600 700 800 900
Der
ivati
ve
wei
gh
tlo
ss(m
g/o
C)
Temperature (oC)
fresh Ni/Alumina
without PVP
fresh Ni/Alumina
PVP/Ni=2.5
fresh Ni/Alumina
PVP/Ni=5.0
-0.0045
-0.0035
-0.0025
-0.0015
-0.0005
0.0005
0 100 200 300 400 500 600 700 800 900
Der
ivati
ve
wei
gh
t lo
ss (
mg/o
C)
Temperature (oC)
spent Ni/Alumina
without PVP-600
spent Ni/Alumina
PVP/Ni=2.5-600
spent Ni/Alumina
without PVP-700
spent Ni/Alumina
PVP/Ni=2.5-700

120
Figure 78. HCTEM of Ni/Al2O3-without PVP catalyst
after being used in reaction at 600°C for 5 hours

121
Figure 79. HCTEM of Ni/Al2O3-PVP/Ni=2.5 catalyst
after being used in reaction at 600°C for 5 hours
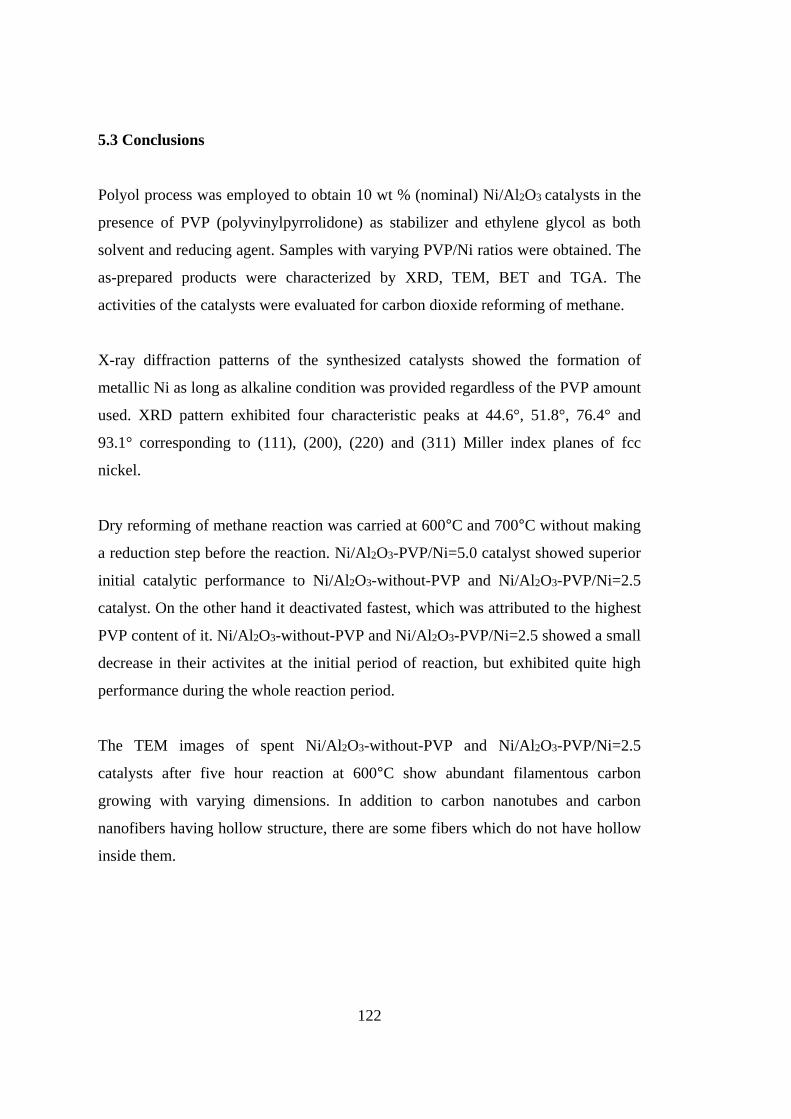
122
5.3 Conclusions
Polyol process was employed to obtain 10 wt % (nominal) Ni/Al2O3 catalysts in the
presence of PVP (polyvinylpyrrolidone) as stabilizer and ethylene glycol as both
solvent and reducing agent. Samples with varying PVP/Ni ratios were obtained. The
as-prepared products were characterized by XRD, TEM, BET and TGA. The
activities of the catalysts were evaluated for carbon dioxide reforming of methane.
X-ray diffraction patterns of the synthesized catalysts showed the formation of
metallic Ni as long as alkaline condition was provided regardless of the PVP amount
used. XRD pattern exhibited four characteristic peaks at 44.6°, 51.8°, 76.4° and
93.1° corresponding to (111), (200), (220) and (311) Miller index planes of fcc
nickel.
Dry reforming of methane reaction was carried at 600°C and 700°C without making
a reduction step before the reaction. Ni/Al2O3-PVP/Ni=5.0 catalyst showed superior
initial catalytic performance to Ni/Al2O3-without-PVP and Ni/Al2O3-PVP/Ni=2.5
catalyst. On the other hand it deactivated fastest, which was attributed to the highest
PVP content of it. Ni/Al2O3-without-PVP and Ni/Al2O3-PVP/Ni=2.5 showed a small
decrease in their activites at the initial period of reaction, but exhibited quite high
performance during the whole reaction period.
The TEM images of spent Ni/Al2O3-without-PVP and Ni/Al2O3-PVP/Ni=2.5
catalysts after five hour reaction at 600°C show abundant filamentous carbon
growing with varying dimensions. In addition to carbon nanotubes and carbon
nanofibers having hollow structure, there are some fibers which do not have hollow
inside them.

123
CHAPTER 6
DRY REFORMING OF METHANE ON CeO2 SUPPORTED Ni, Co and Ni-
Co CATALYSTS PREPARED BY INCIPIENT WETNESS IMPREGNATION
METHOD
6.1 Introduction
CeO2 has mostly been used as an additive promoter on Ni/Al2O3 catalysts in dry
reforming of methane reaction. These catalyst were found to provide considerably
higher catalytic activity and resistance to carbon formation compared to the
conventional Ni/Al2O3 [62,124-126]. These improvements are mainly due to the
redox property of ceria [127]. While it is able to release oxygen under oxygen
deficient medium, it can rapidly reoxidize under oxygen abundant medium [128].
Under dry reforming of methane conditions, the catalytic behavior of ceria is the
result of a complex series of surface reactions [1 and references therein]. CO2
adsorption and activation occurs on Ce3+ sites with formation of CO followed by
oxidation of Ce3+ to Ce4+, while the presence of bulk oxygen vacancies creates
additional driving force for the reduction of CO2 to CO [129]. Furthermore, ceria has
the ability of chemisorbing huge amounts of H2 to CO where the quantity depends
on physicochemical properties and thermal treatment conditions [1 and references
therein]. “In general, the redox properties of CeO2 are very sensitive to the textural,
structural, and morphological properties of the catalytic system, brought about by
the preparation method, the presence of metals or metal oxide additives and the
pretreatment.” [1 and references therein]

124
The following reactions between ceria and feed are probable during dry reforming of
methane process [130].
2CeO2 + CH4 ↔ Ce2O3 + CO + 2H2 (23)
Ce2O3 + CO2 ↔ 2CeO2 + CO (24)
As mentioned before, carbon can be formed due to the decomposition of CH4 and
CO disproportionation. Being a lattice oxygen supplier, CeO2 might oxidize the
solid carbon as in the following reaction [130].
2CeO2 + C(s) ↔ Ce2O3 + CO (25)
The presence of CeO2 can cause oxidation of Ni according to the below reaction.
2CeO2 + Ni ↔ Ce2O3 +NiO (26)
To investigate the probability of the above reactions, standard Gibbs-free energy
changes (ΔG°) were calculated and shown in Figure 80 as a function of temperature.
Figure 80. Standard Gibbs free energy as a function of
temperature for CeO2 based nickel catalyst
-100
0
100
200
300
0 100 200 300 400 500 600 700 800 900
ΔG
o(k
J/m
ol)
Temperature (oC)
2CeO2+CH4↔Ce2O3+2H2+CO
Ce2O3+CO2↔2CeO2+CO
2CeO2+C↔Ce2O3+CO
2CeO2+Ni↔Ce2O3+NiO

125
Since the gasification of solid carbon is thermodynamically favorable at
temperatures higher than 900°C, the existence of CeO2 can suppress carbon
formation throughout dry reforming process. Furthermore, it is not probable that
CeO2 oxidizes Ni to NiO which is less active than Ni species. On the other hand,
Ce2O3 probably reduces NiO to Ni, keeping Ni active for dry reforming of methane
[130].
Pure ceria was shown to be a promising candidate for CO2 reforming of CH4 due to
its resistance to deactivation [131]. While methane conversion was approximately 15
% for low surface area ceria (55 m2/g), it was about 30 % for high surface area ceria
(105 m2/g) at 900°C reaction temperature. The utilization of high surface area ceria
importantly decreased the extent of deactivation by thermal sintering when
compared to low surface area ceria.
Wang and Lu [132] tested nickel catalysts which were supported on γ-Al2O3, CeO2
and CeO2+Al2O for carbon dioxide reforming of methane. Ni/CeO2 exhibited
considerably different catalytic behaviour from Ni/Al2O3 at 500-800°C temperature
range. While CH4 conversion of CeO2 supported catalyst was higher than that of
Al2O3 supported catalyst before 600°C, opposite behavior was observed after 600°C.
Using CeO2 as a support for nickel catalysts caused a strong metal-support
interaction, which decreased the catalytic activity and carbon deposition.
Nevertheless, adding CeO2 into Ni/γ-Al2O3 catalyst increased catalytic activity and
stability and also inhibited coke formation. Because CeO2 improved the dispersion
of nickel and the reactivities of carbon deposits
Asami et al. [133] examined CO2 reforming of CH4 over nickel, cobalt, and iron
catalysts supported on cerium oxide. Ni/CeO2 was the most effective catalyst with
95% methane conversion at 850°C. Co/CeO2 showed an activity approximately
equal to that of Ni/CeO2 when reduced sufficient enough, whereas Fe/CeO2
exhibited a poor performance. Although being highly active at 850°C, Ni/CeO2

126
deactivated rapidly at low temperature of 700°C. They found that high temperature
heat treatment played a key role in attaining high activity. Even though the influence
of high temperature treatment was not yet clear, the intimate contact between nickel
and CeO2 or the variation in the number of the active sites was proposed to be the
probable reasons of high activity.
Gonzalez-Delacruz et al. [134] prepared Ni–CeO2 catalysts, in a wide range of
nickel loadings (7–26%) by using combustion synthesis method for dry reforming of
methane. This new synthesis method was shown to be an easy, efficient and trusty
way of preparing catalysts with a narrow size distribution and homogeneous
dispersion over the support. The reducer/oxidizer ratio was shown to affect the
number of nickel particles and hence activity. Higher activities were obtained with
decreasing ratios of this parameter. Even though the catalsyt preserved its activity
and stability even after more than two weeks, severe coke formation in the form of
narrow and long nano-fibers was observed.
Odedairo et al. [135] prepared ceria supported nickel particles under microwave
plasma. A totally different material was obtained under microwave plasma
compared with the catalyst synthesized using conventional thermal calcinations. The
HRTEM images of the plasma treated sample revealed that the majority of the nickel
particles were arranged in an orderly way on support surface and not within the
support, resulting in a clean metal–support interface. On the other hand, the HRTEM
images of the ceria sample prepared by conventional thermal method exhibited that
nickel particles were dispersed within the ceria support. The sample treated with
plasma displayed higher activity and excellent stability than the thermally calcined
catalyst in CO2 reforming of CH4 reaction. The clean metal–support interface
created by the microwave plasma treatment was reported to be the reason of higher
catalytic activity and very good stability.
127
Wang et al. [136] studied CO2 reforming of CH4 over novel fibrous NiO/CeO2
catalysts to find out the effects of NiO content, crystallization temperature and gas
flow rate on coke formation. The influence of crystallization temperature and NiO
content could be ascribed to its effect on the interaction between the CeO2 support
and NiO which importantly determined coke formation over the fibrous samples
during CO2 reforming of CH4. As the interaction became stronger, the amount of
carbon formation became lower. When the gas flow rate was increased, coke
formation rate was reduced by a large amount which was ascribed to the enhanced
radical desorption and low conversion of CH4 at high gas flow rates.
Du et al. [137] studied the morphology dependence of Ni/CeO2 nanomaterials for
dry reforming of methane reaction. Ni/CeO2 nanorods exhibited much better
catalytic activity and coking resistance compared with Ni/CeO2 nanopolyhedras.
The predominately exposed planes were the extraordinary reactive {110} and {100}
planes in the CeO2 nanorods rather than the stable {111} plane in the CeO2
nanopolyhedra. The {110} and {100} planes exhibited big supremacy for anchoring
the nickel nanoparticles resulting in the presence of strong metal−support interaction
effect. This effect could be useful to inhibit the sintering of nickel particles
benefiting to decrease the deactivation of the catalyst.
Luisetto et al. [138] prepared Ni/CeO2, Co/CeO2 and Co-Ni/CeO2 by surfactant
assisted co-precipitation method for CO2 reforming of CH4 in the temperature range
of 600-800°C. The bimetallic catalyst exhibited higher CH4 conversion in
comparison with the monometallic catalysts in the whole temperature range. While
H2/CO selectivity was highest for Co-Ni/CeO2, it was lowest for Co/CeO2. They
suggested that catalytic activity was mainly related to an intrinsic feature of the
cobalt-nickel alloy. Carbon deposition resistance of Co-Ni/CeO2 and Co/CeO2 was
substantially higher than that of Ni/CeO2.

128
As understood from the above literature survey, there are some studies over CeO2
supported Ni for dry reforming of methane. On the other hand, CeO2 supported Co
and Ni-Co catalysts have not been investigated in detail. In this part, a
comprehensive study on the role of cerium oxide as a support in Ni/CeO2, Co/CeO2
and Ni-Co/CeO2 was conducted for dry reforming of methane. In order to see the
effect of calcination temperature, the catalysts were calcined at 700°C and 900°C.
6.2 Results and Discussion
6.2.1 Characterization of fresh catalysts
6.2.1.1 X-Ray Diffraction (XRD) Analysis
XRD was used for the identification of bulk phase feature of the catalysts. Figure 81
and 82 shows the XRD patterns of the ceria-based catalysts calcined at 700 and
900°C, respectively. The pure ceria and the ceria supported catalysts contain CeO2
fluorite structure (JCPDS 34-0394), corresponding to the (111), (200), (220), (311),
(222) and 400) planes. As can be seen, with the increasing temperature from 700 to
900°C, a remarkable increase in the intensity of the lines due to better crystallization
of CeO2 could be noted.
Ni/CeO2-I-700 and Ni/CeO2-I-900 exhibit NiO, corresponding to (111), (200) and
(220) planes. Co/CeO2-I-700 and Co/CeO2-I-900 exhibit the diffraction peaks of
Co3O4, corresponding to (311), (400) and (440) planes.
Ni-Co/CeO2-I-700 and Ni-Co/CeO2-I-900 show a diffraction peak in 37-38° region
between NiO (111) and Co3O4 (311), suggesting the formation of a nickel-cobalt
alloy.

129
Figure 81. XRD pattern of pure CeO2, Ni/CeO2,
Co/CeO2 and Ni-Co/CeO2 calcined at 700°C

130
Figure 82. XRD pattern of pure CeO2, Ni/CeO2,
Co/CeO2 and Ni-Co/CeO2 calcined at 900°C

131
6.2.1.2 Surface Area, Pore Size Distribution and Adsorption-Desorption
Isotherms
Textural properties of the samples calcined at 700°C and 900°C are given in Table
11 and 12 respectively.
Table 11. Textural properties of pure CeO2, Ni/CeO2,
Co/CeO2 and Ni-Co/CeO2 calcined at 700°C
Catalyst BET Surface
area (m2/g)
Pore volume
(cm3/g)
Average pore
diameter (nm)
Pure CeO2
calc. at 700°C
40.47 0.16 13.49
Ni/CeO2 23.78 0.12 17.35
Co/CeO2 18.92 0.10 17.80
Ni-Co/CeO2 18.27 0.10 20.31
Table 12. Textural properties of pure CeO2, Ni/CeO2,
Co/CeO2 and Ni-Co/CeO2 calcined at 900°C
Catalyst BET Surface
area (m2/g)
Pore volume
(cm3/g)
Average pore
diameter (nm)
Pure CeO2
calc. at 900°C
14.41 0.09 19.74
Ni/CeO2 7.86 0.04 19.77
Co/CeO2 4.32 0.02 14.77
Ni-Co/CeO2 5.76 0.02 16.62

132
As it was remembered pure CeO2 support was obtained by calcination of
Ce(C2H3O2).1.5H2O at 700°C as well as 900°C for 3 hours. The surface area of the
CeO2 obtained by calcination cerium acetate at 900°C was much lower than the one
obtained by calcination of cerium acetate at 900°C. Thermal treatment at higher
temperature brings about gradual sintering and crystallite growth resulting in the loss
of surface area [139]. When Ni, Co or Ni-Co was added to the support, the surface
area and the total pore volume decreased significantly.
Figure 83. Nitrogen adsorption-desorption isotherms of pure CeO2,
Ni/CeO2, Co/CeO2 and Ni-Co/CeO2 calcined at 700°C
0
20
40
60
80
100
120
140
160
180
200
0.0 0.2 0.4 0.6 0.8 1.0
Qu
an
tity
ad
sorb
ed (
cm3/g
ST
P)
P/Po
pure Ceria-700 Ads.pure Ceria-700 Des.
Ni/Ceria-700 Ads.
Ni/Ceria-700 Des.
Co/Ceria-700 Ads.
Co/Ceria-700 Des.
Ni-Co/Ceria-700 Ads.
Ni-Co/Ceria-700 Des.

133
The N2 adsorption/desorption isotherm of the samples calcined at 700°C and 900°C
are given in Figure 83 and 84 respectively. According to the IUPAC classification
all samples exhibited type II adsorption isotherm which is characteristic of
macroporous materials and the H3-shape hysteresis loops show the presence of
mesopores [79]. Pore size distribution of the samples exhibits that they are mainly
composed of macropores (pore diameter>50nm in diameter) in addition to the
mesopores (2nm<pore diameter<50 nm) (Figure 85 and Figure 86).
Figure 84. Nitrogen adsorption-desorption isotherms of pure CeO2,
Ni/CeO2, Co/CeO2 and Ni-Co/CeO2 calcined at 900°C
0
20
40
60
80
100
0.0 0.2 0.4 0.6 0.8 1.0
Qu
an
tity
ad
sorb
ed (
cm3/g
ST
P)
P/Po
pure Ceria-900 Ads.pure Ceria-900 Des.
Ni/Ceria-900 Ads.
Ni/Ceria-900 Des.
Co/Ceria-900 Ads.
Co/Ceria-900 Des.
Ni-Co/Ceria-900 Ads.
Ni-Co/Ceria-900 Des.

134
Figure 85. BJH pore size distribution of pure CeO2,
Ni/CeO2, Co/CeO2 and Ni-Co/CeO2 calcined at 700°C
Figure 86. BJH pore size distribution of pure CeO2,
Ni/CeO2, Co/CeO2 and Ni-Co/CeO2 calcined at 900°C
0.0
0.2
0.4
0.6
0.8
1.0
1 10 100
dV
/dlo
gD
Pore diameter (nm)
Ni/Ceria-700
Co/Ceria-700
Ni-Co/Ceria-700
pure Ceria-700
0.0
0.1
0.2
0.3
0.4
0.5
1 10 100
dV
/dlo
gD
Pore diameter (nm)
Ni/Ceria-900
Co/Ceria-900
Ni-Co/Ceria-900
pure Ceria-900

135
6.2.1.3 Temperature Programmed Reduction (TPR) Analysis
The reducibility of the samples was investigated by TPR. Pure CeO2 showed a broad
Ce4+→ Ce3+ reduction peak with a maximum at 450°C attributed to the surface
reduction. The second reduction peak with a maximum at 812°C was ascribed to the
bulk reduction [140,141] (Figure 87).
Figure 87. TPR profiles of pure CeO2, Ni/CeO2,
Co/CeO2 and Ni-Co/CeO2 calcined at 700°C

136
The reduction of CeO2 happens by means of direct dissociative chemisorption of H2
on surface site resulting in the formation of H2O via hydroxyl groups followed by
the formation of surface oxygen vacancies and reduction of Ce4+ to Ce3+. This can
be shown as [141]
2Had + 2Ce4+ + O2-→ 2Ce3+ + H2O + □ (27)
where □ is a surface oxygen vacancy. The diffusion of surface anion vacancies into
the bulk ceria happens at comparatively high temperatures making a contribution to
slow bulk reduction [141].
The first peak for the metal loaded samples corresponded to the reduction of metal
oxides. There was only one peak for bimetallic catalyst, suggesting the formation of
nickel-cobalt alloy. The ease of reducibility was in the order of Ni/CeO2 < Co/CeO2
< Ni-Co/CeO2 for the catalysts calcined at 700°C. While there was only one peak for
NiO reduction, there was a two-step reduction process for Co3O4 which was
attributed to Co3O4 → CoO → Co°.
The most striking results seen in the TPR profiles of CeO2 supported catalysts
calcined at 700°C was the negative peak.
Laachir et al. [142] observed a negative peak in the hydrogen TPR of ceria sample
which was obtained by calcination of CeO2 (Rhone Poulenc) at 400oC. Prior to
reduction, the sample was standardised for 1 h at 400oC under oxygen flow and then
treated for 1 hour at the same temperature either under vacuum or rare gas before
cooling to room temperature. They attributed the negative peak at 617°C to the
release of CO which could originate from the reduction of carbonates existing in the
bulk of the ceria and not removed by the standardisation process at 400oC.
Rogemond et al. [143] also observed negative peaks in the hydrogen TPR profiles of
pure CeO2, Rh/CeO2, Pt/CeO2 and Rh-Pt/CeO2 obtained after calcination at 500oC.
They concluded that the negative peak could be ascribed to the evolution of H2, CO,
and CO2 in the gas phase, originating from the desorption of hydrogen stored by the
solid (metal and reduced ceria) and from the reduction or decomposition of

137
carbonate species existing in the bulk ceria and not removed in the course of the
pretreatment.
By taking into consideration the above studies, the negative peak might be attributed
to the desorption of fixed hydrogen by the solid during TPR.
Figure 88. TPR profiles of pure CeO2, Ni/CeO2,
Co/CeO2 and Ni-Co/CeO2 calcined at 900°C
The TPR profiles of the samples calcined at 900°C are given in Figure 88. The first
peak at about 350°C was again ascribed to the reduction of metal oxides, the ease of
which was in the order of Ni-Co/CeO2 < Co/CeO2 < Ni/CeO2. The second broad
peak, the peak temperature of which was around 800°C, was attributed to the
reduction of bulk ceria.

138
The reducibility order was different for the catalysts calcined at 700°C and 900°C.
While Ni catalyst was reduced easiest at 700°C calcination temperature, its
reduction was most difficult at 900°C calcination temperature. Similarly, while the
reduction of Ni-Co bimetallic catalyst was achieved at the lowest temperature when
the calcination was carried out at 900°C, its reduction peak was observed at the
highest temperature when the calcination was carried out at 700°C. These results
made us to conclude that the interaction of the metals with ceria changed with
calcination temperature.
6.2.2 Dry reforming reaction results
The time dependent CH4 and CO2 conversion over the catalysts calcined at 700°C
are given in Figure 89. While Ni/CeO2-I-700-pellet and Ni-Co/CeO2-I-700-pellet
provided comparable high activities, Co/CeO2-I-700-pellet exhibited very low
performance. Although showing a slight decrease in activity in the first period of
reaction, Ni/CeO2-I-700-pellet and Ni-Co/CeO2-I-700-pellet preserved their
performance up to the end of the reaction. Wang and Lu [132] reported that an initial
quick (non-linear) deactivation took place over Ni/CeO2 catalyst at 700°C. After five
hour a linear deactivation rate was seen. Asami et al. [133] also observed such
deactivation at that temperature. In their work, the initial conversion of CH4 at
700°C was only 30%, and it fell rapidly to only several percentage points for 2–3
hour. We also observed such an initial deactivation in the CH4 and CO2 conversions
at 700°C reaction temperature (Figure 89), but not that much severe.
The time dependent H2 and CO yield of the catalysts calcined at 700°C are given in
Figure 90. CO yield was higher than H2 yield for all the catalysts due to the
occurrence of the RWGS reaction. Since CO yield was higher than H2 yield, the
H2/CO ratio was lower than 1.0 for all the catalysts examined (Figure 91).

139
Figure 89. Comparison of CH4 and CO2 conversion versus time on stream over the
catalysts calcined at 700°C, Ni/CeO2-I-700-pellet , Co/CeO2-I-700-pellet ,
Ni-Co/CeO2-I-700-pellet , (Reaction conditions: 700°C, 1 atm)
0.0
0.2
0.4
0.6
0.8
1.0
0 50 100 150 200 250 300
CH
4co
nver
sion
Time (min)
0.0
0.2
0.4
0.6
0.8
1.0
0 50 100 150 200 250 300
CO
2co
nver
sio
n
Time (min)
0.0
0.2
0.4
0.6
0.8
1.0
0 50 100 150 200 250 300
CH
4co
nver
sion
Time (min)
0.0
0.2
0.4
0.6
0.8
1.0
0 50 100 150 200 250 300
CO
2co
nver
sio
n
Time (min)
0.0
0.2
0.4
0.6
0.8
1.0
0 50 100 150 200 250 300
CH
4co
nver
sion
Time (min)
0.0
0.2
0.4
0.6
0.8
1.0
0 50 100 150 200 250 300
CO
2co
nver
sio
n
Time (min)

140
Figure 90. Comparison of H2 and CO yield versus time on stream over the catalysts
calcined at 700°C, Ni/CeO2-I-700-pellet , Co/CeO2-I-700-pellet ,
Ni-Co/CeO2-I-700-pellet , (Reaction conditions: 700°C, 1 atm)
0.0
0.2
0.4
0.6
0.8
1.0
0 50 100 150 200 250 300
H2
yie
ld
Time (min)
0.0
0.2
0.4
0.6
0.8
1.0
0 50 100 150 200 250 300
CO
yie
ld
Time (min)
0.0
0.2
0.4
0.6
0.8
1.0
0 50 100 150 200 250 300
H2
yie
ld
Time (min)
0.0
0.2
0.4
0.6
0.8
1.0
0 50 100 150 200 250 300
CO
yie
ld
Time (min)
0.0
0.2
0.4
0.6
0.8
1.0
0 50 100 150 200 250 300
H2
yie
ld
Time (min)
0.0
0.2
0.4
0.6
0.8
1.0
0 50 100 150 200 250 300
CO
yie
ld
Time (min)

141
Figure 91. Comparison of H2/CO ratio versus time on stream over the catalysts
calcined at 700°C, Ni/CeO2-I-700-pellet , Co/CeO2-I-700-pellet ,
Ni-Co/CeO2-I-700-pellet , (Reaction conditions: 700°C, 1 atm)
In order to understand the effect of calcination temperature, the activity of the
catalysts calcined at 900°C were also investigated for dry reforming of methane.
CH4 and CO2 conversions versus time on stream over the catalysts calcined at 900°C
are given in Figure 92. When Figure 89 and Figure 92 are compared with each
other, it is seen that conversion of CH4 and CO2 decreased with the increase of
calcination temperature from 700°C to 900°C. The initial deactivation was more
severe in the case of 900°C calcination temperature.
0.0
0.2
0.4
0.6
0.8
1.0
0 50 100 150 200 250 300
H2/C
O
Time (min)
0.0
0.2
0.4
0.6
0.8
1.0
0 50 100 150 200 250 300
H2/C
O
Time (min)
0.0
0.2
0.4
0.6
0.8
1.0
0 50 100 150 200 250 300
H2/C
O
Time (min)

142
Figure 92. Comparison of CH4 and CO2 conversion versus time on stream over the
catalysts calcined at 900°C, Ni/CeO2-I-900-pellet , Co/CeO2-I-900-pellet ,
Ni-Co/CeO2-I-900-pellet , (Reaction conditions: 700°C, 1 atm)
0.0
0.2
0.4
0.6
0.8
1.0
0 50 100 150 200 250 300
CH
4co
nver
sio
n
Time (min)
0.0
0.2
0.4
0.6
0.8
1.0
0 50 100 150 200 250 300
CO
2co
nver
sion
Time (min)
0.0
0.2
0.4
0.6
0.8
1.0
0 50 100 150 200 250 300
CH
4co
nver
sio
n
Time (min)
0.0
0.2
0.4
0.6
0.8
1.0
0 50 100 150 200 250 300
CO
2co
nver
sion
Time (min)
0.0
0.2
0.4
0.6
0.8
1.0
0 50 100 150 200 250 300
CH
4co
nver
sio
n
Time (min)
0.0
0.2
0.4
0.6
0.8
1.0
0 50 100 150 200 250 300
CO
2co
nver
sion
Time (min)

143
Figure 93. Comparison of H2 and CO yield versus time on stream over the catalysts
calcined at 900°C, Ni/CeO2-I-900-pellet , Co/CeO2-I-900-pellet ,
Ni-Co/CeO2-I-900-pellet , (Reaction conditions: 700°C, 1 atm)
0.0
0.2
0.4
0.6
0.8
1.0
0 50 100 150 200 250 300
H2
yie
ld
Time (min)
0.0
0.2
0.4
0.6
0.8
1.0
0 50 100 150 200 250 300
CO
yie
ld
Time (min)
0.0
0.2
0.4
0.6
0.8
1.0
0 50 100 150 200 250 300
H2
yie
ld
Time (min)
0.0
0.2
0.4
0.6
0.8
1.0
0 50 100 150 200 250 300
CO
yie
ld
Time (min)
0.0
0.2
0.4
0.6
0.8
1.0
0 50 100 150 200 250 300
H2
yie
ld
Time (min)
0.0
0.2
0.4
0.6
0.8
1.0
0 50 100 150 200 250 300
CO
yie
ld
Time (min)

144
The performance of Ni-Co/CeO2-I-900-pellet was slightly higher than that of
Ni/CeO2-I-900-pellet. Although relatively lower than the performance of their
corresponding ones calcined in 700°C, Ni/CeO2-I-900-pellet and Ni-Co/CeO2-I-900
exhibited quite high activity. On the other hand Co/CeO2-I-900-pellet did not show
any activity.
Figure 94. Comparison of H2/CO ratio versus time on stream over the catalysts
calcined at 900°C, Ni/CeO2-I-900-pellet , Co/CeO2-I-900-pellet ,
Ni-Co/CeO2-I-900-pellet , (Reaction conditions: 700°C, 1 atm)
0.0
0.2
0.4
0.6
0.8
1.0
0 50 100 150 200 250 300
H2/C
O
Time (min)
0.0
0.2
0.4
0.6
0.8
1.0
0 50 100 150 200 250 300
H2/C
O
Time (min)
0.0
0.2
0.4
0.6
0.8
1.0
0 50 100 150 200 250 300
H2/C
O
Time (min)

145
CO yield was again higher than H2 yield as in the case of 700°C calcination
temperature which was again due to the RWGS reaction (Figure 93). When Figure
90 and Figure 93 are compared with each other, it is seen that yield of CO and H2
decreased with the increase of calcination temperature from 700°C to 900°C. H2/CO
ratio was below 1.0 for the catalysts calcined at 900°C because of RWGS reaction
(Figure 94).
6.2.3 Characterization of spent catalysts
6.2.3.1 Thermal Gravimetric Analysis (TGA)
The amount of carbon deposited on the samples after being used in CO2 reforming
of CH4 was determined by TGA. The weight loss and derivative weight loss of the
spent catalysts are given in Figure 95 and Figure 96, respectively.
(a) (b)
Figure 95. TGA curves in air atmosphere after being used in reaction at 700°C
for 5 hours for the catalysts calcined at a) 700°C, b) 900°C
70
75
80
85
90
95
100
105
0 100 200 300 400 500 600 700 800 900
Wei
gh
tL
oss
(%)
Temperature (oC)
Ni/CeO2-700
Ni-Co/CeO2-700
Co/CeO2-700
70
75
80
85
90
95
100
105
0 100 200 300 400 500 600 700 800 900
Wei
gh
tL
oss
(%)
Temperature (oC)
Ni/CeO2-900
Ni-Co/CeO2-900
Co/CeO2-900

146
(a) (b)
Figure 96. Derivative weight losses after being used in reaction at 700°C
for 5 hours for the catalysts calcined at a) 700°C, b) 900°C
Although their catalytic performances were comparable, their behavior in terms of
coke deposition was different. Higher amount of coke deposited on Ni-Co/CeO2
when the calcination was done at 700°C. On the other hand, deposited amount of
coke was higher on Ni/CeO2 when the calcination was carried out at 900°C. The
presence of two oxidation peaks in the derivative weight loss of Ni-Co/CeO2-I-700
indicates the formation of two types of carbon formation.
6.2.3.2 High Contrast Transmission Electron Microscopy (HCTEM)
The morphology of deposited carbon on the spent catalyts were determined by
HCTEM and shown in Figure 97 and Figure 98 for Ni/CeO2-I-700 catalyst and Ni-
Co/CeO2-I-700 catalyst, respectively. Abundant filamentous carbon growing with
varying dimensions are seen.
-0.017
-0.011
-0.005
0.001
0 100 200 300 400 500 600 700 800 900
Der
ivati
ve
Wei
gh
tL
oss
(%)
Temperature (oC)
Co/CeO2-700 Ni/CeO2-700
Ni-Co/CeO2-700
-0.017
-0.011
-0.005
0.001
0 100200 300400 500600700 800900D
eriv
ati
ve
Wei
gh
tL
oss
(%)
Temperature (oC)
Co/CeO2-900
Ni/CeO2-900Ni-Co/CeO2-900

147
Figure 97. HCTEM of Ni/CeO2-I-700 catalyst after
being used in reaction at 700°C for 5 hour

148
Figure 98. HCTEM of Ni-Co/CeO2-I-700 catalyst after
being used in reaction at 700°C for 5 hours
As seen in Figure above, the metal particle was encapsulated within the filament for
Ni-Co/CeO2-I-700 catalyst resulting in deactivation of the active surface.

149
6.3 Conclusions
Ceria supported Ni, Co monometallic and Ni-Co bimetallic catalysts were prepared
by incipient wetness impregnation method at two different calcination temperatures
(700 and 900°C) for dry reforming of methane.
TPR results showed that the interaction of metals with ceria changed with
calcination temperature.
The activities of ceria-based catalysts decreased obviously with increasing
calcination temperature. The initial deactivation was more severe in the case of
900°C calcination temperature. Although showing a decrease in activity in the first
period of reaction, Ni and Ni-Co catalyst exhibited comparable high activities at
both calcination temperatures. On the other hand ceria supported Co catalysts was
shown to be inactive for dry reforming of methane at studied reaction conditions.
Higher amount of coke deposited on Ni-Co/CeO2 when the calcination was done at
700°C. On the other hand, deposited amount of coke was higher on Ni/CeO2 when
the calcination was carried out at 900°C. Filamentous carbon growing with varying
dimensions were seen on the spent catalysts after being used in the reaction. The
deactivation of the catalysts was attributed to the encapsulation of active metal
particles within the carbon filaments.

150

151
CHAPTER 7
MORPHOLOGY DEPENDENT REDOX PROPERTIES OF CeO26
7.1 Introduction
Cerium oxide and CeO2-containing materials have been investigated intensively for
the past several years as a reult of their potential applications in the fields of
electrochemistry, optics and catalysis [144-153]. Ceria is extensively employed in
three way catalysts for eliminating the toxic auto-exhaust gases [144-146]. Catalyst
based on CeO2 have been reported to be very promising for water gas shift reaction
[147-149]. Ceria is an excellent catalyst for fuel cell anodes [150-151]. Due to its
strong absorption in the UV range, CeO2 is used as UV blocking and shielding
materials [152-153].
The broad range applications of ceria is mostly due to its unique redox properties
and remarkable oxygen storage capacities [154-156]. Ceria has very good redox
properties due to the very quick reduction of Ce4+ to Ce3+ associated with the
creation of oxygen vacancies [157]. It can release oxygen under reducing
atmosphere and store oxygen by filling oxygen vacancies under oxidizing
environment [158 and references therein].
Various approaches have recently been proposed to increase the redox properties of
ceria including the development of novel methodologies of preparation with
enhanced textural properties [155,159,160] and addition of small amount of dopant
metal to ceria [141,145,161,162].
6 This study comprises the work done in Technical University of Darmstadt and Ruhr University
Bochum in the context of TUBITAK Inten-C project with reference number 107M447.

152
Surface area has a major role on the redox properties and hence OSC of CeO2
[145,163].
The reduction of ceria occurs mainly in two temperature regions. The first region is
300°C-600°C and attributed to surface reduction [145 and references therein]. The
second region is 700°C-1000°C and ascribed to bulk reduction [145 and references
therein]. A linear correlation was found between the surface area and the hydrogen
consumption at the low temperature region, indicating that reduction of ceria takes
place first on the surface and then progressively affects the bulk [163 and references
therein].
Morphology has also strong influence on the redox properties of ceria.
[154,155,156,159,160]. Ceria in different morphologies such as nanotubes [160],
nanowires [156], nanorods [154], microspheres [155], nanoflowers [154] and
nanocubes [159] have been synthesized and tested for different catalytic reactions.
Wu and Wang [155] synthesized novel 3D-like CeO2 microflowers and
microspheres and tested them for CO oxidation. 3D-like ceria exhibited great
superiority for favoring creation of oxygen vacancies, which in turn resulted in
higher oxygen mobility and reducibility. The catalytic activity and thermal stability
of 3D-like ceria were much better than that of CeO2 nanoparticles. They proposed
that highly active CeO2 could be acquired by turning their shapes with a high
concentration of oxygen vacancies.
Tana et al. [156] studied the redox properties and catalytic activities of ceria
nanorods, nanoparticles and nanorods for CO oxidation comparatively. While ceria
nanoparticles predominantly exposed stable {111} plane on the surface, the rod-
shaped structures mainly exposed the reactive {100} and {111} planes, resulting in
higher OSC and catalytic activity for CO oxidation. Although both the ceria
nanorods and nanowires predominately exposed the reactive {100} and {111}

153
planes, ceria nanowires exhibited much higher catalytic activity than the nanorods
due to favoring to expose a big portion of these reactive planes on the surface.
Mai et al. [159] synthesized CeO2 nanorods, nanocubes and nanopolyhedras via
hydrothermal method by altering the NaOH concentration and temperature. The
synthesized samples exhibited various exposed crystal planes: {110} and {100} for
nanorods; {100} for nanocubes; {111} and {100} for nanopolyhedra. OSC tests
done at 400°C showed that while oxygen storage occurred both at the surface and in
the bulk for nanocubes and nanorods, it was limited at the surface for the
nanopolyhedra just like its bulk counterpart, because of exposure of more reactive
(100)/(110) planes for the former two catalysts.
Meher and Rao [154] prepared highly uniform CeO2 nanoflowers and nanorods by
non-hydrothermal homogeneous precipitation method. Compared to the nanoflower
sample, CeO2 nanorod was shown to be easily and highly reducible. The OSC of
nanorod was higher than that of nanoflower. CeO2 nanorod exhibited better soot
oxidation activity due to the larger CeO2/soot interface than CeO2 nanoflower.
The relationship between the oxygen storage capacity and the surface structure
associated with a specific crystalline shape for CeO2 nanomaterials lasts to be a
subject of vivid investigation and discussion [159]. In present work, a comparative
study was performed on the redox features of different kinds of ceria samples,
including commercial ceria (COC) from Sigma Aldrich (54481-25G), coprecipitated
ceria7 (CPC) and ceria fiber mats (ESC) obtained by a template directed synthesis
using electrospun PMMA polymer fibers, followed by spray coating of an inorganic
ceria sol.
7 The coprecipitated ceria sample was synthesized by a master student in Ruhr University Bochum .

154
7.2 Results and Discussion
7.2.1 Characterization of fresh catalysts
The BET surface areas of ESC, CPC and COC were measured as 77.4, 91.4 and
103.1 m2/g respectively. For ESC, this corresponds to the surface area after
calcination at 350°C. For CPC and COC, these are the surface areas measured after
calcination at 500°C.
The SEM images of ESC sample show mats of ceria tubes (Figure 99). The addition
of Pluronic P123 not only facilitates the formation of 1D ceria tubes, it also provides
the formation of 2D ceria film interconnecting the ceria tubes and hence generating a
network structure [61]. As it is seen in the SEM images, the dimensions of the ceria
tubes which was obtained by using electrospun PMMA fibers as templates are
varying. The shapes and dimensions of the fibers formed during electrospinning
depend upon several variables [164]. In their detailed study, Greiner and Wendorf
[164] reported these parameters as “the properties of the polymer itself (such as
molecular weight, molecular-weight distribution, glass-transition temperature, and
solubility), as well the properties of the polymer solution (such as viscosity,
viscoelasticity, concentration, surface tension, and electrical conductivity).” In
addition, vapor pressure of the solvent, relative humidity of the environment, the
features of the substrate, feeding rate of the solution, the field strength and the
geometry of the electrodes were reported to have an important effect on fiber
formation [164].

155
Figure 99. Scanning electron micrographs of ceria fiber mats
7.2.2 Redox Properties of CeO2 samples
Redox experiments were performed in order to get information about the oxygen
release/storage ability of different kinds of ceria samples.
Step 1 and Step 2 were carried out to obtain a defined state. The actual OSC
measurement started with Step 3. 100 pulses of oxygen were done in Step 3.
Ce2O3 + 1/2O2(g) → 2CeO2 (28)
The equation shows the process of oxygen storage from gas oxygen to lattice oxygen
on the reduced ceria. O2 uptake values for each sample were sketched in Figure 100
and tabulated in Table 13.

156
Figure 100. O2 consumption during Step 3
Table 13. Oxygen storage of ceria samples at 600°C during Step 3
Sample COC ESC CPC
O2 consumed (μmol/g cat.) 324 438 375
As it is seen, the oxygen uptake is in the order of ESC > CPC > COC. The mats of
ceria fibers with the lowest surface area had the highest oxygen uptake value. This
phenomenon demonstrated that the OSC of the CeO2 samples depended strongly on
the morphology.
120 pulses of CO were done in Step 4.
2CeO2 + CO → Ce2O3 + CO2 (29)
The above equation shows the ability of the sample to release oxygen in the absence
of gaseous O2. CO uptake and CO2 production values upon CO pulses were sketched
in Figure 101 and Figure 102 respectively.
0
100
200
300
400
500
0 20 40 60 80 100
μm
ol
O2
con
sum
ed/
g c
at.
Time (min)
COC
CPC
ESC

157
Figure 101. CO consumption during Step 4
There is a difference between CO uptake and CO2 production on all of the catalysts
examined (Table 14), which is called ‘carbon residual’ [161,165]. ESC is the best
catalyst in terms of CO2 production and prevention of carbon residual.
Figure 102. CO2 production during Step 4
0
100
200
300
400
500
0 20 40 60 80 100 120
μm
ol
CO
con
sum
ed/
g c
at.
Time (min)
COC
CPC
ESC
0
100
200
300
0 20 40 60 80 100 120
μm
ol
CO
2p
rod
uce
d /
g c
at.
Time (min)
COC
CPC
ESC

158
Table 14. Oxygen release of ceria samples at 600°C during Step 4
Sample CO consumed
(μmol/g cat.)
CO2 produced
(μmol/g cat.)
Carbon residual
(μmol/g cat.)
COC 424 102 322
ESC 423 290 132
CPC 317 143 174
CO adsorption on ceria is a complex process during which different events can
occur:
a) CO reacts with oxygen of ceria to form CO2 [165].
b) The produced CO2 might desorb, or it may stay adsorbed on the ceria surface
in a carbonate like species [165].
c) CO may react with OH to produce H2 and CO2 [165].
2CO + 2OH → 2CO2 + H2 (30)
d) CO may react with itself in the CO disproportionation reaction, producing C
and CO2 [165].
2CO → CO2 + C (7)
Since the redox experiments were done at 600°C, hypothesis c can be excluded in
our case. If CO reacted with itself in the CO disproportionation reaction, there would
be CO2 production in the next reoxidation (Step 5). But no CO2 production was
detected in the next reoxidation Step. It was concluded that carbon residual species
on ceria was in the form of carbonates. The assumption seems reasonable due to the
fact that the removal of surface carbonates does not normally consume any oxygen
[165].

159
Having done the reduction of the catalysts in Step 4, the samples were reoxized in
Step 5 with again 100 O2 pulses. O2 uptake values for each sample were sketched in
Figure 103 and tabulated in Table 15.
Figure 103. O2 consumption during Step 5
Table 15. Oxygen storage of ceria samples at 600°C during Step 5
Sample COC ESC CPC
O2 consumed (μmol/g cat.) 162 333 182
As it is seen the oxygen uptake is in the order of ESC > CPC > COC in Step 5 which
is the case for Step 3, but with a decreased amount.
In order to test the reproducibility of the reduction cycle, 120 pulses of CO was
again sent to the samples in Step 6 after the reoxidation (Step 5). CO uptake and
0
100
200
300
400
0 20 40 60 80 100
μm
ol
O2
con
sum
ed /
g c
at.
Time (min)
COC
CPC
ESC

160
CO2 production values upon CO pulses in Step 6 were sketched in Figure 104 and
Figure 105 respectively.
Figure 104. CO consumption during Step 6
Figure 105. CO2 production during Step 6
0
100
200
300
400
500
0 20 40 60 80 100 120
µm
ol
CO
con
sum
ed /
g c
at.
Time (min)
COC
CPC
ESC
0
100
200
300
0 20 40 60 80 100 120
μm
ol
CO
2 p
rod
uce
d /
g c
at.
Time (min)
COC
CPC
ESC

161
CO uptake and CO2 production values were tabulated in Table 16 upon CO pulse in
Step 6.
Table 16. Oxygen release of ceria samples at 600°C during Step 6
Sample CO consumed
(μmol/g cat.)
CO2 produced
(μmol/g cat.)
Carbon residual
(μmol/g cat.)
COC 426 101 325
ESC 419 239 180
CPC 339 126 213
Comparison of the values in Table 14 and Table 16 demonstrates the reversibility of
the reduction cycle on the ceria samples. The difference between Step 4 and Step 6
can be explained by the uncertainity in the ability to calculate the areas under the
peaks.
7.3. Conclusions
Fibers of ceria (ESC) were successfully prepared by a template directed synthesis
method using electrospun PMMA polymer fibers, followed by spray coating of an
inorganic ceria sol.
O2, CO pulse experiments were performed to get information about redox properties
of different kinds of ceria samples, including commercial ceria (COC),
coprecipitated ceria (CPC) and ceria fibers (ESC). The oxygen storage capacities of
the ceria samples were in the order of ESC > CPC > COC. The ceria fibers having
the lowest surface area had the highest oxygen uptake value. This phenomenon
demonstrated that the oxygen storage capacity of the CeO2 samples depended

162
strongly on the morphology. A difference was observed between the CO uptake and
CO2 production on all of the samples examined, which was called carbon residual.
ESC has shown the best performance in terms of least amount of carbon residual.

163
CHAPTER 8
CONCLUSIONS
Al2O3 supported Ni, Co and Ni-Co catalysts were prepared via incipient wetness
impregnation method. Effect of calcination temperature was studied. Metal-support
interaction of Ni-based catalyst increased with addition of cobalt. While doing the
calcination at 700°C or 900°C did not really affect the catalytic performance of
Ni/Al2O3-I and Ni-Co/Al2O3-I catalysts, it had significant influence on the
performance of Co/Al2O3-I catalyst. Carrying out the calcination temperature at
higher temperatures was found to be more preferable in terms of carbon deposition,
especially for Ni-Co/Al2O3-I catalyst. Octopus carbon structure was observed on the
spent Ni/Al2O3-I-900 catalyst. DRIFTS and microcalorimetry studies showed that
CO2 activation took place on Al2O3 for both Ni/Al2O3 and Ni-Co/Al2O3 catalysts.
13C NMR characterization of the deposited coke revealed that coke not only came
from CH4, but CO2 had also significant role in carbon formation.
Polyol process was shown to be a good catalyst preparation method for dry
reforming of methane reaction. The catalysts exhibited quite high performance at
600°C and 700°C without making a reduction step before the reaction. Abundant
filamentous carbon growing with varying dimensions were observed on the TEM
images of the spent catalysts.
CeO2 supported Ni, Co and Ni-Co catalysts were prepared via incipient method at
two different calcination temperatures. The interaction of metals with ceria changed
significantly with calcination temperature. For the same sample calcined at different
temperatures (700 and 900°C), the activities decreased obviously with increasing
calcination temperature. Ni/CeO2 and Ni-Co/CeO2 catalyst exhibited comparable
high activities. On the other hand ceria supported Co/CeO2 was shown to be an

164
inactive catalyst for dry reforming of methane at our operating conditions. Abundant
filamentous carbon growing with varying dimensions were seen on the TEM images
of the spent catalysts after being used in the reaction. Deactivation was attributed to
the encapsulation of active metal particles within the carbon filaments.
O2, CO pulse experiments were done to get information about redox properties of
different kinds of ceria samples, including commercial ceria (COC), coprecipitated
ceria (CPC) and mats of ceria fibers (ESC). The oxygen storage capacities of the
ceria samples were in the order of ESC > CPC > COC. The ceria fibers having the
lowest surface area had the highest oxygen uptake value. Morphology was shown to
be the main parameter that determined the redox properties of ceria.
165
REFERENCES
[1] C. Papadopoulou, H. Matralis, and X. Verykios, Utilization of biogas as a
renewable carbon source: Dry reforming of methane, in: L. Guczi and A. Erdôhelyi
(Eds.), Catalysis for alternative energy generation, Springer Science+Business
Media, New York (2012) 57–127
[2] A.P.E. York, T.C. Xiao, M.L.H. Green, J.B. Claridge, Methane oxyforming for
synthesis gas production, Catalysis Reviews 49(4) (2007) 511–560
[3] K. Otsuka, Y. Wang, E. Sunada, and I. Yamanaka, Direct partial oxidation of
methane to synthesis gas by cerium oxide, Journal of Catalysis 175 (1998) 152-160
[4] The magic of syngas-the link from feedstock to synthetic product, retrieved from
http://www.chemrec.se/Syngas_the_link_from_feedstock_to_synthetic_product.aspx
(last accessed June, 2014)
[5] V.A. Tsipouriari and X.E. Verykios, Carbon and oxygen reaction pathways of
CO2 reforming of methane over Ni/La2O3 and Ni/Al2O3 catalysts studied by isotopic
tracing techniques, Journal of Catalysis 187 (1999) 85–94
[6] B. Beşergil, Petrol, Petrol Kimyası, Bölüm 6, Doğal Gaz, Ege Üniversitesi
Yayını, İzmir (2009)
[7] A.S.K. Raju, C.S. Park, J.M. Norbeck, Synthesis gas production using steam
hydrogasification and steam reforming, Fuel Processing Technology 90(2) (2009)
330–336
[8] L.A. Arkatova, The deposition of coke during carbon dioxide reforming of
methane over intermetallides, Catalysis Today 157 (2010) 170-176
166
[9] Ş. Özkara-Aydınoğlu, E. Özensoy, A.E. Aksoylu, The effect of impregnation
strategy on methane dry reforming activity of Ce promoted Pt/ZrO2, International
Journal of Hydrogen Energy 34 (2009) 9711-9722
[10] D. San-José-Alanso, J. Juan-Juan, M.J. Illán-Gómez, M.C. Román-Martίnez,
Ni, Co and bimetallic Ni-Co catalysts for the dry reforming of methane, Applied
Catalysis A: General 371 (2009) 54-59
[11] J. Xu, W. Zhou, Z. Li, J. Wang, J. Ma, Biogas reforming for hydrogen
production over nickel and cobalt bimetallic catalysts, International Journal of
Hydrogen Energy 34 (2009) 6646-6654
[12] WMO Greenhouse Gas Bulletin, The Satate of Greenhouse Gases in the
Atmosphere Based on Global Observations through 2012, No 9, 6 November 2013,
retrieved from http://www.wmo.int/pages/prog/arep/gaw/ghg/documents/GHG_
Bulletin_No.9_en.pdf (last accessed May, 2014)
[13] A.E.C. Luna, M.E. Iriarte, Carbon dioxide reforming of methane over a metal
modified Ni-Al2O3 catalyst, Applied Catalysis A: General 343 (2008) 10–15
[14] Z.F. Yan, R.G. Ding, L.H. Song, and L. Qian, Mechanistic study of carbon
dioxide reforming with methane over supported nickel catalysts, Energy Fuels 12(6)
(1998) 1114–1120
[15] D. Liu, X.Y. Quek, W.N.E. Cheo, R. Lau, A. Borgna, Y. Yang, MCM-41
supported nickel-based bimetallic catalysts with superior stability during carbon
dioxide reforming of methane: Effect of strong metal–support interaction, Journal of
Catalysis 266 (2009) 380–390

167
[16] E.V. Kondratenko, M. Baerns, Synthesis Gas Generation by Heterogeneous
Catalysis, in: I. Horvath (Ed.), Encyclopedia of Catalysis, John Wiley and Sons,
New Jersey, 6 (2003) 424-456
[17] B. Fidalgo, J.A. Menéndez, Syngas production by CO2 reforming of CH4 under
microwave heating–Challenges and opportunities, in: A. Indarto and J. Palgunadi
(Eds), Syngas: Production, Applications and Environmental Impact, Nova Science
Publishers Inc., New York (2011) 121-149
[18] S. Tang, J. Lin and K.L. Tan, Pulse-MS studies on CH4/CD4 isotope effect in
the partial oxidation of methane to syngas over Pt/α-Al2O3, Catalysis Letters 55
(1998) 83–86
[19] M.S. Fan, A.Z. Abdullah, and S. Bhatia, Catalytic technology for carbon
dioxide reforming of methane to synthesis Gas, ChemCatChem 1 (2009) 192 – 208
[20] M.A. Pena, J.P. Gόmez, J.L.G. Fierro, New catalytic routes for syngas and
hydrogen production, Applied Catalysis A: General 144 (1996) 7-57
[21] A.P.E. York, T. Xiao, and M.L.H. Green, Brief overview of the partial
oxidation of methane to synthesis gas, Topics in Catalysis 22 (2003) 345-358
[22] A.C.W. Koh, L. Chen, W.K. Leong, B.F.G. Johnson, T. Khimyak, J. Lin,
Hydrogen or synthesis gas production via the partial oxidation of methane over
supported nickel–cobalt catalysts, International Journal of Hydrogen Energy 32
(2007) 725–730
[23] Y. Qu, A.M. Sutherland, and T. Guo, Carbon Dioxide Reforming of Methane
by Ni/Co Nanoparticle Catalysts Immobilized on Single-Walled Carbon Nanotubes,
Energy & Fuels 22 (2008) 2183–2187

168
[24] 2010 National Energy Technology Laboratory (NETL) Accomplishments
Report, retrieved from http://www.netl.doe.gov/File%20Library/newsroom/accomp
10.pdf (last accessed April, 2014)
[25] Y.N. Chun, Y.C. Yang, K. Yoshikawa, Hydrogen generation from biogas
reforming using a gliding arc plasma-catalyst reformer, Catalysis Today 148 (2009)
283–289
[26] B.C. Murray, C.S. Galik and T. Vegh, Biogas in the United States, An
Assessment of Market Potential in a Carbon-Constrained Future, Nicholas Institute
for Environmental Policy Solutions, Duke University, (2014)
[27] Sino-Danish, Renewable Energy Development Programme(RED, Report on
the Development Status of Chinese Biogas Industry, Environmental Protection
Research Institute of Light Industry, April, 2011, Beijing-China
[28] M.C.J. Bradford and M.A. Vannice, CO2 Reforming of CH4, Catalysis
Reviews: Science and Engineering 41(1) (1999) 1-42
[29] J.R. Rostrup-Neilsen, J.H. Bak-Hansen, CO2-Reforming of Methane over
Transition Metals, Journal of Catalysis 144 (1993) 38-49
[30] Z.L. Zhang, V.A. Tsipouriari, A.M. Efstathiou, X.E. Verykios, Reforming of
methane with carbon dioxide to synthesis gas over supported rhodium catalysts. I.
Effects of support and metal crystallite size on reaction activity and deactivation
characteristics, Journal of Catalysis 158 (1996) 51–63.
[31] J. Guo, H. Lou, H. Zhao, D. Chai, X. Zheng, Dry reforming of methane over
nickel catalysts supported on magnesium aluminate spinels, Applied Catalysis A:
General 273 (2004) 75–82

169
[32] K. Nagaoka, K. Takanabe, K.I. Aika, Modification of Co/TiO2 for dry
reforming of methane at 2MPa by Pt, Ru or Ni, Applied Catalysis A: General 268
(2004) 151–158
[33] E. Ruckenstein and H.Y. Wang, Carbon Deposition and Catalytic Deactivation
during CO2 Reforming of CH4 over Co/γ-Al2O3 Catalysts, Journal of Catalysis 205
(2002) 289–293
[34] K. Nagaoka, K. Seshan, J.A. Lercher and K.I. Aika, Activation mechanism of
methane-derived coke (CHx) by CO2 during dry reforming of methane–comparison
for Pt/Al2O3 and Pt/ZrO2, Catalysis Letters 70 (2000) 109–116
[35] E. Ruckenstein, H.Y. Wang, Carbon dioxide reforming of methane to synthesis
gas over supported cobalt catalysts, Applied Catalysis A: General 204 (2000) 257–
263
[36] J. Zhang, H. Wang, A.K. Dalai, Development of stable bimetallic catalysts for
carbon dioxide reforming of methane, Journal of Catalysis 249 (2007) 300–310
[37] B.S. Liu, C.T. Au, Carbon deposition and catalyst stability over La2NiO4/γ-
Al2O3 during CO2 reforming of methane to syngas, Applied Catalysis A: General
244 (2003) 181–195
[38] T.P. Beebe Jr., D.W. Goodman, B.D. Kay and J.T. Yates Jr., Kinetics of the
activated dissociative adsorption of methane on the low index planes of nickel single
crystal surfaces, Journal of Chemical Physics 87 (1987) 2305
[39] F. Abild-Pedersen, O. Lytken, J. Engbæk, G. Nielsen, I. Chorkendorff, J.K.
Nørskov, Methane activation on Ni(111): Effects of poisons and step defects,
Surface Science 590 (2005) 127–137

170
[40] H.S. Bengaard, J.K. Nørskov, J. Sehested, B.S. Clausen, L.P. Nielsen, A.M.
Molenbroek, and J.R. Rostrup-Nielsen, Steam Reforming and Graphite Formation
on Ni Catalysts, Journal of Catalysis 209 (2002) 365–384
[41] F. Solymosi, The bonding, structure and reactions of CO2 adsorbed on
clean and promoted metal surfaces, Journal of Molecular Catalysis, 65 (1991)
337-358
[42] B. Bartos, H.J. Freund, H. Kuhlenbeck, M. Neumann, H. Lindner, K. Müller,
Adsorption and reaction of CO2 and CO2/O co-adsorption on Ni(100): Angle
resolved photoemission (ARUPS) and electron energy loss (HREELS) studies,
Surface Science 179 (1987) 59-89
[43] H.J. Freund, M.W. Roberts, Surface chemistry of carbon dioxide, Surface
Science Reports 25 (1996) 225-273
[44] U. Burghaus, Surface science perspective of carbon dioxide chemistry-
Adsorption kinetics and dynamics of CO2 on selected model surfaces, Catalysis
Today 148 (2009) 212–220
[45] A. Cimino, F.S. Stone, Oxide solid solutions as catalysts. Advances in Catalysis
47 (2002) 141–306
[46] S. Bennici and A. Auroux, Thermal Analysis and Calorimetric Methods, in:
S.D. Jackson and J.S.J. Hargreaves (Eds), Metal Oxide Catalysis, Wiley-VCH
Verlag GmbH & Co.KGaA, Weinheim (2009) 391-441
[47] J. Baltrusaitis, Experimental and theoretical studies of the adsorption of
atmospherically relevant gases on metal oxide and carbonate surfaces, Ph.D. Thesis,
University of Iowa (2007)

171
[48] P. Ferreira-Aparicio, I. Rodrίguez-Ramos, J.A. Anderson, A. Guerrero-Ruiz,
Mechanistic aspects of the dry reforming of methane over ruthenium catalysts,
Applied Catalysis A: General 202 (2000) 183–196
[49] J. Nakamura, K. Aikawa, K. Sato, T. Uchijima, Role of support in reforming of
CH4 with CO2 over Rh catalysts, Catalysis Letters 25(3-4) (1994) 265-270
[50] J. H. Bitter, K. Seshan, and J. A. Lercher, The State of Zirconia Supported
Platinum Catalysts for CO2/CH4 Reforming, Journal of Catalysis 171 (1997) 279-
286
[51] Y.T. Shah, Steam Gasification and Reforming Technologies, in: Water for
Energy and Fuel Production, CRC Press, Taylor & Francis Group, Boca Raton
(2014) 47-112
[52] C.A. Bernardo, The fouling of catalysts by deposition of filamentous carbon, in:
L.F. Melo, T.R. Bott, C.A. Bernardo (Eds), Fouling Science and Technology,
Kluwer Academic Publishers, Dordrecht, the Netherlands (1988) 369-389
[53] C.H. Bartholomew, Mechanisms of catalyst deactivation, Applied Catalysis A:
General 212 (2001) 17–60
[54] V.C.H. Kroll, H.M. Swaan and C. Mirodatos, Methane reforming reaction with
carbon dioxide over Ni/SiO2 catalysts. I. Deactivation studies, Journal of
Catalysis 161 (1996) 409-422
[55] J.R. Rostrup-Nielsen and L.J. Christiansen, Concepts in Syngas Manufacture,
Imperial College Press, London (2011)
[56] J.R. Rostrup-Nielsen and J. Sehested, Whisker Carbon Revisited, Studies in
Surface Science and Catalysis, 139 (2001) 1-12

172
[57] F. Abild-Pedersen and J.K. Nørskov, J.R. Rostrup-Nielsen, J. Sehested, and S.
Helveg, Mechanisms for catalytic carbon nanofiber growth studied by ab initio
density functional theory calculations, Physical Review B 73 (2006) 115419(1-13)
[58] S. Helveg, C. Lopez-Cartes, J. Sehested, P. L. Hansen, B. S. Clausen, J.R.
Rostrup-Nielsen, F. Abild-Pedersen, J.K. Nørskov, Atomic-scale imaging of carbon
nanofibre growth, Nature 427 (2004) 426-429
[59] J.R. Rostrup-Nielsen, J.B. Hansen, Steam Reforming for Fuel Cells, in: D.
Shekhawat, J.J. Spivey, D.A. Berry (Eds), Fuel Cells: Technologies for Fuel
Processing, Elsevier, Amsterdam (2011) 49-71
[60] J.R. Rostrup-Nielsen, I. Dybkjaer, L.J. Christiansen, Steam Reforming
Opportunities and Limits of the Technology, in: H.I. de Lasa, G. Doğu, A. Ravella
(Eds), Chemical Reactor Technology for Environmentally Safe Reactors and
Products, Kluwer Academic Publishers, Dordrecht, the Netherlands (1992) 249-281
[61] J.J. Schneider, M. Naumann, C. Schäfer, A. Brandner, H.J. Hofmann, and P.
Claus, Template-assisted formation of microsized nanocrystalline CeO2 tubes and
their catalytic performance in the carboxylation of methanol, Beilstein Journal of
Nanotechnology 2 (2011) 776–784
[62] N. Wang, W. Chu, T. Zhang, X.S. Zhao, Synthesis, characterization and
catalytic performances of Ce-SBA-15 supported nickel catalysts for methane dry
reforming to hydrogen and syngas, International Journal of Hydrogen Energy 37
(2012) 19-30
[63] D. Chen, R. Lødeng, A. Anundska, O. Olsvik, A. Holmen, Deactivation during
carbon dioxide reforming of methane over Ni catalyst: microkinetic analysis,
Chemical Engineering Science 56 (2001) 1371-1379

173
[64] N.A. Pechimuthu, K.K. Pant and S.C. Dhingra, Deactivation Studies over Ni-
K/CeO2-Al2O3 Catalyst for Dry Reforming of Methane, Industrial & Engineering
Chemistry Research 46 (2007) 1731-1736
[65] A. Becerra, M.E. Iriarte, M. Dimitrijewits, A. Castro-Luna, Promoting effects
of rhodium on supported nickel catalysts in the dry reforming of methane, Boetín de
la Sociedad Chilena de Quimíca 47(4) (2002) 385-392
[66] H. Arbag, S. Yasyerli, N. Yasyerli, G. Dogu, Activity and stability
enhancement of Ni-MCM-41 catalysts by Rh incorporation for hydrogen from dry
reforming of methane. International Journal of Hydrogen Energy 35 (2010) 2296–
2304
[67] M. García-Diéguez, I.S. Pieta, M.C. Herrera, M.A. Larrubia, L.J. Alemany,
Improved Pt-Ni nanocatalysts for dry reforming of methane, Applied Catalysis A:
General 377 (2010) 191–199
[68] Y. Chen, K. Tomishige, K. Yokohama, K. Fujimoto, Promoting effect of Pt, Pd
and Rh noble metals to the Ni0.03Mg0.97O solid solution catalysts for the reforming of
CH4 with CO2, Applied Catalysis A: General 165 (1997) 335–347
[69] C. Crisafulli, S. Scirè, S. Minicò, L. Solarino, Ni–Ru bimetallic catalysts for the
CO2 reforming of methane, Applied Catalysis A: General 225 (2002) 1–9
[70] K. Takanabe, K. Nagaoka and K.I. Aika, Improved resistance against coke
deposition of titania supported cobalt and nickel bimetallic catalysts for carbon
dioxide reforming of methane, Catalysis Letters 102 (2005) 153-157
[71] S. Wang and G.Q. Lu, Thermogravimetric Analysis of Carbon Deposition over
Ni/γ-Al2O3Catalysts in Carbon Dioxide Reforming of Methane, Energy Fuels 12(6)
(1998) 1235–1240

174
[72] M. Yang, H. Papp, CO2 reforming of methane to syngas over highly active and
stable Pt/MgO catalysts, Catalysis Today 115 (2006) 199–204
[73] X.E. Verykios, Mechanistic aspects of the reaction of CO2 reforming of
methane over Rh/Al2O3 catalyst, Applied Catalysis A: General 255 (2003) 101–111
[74] A.A. Lemonidou, M.A. Goula, I.A. Vasalos, Carbon dioxide reforming of
methane over 5 wt.% nickel calcium aluminate catalysts-effect of preparation
method, Catalysis Today 46 (1998) 175-183
[75] V.C.H. Kroll, H.M. Swaan, S. Lacombe, and C. Mirodatos, Methane Reforming
Reaction with Carbon Dioxide over Ni/SiO2 Catalyst, II. A Mechanistic Study,
Journal of Catalysis 164 (1997) 387–398
[76] A.R. McFarlane, I.P. Silverwood, R. Warringham, E.L. Norris, R.M. Ormerod,
C.D. Frost, S.F. Parker, S.F. and D. Lennon, The application of inelastic neutron
scattering to investigate the dry reforming of methane over an alumina-supported
nickel catalyst operating under conditions where filamentous carbon formation is
prevalent, Royal Society of Chemistry Advances 3 (2013) 16577–16589
[77] A. Boumaza, L. Favaro, J. Lédion, G. Sattonnay, J.B. Brubach, P. Berthet,
A.M. Huntz, P. Royc, R.Tétot, Transition alumina phases induced by heat treatment
of boehmite: An X-ray diffraction and infrared spectroscopy study, Journal of Solid
State Chemistry 182 (2009) 1171–1176
[78] F. Le Coz, L. Arurault, S. Fontorbes, V. Vilar, L. Datas, P. Winterton,
Chemical composition and structural changes of porous templates obtained by
anodizing aluminum in phosphoric acid electrolyte, Surface and Interface Analysis
42 (2010) 227-233

175
[79] T. Niu, L.M. Shen, Y. Liu, Preparation of meso-macroporous α-alumina using
carbon nanotube as the template for the mesopore and their application to the
preferential oxidation of CO in H2-rich gases, Journal of Porous Materials 20 (2013)
789-798
[80] J. Zhou, Z. Hua, W. Wu, Z. Liu, Z. Gao, Y. Zhu, Y. Chen and J. Shi,
Supplementary Information for: Hollow mesoporous zeolite microspheres:
Hierarchiral macro-/meso-/microporous structure and exceptionally enhanced
adsorption properties (2011)
[81] S. Y. Foo, C.K. Cheng, T.H. Nguyen, A.A. Adesina, Oxidative CO2 Reforming
of Methane on Alumina-Supported Co-Ni Catalyst, Ind. Eng. Chem. Res. 49 (2010)
10450–10458
[82] B. Coq, D. Tichit, S. Ribet, Co/Ni/Mg/Al layered double hydroxides as
precursors of catalysts for the hydrogenation of nitriles: hydrogenation of
acetonitrile. Journal of Catalysis 189(1) (2000) 117-128
[83] L. Chen, Q. Zhu, R. Wu, Effect of Co-Ni ratio on the activity and stability of
Co-Ni bimetallic aerogel catalyst for methane Oxy-CO2 reforming, International
Journal of Hydrogen Energy 36 (2011) 2128-2136
[84] M. Chareonpanich, N. Teabpinyok, and S. Kaewtaweesub, Effect of Nickel
Particle Size on Dry Reforming Temperature, Proceedings of the World Congress on
Engineering and Computer Science 2008, San Francisco, USA
[85] C. Li, Y.W. Chen, Temperature programmed reduction studies on Ni oxide
Alumina catalysts: effect of the preparation method, Thermochimica Acta 256
(1995) 457-465

176
[86] D.S. José-Alonso, M.J. Illán-Gómez, M.C. Román-Martínez, Low metal
content Co and Ni alumina supported catalysts for the CO2 reforming of methane,
International Journal of Hydrogen Energy 38 (2013) 2230-2239
[87] J.L. Ewbank, L. Kovarik, C.C. Kenvin and C. Sievers, Effect of preparation
methods on the performance of Co/Al2O3 catalysts for dry reforming of methane,
Green Chemistry 16 (2014) 885-896
[88] H.Y. Wang, E. Ruckenstein, Conversions of Methane to Synthesis Gas over
Co/γ-Al2O3 by CO2 and/or O2, Catalysis Letters 75 (2001) 13-18
[89] S. Andonova, C.N. de Avila, K. Arishtirova, J.M.C. Bueno, S. Damyanova,
Structure and redox properties of Co promoted Ni/Al2O3 catalysts for oxidative
steam reforming of ethanol, Applied Catalysis B: Environmental 105 (2011) 346–
360
[90] N.K. Nga, D.K. Chi, Synthesis, Characterizations and Catalytic Activity of
CoAl2O4 and NiAl2O4 Spinel Types oxides for NOx Selective Reduction, Advances
in Technology of Materials and Materials Processing, 6(2) (2004) 336-343
[91] S.J. Gregg, J.D.F. Ramsay, A Study of the Adsorption of Carbon Dioxide by
Alumina Using Infrared and Isotherm Measurements, Journal of Physical Chemistry,
73(5) (1969) 1243-1247
[92] M. Cabrejas Manchado, J.M. Guil, A. Pérez Masia, A. Ruiz Paniego, J. M.
Trejo Menayo, Adsorption of H2, O2, CO, and CO2 on a γ-Alumina: Volumetric and
Calorimetric Studies, Langmuir 10(3) (1994) 685-691
[93] J. Baltrusaitis, J.H. Jensen, V.H. Grassian, FTIR Spectroscopy Combined with
Isotope Labeling and Quantum Chemical Calculations to Investigate Adsorbed

177
Bicarbonate Formation Following Reaction of Carbon Dioxide with Surface
Hydroxyl Groups on Fe2O3 and Al2O3, Journal of Physical Chemistry B 110(24)
(2006) 12005-12016
[94] P. Galhotra, Carbon dioxide adsorption on nanomaterials, University of Iowa,
PhD Thesis (2010)
[95] O.B. Belskaya, I.G. Danilova, M.O. Kazakov, R.M. Mironenko, A.V. Lavrenov
and V.A. Likholobov, FTIR Spectroscopy of Adsorbed Probe Molecules for
Analyzing the Surface Properties of Supported Pt (Pd) Catalysts, in: T.
Theophanides (Ed), Infrared Spectroscopy-Materials Science, Engineering and
Technology (2012) 149-179
[96] S.U. Rege, R.T. Yang, A novel FTIR method for studying mixed gas adsorption
at low concentrations: H2O and CO2 on NaX zeolite and γ-alumina, Chemical
Engineering Science 56 (2001) 3781–3796
[97] M. Casarin, D. Falcomer, A. Glisenti, and A. Vittadini, Experimental and
Theoretical Study of the Interaction of CO2 with α-Al2O3, Inorganic Chemistry,
42(2) (2003) 436-445
[98] M. García-Dieguez, I.S. Pieta, M.C. Herrera, M.A. Larrubia, I. Malpartida, L.J.
Alemany, Transient study of the dry reforming of methane over Pt supported on
different γ-Al2O3, Catalysis Today 149 (2010) 380–387
[99] S. Takenaka, H. Ogihara, I. Yamanaka, K. Otsuka, Decomposition of methane
over supported-Ni catalysts: effects of the supports on the catalytic lifetime, Applied
Catalysis A: General 217 (2001) 101–110

178
[100] M.P. Rosynek, Isotherms and Energetics of Carbon Dioxide on γ-Alumina at
100-300°C, Journal of Physical Chemistry, 79(13) (1975) 1280-1284
[101] C.A. Bernardo, I. Alstrup and J.R. Rostrup-Nielsen, Carbon deposition and
steam reforming on silica-supported Ni-Cu catalysts, Journal of Catalysis 96 (1985)
517-534
[102] J.R. Rostrup-Nielsen, Sulfur-passivated nickel catalysts for carbon-free steam
reforming of methane, Journal of Catalysis 85(1) (1984) 31–43
[103] M.A. Ermakova, D.Y. Ermakov, A.L. Chuvilin, and G.G. Kuvshinov,
Decomposition of Methane over Iron Catalysts at the Range of Moderate
Temperatures: The Influence of Structure of the Catalytic Systems and the Reaction
Conditions on the Yield of Carbon and Morphology of Carbon Filaments, Journal of
Catalysis 201 (2001) 183–197
[104] C. Pham-Huu, R. Vieira, B. Loui, A. Carvalho, J. Amadou, T. Dintzer, M.J.
Ledoux, About the octopus-like growth mechanism of carbon nanofibers over
graphite supported nickel catalyst, Journal of Catalysis 240 (2006) 194–202
[105] J. Rass-Hansen, C.H. Christensen, J. Sehested, S. Helveg, J.R. Rostrup-
Nielsen and S. Dahl, Renewable hydrogen: carbon formation on Ni and Ru catalysts
during ethanol steam-reforming, Green Chemistry 9 (2007) 1016–1021
[106] S. Kaya, E. Erünal, R. Shaltaf, Ş. Ellialtıoğlu, D. Üner, On the Structure
Sensitivity of CO Oxidation on Alumina Supported Pd-Pt Bimetallic Catalysts,
Turkish Journal of Chemistry 33 (2009) 11-21
[107] M. Khoshtinat Nikoo and N.A.S. Amin, Thermodynamic analysis of carbon
dioxide reforming of methane in view of solid carbon formation, Fuel Processing
Technology 92 (2011) 678–691

179
[108] T.P. Braga, R.C.R. Santos, B.M.C. Sales, B.R. da Silva, A.N. Pinheiro, E.R.
Leite, A. Valentini, CO2 mitigation by carbon nanotube formation during dry
reforming of methane analyzed by factorial design combined with response surface
methodology, Chinese Journal of Catalysis 35 (2014) 514-523
[109] R.S. Ningthoujam, N.S. Gajbhiye and S. Sharma, Reduction Mechanism of
Ni2+ into Ni Nanoparticles Prepared from Different Precursors: Magnetic Studies,
Pramana Journal of Physics 72(3) (2009) 577-586
[110] N.R. NikRoselina, A. Azizan and Z. Lockman, Synthesis of Nickel
Nanoparticles Via Non-Aqueous Polyol Method: Effect of Reaction Time, Sains
Malaysiana 41(8) (2012) 1037–1042
[111] C.Y. Lu, H.H. Tseng, M.Y. Wey, L.Y. Liu, K.H. Chuang, Effects of the ratio
of Cu/Co and metal precursors on the catalytic activity over Cu-Co/Al2O3 prepared
using the polyol process, Materials Science and Engineering B 157 (2009) 105–112
[112] K.J. Carroll, J.U. Reveles, M.D. Shultz, S.N. Khanna, and E.E. Carpenter,
Preparation of Elemental Cu and Ni Nanoparticles by the Polyol Method: An
Experimental and Theoretical Approach, Journal of Physical Chemistry C 2011,
115, 2656–2664
[113] G.G. Couto, J.J. Klein, W.H. Schreiner, D.H. Mosca, A.J.A. de Oliveira,
A.J.G. Zarbina, Nickel nanoparticles obtained by a modified polyol process:
Synthesis, characterization, and magnetic properties, Journal of Colloid and
Interface Science 311 (2007) 461–468
[114] K.S. Chou and K.C. Huang, Studies on the chemical synthesis of nanosized
nickel powder and its stability, Journal of Nanoparticle Research 3 (2001) 127–132

180
[115] L. Bai, J. Fan, Y. Cao, F. Yuan, A. Zuo, Q. Tang, Shape-controlled synthesis
of Ni particles via polyol reduction, Journal of Crystal Growth 311 (2009) 2474–
2479
[116] G.S. Okram, A. Soni, R. Prasad, The pH-Controlled Particle Size Tuning of
Nanocrystalline Ni in Polyol Synthesis Method Without Additional Cappant,
Advanced Science Letters, 4 (1) (2011) 132-135
[117] E. Bayrakdar, T.Gürkaynak Altınçekiç, M.A.F. Öksüzömer, Effects of PVP on
the preparation of nanosized Al2O3 supported Ni catalysts by polyol method for
catalytic partial oxidation of methane, Fuel Processing Technology 110 (2013) 167–
17
[118] D. Ung, Y. Soumare, N. Chakroune, G. Viau, M.-J. Vaulay, V. Richard and F.
Fievet, Growth of Magnetic Nanowires and Nanodumbbells in Liquid Polyol,
Chemistry of Materials 19(8) (2007) 2084-2094
[119] M. Singh, M. Kumar, F. Štěpánek, P. Ulbrich, P. Svoboda, E. Santava, M.L.
Singla, Liquid-Phase Synthesis of Nickel Nanoparticles stabilized by PVP and study
of their structural and magnetic properties, Advanced Materials Letters 2(6) (2011)
409-414
[120] G. Viau, P. Toneguzzo, A. Pierrard, O. Acher, F. Fiévet-Vincent and F. Fiévet,
Heterogenous nucleation and growth of metal nanoparticles in polyols, Scripta
Materialia 44(8) (2001) 2263–2267
[121] K. Nouneh, M. Oyama, R. Diaz, M. Abd-Lefdil, I.V. Kityk, M. Bousmina,
Nanoscale synthesis and optical features of metallic nickel nanoparticles by wet
chemical approaches, Journal of Alloys and Compounds 509(19) (2011) 5882–5886

181
[122] B.K. Park, S. Jeong, D. Kim, J. Moon, S. Lim, J.S. Kim, Synthesis and size
control of monodisperse copper nanoparticles by polyol method, Journal of Colloid
and Interface Science 311 (2007) 417–424
[123] M. Dinç, Ö. Metin, S. Özkar, Water soluble polymer stabilized iron(0)
nanoclusters: A cost-effective and magnetically recoverable catalyst in hydrogen
generation from the hydrolysis of sodium borohydride and ammonia borane,
Catalysis Today 183 (2012) 10–16
[124] N. Laosiripojana, W. Sutthisripok, S. Assabumrungrat, Synthesis gas
production from dry reforming of methane over CeO2 doped Ni/Al2O3: Influence of
the doping ceria on the resistance toward carbon formation, Chemical Engineering
Journal 112 (2005)13–22
[125] C.E. Daza, A. Kiennemann, S. Moreno, R. Molina, Dry reforming of methane
using Ni–Ce catalysts supported on a modified mineral clay, Applied Catalysis A:
General 364 (2009) 65–74
[126] M. Ocsachoque, J. Bengoa, D. Gazzoli, M.G. Gonzalez, Role of CeO2 in
Rh/α-Al2O3 Catalysts for CO2 Reforming of Methane, Catalysis Letters 141 (2011)
1643–1650
[127] P. Kumar, Y. Sun and R.O. Idem, Nickel-Based Ceria, Zirconia, and Ceria–
Zirconia Catalytic Systems for Low-Temperature Carbon Dioxide Reforming of
Methane, Energy & Fuels 21 (2007) 3113–312
[128] A. Kambolis, H. Matralis, A. Trovarelli, C. Papadopoulou, Ni/CeO2-ZrO2
catalysts for the dry reforming of methane, Applied Catalysis A: General 377 (2010)
16–26

182
[129] C. de Leitenburg, A. Trovarelli and J. Kaspar, A Temperature-Programmed
and Transient Kinetic Study of CO2 Activation and Methanation over CeO2
Supported Noble Metals, Journal of Catalysis, 166 (1997) 98–107
[130] P. Kumar, Y. Sun, and R.O. Idem, Comparative Study of Ni-based Mixed
Oxide Catalyst for Carbon Dioxide Reforming of Methane, Energy&Fuels, 22(6)
(2008) 3575-3582
[131] N. Laosiripojana and S. Assabumrungrat, Catalytic dry reforming of methane
over high surface area ceria, Applied Catalysis B: Environmental 60 (2005) 107–116
[132] S. Wang, G.Q.M. Lu, Role of CeO2 in Ni/CeO2-Al2O3 catalysts for carbon
dioxide reforming of methane, Applied Catalysis B: Environmental 19 (1998) 267-
277
[133] K. Asami, X. Li, K. Fujimoto, Y. Koyama, A. Sakurama, N. Kometani, Y.
Yonezawa, CO2 reforming of CH4 over ceria-supported metal catalysts, Catalysis
Today 84 (2003) 27–31
[134] V.M. Gonzalez-Delacruz, F. Ternero, R. Pereniguez, A. Caballero, J.P.
Holgado, Study of nanostructured Ni/CeO2 catalysts prepared by combustion
synthesis in dry reforming of methane, Applied Catalysis A: General 384 (2010) 1–9
[135] T. Odedairo, J. Chen, Z. Zhu, Metal–support interface of a novel Ni–CeO2
catalyst for dry reforming of methane, Catalysis Communications 31 (2013) 25–31
[136] Z. Wang, X. Shao, A. Larcher, K. Xie, D. Dong, C.-Z. Li, A study on carbon
formation over fibrous NiO/CeO2 nanocatalysts during dry reforming of methane,
Fuels, Catalysis Today 216 (2013) 44– 49
183
[137] X. Du, D. Zhang, L. Shi, R. Gao, and J. Zhang, Morphology Dependence of
Catalytic Properties of Ni/CeO2, Journal of Physical Chemistry C, 116 ( 2012)
10009−10016
[138] I. Luisetto, S. Tuti, E.D. Bartolomeo, Co and Ni supported on CeO2 as
selective bimetallic catalyst for dry reforming of methane, International Journal of
Hydrogen Energy 37 (2012) 15992-15999
[139] P. Bharali, G. Thrimurthulu, L. Katta, B.M. Reddy, Preparation of highly
dispersed and thermally stable nanosized cerium–hafnium solid solutions over silica
surface: Structural and catalytic evaluation, Journal of Industrial and Engineering
Chemistry 18 (2012) 1128–1135
[140] F. Giordano, A. Trovarelli, C. de Leitenburg, and M. Giona, A Model for the
Temperature-Programmed Reduction of Low and High Surface Area Ceria, Journal
of Catalysis 193 (2000) 273–282
[141] G.R. Rao, Influence of metal particles on the reduction properties of ceria-
based materials studied by TPR, Bulletin of Materials Science, 22(2) (1999) 89-94
[142] A. Laachir, V. Perrichon, A. Badri, J. Lamotte, E. Catherine, J.C. Lavalley,
J.E. Fallah, L. Hilaire and F. le Normand, E. Quemere, G.N. Sauvion and O. Touret,
Reduction of CeO by Hydrogen Magnetic Susceptibility and Fourier-transform
Infrared, Ultraviolet and X-Ray Photoelectron Spectroscopy Measurements, Journal
of Chemical Society, Faraday Transactions, 87(10) (1991) 1601-1609
[143] E. Rogemond, R. Frety, V. Perrichon, M. Primet, S. Salasc, M. Chevrier, C.
Gauthier and F. Mathis, Preparation of Alumina-Supported Ceria. II. Measurement
of Ceria Surface Area after Impregnation with Platinum or Rhodium, Journal of
Catalysis 169 (1997) 120-131

184
[144] G. Kim, Ceria-promoted three-way catalysts for auto exhaust emission control,
Industrial & Engineering Chemistry Product Research and Development 21(2)
(1982) 267–274
[145] G. R. Rao, B. Mishra, Structural, redox and catalytic chemistry of ceria based
materials, Bulletin of the Catalysis Society of India 2 (2003) 122-134
[146] J. Kašpar, P. Fornasiero, and N. Hickey, Automotive catalytic converters:
current status and some perspectives, Catalysis Today 77 (2003) 419-449
[147] X. Wang, J.A. Rodriguez, J.C. Hanson, D. Gamarra, A. Martınez-Arias, M.
Fernandez-Garcıa, Ceria-based Catalysts for the Production of H2 Through the
Water-gas-shift Reaction: Time-resolved XRD and XAFS Studies, Topics in
Catalysis 49 (2008) 81–88
[148] P. Djinović, J. Batista, J. Levec, A. Pintar, Influence of morphological, redox
and surface acidity properties on WGS activity of CuO-CeO2 catalysts, Journal of
Chemical Engineering of Japan 42 (2009) 3-9
[149] R.J. Gorte, S. Zhao, Studies of the water-gas-shift reaction with ceria-
supported precious metals, Catalysis Today 104 (2005) 18–24
[150] L. Tang, M. Salamon, and M. R. D. Guire, Cerium oxide thin films on solid
oxide fuel cell anodes, Science of Advanced Materials, 2(1) (2010) 79–89
[151] V.V. Kharton, F:M. Figueiredo, L. Navarro, E.N. Naumovich, A.V.
Kovalevsky, A.A. Yaremchenko, A.P. Viskup, A. Carneiro, F.M.B. Marques, J.R.
Frade, Ceria-based materials for solid oxide fuel cells, Journal of Materials Science
36(5) (2001) 1105-1117

185
[152] Y.W. Zhang, R. Si, C.S. Liao, C.H. Yan, C.X. Xiao, and Y. Kou, Facile
Alcohothermal Synthesis, Size-dependent Ultraviolet Absorption and Enhanced CO
Conversion Activity of Ceria Nanocrystals, Journal of Physical Chemistry B, 107
(2003) 10159-10167
[153] N.M. Zholobak, V.K. Ivanov, A.B. Shcherbakov, A.S. Shaporev, O.S.
Polezhaeva, A.Y. Baranchikov, N.Y. Spivak, Y.D. Tretyakov, UV-shielding
property, photocatalytic activity and photocytotoxicity of ceria colloid solutions,
Journal of Photochemistry and Photobiology B. 102(1) (2011) 32-38
[154] S.K. Meher, G.R. Rao, Tuning, via Counter Anions, the Morphology and
Catalytic Activity of CeO2 Prepared under Mild Conditions, Journal of colloid and
interface science 373(1) (2012) 46-56
[155] H. Wu, L. Wang, Shape effect of microstructured CeO2 with various
morphologies on CO catalytic oxidation, Catalysis Communications, 12 (2011)
1374-1379
[156] Tana, M. Zhang, J. Li, H. Li, Y. Li, W. Shen, Morphology-dependent redox
and catalytic properties of CeO2 nanostructures: Nanowires, nanorods and
nanoparticles Catalysis Today, 148 (2009) 179-183
[157] F. Sadi, D. Duprez, F. Gérard, A. Miloudi, Hydrogen formation in the reaction
of steam with Rh/CeO2 Catalysts: a tool for characterising reduced centres of ceria,
Journal of Catalysis, 213(2) (2003) 226-234
[158] A.B. Kehoe, D.O. Scanlon, G.W. Watson, Role of Lattice Distortions in the
Oxygen Storage Capacity of Divalently Doped CeO2, Chemistry of Materials, 23
(2011) 4464-4468

186
[159] H.X. Mai, L.D. Sun, Y.W. Zhang, R. Si, W. Feng, H.P. Zhang, H.C. Liu,
C.H. Yan, Shape-Selective Synthesis and Oxygen Storage Behavior of Ceria
Nanopolyhedra, Nanorods and Nanocubes, Journal of Physical Chemistry B, 109
(2005) 24380-24385
[160] K. Zhou, Z. Yang, S. Yang, Highly Reducible CeO2 Nanotubes, Chemistry of
Materials 19 (2007) 1215-1217
[161] Z. Song, W. Liu, H. Nishiguchi, Quantitative analyses of oxygen
release/storage and CO2 adsorption on ceria and Pt–Rh/ceria, Catalysis
Communications 8 (2007) 725–730
[162] E. Rocchini, A. Trovarelli, J. Llorca, G.W. Graham, W.H. Weber, M.
Maciejewski and A. Baiker, Relationships between Structural/Morphological
Modifications and Oxygen Storage–Redox Behavior of Silica-Doped Ceria, Journal
of Catalysis 194 (2000) 461–478
[163] A. Trovarelli, Catalytic Properties of Ceria and CeO2-Containing Materials,
Catalysis Reviews, 38(4) (1996) 439-520
[164] A. Greiner, J.H. Wendorff, Electrospinning: A Fascinating Method for the
Preparation of Ultrathin Fibers, Angewandte Chemie Internationa Edition 46(30)
(2007) 5670-5703
[165] A. Holmgren, B. Andersson, D. Duprez, Interactions of CO with Pt/ceria
catalysts Applied Catalysis B, 22 (1999) 215-230

187
APPENDIX A
EFFLUENT MOLE FRACTIONS DURING REDOX
EXPERIMENTS ON COC, ESC AND CPC
Figure 106. Effluent mole fraction of O2 during
O2 pulse experiment on COC at 600°C (Step 3)
0.00
0.04
0.08
0.12
0.16
0 20 40 60 80 100
O2
(%)
Time (min)

188
Figure 107. Effluent mole fraction of O2 during
O2 pulse experiment on ESC at 600°C (Step 3)
Figure 108. Effluent mole fraction of O2 during
O2 pulse experiment on CPC at 600°C (Step 3)
0.00
0.01
0.02
0.03
0 10 20 30 40 50 60 70 80 90 100
O2
(%)
Time (min)
0.00
0.03
0.06
0.09
0.12
0 20 40 60 80 100
O2
(%)
Time (min)

189
Figure 109. Effluent mole fraction of CO during
CO pulse experiment on COC at 600°C (Step 4)
Figure 110. Effluent mole fraction of CO during
CO pulse experiment on ESC at 600°C (Step 4)
0.000
0.005
0.010
0.015
0.020
0.025
0 20 40 60 80 100 120
CO
(%
)
Time (min)
0.00
0.02
0.04
0.06
0.08
0.10
0 20 40 60 80 100 120
CO
(%)
Time (min)

190
Figure 111. Effluent mole fraction of CO during
CO pulse experiment on CPC at 600°C (Step 4)
Figure 112. Effluent mole fraction of CO2 during
CO pulse experiment on COC at 600°C (Step 4)
0.00
0.02
0.04
0.06
0.08
0.10
0 20 40 60 80 100 120
CO
(%
)
Time (min)
0.00
0.01
0.02
0.03
0.04
0.05
0.06
0 20 40 60 80 100 120
CO
2(%
)
Time (min)

191
Figure 113. Effluent mole fraction of CO2 during
CO pulse experiment on ESC at 600°C (Step 4)
Figure 114. Effluent mole fraction of CO2 during
CO pulse experiment on CPC at 600°C (Step 4)
0.00
0.02
0.04
0.06
0.08
0 20 40 60 80 100 120
CO
2(%
)
Time (min)
0.00
0.02
0.04
0.06
0.08
0.10
0 20 40 60 80 100 120
CO
2(%
)
Time (min)

192
Figure 115. Effluent mole fraction of O2 during
O2 pulse experiment on COC at 600°C (Step 5)
Figure 116. Effluent mole fraction of O2 during
O2 pulse experiment on ESC at 600°C (Step 5)
0.00
0.03
0.06
0.09
0.12
0.15
0.18
0 20 40 60 80 100
O2
(%)
Time (min)
0.00
0.02
0.04
0.06
0 20 40 60 80 100
O2
(%)
Time (min)

193
Figure 117. Effluent mole fraction of O2 during
O2 pulse experiment on CPC at 600°C (Step 5)
Figure 118. Effluent mole fraction of CO during
CO pulse experiment on COC at 600°C (Step 6)
0.00
0.02
0.04
0.06
0.08
0.10
0.12
0.14
0 20 40 60 80 100
O2
(%)
Time (min)
0.000
0.005
0.010
0.015
0.020
0.025
0 20 40 60 80 100 120
CO
(%
)
Time (min)

194
Figure 119. Effluent mole fraction of CO during
CO pulse experiment on ESC at 600°C (Step 6)
Figure 120. Effluent mole fraction of CO during
CO pulse experiment on CPC at 600°C (Step 6)
0.00
0.02
0.04
0.06
0.08
0 20 40 60 80 100 120
CO
(%
)
Time (min)
0.00
0.03
0.06
0.09
0 20 40 60 80 100 120
CO
(%
)
Time (min)

195
Figure 121. Effluent mole fraction of CO2 during
CO pulse experiment on COC at 600°C (Step 6)
Figure 122. Effluent mole fraction of CO2 during
CO pulse experiment on ESC at 600°C (Step 6)
0.00
0.01
0.02
0.03
0.04
0.05
0 20 40 60 80 100 120
CO
2(%
)
Time (min)
0.00
0.02
0.04
0.06
0.08
0.10
0 20 40 60 80 100 120
CO
2(%
)
Time (min)

196
Figure 123. Effluent mole fraction of CO2 during
CO pulse experiment on CPC at 600°C (Step 6)
0.00
0.03
0.06
0.09
0.12
0 20 40 60 80 100 120
CO
2(%
)
Time (min)

197
APPENDIX B
TESTING FOR TRANSPORT LIMITATIONS
Intraparticle mass transfer effects were investigated over Ni/Al2O3-700 catalyst by
changing the particle size at constant catalyst weight, feed composition and flow
rate. It was studied at 700°C and inlet CH4/CO2/Ar=1/1/3 stream with a total flow
rate of 50 sccm. Since the conversions did not change by decreasing the particle
size, it was concluded that pore diffusion resistances were not present.
Figure 124. The effect of catalyst particle size on CH4 and CO2 conversion,
: Ni/Al2O3-700-pellet, : Ni/Al2O3-700-powder
External mass transfer limitation was investigated over Ni/Al2O3-900 catalyst (0.5
mm<particle size<1 mm) at 700°C and CH4/CO2/Ar=1/1/3. The linear velocity was
changed by varying inlet flow rate and catalyst weight simultaneously at constant
contact time. As seen in Table 17 and Figure 125, CH4 conversion increased with an
increase in total flow rate from 50 sccm to 75 sccm. On the other it was not affected
0.0
0.2
0.4
0.6
0.8
1.0
0 50 100 150 200 250 300
CH
4co
nver
sion
Time (min)
0.0
0.2
0.4
0.6
0.8
1.0
0 50 100 150 200 250 300
CO
2co
nver
sio
n
Time (min)

198
by further flow rate increase. It was concluded that 50 sccm total flow rate was not
sufficient for eliminating the film mass transfer resistance during the harsh reaction
conditions of dry reforming of methane reaction.
Table 17. The influence of flow rate on conversion at constant contact time
Catalyst
weight (g)
CH4 flow
(sccm)
CO2 flow
(sccm)
Argon flow
(sccm)
CH4
Conversion
0.10 10 10 30 0.86-0.87
0.15 15 15 45 0.97-0.98
0.20 20 20 60 0.98-0.99
Figure 125. Experimental evaluation of the effect of interphase mass transport
: W=0.1 g and F=50 sccm, : W=0.15 g and F=75 sccm,
: W=0.2 g and F=100 sccm
0.7
0.8
0.9
1.0
0 20 40 60 80 100
CH
4co
nver
sion
Time (min)

199
CURRICULUM VITAE
Hale Ay
Middle East Technical University
Department of Chemical Engineering
06800 Ankara/Turkey
Personal Information
Nationality: Turkish (TC)
Date of birth: 07.08.1983
Marital status: Single
Education
Bachelor of Science Degree: Chemical Engineering, METU, 3.40/4.00 (2006)
Master of Science Degree: Chemical Engineering, METU, 3.64/4.00 (2008)
MS Thesis Topic: Single and Multicomponent Ion Exchange of Silver, Zinc and
Copper on Zeolite 4A Doctor of Philosophy: Chemical Engineering, METU, 3.86/4.00 (2014)
PhD Thesis Topic: Carbon Dioxide Reforming of Methane on Ni-based Bimetallic
Catalyts
Professional
2006-2013, Teaching and Research Assistant, Department of Chemical Engineering,
METU, Turkey
15 November 2012-15 November 2013, Scholar in TUBITAK 1002-112M561
Project- Carbon Dioxide Reforming of Methane on Ni-based Bimetallic Catalyts
1-15 April 2011, Visiting Scientist, Department of Inorganic Chemistry, Technical
University of Darmstadt, Germany
18 April-30 June 2011, Visiting Scientist, Department of Industrial Chemistry, Ruhr
University Bochum, Germany

200
National and International Conference Presentations
H. Ay, H. Yücel, ‘Single and Multicomponent Ion Exchange of Silver, Zinc and
Copper on Zeolite 4A’, EMCC-6 (6th Chemical Engineering Conference for
Colloborative Research in Eastern Mediterranen Countries), Antalya, Turkey, March
2010, Poster presentation
H. Ay, D. Üner, ‘Carbon Dioxide Reforming of Methane to Synthesis Gas Over
SBA-15 Supported Co-Ni Catalyst’, NCC-3 (3rd National Catalysis Conference),
Zonguldak, Turkey, May 2010, Poster presentation
H. Ay, D. Üner, ‘Effect of Co on the Performance of Ni/Al2O3 Catalyts in Dry
Reforming of Methane’, EFCATS Summer School (Catalysis & Surface Science for
Renewables & Energy), İzmir, Turkey, September 2010, Poster presentation
H. Ay, D. Üner, ‘Microcalorimetric and FTIR Studies of Al2O3 supported Ni, Co
and Ni-Co Catalysts’, EuropaCat X, Glasgow, Scotland, September 2011, Poster
presentation
H. Ay, D. Üner, ‘What is the Precursor for Coke Formation During Dry Reforming
of Methane over Ni-based Catalysts?’ NCC-4 (4th National Catalysis Conference),
Kocaeli, Turkey, March 2012, Poster presentation
H. Ay, M. Naumann, K. Kähler, T. Franzke, J. Schneider, M. Muhler, D. Üner, ‘The
effect of morphology on using CO2 as oxidizing agent for CeOx synthesized via
electrospinning’, ICC-5 (5th International Catalysis Conference), Münich, Germany,
July 2012, Poster presentation
H. Ay, D. Üner, ‘How does Cobalt Improve the Performance of Ni-based Catalaysts
in Dry Reforming of Methane Reaction?’ , UKMK 10 (10. National Chemical
Engineering Conference), İstanbul, Turkey, September 2012, Oral presentation
H. Ay, D. Üner, ‘Creating Metallic Sites for Methane Adsorption by Polyol Process
in Dry Reforming of Methane’ , EuropaCat XI, Lyon, France, September 2013,
Poster presentation
H. Ay, D. Üner, ‘Preparation of Ni/Al2O3 Catalysts by Polyol Method for Carbon
Dioxide Reforming of Methane’, NCC-5 (5th National Catalysis Conference),
Adana, Turkey, April 2014, Oral presentation
H. Ay, D. Üner, ‘Carbon Nanotubes as Side Product of Dry Reforming of Methane’,
ISCRE 23, 23rd International Symposium on Chemical Reaction Engineering,
Bangkok, Thailand, September 2014, Abstract was accepted as Oral presentation.

201
Publications
H. Ay, D. Üner, ‘Synthesis and Characterization of Al2O3 Supported Ni Polyol
Catalysts for Dry Reforming of Methane’ manuscript in preparation
H. Ay, D. Üner, ‘Carbon Nanotubes as Side Product of Dry Reforming of Methane’
manuscript in preparation
H. Ay, D. Üner, ‘CeO2 supported Ni, Co and Ni-Co Catalysts for Dry Reforming of
Methane’ manuscript in preparation
Foreign Languages
Advanced English
Foreign Language Proficiency Examination for State Employees: 90/100 (May 2009)
Interuniversity Board Foreign Language Examination: 97.5/100 (March 2009)
Foreign Language Examination: 86.25 (April 2013) Beginner German
Computer skills
Microsoft Office (Word, Excel, PowerPoint, Front Page)
Origin, Fortran, Chemcad, Polymath
Laboratory Equipment Usage Ability
Mass spectrometry
Gas Chromatography
FTIR (Fourier Transform Infrared Radiation)
Microcalorimetry
BET (Surface Area Measurement)
TGA (Thermal Gravimetric Analysis)