carbon footprint assessment - upper arlington, · pdf filetailored to your needs, the carbon...
TRANSCRIPT

Carbon Footprint Assessment for City of Upper Arlington, Ohio
Prepared by

Executive Summary
This Carbon Footprint Assessment was prepared by MORPC and Ameresco, Inc. Ameresco is a founding member of the Center for Energy and environment and is the nation’s largest independent energy services company. This MORPC service was created to provide member communities with a solution framework to help assess and measure your carbon footprint, and identify possible targets for reducing emissions. The steps taken to create this Carbon Footprint Assessment are as follows:
1. Define what is included in the your current Carbon Footprint 2. Set your Baseline Footprint 3. Familiarize ourselves with the facilities and activities that create your baseline
and calculate and analyze your Footprint 4. Develop action steps to impact your Footprint.
Environmental credentials are now more important than ever before and high on the list of your citizens and employees alike. More sustainable operations give you the MORPC member and your citizens’ competitive and environmental advantages. In addition, identifying efficiencies and adopting new ways of working can reduce your cost to operate. It’s a win-win proposition for your community and the environment.
Reducing your carbon footprint can mean lowering your energy use, an immediate benefit in times of high energy prices. Changing behaviors can often be as important as changing your physical infrastructure. Some benefits of Carbon Footprint reductions might be:
• Assist with possible regulatory compliance both now and in the future. • Mitigate Climate Change impacts within your operations • Attract green investments to your community • Improve your reputation among your citizens and the Central Ohio Community.
Tailored to your needs, the Carbon Footprint Assessment determines the carbon output of your facilities and fleet and enables scenario planning to model how energy and emissions reductions can be improved. The preparation of this assessment involved extensive information gathering and numerous site visits throughout the City of Upper Arlington. Included within the report is a set of recommendations and suggestions on how The City can reduce these emissions.
Below is a quick snapshot of the Cities current emissions. More detail can be found in the following sections.

.
Source Emissions % TonsBuilding 4,386.8 N/A N/ATransportation 2,157.9 N/A N/AStreet Lights 844.2 N/A N/ATree Canopy (116.5) N/A N/ASolid Waste (593.6) N/A N/ATraffic Signs 371.8 N/A N/A
Total 7,051 N/A N/A
Absolute Emissions (MT eCO2)
2006 Change
Emissions By Source
BuildingTransportationWaste Water TreatmentStreet LightsTree CoverSolid WasteTraffic Signs

Carbon Footprint for City of Upper Arlington, Ohio “Page content is subject to Confidentiality Restrictions” MORPC in partnership with Ameresco Section 1: Methodology June 26, 2008 Page 1
Section 1: Methodology
The intent of this study is to determine the overall production of Green House Gases which results due to the daily operations of the Owner. This overall production is then categorized and benchmarked. This identifies the areas which are either the largest producers of Green House Gases or relatively large when compared to similar activities at other municipalities, which in turn will help the Owner strategically target areas for improvement.
The methodology that comprises this report are divided into four major steps, with each step covering several activities and building on the previous. Following are the major steps which were undertaken for this analysis:
1. Data Gathering
2. Site Survey
3. Calculations
4. Report Generation
Thanks to the City of Columbus and the OSU Center for Resilience for providing much of the calculation methodology used to develop this report.

Carbon Footprint for City of Upper Arlington, Ohio “Page content is subject to Confidentiality Restrictions” MORPC in partnership with Ameresco Section 1: Methodology June 26, 2008 Page 2
Data Gathering
During this critical first phase of the analysis, a wide variety of data is collected from the user. Any historical records concerning operations which affect Green House Gas emissions are supplied. These records vary depending on the type of operations and record keeping practices for each particular user, but may include:
Historical utility bills
Waste production records
Recycling production records
Facility square footage
Commuter and vehicle travel records
Water and Waste Water Treatment Plant productions
Green canopy data
This data is reviewed in detail to begin understanding how the user generates Green House Gas emissions through normal operations.
Site Survey
With a preliminary understanding of the operations affecting Green House Gas production, a site survey is conducted throughout the users’ facilities and properties. During this site survey a thorough understanding of how people interact with the facilities is gained, an assessment of energy consuming devices is performed, and a general understanding of the operations is obtained. The goals of the site survey process include:
1. Verify data gathered is accurate, and determine other operations which may require further data gathering efforts.
2. Gain a first hand understanding of the users operations and facilities to ensure an accurate carbon footprint analysis.
3. Identify potential areas for improvement and reduction of the current carbon footprint.

Carbon Footprint for City of Upper Arlington, Ohio “Page content is subject to Confidentiality Restrictions” MORPC in partnership with Ameresco Section 1: Methodology June 26, 2008 Page 3
Calculations
Calculations, using a Microsoft Excel spreadsheet, are done to determine the actual affect of each operation on the overall carbon footprint for the user. As much of these calculations are performed using the data and observations found during the first two steps of this process as possible. Some assumptions are necessary in order to complete the calculations. Any assumptions made are detailed throughout the report.
A key factor in the Green House Gas calculations is the emission factor of each operation. The table on the next page details the emissions factors used throughout this analysis.
Report Generation
A verification version of this report was generated and sent to the user. This was done to ensure the accuracy of the data collected, site survey interpretations, and assumptions. Comments received during this verification process were then incorporated into this final version of the report.
Next Steps
It should be noted that the report generated from this analysis should simply be the first step in the ongoing journey of emissions reductions. It is the responsibility of the municipality to take the data generated for this report and turn it into an action plan for future environmental impact. Updating the data in this report on an annual basis will help the municipality track progress. In time, new technologies will become available to further reduce specific areas identified in this report.
No decrease in emissions will be realized by simply reading this report, although it can be the cornerstone of a solid plan for the municipality to become a leader in carbon footprint reduction and to positively impact the environment for future generations.

Carbon Footprint for City of Upper Arlington, Ohio “Page content is subject to Confidentiality Restrictions” MORPC in partnership with Ameresco Section 1: Methodology June 26, 2008 Page 4
Emission Source Unit EF (MT eCO2/ unit) Documentation WebsiteElectricity kWh 0.000977 Updated State-level Greenhouse Gas Emission Coefficients for Electricity Generation 1998-2000. EIA ftp://ftp.eia.doe.gov/pub/oiaf/1605/cdrom/pdf/e-supdoc.pdfNatural Gas MMBtu 0.052944 Inventory of U.S. Greenhouse Gas Emissions and Sinks: 1990-2004 (April 2003) EPA 430-R-06-002; Annex 3 http://yosemite.epa.gov/oar/globalwarming.nsf/content/ResourceCenterPuCanopy acre -0.335561 extrapolated from CITYgreen analysis for downtown Columbus
VMT 0.000440 Model Year '96 Gasonline Passenger Vehicle from EIA SEIT Spreadsheet http://www.eia.doe.gov/oiaf/1605/rrfi/excel/SEIT%20Draft%20Nov2006Gal Gasoline 0.008782 EIA SEIT 1605(b) Technical Guidelines http://www.eia.doe.gov/oiaf/1605/techassist.htmlGal Diesel 0.010047 EIA SEIT 1605(b) Technical GuidelinesGal B5 0.009544 EIA SEIT 1605(b) Technical GuidelinesGal B20 0.008033 EIA SEIT 1605(b) Technical GuidelinesGal B100 0.000000 EIA SEIT 1605(b) Technical GuidelinesGal E85 0.001315 EIA SEIT 1605(b) Technical Guidelines
Waste Landfilled short ton 0.151499 US EPA WARM Model & Solid Waste Management and Greenhouse Gases Report http://epa.gov/climatechange/wycd/waste/SWMGHGreport.htmlWaste Recycled short ton -2.852374 US EPA WARM Model & Solid Waste Management and Greenhouse Gases Report http://epa.gov/climatechange/wycd/waste/SWMGHGreport.html
Transportation
Greenhouse Gas Emission Factors

Carbon Footprint for City of Upper Arlington, Ohio “Page content is subject to Confidentiality Restrictions” MORPC in partnership with Ameresco Section 2: Existing Operations June 26, 2008 Page 1
Section 2: Existing Operations
A thorough understanding of the current facilities and operations is a key component to the carbon footprint analysis. Without this analysis, neither an accurate calculation of the current environmental impact will be determined nor can an appropriate plan of action to reduce this impact be put into place. The information throughout this section documents existing City parameters that affect the carbon footprint. This includes facility conditions and energy usage, as well as operational details concerning waste streams, commuter travel, tree canopy, and others.
Please note that the electrical usage for the months of November and December (2007) is extrapolated from the consolidated data. Overall usage for these months was provided. It was assumed that the overall usage for each facility, and for each of these months, is the same proportion as the January and February consolidated usage.
Municipal Services Center
The Municipal Services Center, located at 3600 Tremont Rd is the central facility for public use and department offices throughout the City of Upper Arlington. The City Manager, Parks & Recreation, as well as many other department offices are located in this facility. Also located at the Municipal Services Center are large rooms for City Council and public meetings, and public art displays throughout the lobby and corridor areas. This facility is heavily utilized throughout a wide range of activities.
Overall, the facility is in satisfactory condition. No major concerns with comfort or indoor air quality issues were noted during the survey. In 1998, a major upgrade was implemented through the use of an Energy Savings Performance Contract (ESPC) process.
This upgrade replaced all of the major HVAC components and included a Variable Air Volume (VAV) system for the major Air Handling Units (AHU). A subsequent ESPC project in 2004 installed a new Direct Digital Control (DDC) system throughout the facility.

Carbon Footprint for City of Upper Arlington, Ohio “Page content is subject to Confidentiality Restrictions” MORPC in partnership with Ameresco Section 2: Existing Operations June 26, 2008 Page 2
New Energy Efficient Equipment Installed During Previous ESPC Projects
Municipal Services center
Electric Usage BaselineBaseline Units: kWhAccount #'s: 1080727632, Meter #'s: 83754447Square Footage:
Month 2006 2007 2008 2009Jan 0 70,240 0 0 70,240 70,240 70,240Feb 0 52,000 0 0 52,000 52,000 52,000Mar 0 63,040 0 0 63,040 63,040 63,040Apr 0 61,600 0 0 61,600 61,600 61,600May 0 63,040 0 0 63,040 63,040 63,040Jun 0 78,880 0 0 78,880 78,880 78,880Jul 0 72,160 0 0 72,160 72,160 72,160Aug 0 74,560 0 0 74,560 74,560 74,560Sep 0 82,080 0 0 82,080 82,080 82,080Oct 0 72,320 0 0 72,320 72,320 72,320Nov 0 82,552 0 0 82,552 82,552 82,552Dec 0 111,509 0 0 111,509 111,509 111,509
Totals 0 883,981 0 0 883,981 883,981 883,981Energy Utilization Index 24.8 kWh/sqft
84.8 kBtu/sqft
Natural Gas BaselineBaseline Units: CCFAccount #'s: Meter #'s:
Month 2006 2007 2008 2009Jan 0 8,091 0 0 8,091 8,091 8,091Feb 0 828 0 0 828 828 828Mar 0 1,183 0 0 1,183 1,183 1,183Apr 0 2,868 0 0 2,868 2,868 2,868May 0 3,254 0 0 3,254 3,254 3,254Jun 0 638 0 0 638 638 638Jul 0 121 0 0 121 121 121Aug 0 341 0 0 341 341 341Sep 0 403 0 0 403 403 403Oct 0 57 0 0 57 57 57Nov 1,014 0 0 0 1,014 1,014 1,014Dec 1,913 0 0 0 1,913 1,913 1,913
Totals 2,927 17,785 0 0 20,712 20,712 20,712Energy Utilization Index 0.58 CCF/sqft
58.2 kBtu/sqft
Total Monthly Gas Usage Average of all Data
Most Recent 12 Months
Selected Baseline
Selected Baseline
35,581
Total Monthly Electric Usage Average of all Data
Most Recent 12 Months

Carbon Footprint for City of Upper Arlington, Ohio “Page content is subject to Confidentiality Restrictions” MORPC in partnership with Ameresco Section 2: Existing Operations June 26, 2008 Page 3
All of these HVAC systems have been well maintained and are operating in satisfactory condition. A project was completed in 2005 to upgrade the lighting system to energy efficient lamps and ballasts, as well as strategically placed occupancy sensor controls. The overall condition of the building envelope and roof seem to be good as well. The table below documents the historical utility data provided during this analysis.
Public Services Center
The City of Upper Arlington maintains a large fleet of vehicles and equipment to maintain roads, grounds, and other public spaces. These activities require a large space for vehicle maintenance and storage. The Public Services Center facility located at 4100 Robert Road has both a newer addition for the public works offices, as well as older facility which is mainly garage space. A City owned refueling station for both gasoline and diesel fuel is located here as well. The total facility area is estimated to be 55,350 square feet.
The administration area of the facility utilizes an energy efficient Water Source Heat Pump (WSHP) system. Controls for the WSHP are local thermostats without programmable capabilities. A boiler and cooling tower system serve the WSHP’s. Several issues were noted with the cooling tower, including that it is undersized and it is corroding badly. A dedicated Make-up Air Unit (MAU) is utilized to provide fresh air to the areas served by the WSHP’s. The lighting throughout this space is primarily T12 lighting, although the City is currently planning a lighting retrofit for this entire facility.
Existing Cooling Tower and Typical Thermostat Serving Administration Area
Several make-up air units and radiant heaters are located throughout the garage areas of the facility. The majority of the MAU’s are controlled through a CO2 sensor. As CO2 levels rise in the space due to the operation of vehicles, these MAU’s will automatically turn on/off to maintain proper indoor air quality.

Carbon Footprint for City of Upper Arlington, Ohio “Page content is subject to Confidentiality Restrictions” MORPC in partnership with Ameresco Section 2: Existing Operations June 26, 2008 Page 4
There is no central cooling system in these areas. In the past the facility utilized used oil to meet some heating needs. This has been abandoned however due to EPA concerns with the equipment which was burning the used oil, which is now disposed of through a local recycler.
Existing Garage Area and Multiple MAU’s Serving the Garage
The following table shows the historical utility usage for this facility.
Public Services Center
Electric Usage BaselineBaseline Units: kWhAccount #'s: 1063261631, Meter #'s: 41115186Square Footage:
Month 2006 2007 2008 2009Jan 0 52,000 0 0 52,000 52,000 52,000Feb 0 55,840 0 0 55,840 55,840 55,840Mar 0 57,600 0 0 57,600 57,600 57,600Apr 0 47,520 0 0 47,520 47,520 47,520May 0 42,560 0 0 42,560 42,560 42,560Jun 0 52,320 0 0 52,320 52,320 52,320Jul 0 50,400 0 0 50,400 50,400 50,400Aug 0 52,960 0 0 52,960 52,960 52,960Sep 0 60,160 0 0 60,160 60,160 60,160Oct 0 47,840 0 0 47,840 47,840 47,840Nov 0 88,648 0 0 88,648 88,648 88,648Dec 0 82,552 0 0 82,552 82,552 82,552
Totals 0 690,401 0 0 690,401 690,401 690,401Energy Utilization Index 12.5 kWh/sqft
42.6 kBtu/sqft
Natural Gas BaselineBaseline Units: CCFAccount #'s: Meter #'s:
Month 2006 2007 2008 2009Jan 0 6,087 0 0 6,087 6,087 6,087Feb 0 4,882 0 0 4,882 4,882 4,882Mar 0 1,874 0 0 1,874 1,874 1,874Apr 0 4,824 0 0 4,824 4,824 4,824May 0 4,673 0 0 4,673 4,673 4,673Jun 0 1,392 0 0 1,392 1,392 1,392Jul 0 55 0 0 55 55 55Aug 0 26 0 0 26 26 26Sep 0 37 0 0 37 37 37Oct 0 45 0 0 45 45 45Nov 208 0 0 0 208 208 208Dec 1,520 0 0 0 1,520 1,520 1,520
Totals 1,728 23,895 0 0 25,622 25,622 25,622Energy Utilization Index 0.46 CCF/sqft
46.3 kBtu/sqft
Total Monthly Gas Usage Average of all Data
Most Recent 12 Months
Selected Baseline
Selected Baseline
55,350
Total Monthly Electric Usage Average of all Data
Most Recent 12 Months

Carbon Footprint for City of Upper Arlington, Ohio “Page content is subject to Confidentiality Restrictions” MORPC in partnership with Ameresco Section 2: Existing Operations June 26, 2008 Page 5
Fire Stations
There are currently three fire stations throughout Upper Arlington. All three are included in this analysis, however it should be noted that Fire Station #73 is scheduled to be closed. A new facility is to be constructed at the current location of Fire Station #72 which will house equipment and staff from both existing Stations #72 and #73.
Station #71 is an older facility which used to be the City Hall. A 1990 project did upgrade the facility, although equipment installed at that time is beginning to reach the end of its useful life. T12 lighting with magnetic ballasts are predominant throughout. The high bay areas used for vehicle storage utilize efficient Infrared Radiant heating, as well as carbon monoxide sensors to control exhaust fans.
Since Stations #72 and #73 are to be consolidated into a new facility soon, details to the lighting and HVAC systems in these facilities are not included at this time. The table below documents the historical utility usage at all three of these facilities combined.
Fire Stations
Electric Usage BaselineBaseline Units: kWhAccount #'s: 1040584611 (Station #71), 1032459531 (Station #72), 1058047332 (Station #73)Meter #'s: 321094839, 38208813, 86312856Square Footage:
Month 2006 2007 2008 2009Jan 0 27,634 0 0 27,634 27,634 27,634Feb 0 21,752 0 0 21,752 21,752 21,752Mar 0 31,059 0 0 31,059 31,059 31,059Apr 0 20,454 0 0 20,454 20,454 20,454May 0 20,640 0 0 20,640 20,640 20,640Jun 0 26,111 0 0 26,111 26,111 26,111Jul 0 25,828 0 0 25,828 25,828 25,828Aug 0 26,631 0 0 26,631 26,631 26,631Sep 0 31,371 0 0 31,371 31,371 31,371Oct 0 23,000 0 0 23,000 23,000 23,000Nov 0 34,532 0 0 34,532 34,532 34,532Dec 0 43,870 0 0 43,870 43,870 43,870
Totals 0 332,882 0 0 332,882 332,882 332,882Energy Utilization Index 20.3 kWh/sqft
69.2 kBtu/sqft
Natural Gas BaselineBaseline Units: CCFAccount #'s: Meter #'s:
Month 2006 2007 2008 2009Jan 0 1,520 0 0 1,520 1,520 1,520Feb 0 2,988 0 0 2,988 2,988 2,988Mar 0 1,652 0 0 1,652 1,652 1,652Apr 0 1,725 0 0 1,725 1,725 1,725May 0 625 0 0 625 625 625Jun 0 82 0 0 82 82 82Jul 0 294 0 0 294 294 294Aug 0 201 0 0 201 201 201Sep 0 142 0 0 142 142 142Oct 0 257 0 0 257 257 257Nov 684 0 0 0 684 684 684Dec 1,190 0 0 0 1,190 1,190 1,190
Totals 1,874 9,487 0 0 11,361 11,361 11,361Energy Utilization Index 0.69 CCF/sqft
69.2 kBtu/sqft
Total Monthly Gas Usage Average of all Data
Most Recent 12 Months
Selected Baseline
Selected Baseline
16,420
Total Monthly Electric Usage Average of all Data
Most Recent 12 Months

Carbon Footprint for City of Upper Arlington, Ohio “Page content is subject to Confidentiality Restrictions” MORPC in partnership with Ameresco Section 2: Existing Operations June 26, 2008 Page 6
Senior Center
The existing Senior Center was built in the mid 1950’s as an elementary school. It consists of three (3) separate pods, each with multiple mechanical systems. A total of 12 standard efficiency furnaces, most of which are older, are installed throughout the pods. There is also one small pod with one furnace. All of the HVAC systems utilize a programmable thermostat, although they may not all be programmed for night setback. T12 lighting with magnetic ballasts are installed throughout the facility.
Existing Furnaces and Building Envelope at the Senior Center
The building envelope is in need of updating. The overall aesthetics of the facility do not match the remainder of the City décor. In addition, the windows are very old and inefficient and may need replaced. A small irrigation system feeds part of the grounds and includes a rain water sensor. The table below shows the historical energy usage of this facility. This site has the highest Energy Utilization Index (EUI) of all the facilities included in this report. Based on the conditions and the current energy usage, a Facility Condition Index (FCI) analysis could be completed to help determine the appropriate course of action. An FCI analysis will aid the City regarding decisions to either renovate or construct a new facility.

Carbon Footprint for City of Upper Arlington, Ohio “Page content is subject to Confidentiality Restrictions” MORPC in partnership with Ameresco Section 2: Existing Operations June 26, 2008 Page 7
Senior Center
Electric Usage BaselineBaseline Units: kWhAccount #'s: 1046160911, Meter #'s: 217762403Square Footage:
Month 2006 2007 2008 2009Jan 0 7,280 0 0 7,280 7,280 7,280Feb 0 7,880 0 0 7,880 7,880 7,880Mar 0 6,360 0 0 6,360 6,360 6,360Apr 0 7,040 0 0 7,040 7,040 7,040May 0 7,160 0 0 7,160 7,160 7,160Jun 0 10,480 0 0 10,480 10,480 10,480Jul 0 12,360 0 0 12,360 12,360 12,360Aug 0 11,800 0 0 11,800 11,800 11,800Sep 0 15,600 0 0 15,600 15,600 15,600Oct 0 10,640 0 0 10,640 10,640 10,640Nov 0 12,510 0 0 12,510 12,510 12,510Dec 0 11,557 0 0 11,557 11,557 11,557
Totals 0 120,667 0 0 120,667 120,667 120,667Energy Utilization Index 16.0 kWh/sqft
54.7 kBtu/sqft
Natural Gas BaselineBaseline Units: CCFAccount #'s: Meter #'s:
Month 2006 2007 2008 2009Jan 0 1,315 0 0 1,315 1,315 1,315Feb 0 2,440 0 0 2,440 2,440 2,440Mar 0 1,391 0 0 1,391 1,391 1,391Apr 0 812 0 0 812 812 812May 0 148 0 0 148 148 148Jun 0 114 0 0 114 114 114Jul 0 38 0 0 38 38 38Aug 0 86 0 0 86 86 86Sep 0 66 0 0 66 66 66Oct 0 103 0 0 103 103 103Nov 1,394 0 0 0 1,394 1,394 1,394Dec 893 0 0 0 893 893 893
Totals 2,288 6,513 0 0 8,801 8,801 8,801Energy Utilization Index 1.17 CCF/sqft
116.8 kBtu/sqft
Total Monthly Gas Usage Average of all Data
Most Recent 12 Months
Selected Baseline
Selected Baseline
7,534
Total Monthly Electric Usage Average of all Data
Most Recent 12 Months

Carbon Footprint for City of Upper Arlington, Ohio “Page content is subject to Confidentiality Restrictions” MORPC in partnership with Ameresco Section 2: Existing Operations June 26, 2008 Page 8
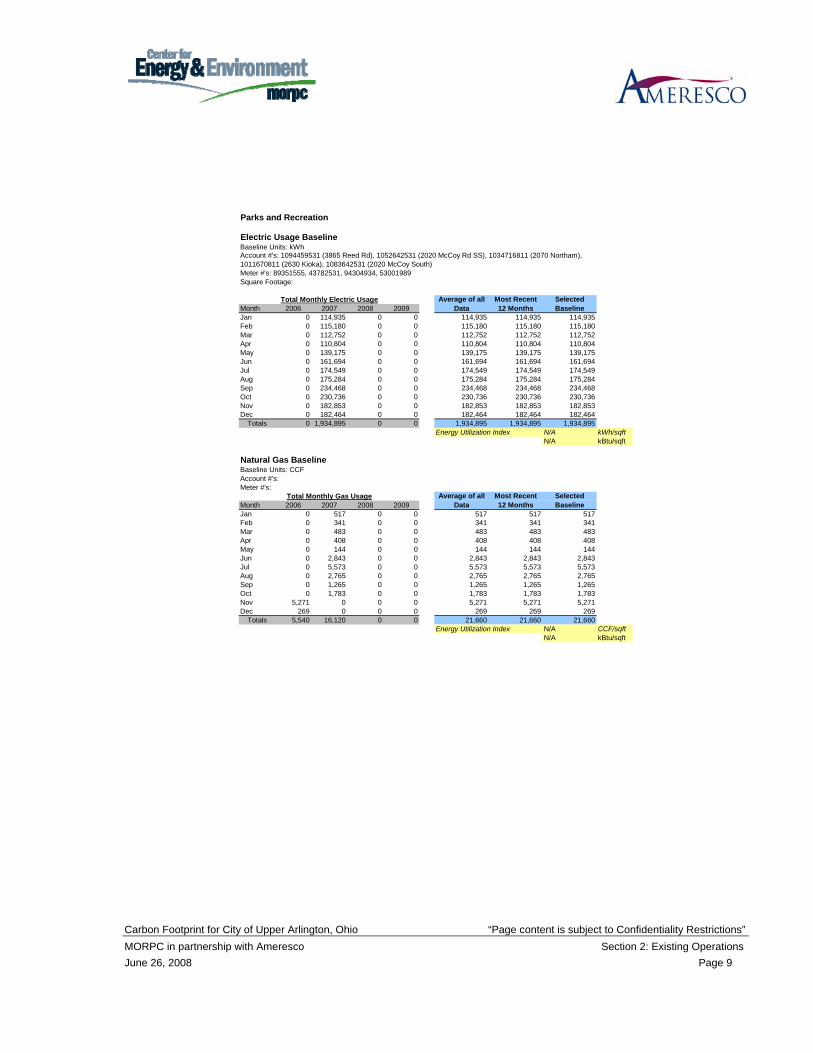
Parks and Recreation
The City of Upper Arlington has an array of parks and recreation opportunities available for public use. The highlight of these facilities are three swimming pools, with the “Reed Road Water Park” being the newest and most widely utilized. Due to the nature of pools, these are also the most energy intensive of the parks and recreation operations. Both the Devon Pool and the Reed Road Water Park have pool heaters, and Tremont Pool is the only facility with no heated pool(s). None of these sites have comfort heating available, as all are shutdown during the winter months. It appears that many of the pool filters are older, although discussions with maintenance indicate that they are all in good condition and are operating well.
Devon Pool and Reed Road Water Park
The irrigation system at the Tremont tennis courts where recently modified to reduce the number of sprinkler heads. This sprinkler system, as well as the others throughout the City, all have timer controls in place. There are plans for a new irrigation system to be installed at the Reed Road water park which will also include timer controls.
Carbon Footprint for City of Upper Arlington, Ohio “Page content is subject to Confidentiality Restrictions” MORPC in partnership with Ameresco Section 2: Existing Operations June 26, 2008 Page 9
Parks and Recreation
Electric Usage BaselineBaseline Units: kWh
Meter #'s: 89351555, 43782531, 94304934, 53001989Square Footage:
Month 2006 2007 2008 2009Jan 0 114,935 0 0 114,935 114,935 114,935Feb 0 115,180 0 0 115,180 115,180 115,180Mar 0 112,752 0 0 112,752 112,752 112,752Apr 0 110,804 0 0 110,804 110,804 110,804May 0 139,175 0 0 139,175 139,175 139,175Jun 0 161,694 0 0 161,694 161,694 161,694Jul 0 174,549 0 0 174,549 174,549 174,549Aug 0 175,284 0 0 175,284 175,284 175,284Sep 0 234,468 0 0 234,468 234,468 234,468Oct 0 230,736 0 0 230,736 230,736 230,736Nov 0 182,853 0 0 182,853 182,853 182,853Dec 0 182,464 0 0 182,464 182,464 182,464
Totals 0 1,934,895 0 0 1,934,895 1,934,895 1,934,895Energy Utilization Index N/A kWh/sqft
N/A kBtu/sqft
Natural Gas BaselineBaseline Units: CCFAccount #'s: Meter #'s:
Month 2006 2007 2008 2009Jan 0 517 0 0 517 517 517Feb 0 341 0 0 341 341 341Mar 0 483 0 0 483 483 483Apr 0 408 0 0 408 408 408May 0 144 0 0 144 144 144Jun 0 2,843 0 0 2,843 2,843 2,843Jul 0 5,573 0 0 5,573 5,573 5,573Aug 0 2,765 0 0 2,765 2,765 2,765Sep 0 1,265 0 0 1,265 1,265 1,265Oct 0 1,783 0 0 1,783 1,783 1,783Nov 5,271 0 0 0 5,271 5,271 5,271Dec 269 0 0 0 269 269 269
Totals 5,540 16,120 0 0 21,660 21,660 21,660Energy Utilization Index N/A CCF/sqft
N/A kBtu/sqft
Account #'s: 1094459531 (3865 Reed Rd), 1052642531 (2020 McCoy Rd SS), 1034716811 (2070 Northam), 1011670811 (2630 Kioka), 1083642531 (2020 McCoy South)
Total Monthly Gas Usage Average of all Data
Most Recent 12 Months
Selected Baseline
Selected Baseline
Total Monthly Electric Usage Average of all Data
Most Recent 12 Months
Carbon Footprint for City of Upper Arlington, Ohio “Page content is subject to Confidentiality Restrictions” MORPC in partnership with Ameresco Section 2: Existing Operations June 26, 2008 Page 10
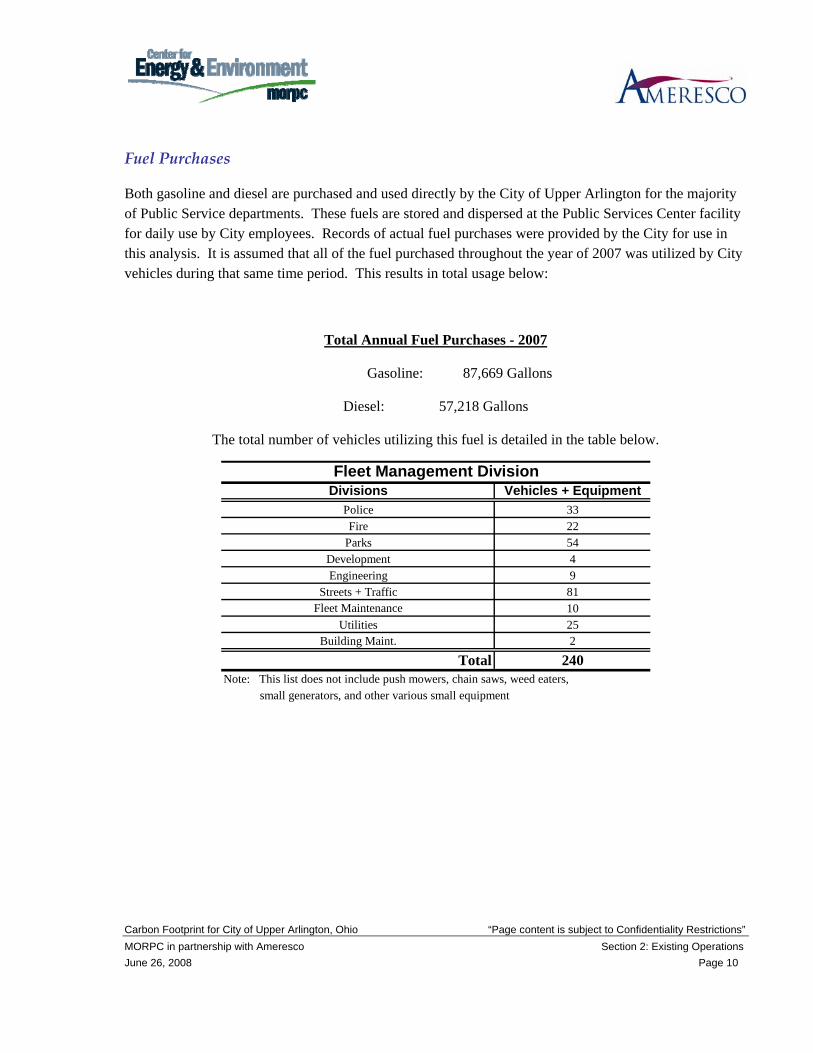
Fuel Purchases
Both gasoline and diesel are purchased and used directly by the City of Upper Arlington for the majority of Public Service departments. These fuels are stored and dispersed at the Public Services Center facility for daily use by City employees. Records of actual fuel purchases were provided by the City for use in this analysis. It is assumed that all of the fuel purchased throughout the year of 2007 was utilized by City vehicles during that same time period. This results in total usage below:
Total Annual Fuel Purchases - 2007
Gasoline: 87,669 Gallons
Diesel: 57,218 Gallons
The total number of vehicles utilizing this fuel is detailed in the table below.
Divisions Vehicles + EquipmentPolice 33Fire 22
Parks 54Development 4Engineering 9
Streets + Traffic 81Fleet Maintenance 10
Utilities 25Building Maint. 2
Total 240Note: This list does not include push mowers, chain saws, weed eaters, small generators, and other various small equipment
Fleet Management Division
Carbon Footprint for City of Upper Arlington, Ohio “Page content is subject to Confidentiality Restrictions” MORPC in partnership with Ameresco Section 2: Existing Operations June 26, 2008 Page 11
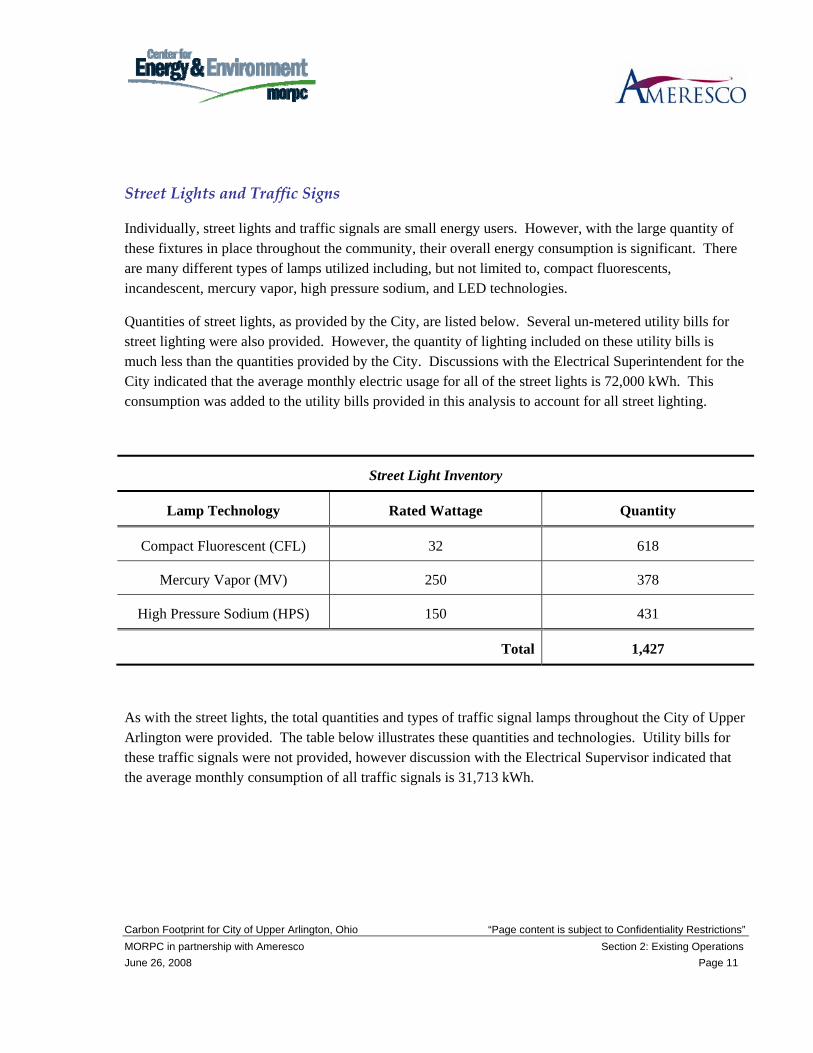
Street Lights and Traffic Signs
Individually, street lights and traffic signals are small energy users. However, with the large quantity of these fixtures in place throughout the community, their overall energy consumption is significant. There are many different types of lamps utilized including, but not limited to, compact fluorescents, incandescent, mercury vapor, high pressure sodium, and LED technologies.
Quantities of street lights, as provided by the City, are listed below. Several un-metered utility bills for street lighting were also provided. However, the quantity of lighting included on these utility bills is much less than the quantities provided by the City. Discussions with the Electrical Superintendent for the City indicated that the average monthly electric usage for all of the street lights is 72,000 kWh. This consumption was added to the utility bills provided in this analysis to account for all street lighting.
As with the street lights, the total quantities and types of traffic signal lamps throughout the City of Upper Arlington were provided. The table below illustrates these quantities and technologies. Utility bills for these traffic signals were not provided, however discussion with the Electrical Supervisor indicated that the average monthly consumption of all traffic signals is 31,713 kWh.
Street Light Inventory
Lamp Technology Rated Wattage Quantity
Compact Fluorescent (CFL) 32 618
Mercury Vapor (MV) 250 378
High Pressure Sodium (HPS) 150 431
Total 1,427

Carbon Footprint for City of Upper Arlington, Ohio “Page content is subject to Confidentiality Restrictions” MORPC in partnership with Ameresco Section 2: Existing Operations June 26, 2008 Page 12
This consumption was used in addition to the bills provided for the analysis.
Traffic Signal Inventory
Signal Type
Quantity
67w 649
116w 189
12” led 408
8” led 66
Led peds 326

Carbon Footprint for City of Upper Arlington, Ohio “Page content is subject to Confidentiality Restrictions” MORPC in partnership with Ameresco Section 2: Existing Operations June 26, 2008 Page 13
Commuter Miles
Currently there are 262 full time employees working for the City of Upper Arlington. Although the exact quantities change, a total of 302 people are employed by the City when including part time and seasonal workers. The vast majority of people commute to work via personnel automobiles. Commuting to work adds to the carbon footprint of the City through the consumption of gasoline and release of exhaust pollution from these vehicles.
According to the Bureau of Transportation Statistics (BTS), the average commuter travels approximately 15 miles each way between home and work. For the purposes of this analysis, it is assumed that the 262 full time employees are all traveling 15 miles each direction of their commute. It is also assumed that each of these employees makes this commute 235 days per year. This takes into account vacation days, sick time and holidays, all days when commuters would not be traveling to work. Using these assumptions, City of Upper Arlington employees commute a total of 1,847,100 miles annually.
Commuter Miles from the Bureau of Transportation Statistics
In the “Emissions Inventory Data” shown at the end of this section, these miles are included as “Vehicle Miles Traveled”. In order to calculate the effect on the carbon footprint for the City, assumptions are made about the average age and fuel efficiency of the vehicles being driven. Utilizing data from the Energy Information Agency (EIA) website, it is assumed that the average vehicle is a 1996 gasoline passenger vehicle, which results in 0.44 equivalent tons of CO2 produced for every 1,000 miles driven.

Carbon Footprint for City of Upper Arlington, Ohio “Page content is subject to Confidentiality Restrictions” MORPC in partnership with Ameresco Section 2: Existing Operations June 26, 2008 Page 14
Please note that this data does not include the miles driven by city owned vehicles which are fueled at the Public Services Center. The miles associated with these vehicles are taken into account through the actual fuel purchases discussed previously. Doing so is a more accurate account of the actual fuel burned and takes into account issues such as idling, lower or higher fuel efficiency, etc.
Solid Waste
Municipal solid waste consists of a variety of solids from typical operations including office paper and refuse collected from park receptacles. There is also “green waste” such as grass, leaves, and wood, which are collected from parks and other city landscapes which are taken to the yard waste facility at Roberts Road. There are two main choices to make when disposing of this solid waste; either landfilling or recycling.
The data provided by the City on solid waste is for the entire City, including residential pick-ups. This data shows that of the 12,825 tons of waste collected by the solid waste division, 47% of this was recycled. In addition, the street division collected 4,538 tons of leafs and other yard waste, which was also recycled. This results in 61% of the total collected solid waste throughout the City has been recycled.
As with most municipalities, actual data on the amount of solid waste landfilled and recycled, specific to the City owned properties, is limited. For this reason, the amount of solid waste for the City of Upper Arlington was estimated in the analysis. A 2003 study in Sonoma County, CA, found that the typical municipal facility throughout their county was producing 2.88 tons of solid waste per 1,000 square foot of facility area. They found that estimating based on square footage, in lieu of employee size, provided a more accurate assessment. Utilizing this assumption, it is estimated that the City of Upper Arlington generates 353 tons of solid waste annually. It is also assumed that the overall 61% recycling rate for the City is carried over to the City owned facilities. This results in a total of 138 tons landfilled every year and 215 tons of solid waste recycled annually and ranks Upper Arlington as one of the top recyclers in the State.

Carbon Footprint for City of Upper Arlington, Ohio “Page content is subject to Confidentiality Restrictions” MORPC in partnership with Ameresco Section 2: Existing Operations June 26, 2008 Page 15
Green Canopy
Trees remove carbon dioxide from the air through their leaves and store carbon in their biomass. The amount of tree cover throughout the City owned properties can affect the total carbon footprint. In addition, tree cover can provide improved aesthetics in a given area and are generally well accepted by the public.
Upper Arlington has been a Tree City for the past 19 years. Discussions with City personnel indicated that there are approximately 243,000 trees on the public lands throughout Upper Arlington. Using an average forest density of 700 trees per acre, this results in 347 acres of forest. This number is assumed accurate and used in this analysis.
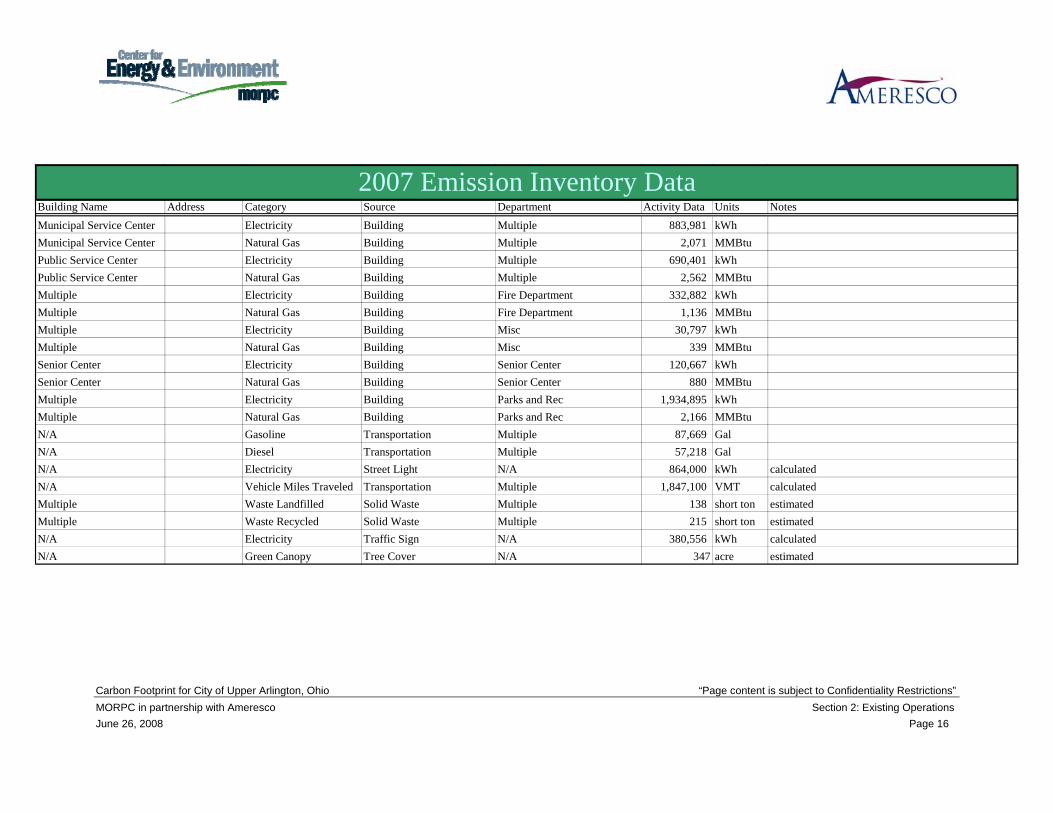
Total Inventory
Based on the information provided above, the table below was generated. This table indicates the total inventory for emissions generation by the City of Upper Arlington for 2007.
Carbon Footprint for City of Upper Arlington, Ohio “Page content is subject to Confidentiality Restrictions” MORPC in partnership with Ameresco Section 2: Existing Operations June 26, 2008 Page 16
Building Name Address Category Source Department Activity Data Units NotesMunicipal Service Center Electricity Building Multiple 883,981 kWhMunicipal Service Center Natural Gas Building Multiple 2,071 MMBtuPublic Service Center Electricity Building Multiple 690,401 kWhPublic Service Center Natural Gas Building Multiple 2,562 MMBtuMultiple Electricity Building Fire Department 332,882 kWhMultiple Natural Gas Building Fire Department 1,136 MMBtuMultiple Electricity Building Misc 30,797 kWhMultiple Natural Gas Building Misc 339 MMBtuSenior Center Electricity Building Senior Center 120,667 kWhSenior Center Natural Gas Building Senior Center 880 MMBtuMultiple Electricity Building Parks and Rec 1,934,895 kWhMultiple Natural Gas Building Parks and Rec 2,166 MMBtuN/A Gasoline Transportation Multiple 87,669 GalN/A Diesel Transportation Multiple 57,218 GalN/A Electricity Street Light N/A 864,000 kWh calculatedN/A Vehicle Miles Traveled Transportation Multiple 1,847,100 VMT calculatedMultiple Waste Landfilled Solid Waste Multiple 138 short ton estimatedMultiple Waste Recycled Solid Waste Multiple 215 short ton estimatedN/A Electricity Traffic Sign N/A 380,556 kWh calculatedN/A Green Canopy Tree Cover N/A 347 acre estimated
2007 Emission Inventory Data
Carbon Footprint for City of Upper Arlington, Ohio “Page content is subject to Confidentiality Restrictions” MORPC in partnership with Ameresco Section 3: Today’s Carbon Footprint June 26, 2008 Page 1
Section 3: Today’s Carbon Footprint
Knowing the parameters discussed in Section 3 of this analysis, the amount of Green House Gases released to the atmosphere as a result of the City of Upper Arlington’s operations has been calculated. The overall environmental impact from the City of Upper Arlington is a net equivalent of 7,051 tons of CO2 produced.
How Upper Arlington Creates Green House Gases
The emissions inventory for Upper Arlington can be broken down several ways. The charts below show the total emissions by both category as well as source. Referring to the emissions inventory table in Section 2, each individual line item is assigned to both a category and a source.
Carbon Footprint for City of Upper Arlington, Ohio “Page content is subject to Confidentiality Restrictions” MORPC in partnership with Ameresco Section 3: Today’s Carbon Footprint June 26, 2008 Page 2
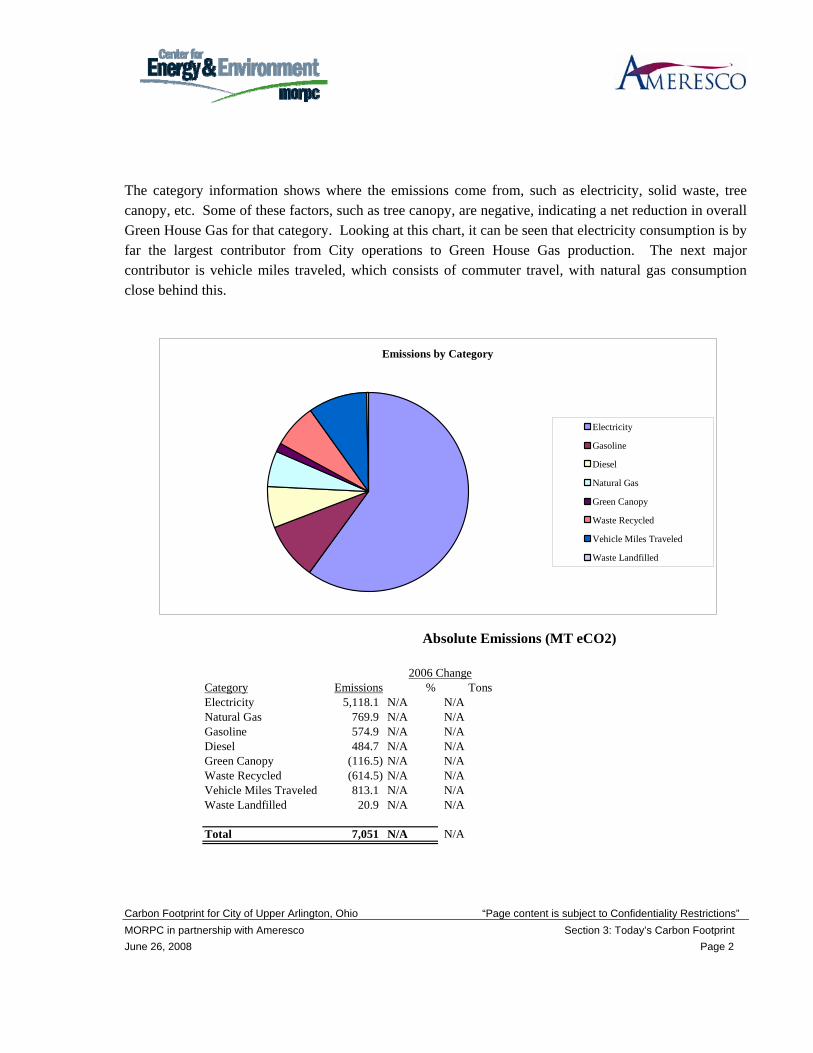
The category information shows where the emissions come from, such as electricity, solid waste, tree canopy, etc. Some of these factors, such as tree canopy, are negative, indicating a net reduction in overall Green House Gas for that category. Looking at this chart, it can be seen that electricity consumption is by far the largest contributor from City operations to Green House Gas production. The next major contributor is vehicle miles traveled, which consists of commuter travel, with natural gas consumption close behind this.
Category Emissions % TonsElectricity 5,118.1 N/A N/ANatural Gas 769.9 N/A N/AGasoline 574.9 N/A N/ADiesel 484.7 N/A N/AGreen Canopy (116.5) N/A N/AWaste Recycled (614.5) N/A N/AVehicle Miles Traveled 813.1 N/A N/AWaste Landfilled 20.9 N/A N/A
Total 7,051 N/A N/A
Absolute Emissions (MT eCO2)
2006 Change
Emissions by Category
Electricity
Gasoline
Diesel
Natural Gas
Green Canopy
Waste Recycled
Vehicle Miles Traveled
Waste Landfilled

Carbon Footprint for City of Upper Arlington, Ohio “Page content is subject to Confidentiality Restrictions” MORPC in partnership with Ameresco Section 3: Today’s Carbon Footprint June 26, 2008 Page 3
Source information shows what specific operations in the City contribute to the overall Green House Gas production. For example, building operations can be compared to solid waste streams or street lighting. Analyzing this information, it can be seen that the building operations are by far the largest contributor to Green House Gas production. Transportation, which includes the fuel consumption for City vehicles as well as commuter miles, is the next major contributor. Items such as tree cover or recycling actually have a net benefit on the overall Green House Gas production and help offset other City operations.
Source Emissions % TonsBuilding 4,386.8 N/A N/ATransportation 2,157.9 N/A N/AStreet Lights 844.2 N/A N/ATree Canopy (116.5) N/A N/ASolid Waste (593.6) N/A N/ATraffic Signs 371.8 N/A N/A
Total 7,051 N/A N/A
Absolute Emissions (MT eCO2)
2006 Change
Emissions By Source
BuildingTransportationWaste Water TreatmentStreet LightsTree CoverSolid WasteTraffic Signs

Carbon Footprint for City of Upper Arlington, Ohio “Page content is subject to Confidentiality Restrictions” MORPC in partnership with Ameresco Section 3: Today’s Carbon Footprint June 26, 2008 Page 4
Upper Arlington Benchmark Comparisons
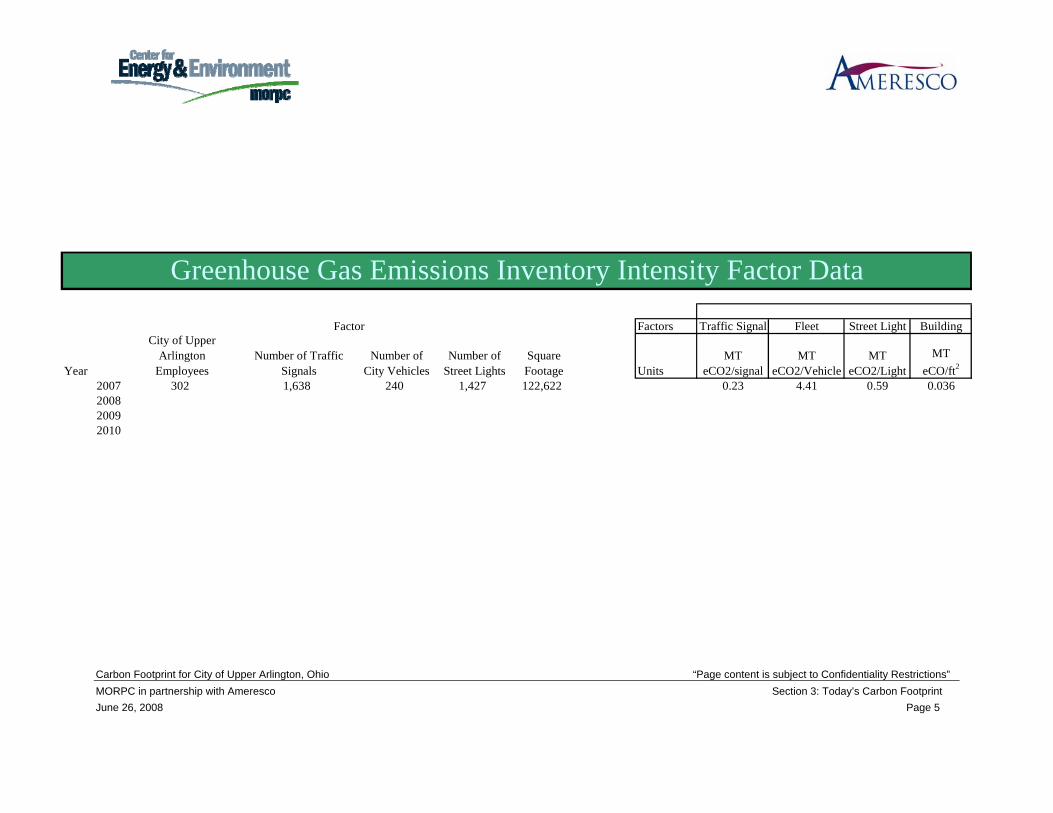
Establishing and comparing benchmark data can be a useful tool in multiple ways - As they can be tracked over time internally by the City to see how on-going efforts are affecting individual and overall Green House Gas production. The table on the next page illustrates several benchmarks which were developed for the City of Upper Arlington. The carbon footprint materials delivered to the City includes an electronic copy of this table. In the future, the City can maintain and update this table to track annual progress and the success of specific initiatives.
In addition to internal tracking, benchmarks allow municipalities of varying populations and services to compare similar type operations without being penalized for larger infrastructure. For example, looking at Green House Gas production of transportation operations on a per vehicle basis allows a city with 10 vehicles to compare their environmental efficiency with a city utilizing 100 vehicles. The city with 100 vehicles is almost certainly producing more Green House Gas; however, they may be utilizing more efficient vehicles, which will be indicated in the benchmark figure.
Since the City of Upper Arlington is performing the first carbon footprint analysis through the MORPC program, there is no comparative data available from the local community. As more carbon footprint analysis are completed, this data will be made available to the City of Upper Arlington. One benchmark which was found is for the City of Somerville, Massachusetts (population 77,478). This City is producing less than 0.01 tons of equivalent CO2 per square foot of facility, compared to 0.036 tons per square foot in Upper Arlington. However, it should be noted that many of the facilities in the Somerville analysis were schools, which have low usage in the summer and may not have comfort cooling. In addition, there are multiple ways to calculate a carbon footprint and it may not exactly match what was done in this analysis. Once multiple Cities are completed through the MORPC effort, a more representative benchmark can be established for comparison.
Carbon Footprint for City of Upper Arlington, Ohio “Page content is subject to Confidentiality Restrictions” MORPC in partnership with Ameresco Section 3: Today’s Carbon Footprint June 26, 2008 Page 5
Factors Traffic Signal Fleet Street Light Building
Year
City of Upper Arlington
EmployeesNumber of Traffic
SignalsNumber of
City VehiclesNumber of
Street LightsSquareFootage Units
MT eCO2/signal
MT eCO2/Vehicle
MT eCO2/Light
MT eCO/ft2
2007 302 1,638 240 1,427 122,622 0.23 4.41 0.59 0.036200820092010
Greenhouse Gas Emissions Inventory Intensity Factor Data
Factor

Carbon Footprint for City of Upper Arlington, Ohio “Page content is subject to Confidentiality Restrictions” MORPC in partnership with Ameresco Section 4: Reducing Carbon Footprint of Tomorrow June 26, 2008 Page 1
Section 4: Reducing Carbon Footprint of Tomorrow
Once Green House Gases have accumulated in the atmosphere, they tend to remain in the atmosphere for long periods of time. The amount of Green House Gas in the atmosphere today is the cumulative result of multiple individual behaviors: the kinds of vehicles we drive and how much we drive them; how we heat and cool our facilities; the efficiency of our HVAC systems; the kinds of lighting we use; how much we reuse and recycle; even the number of trees in the City and the quality of our natural areas and open spaces. In order to stabilize the collection of Green House Gas in the atmosphere at the current levels, a drastic reduction in emissions must be accomplished.
Although the City of Upper Arlington’s portion of the total global Green House Gas production is minimal, taking proactive steps to reduce the current carbon footprint will establish Upper Arlington as a leader in global climate change and help to encourage and build momentum for other municipalities, businesses and individuals to also contribute. There are many ways to reduce carbon footprint, many of which will reduce energy costs or have other economic and/or environmental benefits.
This section includes suggestions on ways to reduce the future carbon footprint associated with the City of Upper Arlington. There are multiple ways to accomplish this and the following is not an exhaustive list. A continuous effort on the part of the City will be required to ensure that these ideas are fully analyzed, implemented if appropriate, and future technologies and ideas are incorporated as well.

Carbon Footprint for City of Upper Arlington, Ohio “Page content is subject to Confidentiality Restrictions” MORPC in partnership with Ameresco Section 4: Reducing Carbon Footprint of Tomorrow June 26, 2008 Page 2

Carbon Footprint for City of Upper Arlington, Ohio “Page content is subject to Confidentiality Restrictions” MORPC in partnership with Ameresco Section 4: Reducing Carbon Footprint of Tomorrow June 26, 2008 Page 3
Climate Action Plan
The first step to reducing the carbon footprint at the City of Upper Arlington is to develop a plan for approval and adaptation by the City. This plan should include specific goals for the reduction of Green House Gas both overall and in specific categories and sources. Additionally, this plan must place Green House Gas reduction responsibility on a particular department in the City. Without responsibility and an action plan to follow-up on the Green House Gas reduction, it is likely to drop in priority and experience only minimal implementation. Many of the actions suggested below may be part of this plan, or they may be implemented simultaneously as this plan is developed.
Energy Savings Performance Contracting
An Energy Savings Performance Contract is one method for municipalities, as well as others, to implement energy savings projects. In an Energy Savings Performance Contract, a project is developed by a performance contractor who may guarantee a certain amount of the energy savings. If this level of energy savings is not realized, the performance contractor is responsible for making up the difference to the Owner. These energy savings are then used to help finance the project.
Although this type of project has been implemented in the past, there is further potential at the City of Upper Arlington to utilize this procurement method. Looking at the existing conditions in Section 2 of this report, the energy usage per square foot indicates potential for further reductions. This is particularly true for the Senior Center. New technologies such as T8 lighting, condensing furnaces, etc. could not only replace aged equipment, but reduce utility bills which are the major portion of the current carbon footprint. Many of the suggestions throughout the section may be implemented under an Energy Savings Performance Contract project as well. For your use we have included a typical request for proposal (RFP) at the end of this report.
LEED or Green Certification
The Leadership in Energy and Environmental Design (LEED) Green Building Rating System is the nationally accepted benchmark for the design, construction and operation of high performance green buildings. Through the LEED certification process, many of the City operations and construction methods will be affected to promote a whole building approach to sustainability. This effort will reduce the Green House Gas production of the facilities in many ways, with an overall reduction on the carbon footprint of the City.

Carbon Footprint for City of Upper Arlington, Ohio “Page content is subject to Confidentiality Restrictions” MORPC in partnership with Ameresco Section 4: Reducing Carbon Footprint of Tomorrow June 26, 2008 Page 4
Any building can be LEED certified, both new and existing. Many communities across the country have adopted ordinances that require new facilities to meet certain LEED designations. Two potential facilities to be considered at Upper Arlington would be the Municipal Service Center under the “Existing Building” ratings, and the new Fire Station under the “New Construction” rating. The Municipal Service Center is suggested since it is the most high profile facility in the community; this would serve as a good example and reach many people. Since the new fire station has not begun construction yet, this is a good opportunity to set a new standard for future construction projects.
Green Canopy Program
There are many benefits associated with “greenscape” projects. The exact potential of this is uncertain at this time, but it would be worth consideration by the City. As you can see in the picture of the Municipal Service Center property, there may be potential for tree planting in front of the facility. Along with planting trees, walkways can be constructed for staff use to promote exercise and overall healthy living.
Street Lighting
There is a wide variety of street lighting in use throughout the City of Upper Arlington. There are a large number of mercury vapor lamps which can be retrofitted to more efficient and common lighting technologies. In addition, there are new technologies including induction and LED lighting available to readily retrofit or replace the existing fixtures and create both energy and maintenance reductions.
Renewable Energy Projects
Renewable energy projects cover a wide range of systems and technologies. Some more common technologies include PhotoVoltaics (PV), solar water heating, and wind turbines. Newer technologies do not typically pay for themselves. However, if grants become available to help offset the construction costs, or other benefits such as carbon footprint reductions are considered, they can become feasible for implementation. The utilization and promotion of these technologies should be strongly considered in the Cities plan to reduce Green House Gas production.
Carbon Footprint for City of Upper Arlington, Ohio “Page content is subject to Confidentiality Restrictions” MORPC in partnership with Ameresco Section 4: Reducing Carbon Footprint of Tomorrow June 26, 2008 Page 5
Carpool Incentives
One of the large contributors to the overall carbon footprint of the City is the vehicle miles traveled by commuters. There are many methods to help reduce this Green House Gas production. Telecommuting, carpool incentives, or bicycle commuting incentives are all possibilities which could be explored. At this time, it is believed that carpool incentives, such as preferred parking, flexible hours to accommodate pick-ups, etc. have the most potential. Another option may be for the City to operate an in-house form of public transportation to pick-up and drop off employees.
The MORPC ‘Ride Solutions Program” could also be explored. Using computerized software, Ride Solutions is able to provide helpful options for commuters to share the ride to work. Many employers and communities also benefit from Ride Solutions partnerships. Their employees and residents save money while arriving on time and ready to work. Ride Solutions programs also help ease congestion on our roads and improve our region’s air quality.
Alternative Fuel Vehicles
Since transportation is a major component of the Upper Arlington carbon footprint, alternative fuel vehicles could be used to decrease gasoline usage. Hybrid vehicles are becoming more common every year and are available in a wide range of types. Some operations, particularly in the Parks and Recreation and Development departments, may be able to switch to all electric vehicles or utility type carts. Some Owner’s have built a parking awning with a solar roof to charge the vehicles further reducing the environmental impact.
Reduce Vehicle Idling
A common practice throughout municipalities, or other entities with vehicle fleets, is excessive idling. There are many sources which suggest that if a vehicle is to remain stationary for more than 10 seconds (with the exception of time stopped at traffic signals / intersections), it should be turned off. While idling, vehicles operate at 0 Miles per Gallon (MPG) but still produce emissions through the combustion of fuel. In addition, idling can increase wear on engine components and may increase future vehicle maintenance. A City policy on engine idling will reduce these issues and result in decreased fuel purchases in the future.

Carbon Footprint for City of Upper Arlington, Ohio “Page content is subject to Confidentiality Restrictions” MORPC in partnership with Ameresco Section 4: Reducing Carbon Footprint of Tomorrow June 26, 2008 Page 6
State and Federal grants may be available to install anti-idling technologies, as well as for engine replacements, vehicle or machinery replacements, or anti-idling technologies. All of these strategies would reduce vehicle emissions and improve air quality throughout the region.
Looking Forward
As shown in this section, there are many ways to affect the carbon footprint. A detailed plan on how the City of Upper Arlington will address this issue and what the goals of this plan are is essential. Included on the CD with this analysis is a emissions calculator and a “scenario analysis” spreadsheet. A copy of this can be seen on the next page. Some potential projects are shown with assumed reductions. As you can see, it is possible to have a substantial affect on the total carbon footprint of the City.

Carbon Footprint for City of Upper Arlington, Ohio “Page content is subject to Confidentiality Restrictions” MORPC in partnership with Ameresco Section 4: Reducing Carbon Footprint of Tomorrow June 26, 2008 Page 7
Scenario ProjectionsTarget Reduction of Reduction MT eCO2
2007 Baseline by 2020 Electricity (kWh) 0.0 0.015% Natural Gas (MMBtu) 0.0 0.0
Gasoline (gal) 0.0 0.0Forecasted Growth in City Services Diesel (gal) 0.0 0.0
1.0% Green Canopy (acres) 0.0 0.0VMT (miles) 184,710.0 81.3Waste Landfilled (short tons) 0.0 0.0
Project Select Description: Reduction of: YearLighting Retrofit Electricity 2008 125
Natural Gas 2010 132Electricity 2010 104Natural Gas 2009 624Electricity 2009 776
Renewable Energy Project Electricity 2011 25Carpool Incentives VMT 2011 81
LEED Cert. of MSC
ESPC
Scenario AnalysisEmissions Calculator
Expected Reduction(MT eCO2)
EXPECTED MITIGATION EFFORTS
Mitigation Targets
0
1,000
2,000
3,000
4,000
5,000
6,000
7,000
8,000
9,000
2007 2009 2011 2013 2015 2017 2019 2021 2023
Year
Met
ric T
ons e
CO
2
Target ReductionElectricityNatural GasGasolineDieselGreen CanopyVMTWaste LandfilledTotal ReductionBaseline
Baseline Emission Projections
0
1,000
2,000
3,000
4,000
5,000
6,000
7,000
8,000
9,000
2007 2009 2011 2013 2015 2017 2019 2021
Year
Met
ric T
ons e
CO
2
ProjectedActual