carbon footprint of undp administered global fund hivaids ... file1 carbon footprint of undp...
TRANSCRIPT

1
Carbon footprint of UNDP administered Global Fund HIV/AIDS and Tuberculosis grants in Montenegro and Tajikistan
Project Summary

2
All rights reserved ©2013 UNDP
September 2013
Design: Ines Silva of Ove Arup and Partners International Ltd.
3
Contents
Glossary of terms 4
Foreword 5
Project team 7
Introduction 8
Study objectives 9
Project approach 11
Findings & observations 14
Grant carbon footprinting results 15
Service Delivery Areas: Creating a strategic planning and operational response to carbon 20
&RVW�FDUERQ�EHQH¿W� ��
Concluding statement 27
What is EE-IO? 12
Service utilisation: Scope 3 downstream emissions 14
Social cost of carbon 23
BSL3 whole life carbon footprint 24
Information highlights:
4
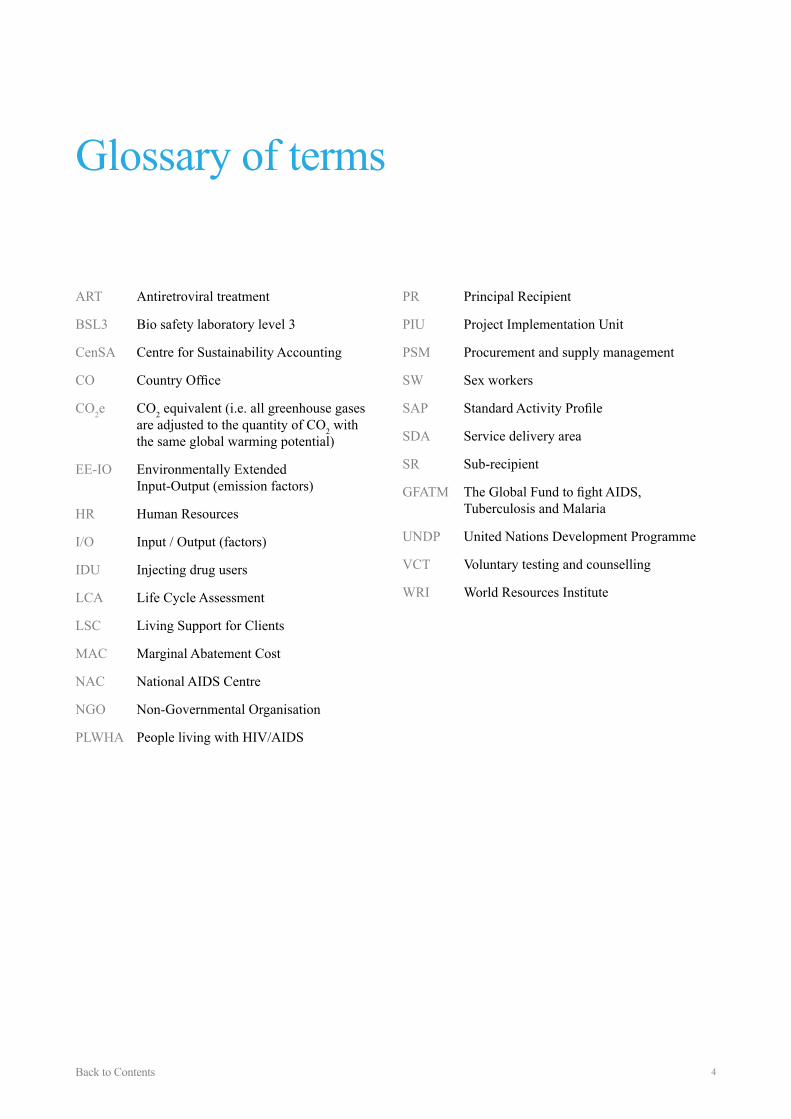
ART Antiretroviral treatment
BSL3 Bio safety laboratory level 3
CenSA Centre for Sustainability Accounting
CO� &RXQWU\�2I¿FH
CO2e CO2 equivalent (i.e. all greenhouse gases are adjusted to the quantity of CO2 with the same global warming potential)
EE-IO Environmentally Extended Input-Output (emission factors)
HR Human Resources
I/O Input / Output (factors)
IDU Injecting drug users
LCA Life Cycle Assessment
LSC Living Support for Clients
MAC Marginal Abatement Cost
NAC National AIDS Centre
NGO Non-Governmental Organisation
PLWHA People living with HIV/AIDS
Glossary of terms
PR Principal Recipient
PIU Project Implementation Unit
PSM Procurement and supply management
SW Sex workers
SAP� 6WDQGDUG�$FWLYLW\�3UR¿OH
SDA Service delivery area
SR Sub-recipient
GFATM� �7KH�*OREDO�)XQG�WR�¿JKW�$,'6��Tuberculosis and Malaria
UNDP United Nations Development Programme
VCT Voluntary testing and counselling
WRI World Resources Institute
Back to Contents
5
Foreword
Herein lies a great opportunity. Our sector has real SRWHQWLDO�WR�HIIHFW�FKDQJH��7KH�¿QGLQJV�IURP�D�UHFHQW�study by WHO Europe show that the health sector in Europe and Central Asia contribute to more than 4% of the overall greenhouse gas emissions; and that at least 25% of such emissions can be easily avoided (in the short term) whilst at the same time achieving health programme objectives.
Following in the footsteps of the British NHS 6XVWDLQDEOH�'HYHORSPHQW�8QLW��RQH�RI�WKH�SLRQHHUV�LQ�GRLQJ�QDWLRQDO�KHDOWK�VHFWRU�µFDUERQ�IRRWSULQWLQJ¶��we initialized the study reported here by Arup to SURYLGH�WKH�¿UVW�V\VWHPDWLF�HYLGHQFH�IRU�WKH�SDWWHUQ�of greenhouse gas emissions caused by global health initiatives.
Since UNDP is the single largest Principal Recipient RI�*OREDO�)XQG�JUDQWV�LQ�WKH�ZRUOG��ZH�VHH�WKLV�work as contributing to our direct responsibility of lowering emissions in our own operations as LPSOHPHQWHUV�RI�JOREDO�KHDOWK�LQLWLDWLYHV��,Q�DGGLWLRQ��we hope to raise the interest of other stakeholders – LPSOHPHQWHUV��IXQGHUV�DQG�SROLF\�PDNHUV�±�LQ�WKLV�US $30 billion annual market of global health aid ZKLFK�KDV�VXEVWDQWLDO�LQÀXHQFH�RQ�PDQ\�QDWLRQDO�health systems around the world.
This report is the result of a truly multidisciplinary XQGHUWDNLQJ��7KHUH�LV�PXFK�WR�OHDUQ�IURP�HDFK�RWKHU��and from across professionals in the environmental and health disciplines.
While applying standards of greenhouse gas DFFRXQWLQJ��WKLV�SURMHFW�SURJUDPPH�RIIHUV�VRPH�ground-breaking methodological work to measure HPLVVLRQV�LQ�WKH�VSHFL¿F�FRQWH[W�RI�D�JOREDO�KHDOWK�initiative using a budget/expenditure and a service utilization approach.
Climate change is now recognised as a major global FKDOOHQJH�DQG�RQH�ZKLFK�LI�OHIW�XQFKHFNHG��PD\�threaten not just the environment around us but humanity’s very own existence.
Whilst we are already experiencing its early impacts and struggling to cope; the science is pointing WRZDUGV�WKH�QHHG�IRU�UDGLFDO�FKDQJH��DQG�QHZ�WKLQNLQJ�IRU�WKH�ZD\�ZH�FUHDWH�HQHUJ\��RUJDQLVH�RXU�SURGXFWLRQ�V\VWHPV��DQG�FRQVXPH�DQG�GHSOR\�UHVRXUFHV��,QGHHG��WKLV�ZLOO�EH�HVVHQWLDO�LI�ZH�DUH�WR�sustain and develop our society and secure the health and wellbeing of future generations.
$OO�DVSHFWV�RI�VRFLHWDO�DFWLYLW\�PXVW�EH�ORRNHG�DW��DQG�that includes those directed towards the prevention of life threatening diseases and the provision of emergency medical assistance.
It must start with understanding the emission levels associated with one’s own activities. By using recognised protocols for the measurement and DVVHVVPHQW�RI�JUHHQKRXVH�JDV�HPLVVLRQV��D�¿UVW�‘carbon footprint’ can be generated. This can then become the basis for managing future actions. By DQDO\VLQJ�¿QGLQJV�DQG�GHYHORSLQJ�D�PRUH�GHWDLOHG�understanding of the whole life cycle of products and services (including consumption and utilisation SDWWHUQV���HPLVVLRQ�KRWVSRWV�FDQ�EH�LGHQWL¿HG�DQG�prioritised. Taking action with targeted interventions to the most appropriate area can then lead to emission reduction.
It is perhaps surprising that the sector dealing with health care as its primary mandate has been slow in the start-up of its efforts to reduce its carbon emissions. It is unfortunate that the priority of immediate treatment of patients is too often and unnecessarily used as excuse to justify inadequate DFWLRQ��8QLQWHQGHG�FRQVHTXHQFHV�FDQ�IROORZ��including negligence towards the creation of further avoidable disease.
6
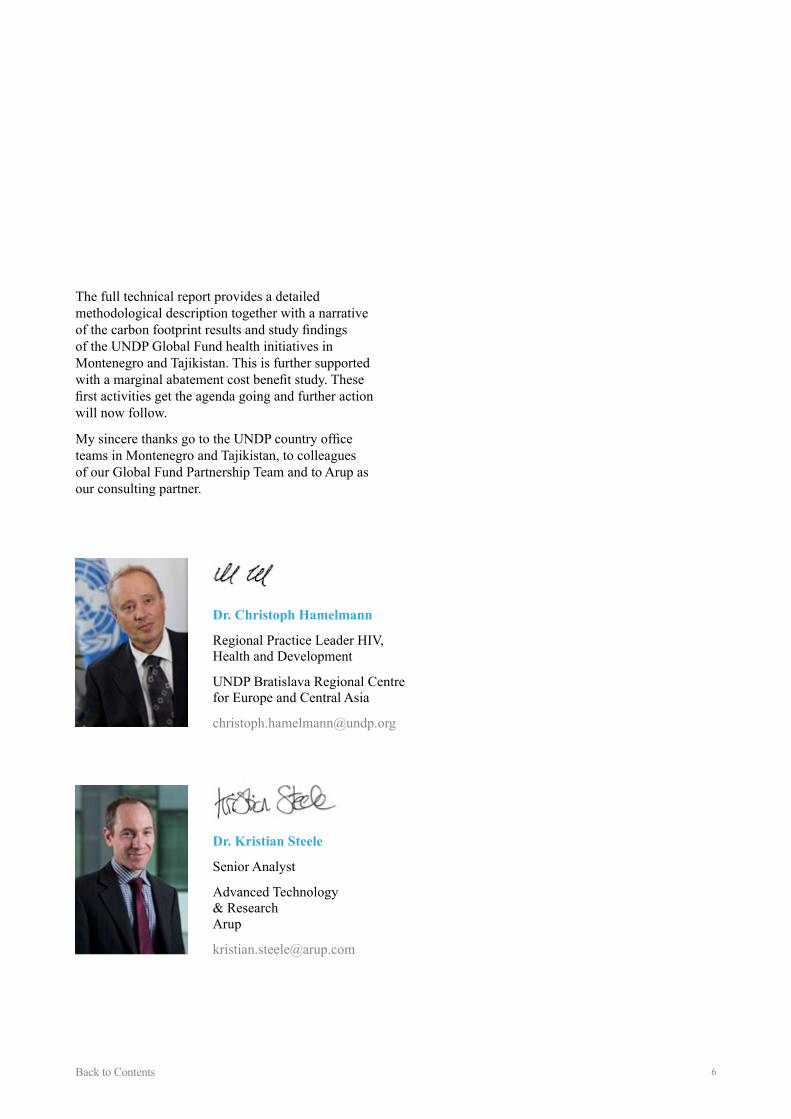
The full technical report provides a detailed methodological description together with a narrative RI�WKH�FDUERQ�IRRWSULQW�UHVXOWV�DQG�VWXG\�¿QGLQJV�of the UNDP Global Fund health initiatives in Montenegro and Tajikistan. This is further supported ZLWK�D�PDUJLQDO�DEDWHPHQW�FRVW�EHQH¿W�VWXG\��7KHVH�¿UVW�DFWLYLWLHV�JHW�WKH�DJHQGD�JRLQJ�DQG�IXUWKHU�DFWLRQ�will now follow.
0\�VLQFHUH�WKDQNV�JR�WR�WKH�81'3�FRXQWU\�RI¿FH�WHDPV�LQ�0RQWHQHJUR�DQG�7DMLNLVWDQ��WR�FROOHDJXHV�of our Global Fund Partnership Team and to Arup as our consulting partner.
Dr. Kristian Steele
Senior Analyst
Advanced Technology & Research Arup
Dr. Christoph Hamelmann
5HJLRQDO�3UDFWLFH�/HDGHU�+,9�� Health and Development
UNDP Bratislava Regional Centre for Europe and Central Asia
Back to Contents
7
We would like to acknowledge the valuable input RI�WKH�IROORZLQJ�SURMHFW�SDUWLFLSDQWV��ZLWKRXW�ZKRP�this research would not have been possible. We ZRXOG�DOVR�OLNH�WR�WKDQN�6RQLD�5RVFKQLN��2SHUDWLRQDO�Director of the NHS Sustainable Development Unit for her support and guidance.
Project Team
John Macauley
KM HIV/AIDS Analyst
UNDP Bratislava Regional Centre for Europe and Central Asia
Keith Robertson
Senior Sustainability Consultant & Lead Analyst
Arup
Itana Labovic
HIV/AIDS Programme Manager/M&E Specialist
UNDP Montenegro
Dr. Tedla Mezemir Damte
Program Manager - Global Fund Grants
UNDP Tajikistan
Dr. Stamatios Christopoulos
Energy & Environment Programme Analyst
Bratislava Regional Centre UNDP Europe and the CIS
Volker Welter
Senior Procurement Adviser
81'3�1RUGLF�2I¿FH
Back to Contents

8
In early 2013 the world quietly passed the somewhat symbolic mark of atmospheric CO2 rising above 400 parts SHU�PLOOLRQ��7KLV�LV�WKH�¿UVW�WLPH�RXU�SODQHW�KDV�EHHQ�LQ�this position for several hundred millennia and certainly before humans existed. This somewhat abstract threshold is important because it marks yet another point in the FRQWLQXHG�XSZDUG�ULVH�RI�DWPRVSKHULF�JUHHQKRXVH�JDVHV��D�VLWXDWLRQ�ZKLFK�LI�OHIW�XQFKHFNHG�ZLOO�OHDG�WR�VLJQL¿FDQW�climate change implications. The issue is more complex VWLOO�EHFDXVH�LW�LV�QRW�MXVW�DERXW�UHGXFWLRQ�WDUJHWV��EXW�more critically the reduction trajectory we take to get there. Limiting total emissions within a discrete budget will become an increasingly pressing issue with time. The International Energy Agency has recently quoted that “to keep open a realistic chance of meeting the 2°C target, intensive action is required before 2020”.
Within this growing imperative the global health sector LV�LQFUHDVLQJO\�EHLQJ�FKDOOHQJHG�WR�XQGHUVWDQG��TXDQWLI\��
and manage the greenhouse gas footprint of its operations. It follows that global health initiatives such as those ¿QDQFHG�E\�7KH�*OREDO�)XQG�WR�¿JKW�$,'6��7XEHUFXORVLV�and Malaria (GFATM) and implemented by numerous principal recipient (PR) organisations around the world are taking note. The United Nations Development Programme (UNDP) is the largest GFATM PR globally and can perhaps more than any act as a catalyst for change JLYHQ�WKH�RUJDQLVDWLRQV�PDQGDWH�DQG�JOREDO�LQÀXHQFH�
Programme operational activities are far reaching and FRYHU�SUHYHQWLRQ��WUHDWPHQW�DQG�PDQDJHPHQW�IXQFWLRQV��Greenhouse gas emissions can be attributed directly through fuel and energy use in facilities and vehicles (see Figure 1); but this must also be augmented with upstream and downstream activities such as the use of health services or the procurement of goods and services VXFK�DV�PHGLFDO�HTXLSPHQW��SKDUPDFHXWLFDOV�DQG�RWKHU�medical commodities.
Introduction
Figure 1. Scoping of emissions sources (from WRI Corporate Value Chain (Scope 3) Accounting and Reporting Standard)
Back to Contents

9
The objectives of this project have been directed towards developing an understanding of the carbon footprint of a range of UNDP implemented GFATM JUDQWV��DQG�WR�JDLQ�DQ�LQVLJKW�LQWR�KRZ�WKH�81'3�and other stakeholders might begin to manage scope �����DQG���HPLVVLRQV�RQ�DQ�RQ�JRLQJ�EDVLV��$V�VXFK�the focus has been on HIV/AIDS and Tuberculosis (TB) grants in Montenegro and Tajikistan. As illustrated in Figure 2 with the presentation of grant budget information for a typical HIV/AIDS grant in 7DMLNLVWDQ��WKH�VFRSH�RI�DFWLYLWLHV�ZLWKLQ�WKLV�UHPLW�are both diverse and complex.
It is on this basis that the project has assessed the greenhouse gas emissions of all goods procured and services commissioned to deliver the studied HIV/AIDS and TB grant programmes. This has been looked at together with climate change impacts arising from direct energy consumption and travel.
A series of operational aims were focused on:
- To produce a measure of the total carbon footprint for a set of UNDP/Global Fund grants in two countries. The footprint emissions outputs were to include:
- 6FRSH������DQG���HPLVVLRQV� �E\�WKH�*+*�3URWRFRO�GH¿QLWLRQV��
- (PLVVLRQV�E\�VRXUFH��HQHUJ\��WUDYHO�DQG�procurement (supply-chain) emissions;
- Emissions by country of UNDP project operation;
- Breakdown of key hotspots of these main RXWSXWV�OLVWHG�LQWR�VLJQL¿FDQW�VXE�DUHDV�
- Calculation of the relative contributions of GLIIHUHQW�W\SHV�RI�JRRGV��VHUYLFHV�DQG�DFWLYLWLHV�WR�this footprint; and
- ,GHQWL¿FDWLRQ�RI�WKH�UHODWLYH�PDJQLWXGHV�RI�opportunity to reduce the carbon footprint through LQLWLDWLYHV�DQG�VWUDWHJLHV�UHODWLQJ�WR�VSHFL¿F�components of the footprint.
But strategically it was also important that the study:
- Raised awareness and understanding of the carbon footprint of this type of programme; and
- Contributed understanding to the development of a broader strategy for reducing the carbon footprint of global health programmes within UNDP.
7KH�VWXG\�LV�EHOLHYHG�WR�EH�WKH�¿UVW�RI�LWV�W\SH�FDUULHG�out for a global health initiative.
Study objectives

10
Figure 2. Budget illustration of example Tajikistan GFATM HIV/AIDS grant (round 8 phase 2) illustrating service delivery activities undertaken by the programme
Management of Implementing Partners �������
Prevention: STI Diagnosis and treatment ��������
Prevention: Condom Distribution �������
Human Resources �������
Community Outreach: Vulnerable Youth ����������
Information systems and Operational research �������
The circles are concentric and measured from the centre
1.5%
1.2%
Community Outreach: Migrants & Vulnerable Women ����������
To reduce high-risk behaviours among
low risk populations
����������
Information Systems �������
Prevention: Schools ��������
Prevention: Migrants �������
Mass Media and IEC Materials �������
Management of Implementing Agencies �������
Infrastructure ��������
IEC Materials ��������
Policy Development �������
Behaviour change: high risk populations
Behaviour change: low risk populations
National capacity building
Treatment
UNDP infrastructure
GMS
Surveillance and information gathering
Blood safety
Blood safety
��������
0.8%
Back to Contents

11
This study took a ‘top-down’ approach to carbon footprint analysis using a cost/budget and carbon intensity methodology. The study focused on seven separate GFATM grants within the two countries across the HIV/AIDS and TB programmes in both.
In simple terms the grant’s monetary budget was used along with a set of environmentally extended input-output (EE-IO) climate change emissions factors VSHFL¿F�WR�WKH�FRXQWULHV�VWXGLHG��7KHVH�IDFWRUV�JLYH�DYHUDJH�HPLVVLRQV�SHU�XQLW�RI�FRVW�DQG�DUH�LGHQWL¿HG�WR�one of 57 industrial sectors. The generalised approach applied can be explained as follows:
1. Determine budget allocation within a set of categories:
- building energy consumption
- direct use of vehicles
- business travel
- transportation and storage of goods
- procurement of goods and services
2.��(VWLPDWH�HQHUJ\�FRQVXPSWLRQ��DQG�IXHO�FRQVXPSWLRQ��based on the budget allocation
3.��,GHQWLI\�RU�GHYHORS�FDUERQ�LQWHQVLWLHV��HLWKHU��
- based on direct consumption estimates (i.e. kgCO
2e/kWh or per litre of fuel); or
- based on budgeted expenditure (kgCO2e/$)
4. Multiply consumption by carbon intensity to calculate emissions in kgCO2e for each sector and combine to determine the overall total carbon footprint.
)RU�SURFXUHPHQW�DFWLYLWLHV��HPLVVLRQV�ZHUH�GHWHUPLQHG�by mapping a breakdown of planned procurement budgets to EE-IO carbon emissions factors to derive overall embodied supply-chain emissions.
The developed model architecture is illustrated in Figure 3. Within this the sub-models produced carbon intensities (in kgCO
2e/$) for a range of different goods and services. Inputs to the sub-models were based on dialogue and data from the project implementation units in both countries. The activity analysis model then attributed activity spend to one RU�PRUH�JRRG�RU�DFWLYLW\��DQG�XVHG�WKH�VXE�PRGHO�outputs to calculate the carbon footprint. The model output sheet collated calculation results and could be XVHG�WR�SUHVHQW�¿QGLQJV�
The development of the footprint model and gathering of inventories required detailed cooperation between the Arup analysis team and UNDP including:
- 81'3�&RXQWU\�2I¿FH��&2��ZKLFK�SURYLGHG�FHQWUDO�support to the delivery of UNDP projects;
- %UDWLVODYD��6ORYDNLD�±�WKH�81'3�5HJLRQDO�2I¿FH�for 25 countries in Eastern Europe and Central Asia;
- &RSHQKDJHQ��'HQPDUN�±�FHQWUDO�SURFXUHPHQW�VXSSRUW�RI¿FH�WKH�3URFXUHPHQW�6XSSRUW�2I¿FH�IRU�WKH�81'3¶V�GFATM operations;
- 1HZ�<RUN��86$�±�WKH�ORFDWLRQ�RI�WKH�81'3�KHDG�RI¿FH�KHDGTXDUWHUV�
- *HQHYD��6ZLW]HUODQG�±�ORFDWLRQ�RI�WKH�81'3¶V�Global Fund Partnership Team.
Project approach

12
Environmentally extended input-output (EE-IO) analysis is based on an ‘input-output’ PHWKRG�WKDW�WUDFNV�DOO�¿QDQFLDO�WUDQVDFWLRQV�between industrial sectors and consumers within an economy. By adding environmental LQIRUPDWLRQ��VXFK�DV�JUHHQKRXVH�JDV�HPLVVLRQV��to each sector it becomes possible to assign an environmental burden (a “footprint”) to these ¿QDQFLDO�WUDQVDFWLRQV��6LPLODU�WR�IROORZLQJ�WKH�ÀRZ�RI�PRQH\��RU�FRVWV��IURP�SURGXFWLRQ�WR�FRQVXPSWLRQ��DQ�HQYLURQPHQWDOO\�H[WHQGHG�LQSXW�RXWSXW�PRGHO�DOORZV�IROORZLQJ�WKH�ÀRZ�of environmental footprints along supply and production chains. As each production step adds DQ�HQYLURQPHQWDO�EXUGHQ��WKH�UHVXOW�LV�D�OLIH�cycle inventory of impacts of production and FRQVXPSWLRQ��H�J��FDUERQ��ZDWHU�RU�HFRORJLFDO�IRRWSULQWV�RI�FRPSDQLHV��RUJDQLVDWLRQV��VHFWRUV��LQGLYLGXDOV��UHJLRQV�RU�FRXQWULHV�
The IO derived dataset applied in this project is EDVHG�RQ�D�PXOWL�UHJLRQDO�JOREDO�FDUERQ�PRGHO��covering 94 individual countries and 98% of *'3��SURGXFLQJ�XQLTXH�FDUERQ�LQWHQVLW\�IDFWRUV�for 57 economic sectors in each country. It is therefore we believe the most sophisticated consumption-based carbon dataset commercially available. This dataset was accessed through an Arup and Centre for Sustainability Accounting (CenSA) partnership.
What is EE-IO?
Figure 3. Overview of footprint model structure illustrating a number of the sub-models that were developed
Sub-models Main model
Activity analysis
Applies kgCO2e/$ factors WR�WKH�EXGJHW�SUR¿OH
Outputs
Carbon intensities
Building energy
GMS
Scope 3 Factors
Travel/transport
,QÀDWLRQ�FXUUHQF\
Procurement
Generate kgCO2e/$ factors
���Back to Contents
14
Findings & observations
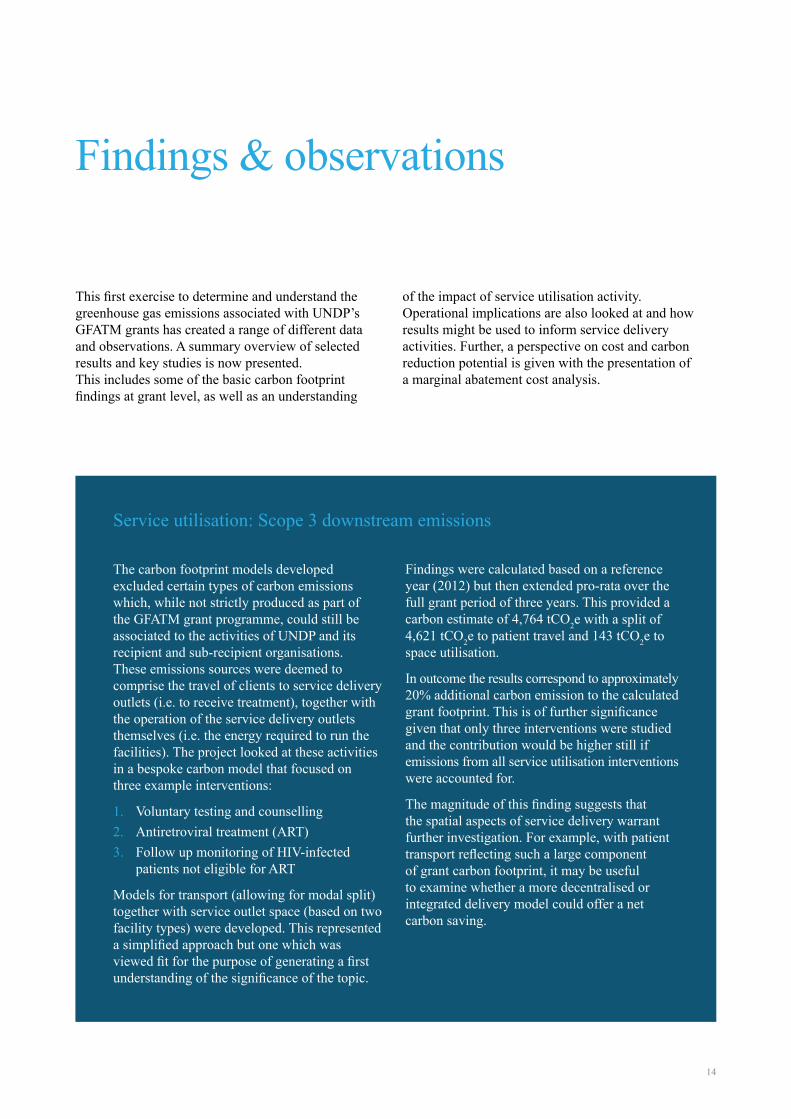
7KLV�¿UVW�H[HUFLVH�WR�GHWHUPLQH�DQG�XQGHUVWDQG�WKH�greenhouse gas emissions associated with UNDP’s GFATM grants has created a range of different data and observations. A summary overview of selected results and key studies is now presented. This includes some of the basic carbon footprint ¿QGLQJV�DW�JUDQW�OHYHO��DV�ZHOO�DV�DQ�XQGHUVWDQGLQJ�
of the impact of service utilisation activity. Operational implications are also looked at and how results might be used to inform service delivery DFWLYLWLHV��)XUWKHU��D�SHUVSHFWLYH�RQ�FRVW�DQG�FDUERQ�reduction potential is given with the presentation of a marginal abatement cost analysis.
The carbon footprint models developed excluded certain types of carbon emissions ZKLFK��ZKLOH�QRW�VWULFWO\�SURGXFHG�DV�SDUW�RI�WKH�*)$70�JUDQW�SURJUDPPH��FRXOG�VWLOO�EH�associated to the activities of UNDP and its recipient and sub-recipient organisations. These emissions sources were deemed to comprise the travel of clients to service delivery RXWOHWV��L�H��WR�UHFHLYH�WUHDWPHQW���WRJHWKHU�ZLWK�the operation of the service delivery outlets themselves (i.e. the energy required to run the facilities). The project looked at these activities in a bespoke carbon model that focused on three example interventions:
1. Voluntary testing and counselling
2. Antiretroviral treatment (ART)
3. Follow up monitoring of HIV-infected patients not eligible for ART
Models for transport (allowing for modal split) together with service outlet space (based on two facility types) were developed. This represented D�VLPSOL¿HG�DSSURDFK�EXW�RQH�ZKLFK�ZDV�YLHZHG�¿W�IRU�WKH�SXUSRVH�RI�JHQHUDWLQJ�D�¿UVW�XQGHUVWDQGLQJ�RI�WKH�VLJQL¿FDQFH�RI�WKH�WRSLF��
Findings were calculated based on a reference year (2012) but then extended pro-rata over the full grant period of three years. This provided a FDUERQ�HVWLPDWH�RI�������W&2
2e with a split of ������W&22e to patient travel and 143 tCO2e to space utilisation.
In outcome the results correspond to approximately 20% additional carbon emission to the calculated JUDQW�IRRWSULQW��7KLV�LV�RI�IXUWKHU�VLJQL¿FDQFH�given that only three interventions were studied and the contribution would be higher still if emissions from all service utilisation interventions were accounted for.
7KH�PDJQLWXGH�RI�WKLV�¿QGLQJ�VXJJHVWV�WKDW�the spatial aspects of service delivery warrant IXUWKHU�LQYHVWLJDWLRQ��)RU�H[DPSOH��ZLWK�SDWLHQW�WUDQVSRUW�UHÀHFWLQJ�VXFK�D�ODUJH�FRPSRQHQW�RI�JUDQW�FDUERQ�IRRWSULQW��LW�PD\�EH�XVHIXO�to examine whether a more decentralised or integrated delivery model could offer a net carbon saving.
Service utilisation: Scope 3 downstream emissions

15
Grant carbon footprinting results
In all grants studied the majority of carbon footprint emissions arise from the procurement of the goods and services necessary to deliver the health programmes. These can be described as scope 2 and 3 emission categories. The impact of emissions arising in these areas can be attributed to the quantities (i.e. large economic outlay) of medical and other supplies procured. This is in contrast to the relatively small emission levels observed from direct organisational activities RI�WKH�81'3�FRXQWU\�RI¿FHV��
In this regard the results of the footprinting process provide an indication of the size of the carbon footprint IRU�GLIIHUHQW�W\SHV�RI�JUDQWV�LQ�WHUPV�RI�VFDOH��ORFDWLRQ�DQG��WR�VRPH�H[WHQW��HPSKDVLV��7KLV�ODVW�LWHP�UHODWHV�to the type of project which is being delivered which LV�LQ�WXUQ��D�SURSHUW\�RI�WKH�ORFDWLRQ�UHJLRQ�DQG�WKH�nature of the service it requires.
Selected results can be viewed in the following Tables and Graphs.
Tajikistan footprint
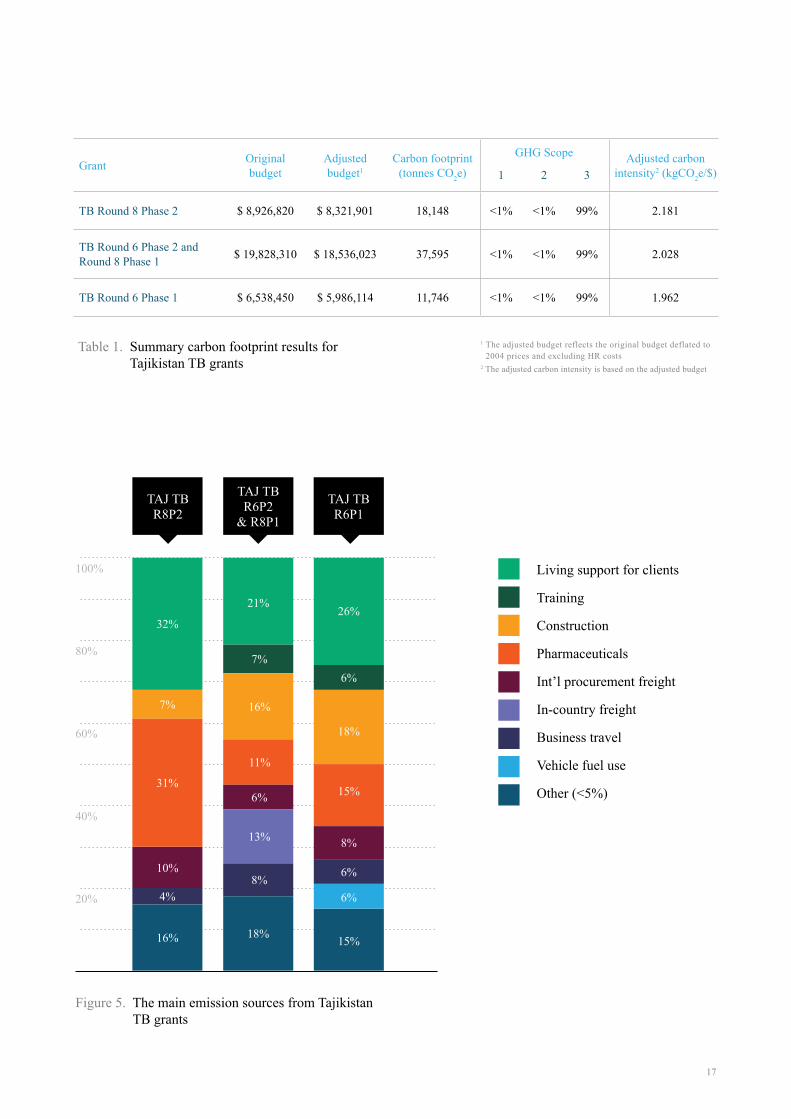
In Tajikistan the emphasis is on bringing the health LQIUDVWUXFWXUH�LQ�WKH�FRXQWU\�XS�WR�DQ�DSSURSULDWH�OHYHO��along with providing direct testing and treatment to clients. It is interesting to note the large contribution of procurement of laboratory and medical equipment. )LJXUHV������DQG���SURYLGH�SHUVSHFWLYH�RQ�WKHVH�aspects and it can be seen in outcome they create a relatively high carbon intensity for the Tajikistan grants (Table 1 and 2).
Montenegro footprint
The impact of transport and travel in Montenegro is OHVV��DV�ZRXOG�EH�H[SHFWHG�JLYHQ�WKH�VL]H�RI�WKH�FRXQWU\�and its existing transport infrastructure. In Montenegro WKH�HPSKDVLV�LV�WR�HQJDJHPHQW��HGXFDWLRQ�DQG�DZDUHQHVV�UDLVLQJ��DQG�JRYHUQDQFH��DQG�OHVV�WR�WUHDWPHQW�DQG�LQIUDVWUXFWXUH��'HYHORSLQJ��SULQWLQJ�DQG�GHOLYHU\�RI�information to populations at risk is a key component of these grants. The results of the carbon footprint exercises DSSHDU�WR�FRQ¿UP�ZKDW�ZRXOG�EH�H[SHFWHG�±�WKDW�WKHVH�lower impact activities result in an overall lower carbon intensity for the grant (Table 3 and Figure 7).

16
������
������
������
������
�����
������
�����
�����
�����
tonnes CO2e
Purchased goods and services
Fuel- and energy-related
activities
Business travel
Supply chain Ç 82% Operations Ç 18%
Capital goods (construction)
Upstream transportation
and distribution
Direct emissions from
combustion of fuel
Waste generated in operations
Upstream leased assets
Figure 4. The carbon footprint of HIV/AIDS grant R8P2 in Tajikistan presented in GHG protocol scopes across the value chain
17
Table 1. Summary carbon footprint results for Tajikistan TB grants
GrantOriginal budget
Adjusted budget1
Carbon footprint (tonnes CO2e)
GHG Scope Adjusted carbon intensity2 (kgCO2e/$)1 2 3
TB Round 8 Phase 2 ����������� ����������� ������ <1% <1% 99% 2.181
TB Round 6 Phase 2 and Round 8 Phase 1
������������ ������������ ������ <1% <1% 99% 2.028
TB Round 6 Phase 1 ����������� ����������� ������ <1% <1% 99% 1.962
Figure 5. The main emission sources from Tajikistan TB grants
Living support for clients
Training
Construction
Pharmaceuticals
Int’l procurement freight
In-country freight
Business travel
Vehicle fuel use
Other (<5%)
TAJ TB R8P2
TAJ TB R6P1
TAJ TB R6P2
& R8P1
4%
32%
31%
10%
7%
100%
60%
80%
40%
20%
16%
6%
7%
8%
21%
13%
16%
11%
18%15%
18%
15%
26%
6%
6%
6%
8%
1 The adjusted budget reflects the original budget deflated to 2004 prices and excluding HR costs
2 The adjusted carbon intensity is based on the adjusted budget

18
Table 2. Summary carbon footprint results for Tajikistan HIV/AIDS grants
GrantOriginal budget
Adjusted budget1
Carbon footprint (tonnes CO2e)
GHG Scope Adjusted carbon intensity2 (kgCO2e/$)1 2 3
HIV/AIDS Round 8 Phase 2 ������������ ������������ ������ 2% <1% 97% 2.034
HIV/AIDS Round 6 Phase 2 and Round 8 Phase 1
������������ ������������ ������ 8% <1% 91% 2.224
HIV/AIDS Round 6 Phase 1 ����������� ����������� ������ <1% <1% 99% 2.130
Figure 6. The main emission sources from Tajikistan HIV/AIDS grants
Pharmaceuticals
Training
Communication materials
2I¿FH�HTXLSPHQW��IXUQLWXUH
Medical/lab equipment & consumables
International freight
In-country freight
Business travel
Vehicle fuel use
Other (<5%)
TAJ HIV R8P2
TAJ HIV R6P1
TAJ HIV R6P2
& R8P1
8%
9%
6%
11%
9%
13%
13%
100%
60%
80%
40%
20%31%
8%
9%
12%
11%
12%
19%
21%
8%
10%
10%
11%
29%
7%
6%
8%
9%
9%
1 The adjusted budget reflects the original budget deflated to 2004 prices and excluding HR costs
2 The adjusted carbon intensity is based on the adjusted budget

19
Figure 7. The main emission sources from Montenegro HIV/AIDS and TB grants.
Table 3. Summary carbon footprint results for Montenegro HIV/AIDS grants and TB grants
GrantOriginal budget
Adjusted budget1
Carbon footprint (tonnes CO2e)
GHG Scope Adjusted carbon intensity2 (kgCO2e/$)1 2 3
HIV/AIDS Round 9 Phase 2 ����������� ��������� 823 0% 8% 92% 0.928
HIV/AIDS Round 9 Phase 1 ����������� ����������� ����� 0% 1% 99% 0.906
HIV/AIDS Round 5 Phase 1 and Round 5 Phase 2
����������� ����������� ����� 0% 7% 93% 1.105
TB Round 6 Phase 2 ����������� ����������� ����� 0% 4% 96% 1.099
Technical assistance
HR costs
Proc - Large lab equipment
Training
Proc - Construction
Planning and admin
M&E
Overheads
Proc - Pharmaceuticals
Communication materials
Medical and lab equipment/consumables
3URF���2I¿FH�HTXLSPHQW
Proc - Vehicles
GMS
Other (<5%)
MON HIV R9P1
MON TB R6P2
MON HIV R9P2
MON HIV R5P1&P2
100%
60%
80%
40%
20% 9%
8%
24%
22%15%
18%
28%
25%12%
9%
7%
7%
7%
7%
7%
8%
6%
6%25%
7%
7%
18%
17%
13% 14%
21%
13%
13%
13%
13%

20
Service Delivery Areas: Creating a strategic planning and operational response to carbon
GFATM grants will typically be structured into a KLHUDUFK\�RI�VHUYLFH�GHOLYHU\�DUHDV��6'$���DFWLYLWLHV�DQG�VXE�DFWLYLWLHV��ZLWK�GH¿QHG�DUHDV�FRPPRQO\�FRQWULEXWLQJ�WR�VSHFL¿F�SURJUDPPH�REMHFWLYHV��7KLV�framework provides a structure from which grant budget planning and then operational implementation can be coordinated and monitored. An example of this was provided earlier in Figure 2. This makes H[DPLQLQJ�FDUERQ�IRRWSULQW�ZLWKLQ�D�6'$�FRQWH[W��D�potentially useful area for action. In due course such an approach could be an enabler to look at climate
change mitigation within the funding requests put to the Global Fund.
Illustrations of carbon emission results at SDA activity and sub-activity level are presented in Figure 8. Findings are for the Tajikistan HIV/AIDs round 8 phase 2 programme (budget data for this can be seen in Figure 2). Results provide an indication for how carbon emissions data can be reported.
In practice a calculation could be applied at planning and integrated with budget spread sheets to allow an immediate estimate of a grant’s carbon footprint during its development and application. With progress this could form the basis of a means to monitor carbon and mitigation actions throughout the delivery of the grants themselves.
Figure 8. Carbon footprint of Tajikistan HIV/AIDS by SDA objective
SDA Objectives
tCO2e
30000
20000
10000
25000
15000
5000
Behaviour change: high risk populations
Behaviour change: low risk populations
Blood safety
Treatment
Surveillance and information gathering
National capacity building
UNDP infrastructure
GMS
38%
25%
11%
9%
3% 4%
5%
5%
9296
6388
1240
2770
1382
2360
848930
21
This would be done by aligning the SDA budget carbon emission data with actual expenditure out turn. This would provide the basis for reporting the carbon intensity value per spend and then by UHFRUGLQJ�DJDLQVW�JUDQW�SHUIRUPDQFH�LQGLFDWRUV��DOVR�the potential to monitor the carbon intensity per target. Operational monitoring with this approach would provide a means to drive carbon reduction RSSRUWXQLWLHV��7KLV�ZRXOG�EH�D�¿UVW�VWHS�WRZDUGV�establishing a cross-grant and cross-country data set of carbon-emissions per unit of service output; an asset that would be of great value to health planners in UNDP and The Global Fund.
This thinking could be extended further with the standardization of these objectives per disease SURJUDPPH��WRJHWKHU�ZLWK�6'$¶V�DQG�UHODWHG�indicators throughout a whole grant programme. This could deliver better benchmarking of costs SHU�XQLW�RI�VHUYLFH�RXWSXW��EXW�DOVR�EHQFKPDUNLQJ�of carbon emission per unit of service output. This might lead to benchmarking of grouped or similar countries (in terms of macro-economic and Human 'HYHORSPHQW�5HSRUW�HWF��LQGLFDWRUV���DV�ZHOO�DV�similar epidemic settings. In this way carbon /climate change could have the potential to be looked at along-side cost and other established indicators as a detailed health planning metric.
&RVW�FDUERQ�EHQH¿W
The primary purpose of the GFATM grants are to effectively increase the scope and scale of services in countries lacking capacity to provide access WR�VHUYLFHV�UHJDUGHG�DV�HVVHQWLDO�IRU�SUHYHQWLRQ��WUHDWPHQW��FDUH�DQG�VXSSRUW��7KLV�PHDQV�LW�LV�VLPSO\�not an option in the short term to reduce the ‘units’ RI�VHUYLFH�RXWSXW��,QGHHG��LW�PDNHV�LW�D�SULRULW\�WR�extract as much service output as possible out of the allocated budget.
This context made it a priority for the project to XQGHUVWDQG�LI�WKHUH�ZHUH�FRVW�EHQH¿WV�WR�EH�UHDOLVHG�from carbon mitigation actions and if these could be achieved based on reduced carbon intensity per unit of service output. Practically this strategy was viewed feasible if it could be delivered by considering the whole life cycle carbon performance RI�JRRGV�DQG�VHUYLFHV�SURFXUHG��WRJHWKHU�ZLWK�HI¿FLHQF\�LPSURYHPHQWV�ZLWKLQ�WKH�VHUYLFH�GHOLYHU\�system itself.
The project explored these ideas through the use of a Marginal Abatement Cost (MAC) curve analysis. Results of the footprint study for both countries and a selected number of key areas were focused on. A workshop was held with the UNDP procurement WHDP�DQG�UHVSHFWLYH�FRXQWU\�RI¿FHV�WR�LGHQWLI\�WKRVH�grant activities with greatest potential for action. Potential was viewed to exist in:
- Switching to lower carbon supply chains
- Local procurement (reduced transport)
- 'HSOR\PHQW�RI�HTXLSPHQW�ZLWK�JUHDWHU�HI¿FLHQF\�
- Service utilisation gain for same resource deployment
,Q�VSHFL¿F�LQVWDQFHV�GHPDQG�UHGXFWLRQ�ZDV�DOVR�viewed as offering some potential. Generically these DUHDV�FRXOG�WKHUHIRUH�EH�FODVVL¿HG�DV�IDOOLQJ�LQ�WR�one of two types of intervention. This enabled a VLPSOL¿HG�DSSURDFK�WR�EH�DGRSWHG�LQ�PRGHOOLQJ�
1. (I¿FLHQF\�LPSURYHPHQW 7KH�GHOLYHU\�WDUJHWV�RI�WKH�JUDQW�DUH�PHW��DOEHLW�with a reduction in the ‘amount’ of inputs and processes
2. Carbon intensity reduction The carbon intensity of a particular good or service can be reduced either in the short term WKURXJK�PRUH�WDUJHWHG�SURFXUHPHQW��RU�LQ�WKH�longer term through more strategic initiatives
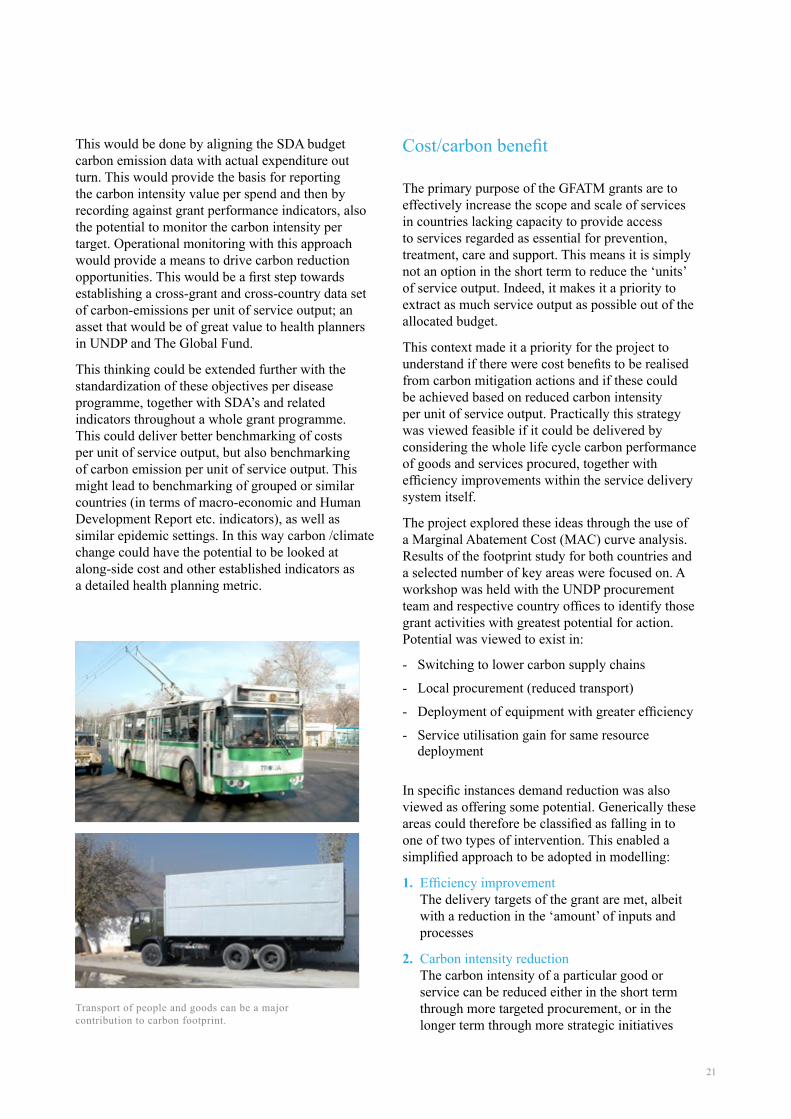
Transport of people and goods can be a major contribution to carbon footprint.
22
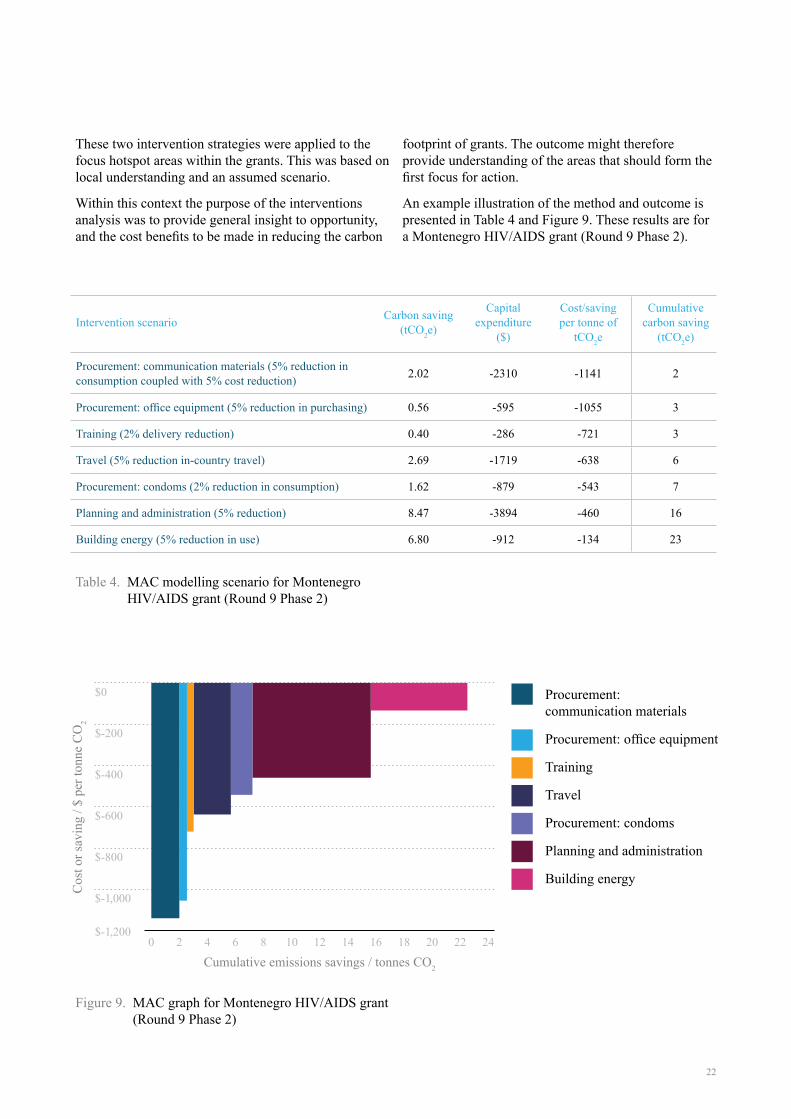
Table 4. MAC modelling scenario for Montenegro HIV/AIDS grant (Round 9 Phase 2)
Intervention scenarioCarbon saving
(tCO2e)
Capital expenditure
($)
Cost/saving per tonne of
tCO2e
Cumulative carbon saving
(tCO2e)
Procurement: communication materials (5% reduction in consumption coupled with 5% cost reduction)
2.02 -2310 -1141 2
3URFXUHPHQW��RI¿FH�HTXLSPHQW�����UHGXFWLRQ�LQ�SXUFKDVLQJ� 0.56 -595 -1055 3
Training (2% delivery reduction) 0.40 -286 -721 3
Travel (5% reduction in-country travel) 2.69 -1719 -638 6
Procurement: condoms (2% reduction in consumption) 1.62 -879 -543 7
Planning and administration (5% reduction) 8.47 -3894 -460 16
Building energy (5% reduction in use) 6.80 -912 -134 23
Figure 9. MAC graph for Montenegro HIV/AIDS grant (Round 9 Phase 2)
$0
$-400
$-800
$-200
$-600
�������
�������0 2 64 8 10 14 1812 16 20 22 24
Procurement: communication materials
3URFXUHPHQW��RI¿FH�HTXLSPHQW
Training
Travel
Procurement: condoms
Planning and administration
Building energy
Cumulative emissions savings / tonnes CO2
Cos
t or
savi
ng /
$ pe
r to
nne
CO
2
These two intervention strategies were applied to the focus hotspot areas within the grants. This was based on local understanding and an assumed scenario.
Within this context the purpose of the interventions DQDO\VLV�ZDV�WR�SURYLGH�JHQHUDO�LQVLJKW�WR�RSSRUWXQLW\��DQG�WKH�FRVW�EHQH¿WV�WR�EH�PDGH�LQ�UHGXFLQJ�WKH�FDUERQ�
footprint of grants. The outcome might therefore provide understanding of the areas that should form the ¿UVW�IRFXV�IRU�DFWLRQ�
An example illustration of the method and outcome is presented in Table 4 and Figure 9. These results are for a Montenegro HIV/AIDS grant (Round 9 Phase 2).

23
The models for this work were based on a set of challenging but realistic assumptions for changes to the ZD\�JUDQWV�ZHUH�GHOLYHUHG��$V�WKH�H[DPSOH�VKRZV��RQO\�modest savings in carbon emission levels were found to be possible.
+RZHYHU��WKHUH�DUH�PXOWLSOH�OHYHOV�RI�GHWDLO�WR�WKLV�and further investigation is merited. It is interesting to note for example that some of the areas where the opportunity is greatest are areas where the local country RI¿FHV�H[HUWV�VRPH�FRQWURO��QDPHO\�DURXQG�EXVLQHVV�travel and use of vehicle fuel for sub-recipients. This is evident in Figure 9.
That is not to say procurement is not important. Other JUDQWV�IRU�H[DPSOH�KDG�GLIIHUHQW�EXGJHW�SUR¿OHV�ZLWK�large contributions of greenhouse gas emissions from construction activity and procurement of pharmaceuticals. Here there is potential but it will require a broader initiative across the UNDP to deliver emission reductions.
A range of strategies will be required in order to see LPSURYHPHQW�PDNLQJ�IXOO�XVH�RI�WKH�LQÀXHQFH�WKDW�UNDP has in ensuring suppliers are working hard to PLQLPLVH�FDUERQ�HPLVVLRQV��WRJHWKHU�ZLWK�MRLQLQJ�XS�carbon objectives and action within the procurement process that the UNDP system operates.
The integration of carbon emission monitoring as part of the health planning process is a new agenda to be taken account of. One of the challenges is to create relevance of the subject to normal working practice. To aid with this the study undertook a small exploratory calculation to link carbon emissions with the ‘social cost of carbon’.
The work of the Stern review popularized this concept and this was used as a basis for the FDOFXODWLRQ��7KH�VRFLDO�FRVW�RI�FDUERQ�LV�GH¿QHG�by the ultimate concentration of greenhouse gases in the atmosphere and keeping global WHPSHUDWXUH�ULVHV�ZLWKLQ�GH¿QHG�OLPLWV�� These are principles consistent with UNDP DVSLUDWLRQV��DQG�DV�VXFK�WKH�VRFLDO�FRVW�RI�FDUERQ�quoted by Stern of $25-30 per tonne CO
2e is a useful benchmark.
Using the Stern value means we can monetize for a UNDP programme an approximate for WKH�FRVW�UHGXFWLRQ��RU�PRGL¿FDWLRQ�RI�FDUERQ�intensity) that will be necessary to adhere to the quoted 450-550ppm CO
2e atmospheric greenhouse gases concentration (which equates to an estimated global 2ºC temperature rise) that Stern calls for.
)RU�H[DPSOH�LI�ZH�WDNH�WKH�WRWDO��������WRQQHV�CO
2e emissions for the Tajikistan HIV/AIDS programmes and assume a $30 per tonne CO2e value; this equates to a social cost of carbon of $2.2 million. The total HIV/AIDS programme EXGJHW�LQ�7DMLNLVWDQ�LV�DSSUR[��������PLOOLRQ��with the social cost of carbon equating to some ���RI�WKLV�WRWDO�DPRXQW��,Q�VXPPDU\�������million of climate change damage is incurred with the $35.1 million spend.
Social cost of carbon
24
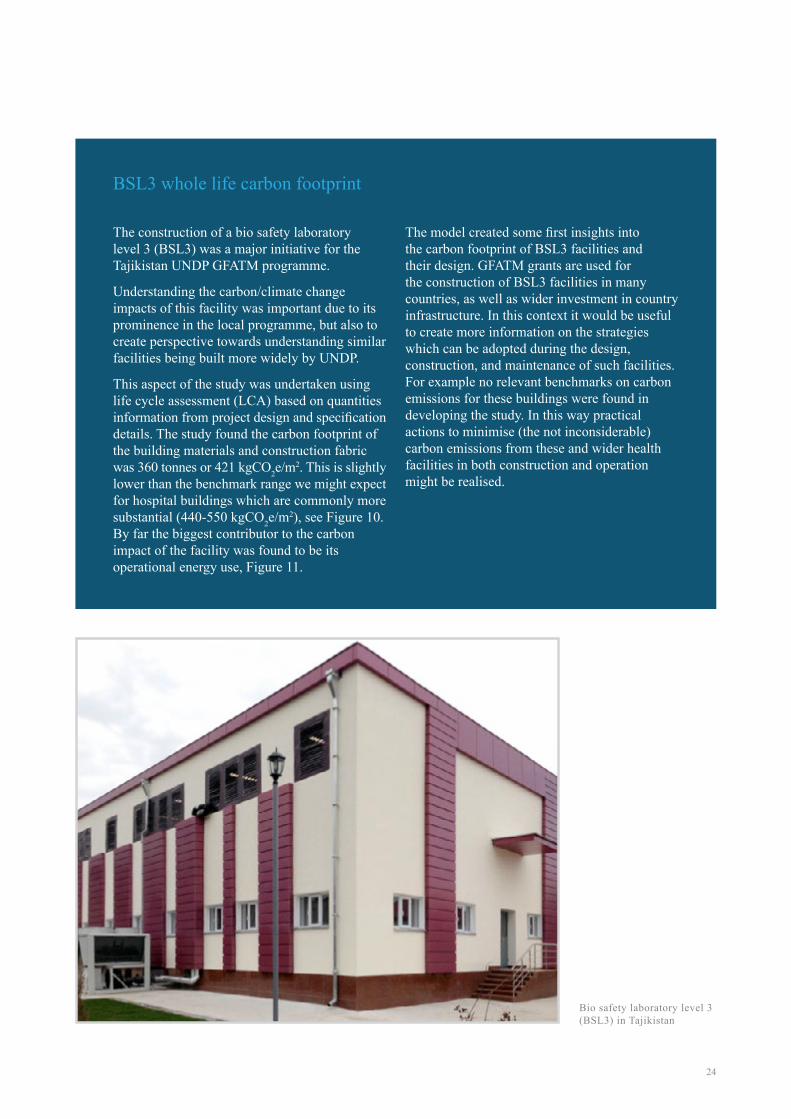
The construction of a bio safety laboratory level 3 (BSL3) was a major initiative for the Tajikistan UNDP GFATM programme.
Understanding the carbon/climate change impacts of this facility was important due to its SURPLQHQFH�LQ�WKH�ORFDO�SURJUDPPH��EXW�DOVR�WR�create perspective towards understanding similar facilities being built more widely by UNDP.
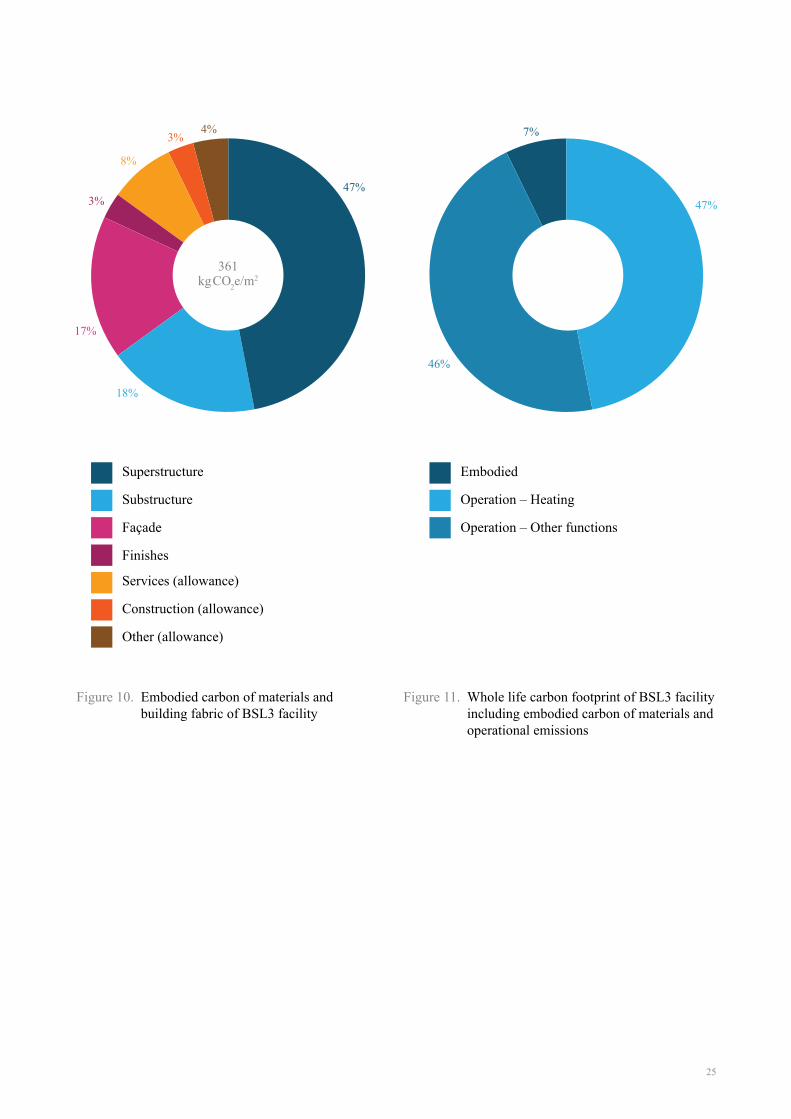
This aspect of the study was undertaken using life cycle assessment (LCA) based on quantities LQIRUPDWLRQ�IURP�SURMHFW�GHVLJQ�DQG�VSHFL¿FDWLRQ�details. The study found the carbon footprint of the building materials and construction fabric was 360 tonnes or 421 kgCO
2e/m2. This is slightly lower than the benchmark range we might expect for hospital buildings which are commonly more substantial (440-550 kgCO2e/m2���VHH�)LJXUH�����By far the biggest contributor to the carbon impact of the facility was found to be its RSHUDWLRQDO�HQHUJ\�XVH��)LJXUH����
7KH�PRGHO�FUHDWHG�VRPH�¿UVW�LQVLJKWV�LQWR�the carbon footprint of BSL3 facilities and their design. GFATM grants are used for the construction of BSL3 facilities in many FRXQWULHV��DV�ZHOO�DV�ZLGHU�LQYHVWPHQW�LQ�FRXQWU\�infrastructure. In this context it would be useful to create more information on the strategies ZKLFK�FDQ�EH�DGRSWHG�GXULQJ�WKH�GHVLJQ��FRQVWUXFWLRQ��DQG�PDLQWHQDQFH�RI�VXFK�IDFLOLWLHV��For example no relevant benchmarks on carbon emissions for these buildings were found in developing the study. In this way practical actions to minimise (the not inconsiderable) carbon emissions from these and wider health facilities in both construction and operation might be realised.
BSL3 whole life carbon footprint
Bio safety laboratory level 3 (BSL3) in Tajikistan
25
Figure 10. Embodied carbon of materials and building fabric of BSL3 facility
Figure 11. Whole life carbon footprint of BSL3 facility including embodied carbon of materials and operational emissions
47%
47%
46%
7%
18%
17%
8%
3%4%
3%
Embodied
Operation – Heating
Operation – Other functions
Superstructure
Substructure
Façade
Finishes
Services (allowance)
Construction (allowance)
Other (allowance)
361 kgCO2e/m2

���Back to Contents
27
7KH�REMHFWLYH�RI�WKLV�SURMHFW�ZDV�WR�GHYHORS�D�¿UVW�understanding of the carbon footprint of a range of UNDP implemented GFATM HIV/AIDS and TB grants in Tajikistan and Montenegro. As a ground EUHDNLQJ�VWXG\�LQ�WKH�¿HOG�LW�KDV�EHHQ�VXFFHVVIXO�LQ�FUHDWLQJ�D�¿UVW�XQGHUVWDQGLQJ�RI�JUHHQKRXVH�gas emissions sources from these global health initiatives and an indication of where UNDP and its VWDNHKROGHUV�PD\�IRFXV�WKHLU�¿UVW�PLWLJDWLQJ�DFWLRQV�In summary the following key priorities can be LGHQWL¿HG�IRU�81'3�FDUERQ�UHSRUWLQJ�DQG�PLWLJDWLRQ�interests in the administration of GFATM grants:
- Modest savings in carbon emissions could be rapidly achieved in operational activities SDUWLFXODUO\�ZKHUH�WKH�ORFDO�FRXQWU\�RI¿FH�H[HUWV�LQÀXHQFH�DQG�RU�FRQWURO��QDPHO\�DURXQG�EXVLQHVV�WUDYHO��XVH�RI�YHKLFOH�IXHO�IRU�VXE�UHFLSLHQWV��YHKLFOH�ÀHHW�PDQDJHPHQW��DQG�EXLOGLQJ�RSHUDWLRQ��
- 6LJQL¿FDQW�FDUERQ�FDQ�EH�DVVRFLDWHG�ZLWK�WKH�supply chain and it is important to examine in more detail the approach taken to global SURFXUHPHQW��DQG�WKH�FDUERQ�LPSOLFDWLRQV�RI�WKLV�approach; dialogue with the supply base on these issues will be necessary;
- The indication is that service utilisation represents a considerable carbon liability. A further more detailed study to understand impact reduction RSWLRQV�DQG�ZKDW�WKH\�PHDQ�WR�FOLHQW�JURXSV��DQG�improved service access through optimized VHUYLFH�RUJDQL]DWLRQ��FRXOG�EH�XVHIXOO\�FRPSOHWHG�
- Carry out a similar study in a different international region with generalised epidemics ZKHUH�WKH�FKDOOHQJHV�IRU�WKH�81'3��DQG�WKH�LQ�FRXQWU\�LQIUDVWUXFWXUH�DQG�VHUYLFH�GHOLYHU\��ZLOO�be different to those already studied;
- Establish a broader evidence base on the cost EHQH¿W�RI�FDUERQ�UHGXFWLRQ�LQFOXGLQJ�WKH�SRWHQWLDO�for cost savings and articulating the wider social cost of carbon emissions. This should be conducted in close dialogue with the supply base to understand cost/carbon implications;
- 0RYH�WR�XWLOLVH�PRUH�VSHFL¿F�HPLVVLRQ�IDFWRUV�IRU�headline procurement items and consider the impact of different pharmaceutical pricing VWUDWHJLHV�DQG�WKHLU�LQÀXHQFH�RQ�JUDQW�FDUERQ�intensity;
- Consider how this type of analysis could be used to inform future grant programmes by being LQFRUSRUDWHG�LQWR�SODQQLQJ�DQG�RSHUDWLRQDO�SKDVHV��and facilitated/driven through on-going data collection during delivery.
:LWK�UH¿QHPHQW�WKH�FDOFXODWLRQ�SODWIRUP�SLORWHG�in this study could be used for carbon footprint estimation in grant application processes. In due course the recording of carbon emissions and mitigation actions during grant delivery could also be monitored. Operational monitoring would provide a means to drive carbon reduction opportunities. With the right coding strategy (i.e. linking carbon emissions with grant performance indicators) carbon /climate change impact has the potential to be looked at along-side cost and other planning indicators as a detailed health planning metric.
The immediate challenge following this study will be for the UNDP to implement from the range of options available to it the right actions to begin to embed carbon reduction activities within its operations. It will be necessary to encourage contribution from a wide group of stakeholders to make this a success. Effective management of carbon emissions in individual grants will require active understanding and action throughout the RUJDQLVDWLRQ��DQG�WKH�JUDQWV�LW�DGPLQLVWHUV��DQG�should be considered as early as possible in the development of future grant programmes.
Concluding statement

���Back to Contents

For further information please contact:
Dr. Christoph Hamelmann 5HJLRQDO�3UDFWLFH�/HDGHU�+,9�� Health and Development
UNDP Bratislava Regional Centre for Europe and Central Asia
Dr. Kristian Steele Senior Analyst
Advanced Technology & Research Arup