carbon reduction institute - alto · pdf filefy2012 annual audit prepared by: jaga park-ross...
TRANSCRIPT

Carbon Reduction Institute Pty Ltd | Level 12, 100 Miller Street, North Sydney NSW 2060 P: +61 2 8228 7300 | F: +61 2 8228 7350 | W: www.noco2.com.au | ABN: 26 122 969 233
CARBON REDUCTION INSTITUTE
CARBONREDUCTIONINSTITUTE
CARBONREDUCTIONINSTITUTE
Alto Hotel on Bourke
FY2012 Annual Audit Prepared by: Jaga Park-Ross
Reviewed by: Stefan Bafatakis
Authorised by: Matt Dyson
Completed on: 9 September 2013
NoCO2 AUDIT REPORT

ALTO HOTEL ON BOURKE – CARBON AUDIT REPORT
2 CARBON REDUCTION INSTITUTE
Executive Summary The Carbon Reduction Institute (CRI), through its certification and logo system, aims to assist organisations reduce their Greenhouse Gas (GHG) emissions and provide those organisations and consumers with a simple way of identifying carbon neutral and low carbon products and services.
Alto Hotel on Bourke is Melbourne's newest CBD boutique hotel. Alto Hotel on Bourke commissioned a NoCO2 audit from CRI to measure their carbon footprint, through the determination of the GHG emissions that resulted from their operations over the 2012 financial year (FY2012).
This report provides the results of this audit, and delivers an understanding of the organisation's GHG inventory. Alto Hotel on Bourke will then be able to use this knowledge to plan future reductions of its carbon footprint, as well as determine whether they have any reporting obligations under energy and emissions reporting legislation. This report is valid within the FY2012 period, subject to Alto Hotel on Bourke’s compliance with the terms and conditions outlined by CRI.
CRI's NoCO2 audit follows the standards outlined by the World Business Council for Sustainable Development’s Greenhouse Gas Protocol Corporate Accounting and Reporting Standard (1), in addition to the international standard ISO 14064.1 (2).
The emissions from Alto Hotel on Bourke’s operations were calculated through the application of numerous published life cycle emission factors and Input-Output tables produced from a CSIRO Triple Bottom Line Analysis of the Australian economy (3). Each emissions factor is scaled to a level of consumption for its impact area, for example a kilowatt-hour of electricity or a litre of fuel.
It has been determined that the total GHG emissions from Alto Hotel on Bourke’s relevant operations and activities, within the boundaries of the NoCO2 program, were 636.35 tonnes of CO2e (tCO2e) over the FY2012 period.
A breakdown of Alto Hotel on Bourke’s emissions by source is summarised in the chart immediately below.
Figure 1: Breakdown of Alto Hotel on Bourke’s GHG Emissions, FY2012
203.41 200.33
125.62
40.74 35.11 18.12
6.72 4.35 1.95 0.00 0
50
100
150
200
250
Cost Of Sales
Electricity Expenses Assets Gas Use Waste Flights Staff Travel Fuel Consumed
Refrigerants
Emis
sion
s (tC
O2e
)

ALTO HOTEL ON BOURKE – CARBON AUDIT REPORT
3 CARBON REDUCTION INSTITUTE
Table 1: Sources of Alto Hotel on Bourke’s emissions (NoCO2 Boundaries) Scope Emission Source Emissions (tCO2e/year)
Scope 1 Fuel Consumed 1.81 Gas Use 32.57 Refrigerants 0.00
Scope 2 Electricity 178.23
Scope 3
Supply of Electricity 22.10 Supply of Gas 2.54 Staff Travel 4.35 Supply of Fuel 0.14 Assets 40.74 Expenses 125.62 Cost Of Sales 203.41 Flights 6.72 Waste 18.12
Total Footprint: 636.35
Green Power 136.96
Flight Offsets 1.69
Total 2012 Offset Requirement: 497.70
The table above encapsulates Alto Hotel on Bourke's total carbon footprint as per Figure 1 on page 2 before accounting for Carbon Neutral Expenses and offsets purchased through third parties. These results are subsequently summarized in Figure 2 below where it should be highlighted that there are yet to be any Carbon Neutral Expenses. Figure 2: Emission Sources for Alto Hotel on Bourke, FY2012
Alto Hotel on Bourke's FY2012 net carbon footprint for certification purposes under CRI's NoCO2 Program is 497.70 tCO2e. Full details of the terms and conditions of certification will be forwarded separate to this audit report.
Expenses & COS, 51.71%
Electricity, 31.48% Assets, 6.40%
Gas Use, 5.52%
Waste, 2.85%
Flights, 1.06%
Staff Travel, 0.68%
Fuel Consumed, 0.31% Refrigerants, 0.00%

ALTO HOTEL ON BOURKE – CARBON AUDIT REPORT
4 CARBON REDUCTION INSTITUTE
Table of Contents Executive Summary .......................................................................................................................................................................................................................... 2
Table of Contents ............................................................................................................................................................................................................................... 4
List of Figures ........................................................................................................................................................................................................................................ 5
List of Tables ......................................................................................................................................................................................................................................... 5
Glossary ................................................................................................................................................................................................................................................... 6
1. Introduction ............................................................................................................................................................................................................................... 7
1.1. Human Induced Climate Change and the Greenhouse Effect .......................................................................................................... 7
1.2. Operational Emissions.............................................................................................................................................................................................. 8
1.2.1. GHG Protocol...................................................................................................................................................................................................... 8
1.3. Emissions Boundaries .............................................................................................................................................................................................. 9
1.3.1. Organisational boundaries ......................................................................................................................................................................... 9
1.3.2. Operational Boundaries ............................................................................................................................................................................... 9
2. Alto Hotel on Bourke’s GHG Emissions Inventory ............................................................................................................................................. 11
2.1. Scope 1 Emissions .................................................................................................................................................................................................. 11
2.1.1. Fuel Use .............................................................................................................................................................................................................. 11
2.1.2. Gas Use .............................................................................................................................................................................................................. 11
2.2. Scope 2 Emissions .................................................................................................................................................................................................. 12
2.2.1. Electricity Use (Scope 2 & 3) ................................................................................................................................................................... 12
2.3. Scope 3 Emissions .................................................................................................................................................................................................. 13
2.3.1. Cost of Sales .................................................................................................................................................................................................... 13
2.3.2. Expenses ............................................................................................................................................................................................................ 14
2.3.3. Assets ................................................................................................................................................................................................................... 16
2.3.4. Waste ................................................................................................................................................................................................................... 17
2.3.5. Staff Air Travel (Flights) .............................................................................................................................................................................. 18
2.3.6. Staff Ground Travel ...................................................................................................................................................................................... 19
3. Emissions Analysis ............................................................................................................................................................................................................. 21
3.1. Emissions from fuel use ........................................................................................................................................................................................ 21
3.2. The combustion of gas ......................................................................................................................................................................................... 21
3.3. Electricity use .............................................................................................................................................................................................................. 21
3.4. Emissions from cost of sales ............................................................................................................................................................................. 21
3.5. Emissions from expenses .................................................................................................................................................................................... 21
3.6. Emissions from the depreciation of assets ................................................................................................................................................ 21
3.7. Emissions attributed to waste ........................................................................................................................................................................... 21
3.8. Staff travel: .................................................................................................................................................................................................................... 21
3.9. Work related flights .................................................................................................................................................................................................. 22
3.10. Comparison with Previous Years ............................................................................................................................................................... 22
References .......................................................................................................................................................................................................................................... 24
Appendix A. Uncertainty of Scope 1 Components ........................................................................................................................................................ 25
Appendix B. Breakdown of Scope 1 Constituents ........................................................................................................................................................ 26
Appendix C. Gas Use ..................................................................................................................................................................................................................... 27
Appendix D. Electricity .................................................................................................................................................................................................................. 28
Appendix E. Cost of Sales, Expenses & Assets ............................................................................................................................................................... 29
Appendix F. Staff Ground Travel ............................................................................................................................................................................................. 40
Appendix G. Staff Air Travel ........................................................................................................................................................................................................ 42

ALTO HOTEL ON BOURKE – CARBON AUDIT REPORT
5 CARBON REDUCTION INSTITUTE
List of Figures Figure 1: Breakdown of Alto Hotel on Bourke’s GHG Emissions, FY2012................................................................................ 2
Figure 2: Emission Sources for Alto Hotel on Bourke, FY2012 ...................................................................................................... 3
Figure 3: Enhanced Greenhouse Effect ..................................................................................................................................................... 8
Figure 4: NoCO2 Emissions Chart ............................................................................................................................................................. 10
Figure 5: Summary of Embodied Emissions from Cost of Sales (by General Type) ...................................................... 13
Figure 6: Summary of Embodied Emissions from Cost of Sales (by CSRIO Categories) ............................................ 14
Figure 7: Summary of Embodied Emissions from Expenses (by General Type) ............................................................. 14
Figure 8: Summary of Embodied Emissions from Expenses (by CSRIO Categories) ................................................... 15
Figure 9: Summary of Embodied Emissions from Assets (by General Type) .................................................................... 16
Figure 10: Summary of Embodied Emissions from Assets (by CSRIO Categories) ........................................................ 17
Figure 11: Summary of Staff Ground Travel Types and Emissions ......................................................................................... 20
Figure 12: Comparison of Emissions for Current and Previous Audit Periods ................................................................... 23
List of Tables Table 1: Sources of Alto Hotel on Bourke’s emissions (NoCO2 Boundaries) ................................................................................................... 3
Table 2: Emissions from Fuel Combustion ....................................................................................................................................................................... 11
Table 3: Summary of Emissions from Gas Use .............................................................................................................................................................. 11
Table 6: Summary of Emissions from Electricity Use .................................................................................................................................................. 12
Table 7: Summary of Embodied Emissions from Cost of Sales (by General Type) ................................................................................... 13
Table 8: Summary of Embodied Emissions from Expenses, (by General Type) ........................................................................................ 14
Table 9: Summary of Embodied Emissions from Expenses (by CSRIO Categories) ................................................................................ 15
Table 11: Summary of Embodied Emissions from Assets (by General Type) ............................................................................................... 16
Table 12: Summary of Embodied Emissions from Assets (by CSRIO Categories) ..................................................................................... 17
Table 13: Waste Conversion Factors (Volume To Weight) ...................................................................................................................................... 18
Table 14: Emissions from Waste (7) ..................................................................................................................................................................................... 18
Table 15: Staff flights by Alto Hotel on Bourke ................................................................................................................................................................ 18
Table 16: Emissions from Staff Ground Travel by Vehicle Type (Summary) .................................................................................................. 19
Table 17: Carbon Intensity Indicators for Alto Hotel on Bourke, (FY2012) ....................................................................................................... 21
Table 18: Sources of Alto Hotel on Bourke’s emissions for Audited Periods (NoCO2 Boundaries) .................................................. 22
Table 20: Summary Emissions from Fuel Consumed (with Uncertainties) .................................................................................................... 25
Table 21: Summary Emissions from Gas (with Uncertainties) ............................................................................................................................... 25
Table 22: Scope 1 Breakdown of Emission Totals, with Uncertainties.............................................................................................................. 26
Table 23: Site(s)' Full Gas Emissions Calculations (7) ................................................................................................................................................ 27
Table 24: Emission Factors for Electricity Consumption in Australian States (7) ........................................................................................ 28
Table 25: Site(s)' Full Electricity Emission Calculations ............................................................................................................................................. 28
Table 26: Examples of Different Embodied Energy Emission Categories ....................................................................................................... 29
Table 27: Embodied Emissions from Expenses ............................................................................................................................................................. 30
Table 28: Embodied Emissions from Assets .................................................................................................................................................................... 33
Table 29: Embodied Emissions from Cost of Sales ..................................................................................................................................................... 38
Table 30: Staff Travel Emissions ............................................................................................................................................................................................ 40
Table 31: Fuel Efficiency for Different Vehicle Types (10) ........................................................................................................................................ 41
Table 32: Emissions Factors of Fuels (7) ............................................................................................................................................................................ 41
Table 33: Kilograms of CO2e per passenger.km (10) (For Different Types of Flights) .............................................................................. 42

ALTO HOTEL ON BOURKE – CARBON AUDIT REPORT
6 CARBON REDUCTION INSTITUTE
Glossary TERM DESCRIPTION
CO2-e CO2 equivalent. This unit reflects the impact of the emission of all greenhouse gases, including CO2 (carbon dioxide), CH4 (Methane), N2O (Nitrous Oxide), Sulphur Hexafluoride (SF6) as well as fluorocarbons PFCs and HCFCs and expresses their varying global warming impacts in terms of a weighted CO2 equivalent.
EF Emissions Factor. The amount of CO2-e emitted (in kg or tonnes) per unit of according factor. GHG Greenhouse Gases (methane, CO2, N2O, etc.). Gases that contribute towards global warming.
p.km Person kilometres. A value expressing the total distance travelled by multiple individuals (i.e. one individual travelling 50km plus one individual travelling 60km is 110 p.km).
RFI Radiative Forcing Index. A factor that references the global warming multiplier effect of releasing GHGs in the upper atmosphere as opposed to ground level. This is relevant to commercial flights. Approximately equal to 1.9 (4).
FY2012 Financial year of 2012 commencing July 2011, ending June 2012.
Uplift Factor Uplift Factor. This value is an inflating factor (1.09 or, in other words, an addition of 9%) (5) that accounts for uncertainties associated with air travel such as indirect paths, delays and varying weather conditions.

ALTO HOTEL ON BOURKE – CARBON AUDIT REPORT
7 CARBON REDUCTION INSTITUTE
1. Introduction The Carbon Reduction Institute (CRI), through its NoCO2/LowCO2 certification program, aims to help businesses reduce their greenhouse gas (GHG) emissions and demonstrate their pro-active approach toward the threats posed by climate change. This program allows businesses to position themselves within industry and community as leaders in the fight against climate change and become part of the growing ‘low carbon economy’. As part of Alto Hotel on Bourke's commitment to increase the sustainability of its business practices, it is having its overall greenhouse gas impact assessed by CRI. This audit will enable Alto Hotel on Bourke to identify areas where emissions are greatest and calculate the carbon offset requirement that Alto Hotel on Bourke must fulfil in order to achieve NoCO2 certification. CRI has attached and sent a certification contract with this report that outlines the costs, terms and conditions of Alto Hotel on Bourke's certification.
1.1. Human Induced Climate Change and the Greenhouse Effect
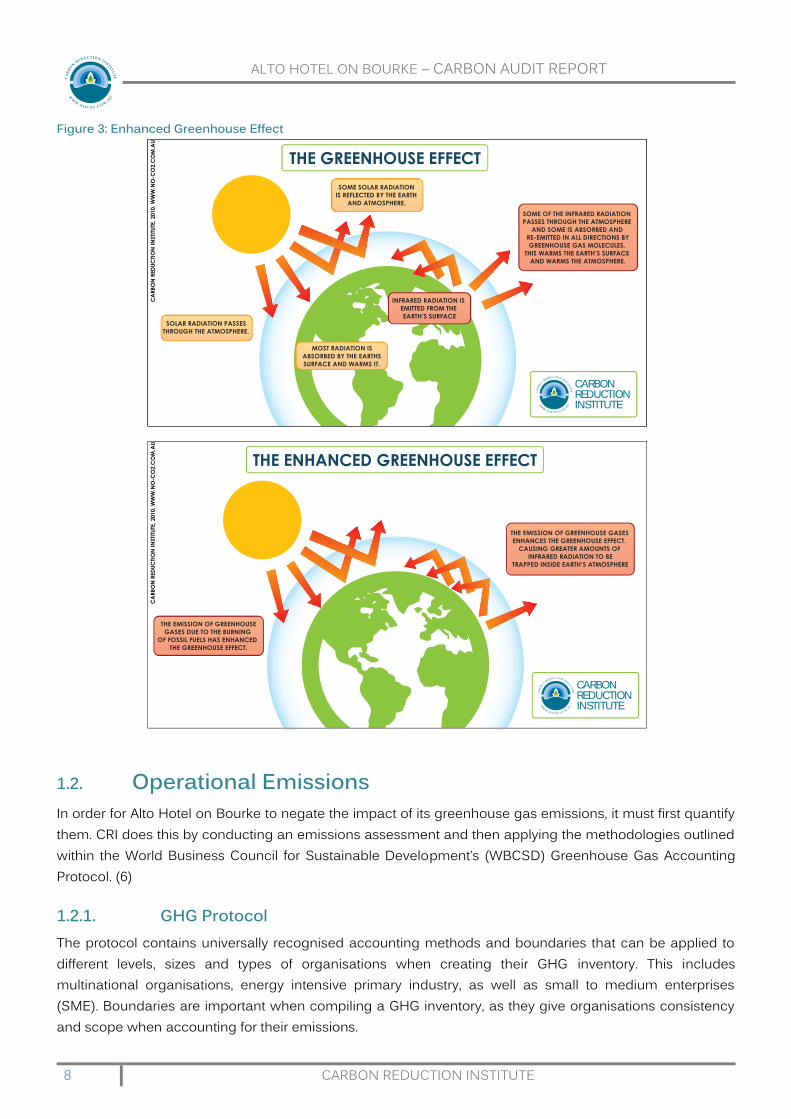
The greenhouse layer in the earth’s atmosphere reflects the sun’s rays back down to the earth. It’s a natural temperature regulating mechanism that makes the earth habitable. The layer is made up of a number of greenhouse gases; Carbon Dioxide (CO2), Methane (CH4), Nitrous Oxide (N2O) are just a few of these. Over billions of years the earth has stored vast volumes of carbon in stores underground; in pockets of coal, oil and gas. Within a very short period of time, geologically speaking, humans have extracted, burned, and therefore emitted these vast quantities of carbon (in the form of CO2) into the atmosphere. The increased concentrations of greenhouse gas in the earth’s atmosphere have caused greater amounts of solar radiation to be trapped by the greenhouse layer and reflected back to the earth. This has caused fluctuations in the earth’s climactic patterns. Figure 3 depicts how this has enhanced the earth’s natural greenhouse effect.
ALTO HOTEL ON BOURKE – CARBON AUDIT REPORT
8 CARBON REDUCTION INSTITUTE
Figure 3: Enhanced Greenhouse Effect
1.2. Operational Emissions In order for Alto Hotel on Bourke to negate the impact of its greenhouse gas emissions, it must first quantify them. CRI does this by conducting an emissions assessment and then applying the methodologies outlined within the World Business Council for Sustainable Development’s (WBCSD) Greenhouse Gas Accounting Protocol. (6)
1.2.1. GHG Protocol The protocol contains universally recognised accounting methods and boundaries that can be applied to different levels, sizes and types of organisations when creating their GHG inventory. This includes multinational organisations, energy intensive primary industry, as well as small to medium enterprises (SME). Boundaries are important when compiling a GHG inventory, as they give organisations consistency and scope when accounting for their emissions.
CARBONREDUCTIONINSTITUTE
SOME SOLAR RADIATION
IS REFLECTED BY THE EARTH
AND ATMOSPHERE.
SOLAR RADIATION PASSES
THROUGH THE ATMOSPHERE.
SOME OF THE INFRARED RADIATION
PASSES THROUGH THE ATMOSPHERE
AND SOME IS ABSORBED AND
RE-EMITTED IN ALL DIRECTIONS BY
GREENHOUSE GAS MOLECULES.
THIS WARMS THE EARTH’S SURFACE
AND WARMS THE ATMOSPHERE.
MOST RADIATION IS
ABSORBED BY THE EARTHS
SURFACE AND WARMS IT.
THE GREENHOUSE EFFECTC
AR
BO
N R
ED
UC
TIO
N I
NSTI
TUTE
, 2010.
WW
W.N
O-C
O2.C
OM
.AU
THE EMISSION OF GREENHOUSE GASES
ENHANCES THE GREENHOUSE EFFECT.
CAUSING GREATER AMOUNTS OF
INFRARED RADIATION TO BE
TRAPPED INSIDE EARTH’S ATMOSPHERE
THE EMISSION OF GREENHOUSE
GASES DUE TO THE BURNING
OF FOSSIL FUELS HAS ENHANCED
THE GREENHOUSE EFFECT.
THE ENHANCED GREENHOUSE EFFECT
CA
RB
ON
RED
UC
TIO
N I
NSTI
TUTE
, 2010.
WW
W.N
O-C
O2.C
OM
.AU
CARBONREDUCTIONINSTITUTE
INFRARED RADIATION IS
EMITTED FROM THE
EARTH’S SURFACE
ALTO HOTEL ON BOURKE – CARBON AUDIT REPORT
9 CARBON REDUCTION INSTITUTE
1.3. Emissions Boundaries There are two ‘types’ of boundaries that need to be set when compiling a GHG inventory; an organisational boundary and an operational boundary. Organisational boundaries allow a business to distinguish between GHG emitting activities that are attributable to their organisation, and those that are not. Operational boundaries allow an organisation to define the emissions that they own or control and categorise them into different scopes (as either direct or indirect). Dividing emissions up into different scopes allows an organisation to determine opportunities for emissions reduction, as well as knowing where their emissions are occurring along the value chain.
1.3.1. Organisational boundaries When setting organisational boundaries, CRI applies a financial control rationale, which states that businesses account for emissions generated from activities over which they have financial control, and derive the majority of financial benefits and/ or risks as a result of these activities. (6) CRI uses this rationale as we believe that the consumer (in this case Alto Hotel on Bourke) is responsible for the products and services that they consume, and that the purchase is an endorsement of the conditions under, and methods used to produce the goods and services consumed. This rationale is both comprehensive and simple; if you bought it, then the emissions produced and embodied within it are your responsibility. This straightforward demarcation will ensure the best outcome for Alto Hotel on Bourke, and other certified businesses as consumers will have confidence in the authenticity of organisations certified with CRI.
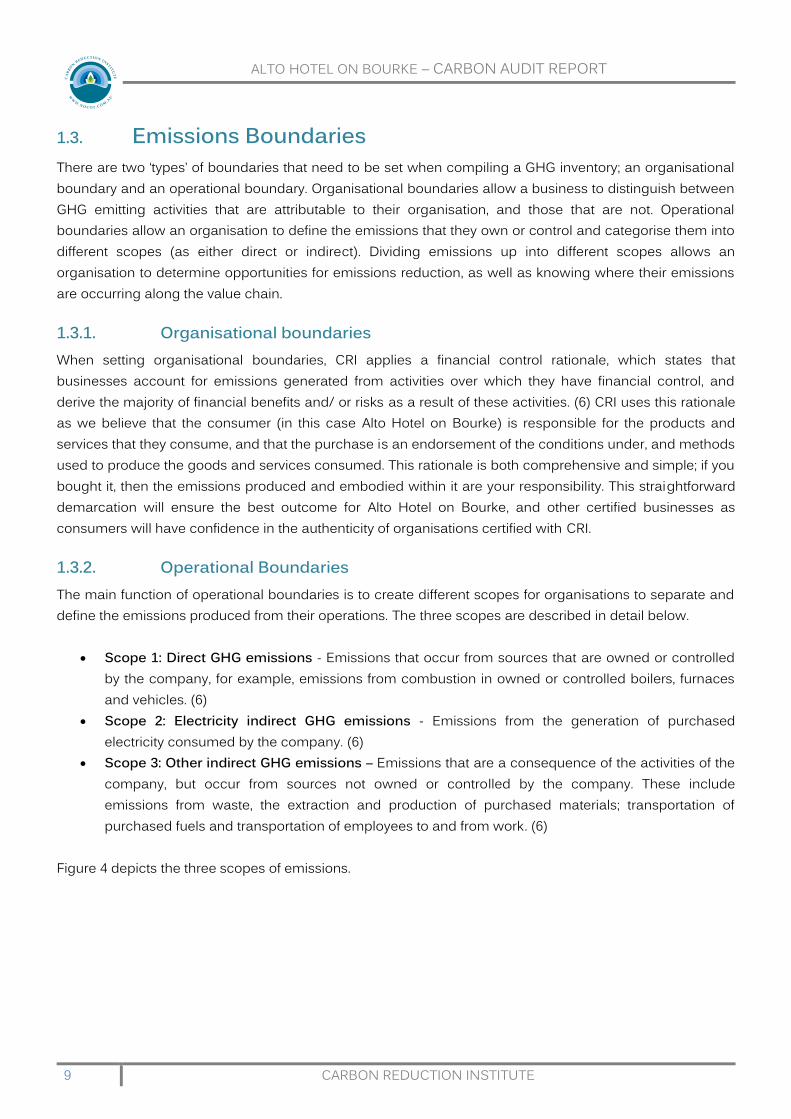
1.3.2. Operational Boundaries The main function of operational boundaries is to create different scopes for organisations to separate and define the emissions produced from their operations. The three scopes are described in detail below.
Scope 1: Direct GHG emissions - Emissions that occur from sources that are owned or controlled by the company, for example, emissions from combustion in owned or controlled boilers, furnaces and vehicles. (6)
Scope 2: Electricity indirect GHG emissions - Emissions from the generation of purchased electricity consumed by the company. (6)
Scope 3: Other indirect GHG emissions – Emissions that are a consequence of the activities of the company, but occur from sources not owned or controlled by the company. These include emissions from waste, the extraction and production of purchased materials; transportation of purchased fuels and transportation of employees to and from work. (6)
Figure 4 depicts the three scopes of emissions.
ALTO HOTEL ON BOURKE – CARBON AUDIT REPORT
10 CARBON REDUCTION INSTITUTE
Figure 4: NoCO2 Emissions Chart
The GHG protocol describes scopes 1 and 2 as mandatory reporting categories, and scope 3 as a voluntary reporting category. Under CRI’s NoCO2 certification program, it is mandatory for organisations to include scope 3 emissions. This is due to the large amount of embodied emissions associated with the sale, delivery and purchase of products and services of a company. “Embodied emissions” refer to the emissions generated in the manufacture and distribution of a product. All products require energy in production and distribution. This energy is most commonly provided through the use of fossil fuels, which have a greenhouse emissions impact. Embodied emissions are included due to the products and services that Alto Hotel on Bourke has bought and used. See section 2.3 for an in-depth description of scope 3 emissions.
NoCO2EMISSION
BOUNDARIES
Ad
op
ted
fro
m N
ZB
CSD
, 2
00
2c
arb
on
re
du
ctio
n in
stitu
te,
20
07
. w
ww
.no
-co
2.c
om
.au
CO2
SF6
CH4
SCOPE 1Direct
SCOPE 2inDirect
PURCHASED ELECTRICITY
FOR OWN USE
FUEL COMBUSTION
outsourced
activities
Waste
disposal
Employee
Business Travel
Contractor
owned
vehicles
company owned
Vehicles
PRODUCTION OF
PURCHASED
MATERIALS
SCOPE 3inDirect
HFCsPFCs
N2O

ALTO HOTEL ON BOURKE – CARBON AUDIT REPORT
11 CARBON REDUCTION INSTITUTE
2. Alto Hotel on Bourke’s GHG Emissions Inventory
2.1. Scope 1 Emissions
2.1.1. Fuel Use Fuel purchased as a company expense, for combustion in vehicles and onsite is classed as a Scope 1 emission source. Fuel also incurs a Scope 3 emission impact from the fuel’s extraction, processing and transportation prior to use. The emissions generated due to fuel use were based on fuel purchase details supplied by Alto Hotel on Bourke and calculated using emission factors outlined in the Department of Climate Change’s National Greenhouse Account Factors (7) Equation 1 illustrates this method. Equation 1: Fuel Combustion Emissions Formula
Table 2 shows a breakdown of the emissions incurred. Table 2: Emissions from Fuel Combustion
Fuel Type Purpose Litres of fuel
Per Year
CO2 EF (kgCO2e
/Litre)
CH4 EF (kgCO2e
/Litre)
N2O EF (kgCO2e
/Litre)
Total Scope 1 Emissions
(tCO2e)
Scope 3 EF (kgCO2e
/Litre)
Total Scope 3 Emissions
(tCO2e)
Total Emissions
(tCO2e) Diesel Transportation 672.43 2.67 0.01 0.02 1.81 0.20 0.14 1.95 Totals:
672.43
1.81
0.14 1.95
2.1.2. Gas Use Data regarding the amount of gas used was converted into an equivalent number of litres and appropriate emissions factors were applied. This method allowed resultant scope 1 and scope 3 emissions from gas use to be calculated, as shown in Table 3. Table 3: Summary of Emissions from Gas Use
Address State
/Location Gas Use
(GJ) Scope 1 EF
(kgCO2e/GJ)
Total Scope 1 Emissions
(tCO2e)
Scope 3 EF (kgCO2
/GJ)
Total Scope 3 Emissions
(tCO2e)
Total Emissions
(tCO2e) 636 Bouke St Melbourne VIC 3000 VIC 634.54 51.33 32.57 4.00 2.53 35.10
Totals
634.54
32.57
2.54 35.11
ALTO HOTEL ON BOURKE – CARBON AUDIT REPORT
12 CARBON REDUCTION INSTITUTE
2.2. Scope 2 Emissions
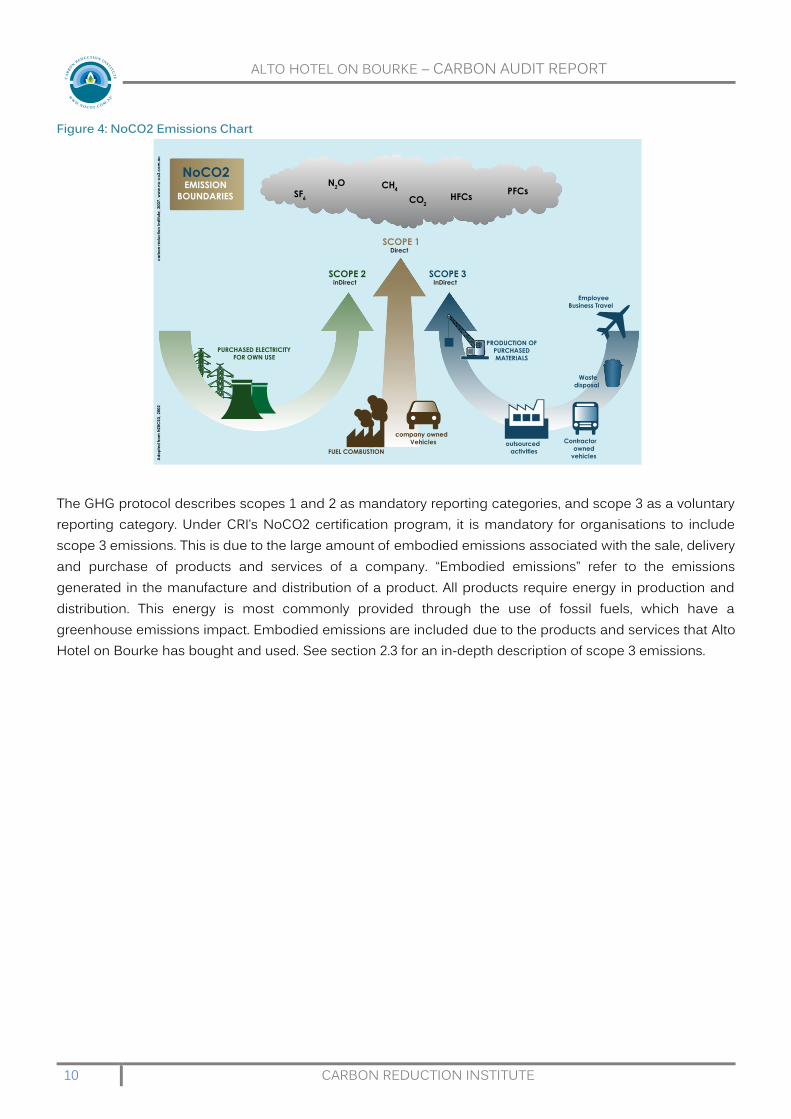
2.2.1. Electricity Use (Scope 2 & 3) Frameworks and data sets exist both within Australia and internationally that enable calculations of emissions from electricity, which follow the formulae below. Equation 2: Emissions from Electricity Use (Scope 2 & 3)
The Department of Climate Change’s National Greenhouse Accounts Factors detail the emission factors for electricity used in each state (7). These values are shown in Table 20 (Appendix D. Electricity). The following table shows a summary of the accounting implemented by CRI and resulting emissions as calculated using the described method. A more comprehensive breakdown is available Appendix D. Electricity. Table 4: Summary of Emissions from Electricity Use
Address State Electricity
Usage (kWh) Scope 2
kgCO2e/kWh
Scope 2 Emissions
tCO2e
Scope 3 kgCO2e/
kWh
Scope 3 Emissions
tCO2e
Total Emissions tCO2e
636 Bouke St, Melbourne VIC 3000 VIC 147,301.20 1.21 178.23 0.15 22.10 200.33
Total: 147,301.20
178.23
22.10 200.33
ALTO HOTEL ON BOURKE – CARBON AUDIT REPORT
13 CARBON REDUCTION INSTITUTE
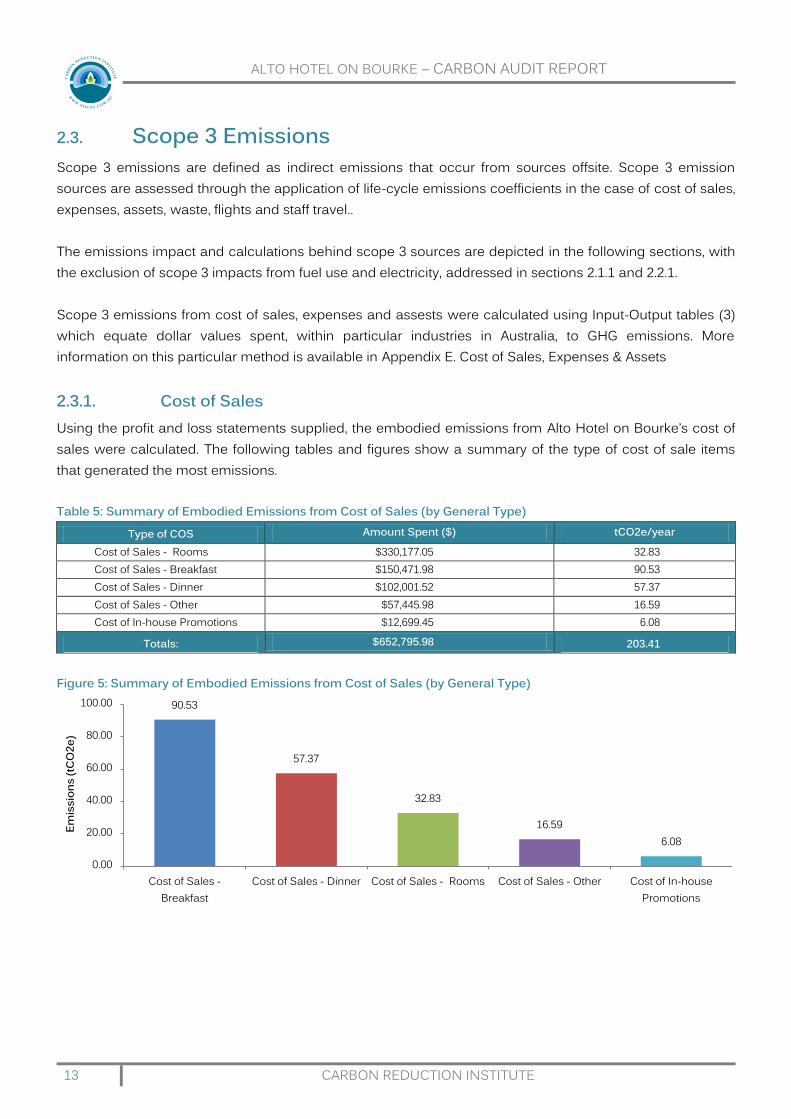
2.3. Scope 3 Emissions Scope 3 emissions are defined as indirect emissions that occur from sources offsite. Scope 3 emission sources are assessed through the application of life-cycle emissions coefficients in the case of cost of sales, expenses, assets, waste, flights and staff travel.. The emissions impact and calculations behind scope 3 sources are depicted in the following sections, with the exclusion of scope 3 impacts from fuel use and electricity, addressed in sections 2.1.1 and 2.2.1. Scope 3 emissions from cost of sales, expenses and assests were calculated using Input-Output tables (3) which equate dollar values spent, within particular industries in Australia, to GHG emissions. More information on this particular method is available in Appendix E. Cost of Sales, Expenses & Assets 2.3.1. Cost of Sales Using the profit and loss statements supplied, the embodied emissions from Alto Hotel on Bourke’s cost of sales were calculated. The following tables and figures show a summary of the type of cost of sale items that generated the most emissions. Table 5: Summary of Embodied Emissions from Cost of Sales (by General Type)
Type of COS Amount Spent ($) tCO2e/year
Cost of Sales - Rooms $330,177.05 32.83 Cost of Sales - Breakfast $150,471.98 90.53 Cost of Sales - Dinner $102,001.52 57.37 Cost of Sales - Other $57,445.98 16.59 Cost of In-house Promotions $12,699.45 6.08
Totals: $652,795.98 203.41
Figure 5: Summary of Embodied Emissions from Cost of Sales (by General Type)
90.53
57.37
32.83
16.59 6.08
0.00
20.00
40.00
60.00
80.00
100.00
Cost of Sales - Breakfast
Cost of Sales - Dinner Cost of Sales - Rooms Cost of Sales - Other Cost of In-house Promotions
Emis
sion
s (tC
O2e
)
ALTO HOTEL ON BOURKE – CARBON AUDIT REPORT
14 CARBON REDUCTION INSTITUTE
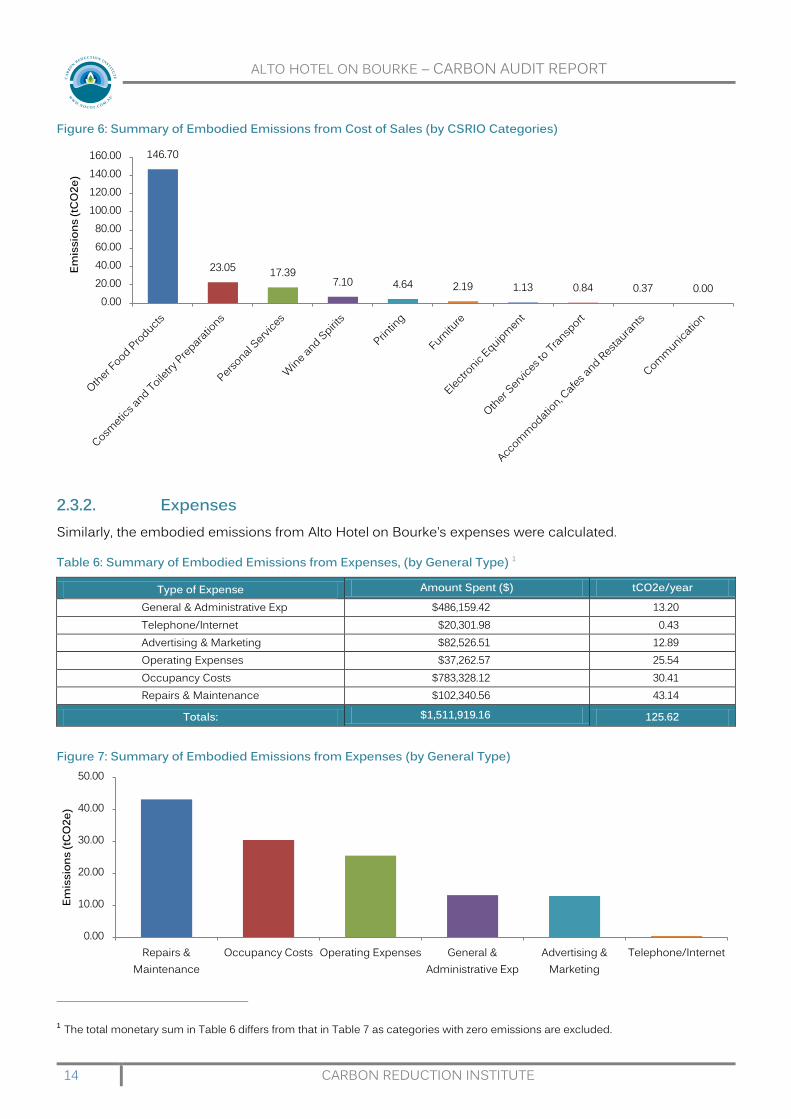
Figure 6: Summary of Embodied Emissions from Cost of Sales (by CSRIO Categories)
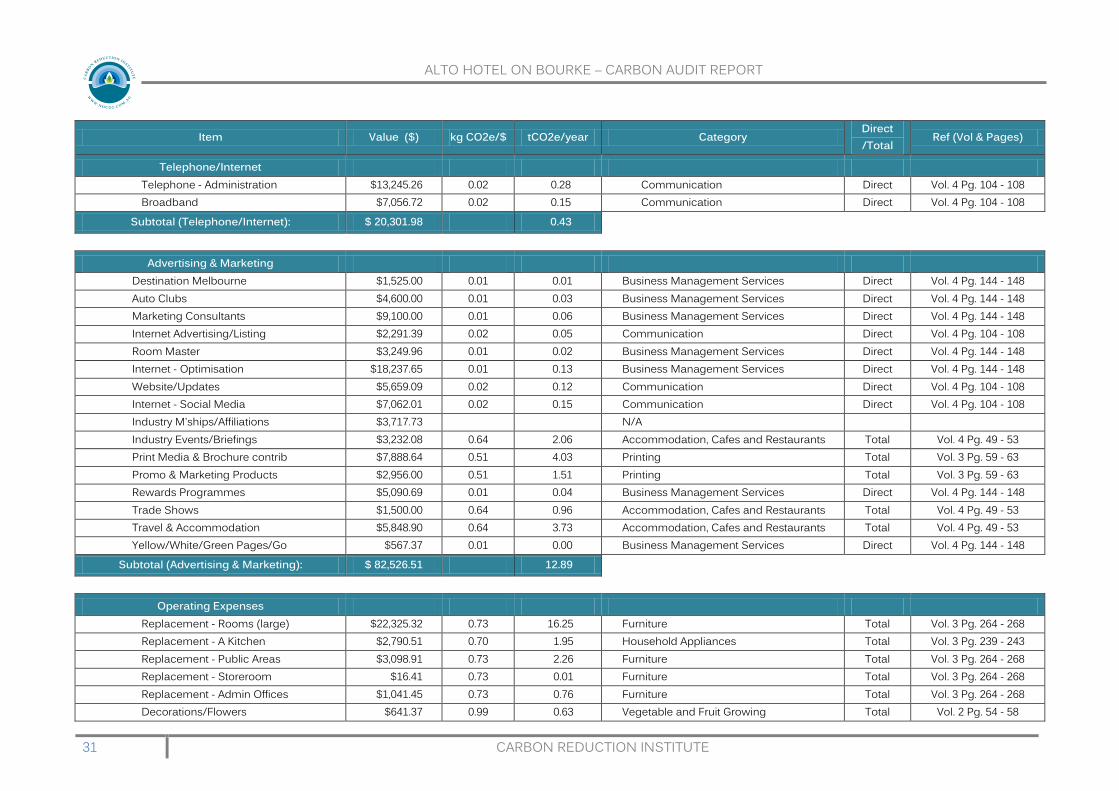
2.3.2. Expenses Similarly, the embodied emissions from Alto Hotel on Bourke’s expenses were calculated.
Table 6: Summary of Embodied Emissions from Expenses, (by General Type) 1
Type of Expense Amount Spent ($) tCO2e/year General & Administrative Exp $486,159.42 13.20 Telephone/Internet $20,301.98 0.43 Advertising & Marketing $82,526.51 12.89 Operating Expenses $37,262.57 25.54 Occupancy Costs $783,328.12 30.41 Repairs & Maintenance $102,340.56 43.14
Totals: $1,511,919.16 125.62
Figure 7: Summary of Embodied Emissions from Expenses (by General Type)
1 The total monetary sum in Table 6 differs from that in Table 7 as categories with zero emissions are excluded.
146.70
23.05 17.39 7.10 4.64 2.19 1.13 0.84 0.37 0.00
0.00 20.00 40.00 60.00 80.00
100.00 120.00 140.00 160.00
Emis
sion
s (tC
O2e
)
0.00
10.00
20.00
30.00
40.00
50.00
Repairs & Maintenance
Occupancy Costs Operating Expenses General & Administrative Exp
Advertising & Marketing
Telephone/Internet
Emis
sion
s (tC
O2e
)

ALTO HOTEL ON BOURKE – CARBON AUDIT REPORT
15 CARBON REDUCTION INSTITUTE
Table 7: Summary of Embodied Emissions from Expenses (by CSRIO Categories) Category Expense ($AUD) Emissions (tCO2e)
Residential Building 53,833.90 25.25 Sanitary and Garbage Disposal 7,544.13 23.66 Furniture 27,375.32 19.93 Printing 25,543.62 13.05 Accommodation, Cafes and Restaurants 10,580.98 6.74 Household Appliances 7,591.30 5.31 Property Services 719,201.64 5.03 Other Repairs 17,660.14 4.45 Textile Products 4,519.55 3.01 Electrical Equipment 5,600.24 2.67 Clothing 4,438.07 2.45 Non-Residential Construction 6,696.21 2.30 Electronic Equipment 5,341.53 2.24 Taxi and Hired Car with Driver 2,745.10 1.98 Water Supply, Sewerage and Drainage 16,278.00 1.60 Motor Vehicles and Parts 3,214.78 1.26 Communication 53,937.21 1.13 Mechanical Repairs 8,261.71 0.93 Business Management Services 86,084.55 0.92 Other Business Services 2,639.00 0.68 Vegetable and Fruit Growing 641.37 0.63 Other Machinery and Equipment 595.43 0.25 Government Administration 20,931.90 0.15
Totals: $ 1,091,255.68 125.62
Figure 8: Summary of Embodied Emissions from Expenses (by CSRIO Categories)
25.25 23.66
19.93
13.05
6.74 5.31 5.03 4.45
3.01 2.67 2.45 2.30 2.24 1.98 1.60 1.26 1.13 0.93 0.92 0.68 0.63 0.25 0.15 0.00
5.00
10.00
15.00
20.00
25.00
30.00
Emis
sion
s (tC
O2e
)

ALTO HOTEL ON BOURKE – CARBON AUDIT REPORT
16 CARBON REDUCTION INSTITUTE
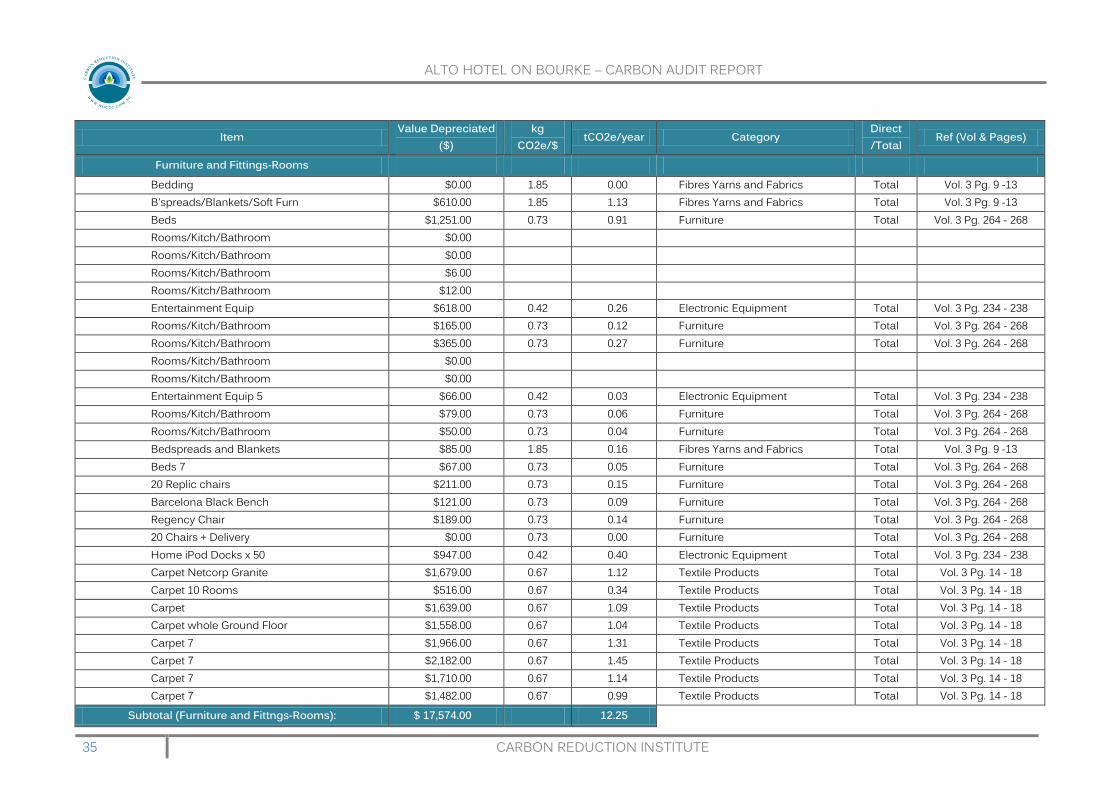
2.3.3. Assets CRI used Alto Hotel on Bourke’s depreciation schedule to calculate the embodied emissions attributed to current assets. When accounting for embodied emissions of assets, CRI scales the impact of an asset over the period in which it is depreciated for tax purposes. An asset depreciating at 50% per year, with total embodied emissions of 10 tCO2e, will register as 5 tCO2e each year of its two-year depreciable lifetime. This method ensures Alto Hotel on Bourke can update its emissions inventory with its tax reports. Written off assets are thus excluded from the assessment. The tables below show a summary of the types of assets and their attributed emissions. The full breakdown of the calculations performed can be found in Appendix E. Cost of Sales, Expenses & Assets. Table 8: Summary of Embodied Emissions from Assets (by General Type)
Type of Assets Value Depreciated ($) tCO2e/year Plant and Equipment $12,314.00 7.84 Motor Vehicles $1,844.00 0.03 Office Furniture and Equipment $5,399.00 2.66 Furniture and Fittngs-Rooms $17,574.00 12.25 Furniture and Fittngs - Other $22,282.00 14.17 Furniture and Fittings - Public Areas $5,358.00 3.80
Totals: $64,771.00 40.74
Figure 9: Summary of Embodied Emissions from Assets (by General Type)
14.17 12.25
7.84
3.80 2.66
0.03 0.00
2.00
4.00
6.00
8.00
10.00
12.00
14.00
16.00
Emis
sion
s (tC
O2e
)
ALTO HOTEL ON BOURKE – CARBON AUDIT REPORT
17 CARBON REDUCTION INSTITUTE
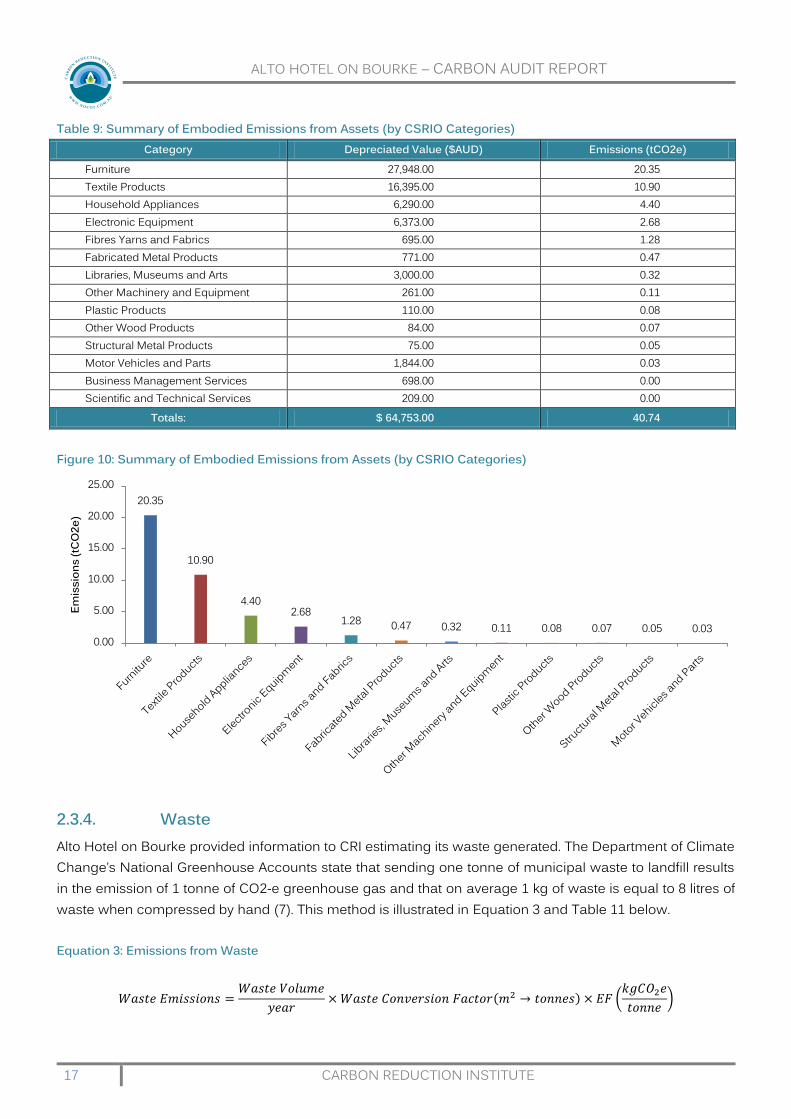
Table 9: Summary of Embodied Emissions from Assets (by CSRIO Categories) Category Depreciated Value ($AUD) Emissions (tCO2e)
Furniture 27,948.00 20.35 Textile Products 16,395.00 10.90 Household Appliances 6,290.00 4.40 Electronic Equipment 6,373.00 2.68 Fibres Yarns and Fabrics 695.00 1.28 Fabricated Metal Products 771.00 0.47 Libraries, Museums and Arts 3,000.00 0.32 Other Machinery and Equipment 261.00 0.11 Plastic Products 110.00 0.08 Other Wood Products 84.00 0.07 Structural Metal Products 75.00 0.05 Motor Vehicles and Parts 1,844.00 0.03 Business Management Services 698.00 0.00 Scientific and Technical Services 209.00 0.00
Totals: $ 64,753.00 40.74
Figure 10: Summary of Embodied Emissions from Assets (by CSRIO Categories)
2.3.4. Waste Alto Hotel on Bourke provided information to CRI estimating its waste generated. The Department of Climate Change’s National Greenhouse Accounts state that sending one tonne of municipal waste to landfill results in the emission of 1 tonne of CO2-e greenhouse gas and that on average 1 kg of waste is equal to 8 litres of waste when compressed by hand (7). This method is illustrated in Equation 3 and Table 11 below. Equation 3: Emissions from Waste
20.35
10.90
4.40 2.68
1.28 0.47 0.32 0.11 0.08 0.07 0.05 0.03 0.00
5.00
10.00
15.00
20.00
25.00
Emis
sion
s (tC
O2e
)

ALTO HOTEL ON BOURKE – CARBON AUDIT REPORT
18 CARBON REDUCTION INSTITUTE
The following waste conversion factors were used to convert data provided in volume (m3) to weight (tonnes): Table 10: Waste Conversion Factors (Volume To Weight)
Waste Type Volume to Weight (t/m3) Reference Co-Mingled 0.12 NGER (2011), Page 415
Table 11: Emissions from Waste (7)
Volume of Waste /Yr
(m3) Waste Type
Recycled Portion (%)
Conversion Factor (m3 to tonnes)
Tonnes Recycled
Tonnes Landfilled
Waste Type tCO2e /tonne waste
tCO2e
137.28 Co-Mingled 0% 0.120 0.00 16.47 Commercial & Industrial
Waste 1.10 18.12
127.92 Co-Mingled 100% 0.120 15.35 0.00 Commercial & Industrial
Waste 1.10 0.00
265.20
15.35 16.47
18.12
2.3.5. Staff Air Travel (Flights) The emissions from flights taken by Alto Hotel on Bourke were calculated employing the distance between airports, the emissions factor associated with passenger flights, the RF Index factor and the Greater Circle Flight factor. This method is illustrated in Equation 4. Equation 4: Emissions from Air Travel
Emission factors for air travel are sourced from the UK Department for Environment, Food and Rural Affairs’ (8) data for air passenger emission factors per passenger kilometre, and are scaled for domestic flights, short haul flights and long haul flights. Such values are shown in Table 29 (Appendix G. Staff Air Travel). Table 12 shows the recorded flights taken for work related affairs by individuals from Alto Hotel on Bourke and the respective calculated emissions for each flight. Table 12: Staff flights by Alto Hotel on Bourke
Flight Origin Dest. 1 Return (Y/N)
# of Passengers
tCO2e from One-way Trip
to Dest. 1
Total tCO2e
Total Flight Distance (pkm)
Third Party Offset
(tCO2e) 1 Melbourne (Aus) Cairns Y 1 0.55 1.10 4,626.37 0.00 2 Melbourne (Aus) Sydney Y 2 0.29 1.14 2,821.58 0.34 3 Melbourne (Aus) Sydney Y 2 0.29 1.14 2,821.58 0.44 4 Melbourne (Aus) Cairns Y 2 0.55 2.20 9,252.74 0.92 5 Melbourne (Aus) Sydney Y 2 0.29 1.14 2,821.58 0.00
# of Flights: 9 Total tCO2e: 6.72 22,343.85 1.69

ALTO HOTEL ON BOURKE – CARBON AUDIT REPORT
19 CARBON REDUCTION INSTITUTE
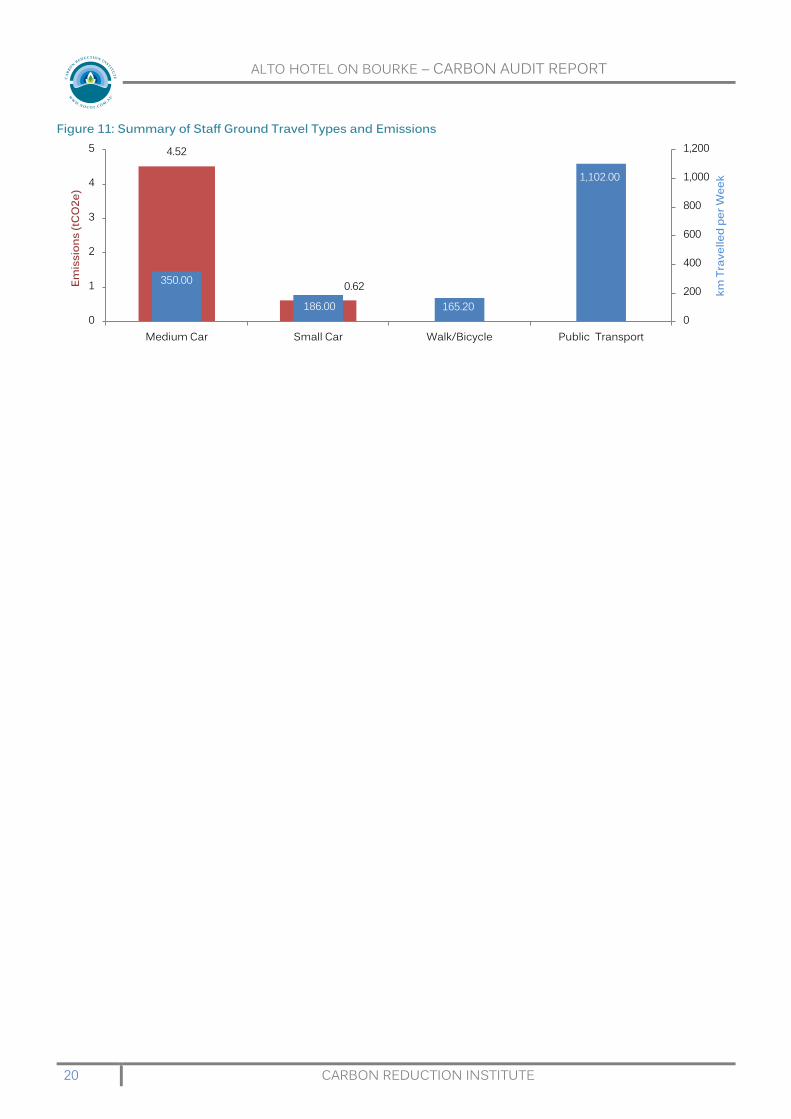
2.3.6. Staff Ground Travel Staff travel includes emissions from private road travel that takes place due to Alto Hotel on Bourke’s operations, this includes commuting to work and any work-related travel. GHG emissions resulting from the use of public transport by Alto Hotel on Bourke's staff are not attributed to Alto Hotel on Bourke, as the emissions created from its utilisation of public transport cannot be affected by Alto Hotel on Bourke’s actions through policy, technology or through direct authority. The formulae and methods used for calculating the emissions impact for small, medium and large cars are similar. Varying parameters are fuel type, fuel consumption, vehicle type and kilometres travelled. Calculations take into account any additional passengers in each carpool. Staff travel information from Alto Hotel on Bourke is collected and figures for fuel use per kilometre (9) make calculations of emissions per kilometre possible. These figures were then increased by a factor of 15% to more accurately represent real world fuel uses (8) and are shown in Table 26 (Appendix F. Staff Ground Travel). To obtain the final emission quantity for each employee’s commuting, Scope 1 and Scope 3 emission factors for transport fuel combustion were used. Emission factors for the relevant fuel types used by Alto Hotel on Bourke are available in Table 27 (Appendix F. Staff Ground Travel). Emissions from ground travel are calculated using information provided by Alto Hotel on Bourke’s office staff and/or correspondents. A total of 19 staff answered a survey regarding their average number of kilometres travelled and their individual transport methods and Alto Hotel on Bourke has indicated that a total of 16.1 Full-Time Equivalent (FTE) staff are employed. Where private vehicles were used, type of car and type of fuel used were also considered. Summarized results for each relevant vehicle type are shown in Table 13 and the full log of received data and calculations available in Appendix F. Staff Ground Travel. Table 13: Emissions from Staff Ground Travel by Vehicle Type (Summary)
Vehicle Type Quantity Total km /Week Total tCO2e /Year Medium Car 1 350.00 4.52 Small Car 4 186.00 0.62 Walk/Bicycle 13 165.20 0 Public Transport 10 1,102.00 0
Subtotal: 5.14
Total (Adjusted for FTE Staff) 4.35
ALTO HOTEL ON BOURKE – CARBON AUDIT REPORT
20 CARBON REDUCTION INSTITUTE
Figure 11: Summary of Staff Ground Travel Types and Emissions
4.52
0.62 350.00
186.00 165.20
1,102.00
0
200
400
600
800
1,000
1,200
0
1
2
3
4
5
Medium Car Small Car Walk/Bicycle Public Transport
km T
rave
lled
per W
eek
Emis
sion
s (tC
O2e
)

ALTO HOTEL ON BOURKE – CARBON AUDIT REPORT
21 CARBON REDUCTION INSTITUTE
3. Emissions Analysis This audit found that Alto Hotel on Bourke's total emissions footprint in FY2012 was 636.35 tCO2e and that a significant portion of these emissions were the result of Cost Of Sales (32%), followed by Electricity (31%) and Expenses (20%). The measure to which a company relies on a carbon-intensive economy can be deduced by looking at the average intensity of emissions per dollar spent and per full-time-equivalent employee. These two indicators have been calculated for Alto Hotel on Bourke as shown below: Table 14: Carbon Intensity Indicators for Alto Hotel on Bourke, (FY2012)
Indicator Value Emissions per dollar spent (kgCO2e /$AUD) 2 0.22 Emissions per FTE employee (tCO2e /FTE) 40
3.1. Emissions from fuel use (1.95 tonnes of CO2e) were a negligible source of GHG emissions in the context of Alto Hotel on Bourke's total emissions. The entirety of fuel-based emissions, resulted from the combustion of Diesel with a combined (scope 1 & 3) emissions intensity of 2.90 kgCO2e/L.
3.2. The combustion of gas generated 35.11 tCO2-e (a small emissions source), resulting from a total gas consumption of 634,537.90 MJ.
3.3. Electricity use produced 200.33 tCO2-e over FY2012. These emissions were resultant from a total electricity consumption of 147,301.20 kWh which compares to 155,246.93 kWh in FY2011.
3.4. Emissions from cost of sales were attributed 203.41 tCO2-e inFY2012. The most emissions–intensive cost of sales item was Breakfast - Food with its cost value of $55,374.58 being attributed 88.38 tCO2-e.
3.5. Emissions from expenses were attributed 125.62 tCO2-e in FY2012. The most emissions-intensive expense item recorded for the given audit period was Building General, with an expense of $53,833.90 being attributed 25.25 tCO2-e.
3.6. Emissions from the depreciation of assets were attributed 40.74 tCO2-e in FY2012. The most emissions-intensive asset item recorded for FY2012 was Carpets, with a depreciated value of $3,370.00 being attributed 2.24 tCO2-e.
3.7. Emissions attributed to waste contributed 18.12 tCO2-e to FY2012's carbon footprint (a very small source) stemming from the 16.47 tonnes of waste that were sent to landfill (15.35 tonnes were recycled). CRI recommends referring to services like those offered in www.cleanup.org.au for the disposal and recycling of waste types.
3.8. Staff travel: A new staff travel survey was conducted for FY2012, the results of which have been presented in Table 26. An effective 19 full-time equivalent staff were surveyed from a total of 16.1 full-time- 2 Emissions per dollar spent were calculated by dividing the total carbon footprint from expenses (125.62 tCO2e) by the monetary sum of all valid expense entries (i.e. excluding entries marked as 'N/A').

ALTO HOTEL ON BOURKE – CARBON AUDIT REPORT
22 CARBON REDUCTION INSTITUTE
equivalent employed. Ultimately, emissions from staff travel saw a significant decrease from 22.21 tCO2-e in FY2011 to 4.35 tCO2-e in FY2012, a negligible contribution towards Alto Hotel on Bourke's entire carbon footprint.
3.9. Work related flights generated 6.72 tCO2-e in FY2012, from the 9 flights that were recorded to have been taken by Alto Hotel on Bourke's staff. These covered a total of 22,343.85 individual person kilometres and generated emissions equivalent to the combustion of 14 barrels of oil.
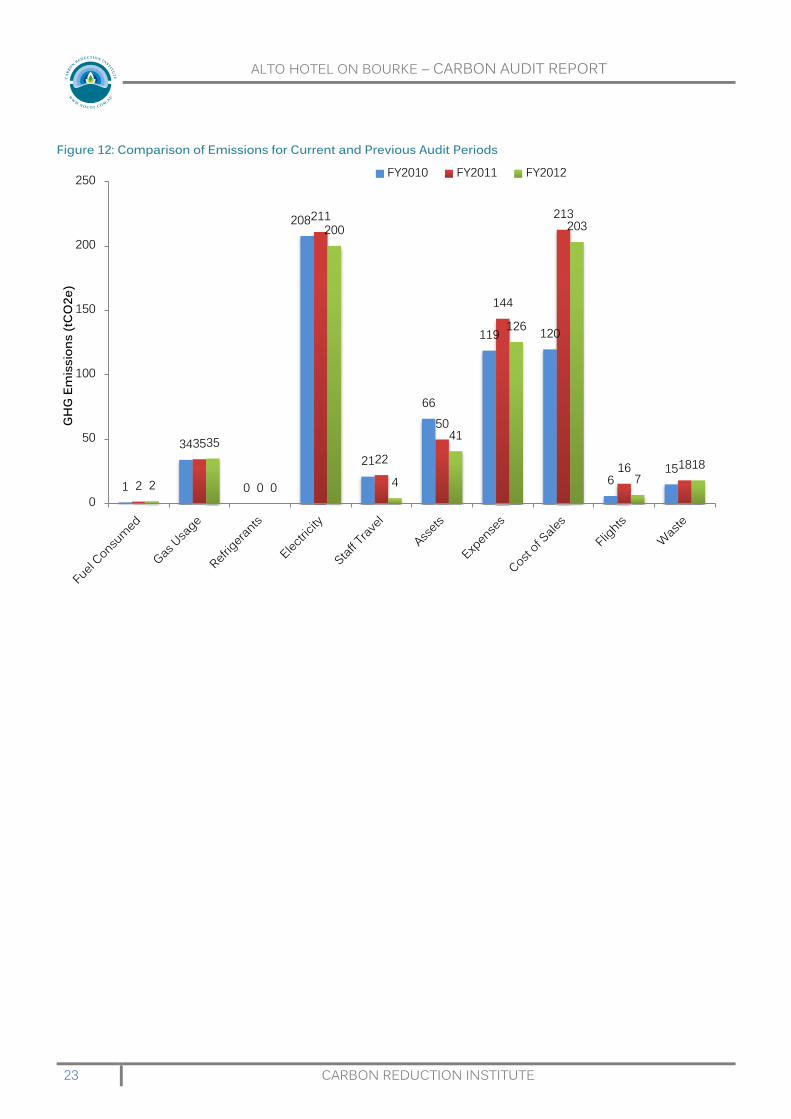
3.10. Comparison with Previous Years This audit found that Alto Hotel on Bourke's total emissions footprint has decreased from 709.64 tCO2-e in FY2011, to 636.35 tCO2-e in FY2012. The most significant change that has occurred during FY2012 is the decrease of emissions attributed to Expenses, as these changed from 143.77 tCO2-e in FY2011 to 125.62 tCO2-e in FY2012. The second largest change in emissions was a decrease in those attributed to Staff Travel. Table 15: Sources of Alto Hotel on Bourke’s emissions for Audited Periods (NoCO2 Boundaries)
Scope Emission Source FY2010 FY2011 FY2012 % Difference From
Initial Audit % Difference From
Previous Audit
Scope 1 & 3 Fuel Consumed 1.00 1.61 1.95 95% 21% Gas Usage 34.00 34.53 35.11 3% 2% Refrigerants 0.00 0.00 0.00 - -
Scope 2 & 3 Electricity 208.00 211.14 200.33 -4% -5%
Scope 3
Staff Travel 21.00 22.21 4.35 -79% -80% Assets 66.00 49.88 40.74 -38% -18% Expenses 119.00 143.77 125.62 6% -13% Cost of Sales 120.00 212.88 203.41 70% -4% Flights 6.00 15.50 6.72 12% -57% Waste 15.00 18.12 18.12 21% 0%
Total 590.14 709.64 636.35 8% -10%
ALTO HOTEL ON BOURKE – CARBON AUDIT REPORT
23 CARBON REDUCTION INSTITUTE
Figure 12: Comparison of Emissions for Current and Previous Audit Periods
1
34
0
208
21
66
119 120
6 15
2
35
0
211
22
50
144
213
16 18 2
35
0
200
4
41
126
203
7 18
0
50
100
150
200
250
GH
G E
mis
sion
s (tC
O2e
)
FY2010 FY2011 FY2012
ALTO HOTEL ON BOURKE – CARBON AUDIT REPORT
24 CARBON REDUCTION INSTITUTE
References 1. World Business Council for Sustainable Development, Wolrd Resources Institute. The Greenhouse Gas Protocol. 2004.
2. International Standards Organisation. ISO 14064-1: Specification with guidance at the organization level for quantification and reporting of greenhouse gas emissions and removals. Geneva, Switzerland : International Standards Organisation, 2006.
3. Lenzen, Manfred, Foran, Barney and Dey, Christopher. Balancing Act; A Triple Bottom Line Analysis of The Australian Economy. s.l. : CSIRO, 2005.
4. Rober Sausen, Ivar Iseksen, et al. Aviation Radiative Forcing in 2000: An Update on IPCC (1999). 2005.
5. Intergovernmental Panel on Climate Change. Aviation and the Global Atmosphere. [Online] http://www.ipcc.ch/ipccreports/sres/aviation/121.htm#8223.
6. World Resources Institute and World Business Council for Sustainable Development. The Greenhouse Protocol. Conchese-Geneva, Switzerland : s.n., 2004.
7. Australian Department of Climate Change and Energy Efficiency. National Greenhouse Accounts Factors. 2011.
8. Department of Environment, Food and Rural Affairs (DEFRA). 2011 Guidelines to DEFRA's GHG Conversion Factors: Methodology Paper for Transport Emissions Factors. 2011.
9. Australian Department of Infrastructure and Transport. Green Vehicle Guide. [Online] 2010. www.greenvehicleguide.gov.au.
10. Lenzen, Manfred, et al. Shared producer and consumer responsibility - Theory and Practice. 2006.
11. Australian Department of the Environment and Water Resources. National Greenhouse Gas Inventory: Analysis of Recent Trends and Greenhouse Gas Indicators 1990 to 2005. 2007.

ALTO HOTEL ON BOURKE – CARBON AUDIT REPORT
25 CARBON REDUCTION INSTITUTE
Appendix A. Uncertainty of Scope 1 Components CRI has complied with the associated requirements set out by the Australian National Carbon Offset Standard (NCOS) by itemizing and assessing the uncertainty margins of all scope 1 emissions. Uncertainty margins were derived by calculating emissions using values at each extreme end of their own uncertainty margins and then inspecting how much the results (upper bound and lower bound values) deviated from the actual value. Sometimes uncertainty margins can be asymmetric, meaning it is more likely to deviate one way than the other (this is common for values which have lower or upper limits). Uncertainty margins were assigned from published figures or using CRI's own judgment on the expected variability of a value, for example: Emission factors from the IPCC or NGA have uncertainty margins published (at a 95% level of
confidence). CRI uses these error margins where available. For values for other quantities (e.g. quantity of fuel prices, etc) CRI uses specialised judgement and
assigns a reasonable uncertainty margin on a case-by-case basis. The following summary tables show similar calculations to those shown in their respective parts of this report. However, each variable shows the specific uncertainty range that is inherent to its value. Table 16: Summary Emissions from Fuel Consumed (with Uncertainties)
Type of
Fuel
Litres of Fuel per Year
CO2 EF (kgCO2 /Litre)
CH4 EF (kgCO2 /Litre)
N2O EF (kgCO2 /Litre)
CO2 Emissions (tCO2e)
CH4 Emissions (tCO2e)
N2O Emissions (tCO2e)
Scope 1 Emissions (tCO2e)
Diesel 672.43 -17% to +25% 2.67 ±4%
0.01 ±52%
0.02 ±52%
1.8 -20% to +30% 0.01 -60% to +90% 0.01 -60% to +90% 1.81 -20% to +31%
Totals: 672.43 -17% to
+25% 0
1.8 -20% to +30%
0.01 -60% to +90%
0.01 -60% to +90%
1.81 -20% to +31%
Table 17: Summary Emissions from Gas (with Uncertainties)
Address Gas Type Gas Use (GJ)
Scope 1 EF (kgCO2e/GJ)
Total Scope 1 Emissions
(tCO2e)
Scope 3 EF (kgCO2
/GJ)
Total Scope 3 Emissions
(tCO2e)
Total Emissions
(tCO2e) 636 Bouke St Melbourne VIC 3000 Natural Gas 634.54 51.33 ±4% 32.57 ±4% 4 ±50% 2.54 ±50% 35.11 ±7%
Totals
634.54
32.57 ±4%
2.54 ±50% 35.11 ±7%

ALTO HOTEL ON BOURKE – CARBON AUDIT REPORT
26 CARBON REDUCTION INSTITUTE
Appendix B. Breakdown of Scope 1 Constituents The IPCC stresses that quantification of GHGs should be expressed separating each of the principal GHGs: Carbon dioxide (CO2), nitrous oxide (N2O), & methane (CH4).CRI has completed calculations to meet these requirements by including the breakdown scope 1 emissions from fuel use, gas use and refrigerant leakage. This is instanced in the following table. Table 18: Scope 1 Breakdown of Emission Totals, with Uncertainties
Emissions Source CO2 CH4 N2O Liquid Fuels 1.8 -20% to +30% 0.01 -60% to +90% 0.01 -60% to +90%
Gaseous Fuels 32.49 ±4% 0.06 ±50% 0.02 ±50% Totals (tCO2e): 34.28 ±5% 0.07 -51% to +53% 0.03 -54% to +66%
Totals (tCO2e) (All): 34.39 -5% to +6%

ALTO HOTEL ON BOURKE – CARBON AUDIT REPORT
27 CARBON REDUCTION INSTITUTE
Appendix C. Gas Use Table 19: Site(s)' Full Gas Emissions Calculations (7)
Units of Consumption: MJ Gas Type: Natural Gas Site Address: 636 Bouke St Melbourne VIC 3000 State /Location:
VIC
Supply Start Date
Supply End Date
No. of Days
Gas Use (MJ)
Gas Use (GJ)
CO2 EF (kgCO2e
/GJ)
CH4 EF (kgCO2e
/GJ)
N2O EF (kgCO2e
/GJ)
CO2 Emissions
(tCO2e)
CH4 Emissions
(tCO2e)
N2O Emissions
(tCO2e)
Total Scope 1 Emissions
(tCO2e)
Scope 3 EF (kgCO2e
/GJ)
Scope 3 Emissions
(tCO2e)
Total Emissions
(tCO2e) 7/07/2011 5/09/2011 61 118,121.00 118.12 51.2000 0.1000 0.03 6.05 0.01 0.00 6.06 4.00 0.47 6.54 5/09/2011 3/11/2011 60 116,824.00 116.82 51.2000 0.1000 0.03 5.98 0.01 0.00 6.00 4.00 0.47 6.46 4/11/2011 3/01/2012 61 92,472.00 92.47 51.2000 0.1000 0.03 4.73 0.01 0.00 4.75 4.00 0.37 5.12 4/01/2012 1/03/2012 58 83,039.00 83.04 51.2000 0.1000 0.03 4.25 0.01 0.00 4.26 4.00 0.33 4.59 2/03/2012 23/04/2012 53 78,485.00 78.49 51.2000 0.1000 0.03 4.02 0.01 0.00 4.03 4.00 0.31 4.34 7/05/2012 3/07/2012 58 119,520.00 119.52 51.2000 0.1000 0.03 6.12 0.01 0.00 6.13 4.00 0.48 6.61
Totals for Period: 350 608,461 608.46 31.15 0.06 0.02 31.23 2.43 33.67
Totals for Year: 365 634,537 634.54 32.49 0.06 0.02 32.57 2.54 35.11

ALTO HOTEL ON BOURKE – CARBON AUDIT REPORT
28 CARBON REDUCTION INSTITUTE
Appendix D. Electricity Table 20: Emission Factors for Electricity Consumption in Australian States (7)
State Scope 2 kgCO2e
/kWh
Scope 3 kgCO2e/
kWh Reference
VIC 1.21 0.15 National Greenhouse Accounts (NGA) Factors by the Australian Government: Department of Climate Change and Energy Efficiency. July 2011. Pages 68-70
Table 21: Site(s)' Full Electricity Emission Calculations
Address Period Start
Date Period Finish
Date No. of Days
Electricity Usage (kWh)
Scope 2 kgCO2e/kWh
Scope 2 Emissions tCO2e
Scope 3 kgCO2e/ kWh
Scope 3 Emissions tCO2e
Total Emissions
tCO2e 636 Bouke St, Melbourne VIC 3000 1/07/2011 31/07/2011 31 15,291.90 1.21 18.50 0.15 2.29 20.80 636 Bouke St, Melbourne VIC 3000 1/08/2011 31/08/2011 31 12,423.86 1.21 15.03 0.15 1.86 16.90 636 Bouke St, Melbourne VIC 3000 1/09/2011 30/09/2011 30 11,743.28 1.21 14.21 0.15 1.76 15.97 636 Bouke St, Melbourne VIC 3000 1/10/2011 31/10/2011 31 11,492.49 1.21 13.91 0.15 1.72 15.63 636 Bouke St, Melbourne VIC 3000 1/11/2011 30/11/2011 30 11,232.42 1.21 13.59 0.15 1.68 15.28 636 Bouke St, Melbourne VIC 3000 1/12/2011 31/12/2011 31 11,670.85 1.21 14.12 0.15 1.75 15.87 636 Bouke St, Melbourne VIC 3000 1/01/2012 31/01/2012 31 14,367.63 1.21 17.38 0.15 2.16 19.54 636 Bouke St, Melbourne VIC 3000 1/02/2012 29/02/2012 29 12,481.67 1.21 15.10 0.15 1.87 16.98 636 Bouke St, Melbourne VIC 3000 1/03/2012 31/03/2012 31 11,557.68 1.21 13.98 0.15 1.73 15.72 636 Bouke St, Melbourne VIC 3000 1/04/2012 19/04/2012 19 6,835.87 1.21 8.27 0.15 1.03 9.30 636 Bouke St, Melbourne VIC 3000 20/04/2012 30/04/2012 11 3,922.77 1.21 4.75 0.15 0.59 5.33 636 Bouke St, Melbourne VIC 3000 1/05/2012 31/05/2012 31 12,341.67 1.21 14.93 0.15 1.85 16.78 636 Bouke St, Melbourne VIC 3000 1/06/2012 30/06/2012 30 12,342.67 1.21 14.93 0.15 1.85 16.79
Total for Period: 366 147,704.76
178.72
22.16 200.88
Total for Year: 365 147,301.20
178.23
22.10 200.33
ALTO HOTEL ON BOURKE – CARBON AUDIT REPORT
29 CARBON REDUCTION INSTITUTE
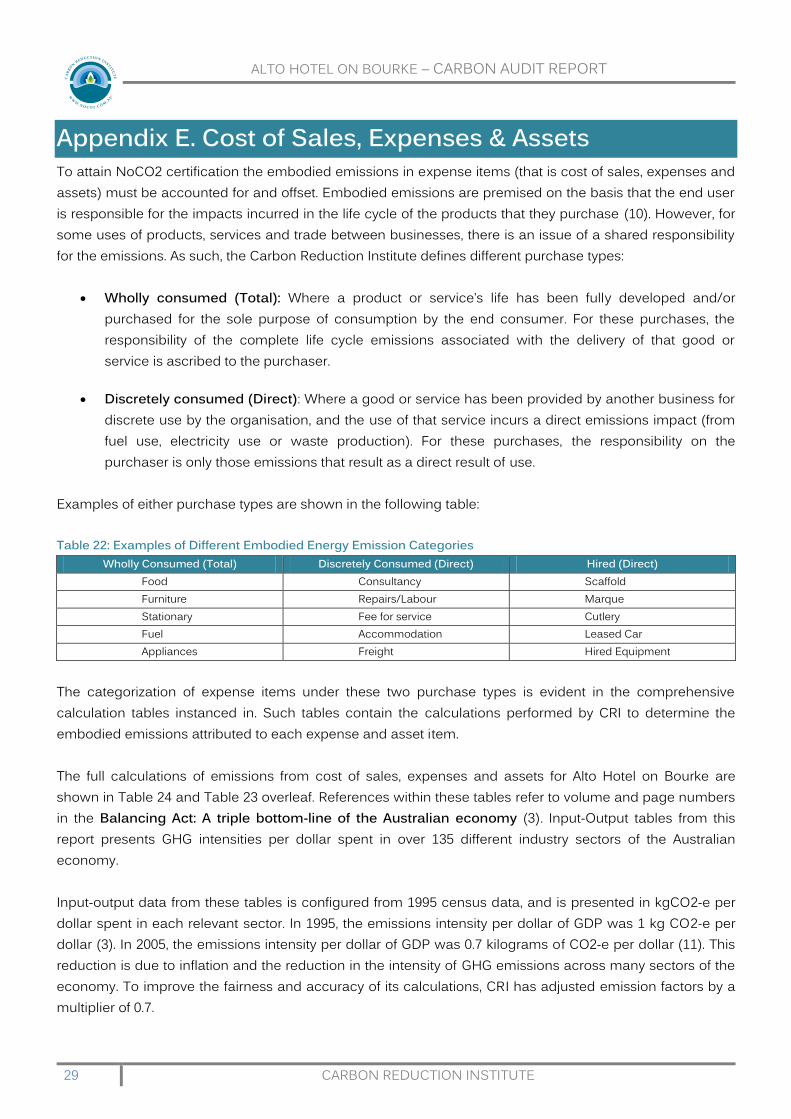
Appendix E. Cost of Sales, Expenses & Assets To attain NoCO2 certification the embodied emissions in expense items (that is cost of sales, expenses and assets) must be accounted for and offset. Embodied emissions are premised on the basis that the end user is responsible for the impacts incurred in the life cycle of the products that they purchase (10). However, for some uses of products, services and trade between businesses, there is an issue of a shared responsibility for the emissions. As such, the Carbon Reduction Institute defines different purchase types:
Wholly consumed (Total): Where a product or service’s life has been fully developed and/or purchased for the sole purpose of consumption by the end consumer. For these purchases, the responsibility of the complete life cycle emissions associated with the delivery of that good or service is ascribed to the purchaser.
Discretely consumed (Direct): Where a good or service has been provided by another business for
discrete use by the organisation, and the use of that service incurs a direct emissions impact (from fuel use, electricity use or waste production). For these purchases, the responsibility on the purchaser is only those emissions that result as a direct result of use.
Examples of either purchase types are shown in the following table: Table 22: Examples of Different Embodied Energy Emission Categories
Wholly Consumed (Total) Discretely Consumed (Direct) Hired (Direct) Food Consultancy Scaffold Furniture Repairs/Labour Marque Stationary Fee for service Cutlery Fuel Accommodation Leased Car Appliances Freight Hired Equipment
The categorization of expense items under these two purchase types is evident in the comprehensive calculation tables instanced in. Such tables contain the calculations performed by CRI to determine the embodied emissions attributed to each expense and asset item. The full calculations of emissions from cost of sales, expenses and assets for Alto Hotel on Bourke are shown in Table 24 and Table 23 overleaf. References within these tables refer to volume and page numbers in the Balancing Act: A triple bottom-line of the Australian economy (3). Input-Output tables from this report presents GHG intensities per dollar spent in over 135 different industry sectors of the Australian economy. Input-output data from these tables is configured from 1995 census data, and is presented in kgCO2-e per dollar spent in each relevant sector. In 1995, the emissions intensity per dollar of GDP was 1 kg CO2-e per dollar (3). In 2005, the emissions intensity per dollar of GDP was 0.7 kilograms of CO2-e per dollar (11). This reduction is due to inflation and the reduction in the intensity of GHG emissions across many sectors of the economy. To improve the fairness and accuracy of its calculations, CRI has adjusted emission factors by a multiplier of 0.7.

ALTO HOTEL ON BOURKE – CARBON AUDIT REPORT
30 CARBON REDUCTION INSTITUTE
Table 23: Embodied Emissions from Expenses
Item Value ($) kg CO2e/$ tCO2e/year Category Direct /Total
Ref (Vol & Pages)
General & Administrative Exp Accounting Fees $180.00 0.00 0.00 Banking Direct Vol. 4 Pg. 109 - 113 Bad Debts $210.91 0.00 0.00 Banking Direct Vol. 4 Pg. 109 - 113 Bank Charges $4,967.90 0.00 0.00 Banking Direct Vol. 4 Pg. 109 - 113 Bookkeeping $22,681.51 0.00 0.00 Banking Direct Vol. 4 Pg. 109 - 113 Consultancy Fees $1,571.95 0.01 0.01 Business Management Services Direct Vol. 4 Pg. 144 - 148 Document Storage $1,625.80 0.01 0.01 Business Management Services Direct Vol. 4 Pg. 144 - 148 Merchant Fees $38,261.77 0.01 0.27 Business Management Services Direct Vol. 4 Pg. 144 - 148 Commissions Paid (T/Agents) $133,768.63 N/A Commissions Paid (GST FREE) $48,363.55 N/A Computer Maintenance Repair $766.05 0.25 0.19 Other Repairs Total Vol. 4 Pg. 44 - 48 Computer /Telephone Support $4,824.59 0.25 1.22 Other Repairs Total Vol. 4 Pg. 44 - 48 Depreciation $78,900.00 Accounted For Via Depreciation Direct
Donations $2,945.00 N/A Donations - Green Fleet $755.00 N/A Environ/Social Responsibility $7,135.00 N/A Interest/Fees on C-Bill $51,099.40 N/A Fees & Charges $5,324.68 0.00 0.00 Banking Direct Vol. 4 Pg. 109 - 113 Filing Fees $226.00 0.01 0.00 Business Management Services Direct Vol. 4 Pg. 144 - 148 Fines & Penalties $287.50 0.01 0.00 Government Administration Direct Vol. 4 Pg. 154 - 158 Legal Costs $500.00 0.01 0.00 Business Management Services Direct Vol. 4 Pg. 144 - 148 Carbon Offset Account $10,649.92 N/A General $1,528.36 0.22 0.33 Business Management Services Total Vol. 4 Pg. 144 - 148 Insurance $27,557.60 0.00 0.00 Insurance Direct Vol. 4 Pg. 119 - 123 Freight, Taxis & Parking $2,745.10 0.72 1.98 Taxi and Hired Car with Driver Total Vol. 4 Pg. 59 - 63 Cable TV $17,175.39 0.02 0.36 Communication Direct Vol. 4 Pg. 104 - 108 Piped Music $1,447.35 0.02 0.03 Communication Direct Vol. 4 Pg. 104 - 108 Motor Vehicle Expenses $3,214.78 0.39 1.26 Motor Vehicles and Parts Total Vol. 3 Pg. 209 - 213 Printing, Stationary & Postage $14,698.98 0.51 7.51 Printing Total Vol. 3 Pg. 59 - 63 Registrations/Licences $2,746.70 0.01 0.02 Government Administration Direct Vol. 4 Pg. 154 - 158
Subtotal (General & Administrative Exp): $ 486,159.42 13.20
ALTO HOTEL ON BOURKE – CARBON AUDIT REPORT
31 CARBON REDUCTION INSTITUTE
Item Value ($) kg CO2e/$ tCO2e/year Category Direct /Total
Ref (Vol & Pages)
Telephone/Internet Telephone - Administration $13,245.26 0.02 0.28 Communication Direct Vol. 4 Pg. 104 - 108 Broadband $7,056.72 0.02 0.15 Communication Direct Vol. 4 Pg. 104 - 108
Subtotal (Telephone/Internet): $ 20,301.98 0.43
Advertising & Marketing Destination Melbourne $1,525.00 0.01 0.01 Business Management Services Direct Vol. 4 Pg. 144 - 148 Auto Clubs $4,600.00 0.01 0.03 Business Management Services Direct Vol. 4 Pg. 144 - 148 Marketing Consultants $9,100.00 0.01 0.06 Business Management Services Direct Vol. 4 Pg. 144 - 148 Internet Advertising/Listing $2,291.39 0.02 0.05 Communication Direct Vol. 4 Pg. 104 - 108 Room Master $3,249.96 0.01 0.02 Business Management Services Direct Vol. 4 Pg. 144 - 148 Internet - Optimisation $18,237.65 0.01 0.13 Business Management Services Direct Vol. 4 Pg. 144 - 148 Website/Updates $5,659.09 0.02 0.12 Communication Direct Vol. 4 Pg. 104 - 108 Internet - Social Media $7,062.01 0.02 0.15 Communication Direct Vol. 4 Pg. 104 - 108 Industry M'ships/Affiliations $3,717.73 N/A Industry Events/Briefings $3,232.08 0.64 2.06 Accommodation, Cafes and Restaurants Total Vol. 4 Pg. 49 - 53 Print Media & Brochure contrib $7,888.64 0.51 4.03 Printing Total Vol. 3 Pg. 59 - 63 Promo & Marketing Products $2,956.00 0.51 1.51 Printing Total Vol. 3 Pg. 59 - 63 Rewards Programmes $5,090.69 0.01 0.04 Business Management Services Direct Vol. 4 Pg. 144 - 148 Trade Shows $1,500.00 0.64 0.96 Accommodation, Cafes and Restaurants Total Vol. 4 Pg. 49 - 53 Travel & Accommodation $5,848.90 0.64 3.73 Accommodation, Cafes and Restaurants Total Vol. 4 Pg. 49 - 53 Yellow/White/Green Pages/Go $567.37 0.01 0.00 Business Management Services Direct Vol. 4 Pg. 144 - 148
Subtotal (Advertising & Marketing): $ 82,526.51 12.89
Operating Expenses Replacement - Rooms (large) $22,325.32 0.73 16.25 Furniture Total Vol. 3 Pg. 264 - 268 Replacement - A Kitchen $2,790.51 0.70 1.95 Household Appliances Total Vol. 3 Pg. 239 - 243 Replacement - Public Areas $3,098.91 0.73 2.26 Furniture Total Vol. 3 Pg. 264 - 268 Replacement - Storeroom $16.41 0.73 0.01 Furniture Total Vol. 3 Pg. 264 - 268 Replacement - Admin Offices $1,041.45 0.73 0.76 Furniture Total Vol. 3 Pg. 264 - 268 Decorations/Flowers $641.37 0.99 0.63 Vegetable and Fruit Growing Total Vol. 2 Pg. 54 - 58

ALTO HOTEL ON BOURKE – CARBON AUDIT REPORT
32 CARBON REDUCTION INSTITUTE
Item Value ($) kg CO2e/$ tCO2e/year Category Direct /Total
Ref (Vol & Pages)
Key Cards/Remotes $2,910.53 0.42 1.22 Electronic Equipment Total Vol. 3 Pg. 234 - 238 Uniforms $4,438.07 0.55 2.45 Clothing Total Vol. 3 Pg. 24 - 28
Subtotal (Operating Expenses): $ 37,262.57 25.54
Occupancy Costs Electricity $16,417.28 Accounted For Direct Gas $5,989.37 Accounted For Direct Rates $17,897.70 0.01 0.13 Government Administration Direct Vol. 4 Pg. 154 - 158 Rent Building 636 $719,201.64 0.01 5.03 Property Services Direct Vol. 4 Pg. 134 - 138 Rubbish/Waste Removal $7,544.13 3.14 23.66 Sanitary and Garbage Disposal Total Vol. 4 Pg. 199 - 203 Water $16,278.00 0.10 1.60 Water Supply, Sewerage and Drainage Direct Vol. 4 Pg. 14 - 18
Subtotal (Occupancy Costs): $ 783,328.12 30.41
Repairs & Maintenance Airconditioning/Heating $365.00 0.11 0.04 Mechanical Repairs Total Vol. 4 Pg. 39 - 43 Antennae System $1,181.00 0.42 0.50 Electronic Equipment Total Vol. 3 Pg. 234 - 238 Building General $53,833.90 0.47 25.25 Residential Building Total Vol. 4 Pg. 19 - 23 Carpet/Flooring $4,519.55 0.67 3.01 Textile Products Total Vol. 3 Pg. 14 - 18 Electrical $4,950.81 0.48 2.36 Electrical Equipment Total Vol. 3 Pg. 244 - 248 Fire Monitoring $1,250.00 0.42 0.53 Electronic Equipment Total Vol. 3 Pg. 234 - 238 Office Equipment $51.77 0.73 0.04 Furniture Total Vol. 3 Pg. 264 - 268 Furniture & Fittings $841.46 0.73 0.61 Furniture Total Vol. 3 Pg. 264 - 268 Grease Trap/Canopy $2,833.64 0.34 0.97 Non-Residential Construction Total Vol. 4 Pg. 24 - 28 Grounds/Carpark $3,648.93 0.34 1.25 Non-Residential Construction Total Vol. 4 Pg. 24 - 28 Kitchen Equipment Ground Floor $4,800.79 0.70 3.36 Household Appliances Total Vol. 3 Pg. 239 - 243 Lift $7,167.86 0.11 0.80 Mechanical Repairs Total Vol. 4 Pg. 39 - 43 Lighting - Globes $649.43 0.48 0.31 Electrical Equipment Total Vol. 3 Pg. 244 - 248 Locks/Safes $595.43 0.41 0.25 Other Machinery and Equipment Total Vol. 3 Pg. 254 - 258 Painting $1,427.35 0.25 0.36 Other Repairs Total Vol. 4 Pg. 44 - 48 Pest Control $2,055.00 0.26 0.53 Other Business Services Total Vol. 4 Pg. 149 - 153 Plumbing $3,143.27 0.25 0.79 Other Repairs Total Vol. 4 Pg. 44 - 48

ALTO HOTEL ON BOURKE – CARBON AUDIT REPORT
33 CARBON REDUCTION INSTITUTE
Item Value ($) kg CO2e/$ tCO2e/year Category Direct /Total
Ref (Vol & Pages)
Purchases Under $300 $213.64 0.34 0.07 Non-Residential Construction Total Vol. 4 Pg. 24 - 28 Fire Safety Management $7,498.88 0.25 1.89 Other Repairs Total Vol. 4 Pg. 44 - 48 Security $584.00 0.26 0.15 Other Business Services Total Vol. 4 Pg. 149 - 153 White Goods $728.85 0.11 0.08 Mechanical Repairs Total Vol. 4 Pg. 39 - 43
Subtotal (Repairs & Maintenance): $ 102,340.56 43.14
Table 24: Embodied Emissions from Assets
Item Value Depreciated
($) kg
CO2e/$ tCO2e/year Category
Direct /Total
Ref (Vol & Pages)
Plant and Equipment Carpets $3,370.00 0.67 2.24 Textile Products Total Vol. 3 Pg. 14 - 18 Fridges on HP $779.00 0.70 0.55 Household Appliances Total Vol. 3 Pg. 239 - 243 Plasmas on HP $1,290.00 0.42 0.54 Electronic Equipment Total Vol. 3 Pg. 234 - 238 WMF Bistro-Coffee Machine $3,032.00 0.70 2.12 Household Appliances Total Vol. 3 Pg. 239 - 243 Massage Chairs $466.00 0.70 0.33 Household Appliances Total Vol. 3 Pg. 239 - 243 Phillips 26" Hotel LCD $115.00 0.42 0.05 Electronic Equipment Total Vol. 3 Pg. 234 - 238 TV Equipment for Free-to-air channels $411.00 0.42 0.17 Electronic Equipment Total Vol. 3 Pg. 234 - 238 Hisense 460L Fridge $154.00 0.70 0.11 Household Appliances Total Vol. 3 Pg. 239 - 243 Insulating Mats $105.00 0.42 0.04 Electronic Equipment Total Vol. 3 Pg. 234 - 238 New Light Sign On Bouke St $190.00 0.70 0.13 Household Appliances Total Vol. 3 Pg. 239 - 243 Double Sided Fabricated Lightbox $293.00 0.67 0.19 Textile Products Total Vol. 3 Pg. 14 - 18 Kenwood Classic Kitchen Machine $117.00 0.70 0.08 Household Appliances Total Vol. 3 Pg. 239 - 243 Evaporative Cooler $771.00 0.61 0.47 Fabricated Metal Products Total Vol. 3 Pg. 204 - 208 2 Samsungs - Rooms $414.00 0.70 0.29 Household Appliances Total Vol. 3 Pg. 239 - 243 2 Samsung TVs $351.00 0.70 0.25 Household Appliances Total Vol. 3 Pg. 239 - 243 HP Compaq 8100 Elite 4gb $172.00 0.42 0.07 Electronic Equipment Total Vol. 3 Pg. 234 - 238 EC30A Ice Machine $284.00 0.70 0.20 Household Appliances Total Vol. 3 Pg. 239 - 243
Subtotal (Plant and Equipment): $ 12,314.00 7.84

ALTO HOTEL ON BOURKE – CARBON AUDIT REPORT
34 CARBON REDUCTION INSTITUTE
Item Value Depreciated
($) kg
CO2e/$ tCO2e/year Category
Direct /Total
Ref (Vol & Pages)
Motor Vehicles Hyundai i30 $1,844.00 0.01 0.03 Motor Vehicles and Parts Direct Vol. 3 Pg. 209 - 213
Subtotal (Motor Vehicles): $ 1,844.00 0.03
Office Furniture and Equipment
Office Equipment 3 $0.00 0.73 0.00 Furniture Total Vol. 3 Pg. 264 - 268 Office Equipment 4 $171.00 0.73 0.12 Furniture Total Vol. 3 Pg. 264 - 268 Office Equipment 5 $132.00 0.73 0.10 Furniture Total Vol. 3 Pg. 264 - 268 Office Equipment 10 $1,663.00 0.73 1.21 Furniture Total Vol. 3 Pg. 264 - 268 Office Equipment 15 $107.00 0.73 0.08 Furniture Total Vol. 3 Pg. 264 - 268 Office Equipment 20 $34.00 0.73 0.02 Furniture Total Vol. 3 Pg. 264 - 268 Office Equipment 3 $18.00 0.73 0.01 Furniture Total Vol. 3 Pg. 264 - 268 Office Equipment 4 $65.00 0.73 0.05 Furniture Total Vol. 3 Pg. 264 - 268 Office Equipment 5 $45.00 0.73 0.03 Furniture Total Vol. 3 Pg. 264 - 268 Office Equipment 10 $71.00 0.73 0.05 Furniture Total Vol. 3 Pg. 264 - 268 Office Equipment 20 $88.00 0.73 0.06 Furniture Total Vol. 3 Pg. 264 - 268 Office Equipment $30.00 0.73 0.02 Furniture Total Vol. 3 Pg. 264 - 268 Office Equipment 4 $53.00 0.73 0.04 Furniture Total Vol. 3 Pg. 264 - 268 Lenovo PC's-FOx2 $491.00 0.42 0.21 Electronic Equipment Total Vol. 3 Pg. 234 - 238 Sony Laptop $259.00 0.42 0.11 Electronic Equipment Total Vol. 3 Pg. 234 - 238 HP Printer-FO $393.00 0.42 0.17 Electronic Equipment Total Vol. 3 Pg. 234 - 238 Networking Equipment For Inhouse WIFI $443.00 0.42 0.19 Electronic Equipment Total Vol. 3 Pg. 234 - 238 New Server Supply and Installation $698.00 0.01 0.00 Business Management Services Direct Vol. 4 Pg. 144 - 148 PMS & SMDR for FO $209.00 0.01 0.00 Scientific and Technical Services Direct Vol. 4 Pg. 139 - 143 PDR 1600 16ch digital recorder with 1000gb $127.00 0.42 0.05 Electronic Equipment Total Vol. 3 Pg. 234 - 238 Cisco SG 300-28 28 Port Gigabit Switch $159.00 0.42 0.07 Electronic Equipment Total Vol. 3 Pg. 234 - 238 Netcomm HS 1100N Wireless hotspot $143.00 0.42 0.06 Electronic Equipment Total Vol. 3 Pg. 234 - 238
Subtotal (Office Furniture and Equipment): $ 5,399.00 2.66
ALTO HOTEL ON BOURKE – CARBON AUDIT REPORT
35 CARBON REDUCTION INSTITUTE
Item Value Depreciated
($) kg
CO2e/$ tCO2e/year Category
Direct /Total
Ref (Vol & Pages)
Furniture and Fittings-Rooms Bedding $0.00 1.85 0.00 Fibres Yarns and Fabrics Total Vol. 3 Pg. 9 -13 B'spreads/Blankets/Soft Furn $610.00 1.85 1.13 Fibres Yarns and Fabrics Total Vol. 3 Pg. 9 -13 Beds $1,251.00 0.73 0.91 Furniture Total Vol. 3 Pg. 264 - 268 Rooms/Kitch/Bathroom $0.00
Rooms/Kitch/Bathroom $0.00
Rooms/Kitch/Bathroom $6.00
Rooms/Kitch/Bathroom $12.00
Entertainment Equip $618.00 0.42 0.26 Electronic Equipment Total Vol. 3 Pg. 234 - 238 Rooms/Kitch/Bathroom $165.00 0.73 0.12 Furniture Total Vol. 3 Pg. 264 - 268 Rooms/Kitch/Bathroom $365.00 0.73 0.27 Furniture Total Vol. 3 Pg. 264 - 268 Rooms/Kitch/Bathroom $0.00
Rooms/Kitch/Bathroom $0.00
Entertainment Equip 5 $66.00 0.42 0.03 Electronic Equipment Total Vol. 3 Pg. 234 - 238 Rooms/Kitch/Bathroom $79.00 0.73 0.06 Furniture Total Vol. 3 Pg. 264 - 268 Rooms/Kitch/Bathroom $50.00 0.73 0.04 Furniture Total Vol. 3 Pg. 264 - 268 Bedspreads and Blankets $85.00 1.85 0.16 Fibres Yarns and Fabrics Total Vol. 3 Pg. 9 -13 Beds 7 $67.00 0.73 0.05 Furniture Total Vol. 3 Pg. 264 - 268 20 Replic chairs $211.00 0.73 0.15 Furniture Total Vol. 3 Pg. 264 - 268 Barcelona Black Bench $121.00 0.73 0.09 Furniture Total Vol. 3 Pg. 264 - 268 Regency Chair $189.00 0.73 0.14 Furniture Total Vol. 3 Pg. 264 - 268 20 Chairs + Delivery $0.00 0.73 0.00 Furniture Total Vol. 3 Pg. 264 - 268 Home iPod Docks x 50 $947.00 0.42 0.40 Electronic Equipment Total Vol. 3 Pg. 234 - 238 Carpet Netcorp Granite $1,679.00 0.67 1.12 Textile Products Total Vol. 3 Pg. 14 - 18 Carpet 10 Rooms $516.00 0.67 0.34 Textile Products Total Vol. 3 Pg. 14 - 18 Carpet $1,639.00 0.67 1.09 Textile Products Total Vol. 3 Pg. 14 - 18 Carpet whole Ground Floor $1,558.00 0.67 1.04 Textile Products Total Vol. 3 Pg. 14 - 18 Carpet 7 $1,966.00 0.67 1.31 Textile Products Total Vol. 3 Pg. 14 - 18 Carpet 7 $2,182.00 0.67 1.45 Textile Products Total Vol. 3 Pg. 14 - 18 Carpet 7 $1,710.00 0.67 1.14 Textile Products Total Vol. 3 Pg. 14 - 18 Carpet 7 $1,482.00 0.67 0.99 Textile Products Total Vol. 3 Pg. 14 - 18
Subtotal (Furniture and Fittngs-Rooms): $ 17,574.00 12.25

ALTO HOTEL ON BOURKE – CARBON AUDIT REPORT
36 CARBON REDUCTION INSTITUTE
Item Value Depreciated
($) kg
CO2e/$ tCO2e/year Category
Direct /Total
Ref (Vol & Pages)
Furniture and Fittngs - Other FF at cost 5 $1,269.00 0.73 0.92 Furniture Total Vol. 3 Pg. 264 - 268 FF at cost 6 $1,139.00 0.73 0.83 Furniture Total Vol. 3 Pg. 264 - 268 FF at cost 7 $3,902.00 0.73 2.84 Furniture Total Vol. 3 Pg. 264 - 268 FF at cost 8 $687.00 0.73 0.50 Furniture Total Vol. 3 Pg. 264 - 268 FF at cost 20 $127.00 0.73 0.09 Furniture Total Vol. 3 Pg. 264 - 268 FF at cost 5 $638.00 0.73 0.46 Furniture Total Vol. 3 Pg. 264 - 268 FF at cost 7 $100.00 0.73 0.07 Furniture Total Vol. 3 Pg. 264 - 268 Improvements at cost 5 $166.00 0.73 0.12 Furniture Total Vol. 3 Pg. 264 - 268 FF at cost 5 $189.00 0.73 0.14 Furniture Total Vol. 3 Pg. 264 - 268 Cafe Assets $1,586.00 0.73 1.15 Furniture Total Vol. 3 Pg. 264 - 268 Bannister rails $84.00 0.88 0.07 Other Wood Products Total Vol. 3 Pg. 44 - 48 Legs for Cup n Cool $75.00 0.69 0.05 Structural Metal Products Total Vol. 3 Pg. 194 - 198 Twin Tank Juice Dispenser $189.00 0.42 0.08 Electronic Equipment Total Vol. 3 Pg. 234 - 238 2 * Samsung TV's $445.00 0.42 0.19 Electronic Equipment Total Vol. 3 Pg. 234 - 238 Prints $1,298.00 0.11 0.14 Libraries, Museums and Arts Total Vol. 4 Pg. 184 - 188 Prints $1,298.00 0.11 0.14 Libraries, Museums and Arts Total Vol. 4 Pg. 184 - 188 Sofas and Seats $8,186.00 0.73 5.96 Furniture Total Vol. 3 Pg. 264 - 268 Coffee table tops $500.00 0.73 0.36 Furniture Total Vol. 3 Pg. 264 - 268 Mural - Electric Car $404.00 0.11 0.04 Libraries, Museums and Arts Total Vol. 4 Pg. 184 - 188
Subtotal (Furniture and Fittngs - Other): $ 22,282.00 14.17
Furniture and Fittings - Public Areas
Public areas 1 $0.00 Furniture Vol. 3 Pg. 264 - 268 Public areas 3 $4.00 0.73 0.00 Furniture Total Vol. 3 Pg. 264 - 268 Public areas 5 $141.00 0.73 0.10 Furniture Total Vol. 3 Pg. 264 - 268 Public areas 10 $338.00 0.73 0.25 Furniture Total Vol. 3 Pg. 264 - 268 Public areas 15 $948.00 0.73 0.69 Furniture Total Vol. 3 Pg. 264 - 268 Public areas 20 $219.00 0.73 0.16 Furniture Total Vol. 3 Pg. 264 - 268 A Kitchen/Crock/Glass 1 $0.00
A kitchen utensils 2 $0.00
Kitchen Appliances 3 $40.00 0.70 0.03 Household Appliances Total Vol. 3 Pg. 239 - 243

ALTO HOTEL ON BOURKE – CARBON AUDIT REPORT
37 CARBON REDUCTION INSTITUTE
Item Value Depreciated
($) kg
CO2e/$ tCO2e/year Category
Direct /Total
Ref (Vol & Pages)
Kitchen Appliances 5 $171.00 0.70 0.12 Household Appliances Total Vol. 3 Pg. 239 - 243 Kitchen Appliances 10 $167.00 0.70 0.12 Household Appliances Total Vol. 3 Pg. 239 - 243 Kitchen Bench/Shelving 15 $328.00 0.73 0.24 Furniture Total Vol. 3 Pg. 264 - 268 Public Areas 1 $0.00
Public Areas 3 $0.00
Public Areas 5 $283.00 0.73 0.21 Furniture Total Vol. 3 Pg. 264 - 268 Public Areas 10 $195.00 0.73 0.14 Furniture Total Vol. 3 Pg. 264 - 268 Public Areas 15 $255.00 0.73 0.19 Furniture Total Vol. 3 Pg. 264 - 268 Public Areas 20 $96.00 0.73 0.07 Furniture Total Vol. 3 Pg. 264 - 268 A Kitchen/Crock/Glass 1 $0.00
A kitchen utensils 2 $0.00
Kitchen Appliance 3 $2.00 0.70 0.00 Household Appliances Total Vol. 3 Pg. 239 - 243 Kitchen equipment 8 $58.00 0.70 0.04 Household Appliances Total Vol. 3 Pg. 239 - 243 Public areas 10 $643.00 0.73 0.47 Furniture Total Vol. 3 Pg. 264 - 268 Public areas 15 $144.00 0.73 0.10 Furniture Total Vol. 3 Pg. 264 - 268 Waterpoint Ultraslim Tank $65.00 0.70 0.05 Household Appliances Total Vol. 3 Pg. 239 - 243 Public Areas 5 (less coffee machine) $725.00 0.73 0.53 Furniture Total Vol. 3 Pg. 264 - 268 Mirrors for Corridor $165.00 0.73 0.12 Furniture Total Vol. 3 Pg. 264 - 268 Cosmo shoe shine machine $261.00 0.41 0.11 Other Machinery and Equipment Total Vol. 3 Pg. 254 - 258 Slimline rainwater tank $110.00 0.70 0.08 Plastic Products Total Vol. 3 Pg. 134 - 138
Subtotal (Furniture and Fittings - Public Areas): $ 5,358.00 3.80

ALTO HOTEL ON BOURKE – CARBON AUDIT REPORT
38 CARBON REDUCTION INSTITUTE
Table 25: Embodied Emissions from Cost of Sales
Item Value ($) kg CO2e/$ tCO2e/year Category Direct or
Total Ref (Vol & Pages)
Cost of Sales - Rooms Rooms - Consumables $28,827.69 0.48 13.72 Cosmetics and Toiletry Preparations Total Vol. 3 Pg. 119 - 123 Room Replacements (small) $3,001.96 0.73 2.19 Furniture Total Vol. 3 Pg. 264 - 268 Linen Hire/Drycleaning/Laundry $49,820.83 0.34 16.74 Personal Services Total Vol. 4 Pg. 194 - 198 Rooms - Wages $248,238.91 N/A Accomodation Expense $287.66 0.64 0.18 Accommodation, Cafes and Restaurants Total Vol. 4 Pg. 49 - 53
Subtotal (Cost of Sales - Rooms): $ 330,177.05 32.83
Cost of Sales - Breakfast Breakfast - Food $55,374.58 1.60 88.38 Other Food Products Total Vol. 2 Pg. 184 - 188 Breakfast - Consumables $1,351.20 1.60 2.16 Other Food Products Total Vol. 2 Pg. 184 - 188 Breakfast - Wages $93,746.20 N/A
Subtotal (Cost of Sales - Breakfast): $ 150,471.98 90.53
Cost of Sales - Dinner Dinner - Food $30,828.64 1.60 49.20 Other Food Products Total Vol. 2 Pg. 184 - 188 Dinner - Beverage $7,554.16 0.62 4.65 Wine and Spirits Total Vol. 2 Pg. 199 - 203 Dinner - Consumables $2,200.73 1.60 3.51 Other Food Products Total Vol. 2 Pg. 184 - 188 Dinner - Wages $23,181.56 N/A Dinner - Contract Wages $38,236.43 N/A
Subtotal (Cost of Sales - Dinner): $ 102,001.52 57.37
Cost of Sales - Other Guest Dry Cleaning/Laundry $1,949.29 0.34 0.65 Personal Services Total Vol. 4 Pg. 194 - 198 Washing Machine $2,700.00 0.42 1.13 Electronic Equipment Total Vol. 3 Pg. 234 - 238 Complementary (apples, news) $19,591.42 0.48 9.33 Cosmetics and Toiletry Preparations Total Vol. 3 Pg. 119 - 123 Gym Passes $9,074.54 0.51 4.64 Printing Total Vol. 3 Pg. 59 - 63 Car Parking Leasing $23,901.80 0.04 0.84 Other Services to Transport Direct Vol. 4 Pg. 99 - 103 Postage - Lost Property $228.93 0.02 0.00 Communication Direct Vol. 4 Pg. 104 - 108 Subtotal (Cost of Sales - Other) $ 57,445.98 16.59
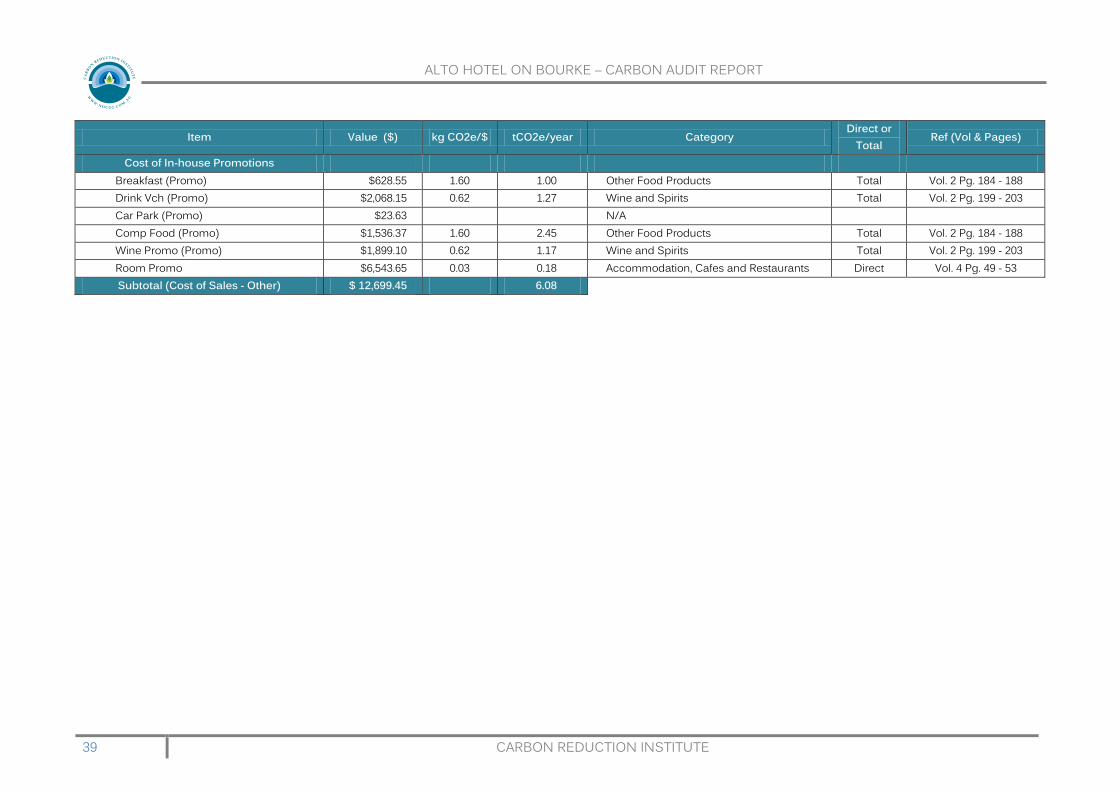
ALTO HOTEL ON BOURKE – CARBON AUDIT REPORT
39 CARBON REDUCTION INSTITUTE
Item Value ($) kg CO2e/$ tCO2e/year Category Direct or
Total Ref (Vol & Pages)
Cost of In-house Promotions Breakfast (Promo) $628.55 1.60 1.00 Other Food Products Total Vol. 2 Pg. 184 - 188 Drink Vch (Promo) $2,068.15 0.62 1.27 Wine and Spirits Total Vol. 2 Pg. 199 - 203 Car Park (Promo) $23.63 N/A Comp Food (Promo) $1,536.37 1.60 2.45 Other Food Products Total Vol. 2 Pg. 184 - 188 Wine Promo (Promo) $1,899.10 0.62 1.17 Wine and Spirits Total Vol. 2 Pg. 199 - 203 Room Promo $6,543.65 0.03 0.18 Accommodation, Cafes and Restaurants Direct Vol. 4 Pg. 49 - 53 Subtotal (Cost of Sales - Other) $ 12,699.45 6.08

ALTO HOTEL ON BOURKE – CARBON AUDIT REPORT
40 CARBON REDUCTION INSTITUTE
Appendix F. Staff Ground Travel Table 26: Staff Travel Emissions 3
First Name
Private Vehicle km /wk
Vehicle Type Fuel (%) Paid
by Organisation
Fuel Type Carpools? # of People
In Car % of Time Carpooled
km /Yr Fuel Economy
(L /km) Litres /Yr
Scope 1 EF
(kgCO2e /L)
Scope 3 EF
(kgCO2e /L)
Staff Travel
Emissions (tCO2e
/Yr) Jenny 90.00 Small Car (1.4ltr, 4cyl)
Petrol Yes 2 100% 4,320.00 0.08 170.64 2.380 0.181 0.44
Andry 16.00 Small Car (1.4ltr, 4cyl)
Petrol No
768.00 0.08 60.67 2.380 0.181 0.16 John 350.00 Medium Car (1.8ltr, 4cyl)
Petrol No
16,800.00 0.11 1,764.00 2.380 0.181 4.52
Carmel 0.00 Not Applicable
Not Applicable No
0.00 0.00 0.00 - - 0 Charly 0.00 Not Applicable
Not Applicable No
0.00 0.00 0.00 - - 0
Karlena 0.00 Not Applicable
Not Applicable No
0.00 0.00 0.00 - - 0 Bhavesh 36.00 Not Applicable
Not Applicable No
1,728.00 0.00 0.00 - - 0
Dinesh 0.00 Not Applicable
Not Applicable No
0.00 0.00 0.00 - - 0 Sophia 0.00 Not Applicable
Not Applicable No
0.00 0.00 0.00 - - 0
Pippa 5.00 Small Car (1.4ltr, 4cyl)
Petrol Yes 2 90% 240.00 0.08 10.43 2.380 0.181 0.03 Rachel 0.00 Not Applicable
Not Applicable No
0.00 0.00 0.00 - - 0
Trang 0.00 Not Applicable
Not Applicable No
0.00 0.00 0.00 - - 0 Liu 0.00 Not Applicable
Not Applicable No
0.00 0.00 0.00 - - 0
Rose 0.00 Not Applicable
Not Applicable No
0.00 0.00 0.00 - - 0 Emily 0.00 Not Applicable
Not Applicable No
0.00 0.00 0.00 - - 0
Rachel 0.00 Not Applicable
Not Applicable No
0.00 0.00 0.00 - - 0 Saly 0.00 Not Applicable
Not Applicable No
0.00 0.00 0.00 - - 0
Charly 0.00 Not Applicable
Not Applicable No
0.00 0.00 0.00 - - 0 Gary 75.00 Small Car (1.4ltr, 4cyl) 100% Diesel No 1
3,600.00 0.06 231.84 2.698 0.205 0
Total Emissions (tCO2e): 5.14
Number of Surveyed Staff (FTE): 19.00
Number of Full-Time-Equivalent Staff: 16.1
Total Emissions (tCO2e) (Adjusted for FTE Staff) 4.35
3 Annual km are calculated based on the assumption of 48 working weeks per year.

ALTO HOTEL ON BOURKE – CARBON AUDIT REPORT
41 CARBON REDUCTION INSTITUTE
Table 27: Fuel Efficiency for Different Vehicle Types (9)
Vehicle Type Fuel Consumption (Litres /km) Petrol Small Car (1.4ltr, 4cyl) 0.079 Petrol Medium Car (1.8ltr, 4cyl) 0.105 Diesel Small Car (1.4ltr, 4cyl) 0.0644
Table 28: Emissions Factors of Fuels (7)
Fuel Type Scope 1 EF (kgCO2e/L) Scope 3 EF (kgCO2e/L) Reference Petrol 2.38032 0.18126 NGER Technical Guidelines 2011, p382 Diesel 2.69814 0.20458 NGER Technical Guidelines 2011, p382
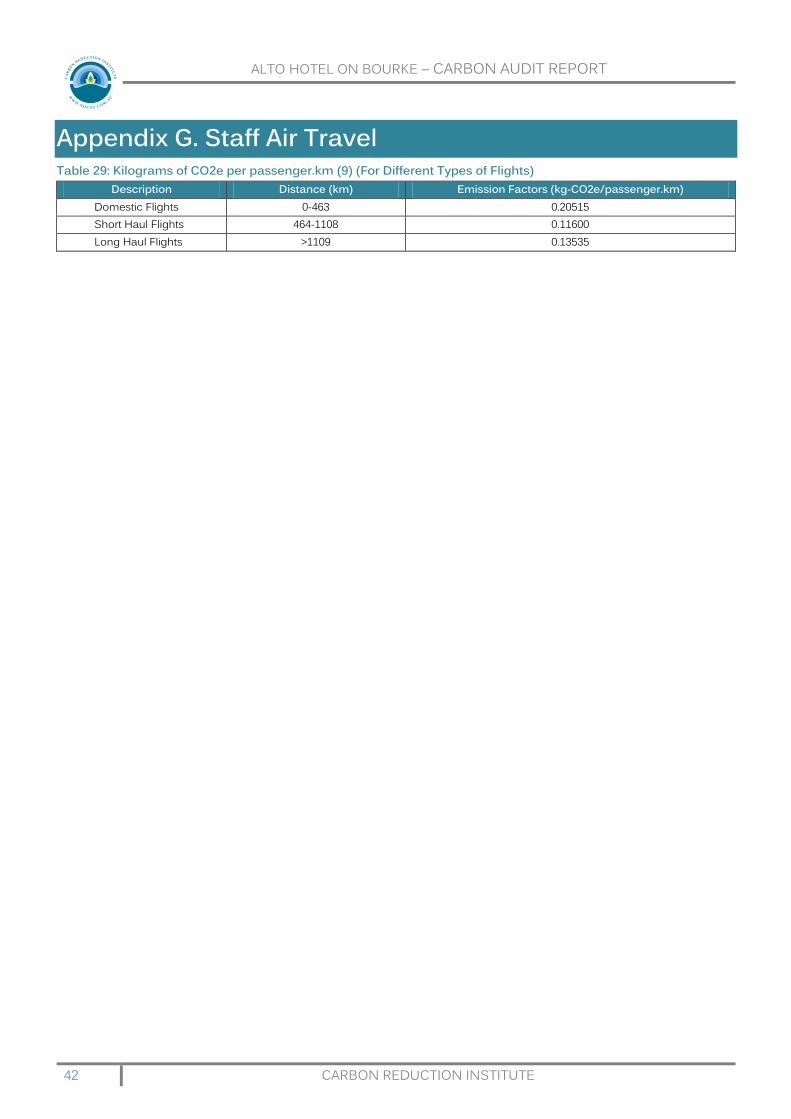
ALTO HOTEL ON BOURKE – CARBON AUDIT REPORT
42 CARBON REDUCTION INSTITUTE
Appendix G. Staff Air Travel Table 29: Kilograms of CO2e per passenger.km (9) (For Different Types of Flights)
Description Distance (km) Emission Factors (kg-CO2e/passenger.km) Domestic Flights 0-463 0.20515 Short Haul Flights 464-1108 0.11600 Long Haul Flights >1109 0.13535