carbon report - seb...in this case, the sector weighting of seb teknologifond saved 17.4 tco2e,...
TRANSCRIPT
Carbon ReportSEB Teknologifond
Report created on: Feb 25, 2019
The carbon footprint provides a historic snapshotof the emissions from the equity holdings of thefund. The calculations are not comprehensive andindirect emissions, e.g. from suppliers, are basedon reported data or estimates of emissions. Themetric says nothing about how the portfoliocontributes to a low-carbon society. For furtherinformation about the metric, seewww.sebgroup.com.

Carbon Report - SEB Teknologifond
Contents . . . . . . . . . . . . . . . . . . . . . . . . . . 3Executive Summary
. . . . . . . . 4Sector weighting and relative carbon footprint . . . . . . . . . . . . . . 4Relative Carbon Footprint Comparison
. . . . . . . . . . . . . . . . . 4Sector Analysis & Stock Selection . . . . . . . . . . . . . . . . . . . . . . . . . . 5Attribution Analysis
. . . . . . . . . 6Summary of 10 largest absolute contributors . . . . . . . . . . 6Summary of 10 largest portfolio companies
. . . . . . . . . . . . . . . . . . . . . . . . . . . 7Scope 3 Overview . . . . . . . . . . . . . . . . . . . 8Company Sector & Breakdown
. . . . . . . . . . . . . . . . . . . . . . . . . . . . 10Carbon Ranking
2

Carbon Report - SEB Teknologifond
Carbon ReportSEB TeknologifondReport created on: Feb 25, 2019 | Holdings Date: Dec 31, 2018 | Benchmark: MSCI World Information Technology Net Return IndexCurrency: SEK | Industry Classification: GICS | Company Breakdown Metrics: carbon intensity (tCO2e / Mio. revenue) | Value: 5'733'497'871.00SEKFund Management Company: SEB Investment Management AB
Executive SummaryCarbon emissions
Scope 1-2(tCO2e)
Total carbonemissions incl.
Scope 3 (tCO2e)
Relative CarbonFootprint
(kgCO2e / SEK1'000 invested)
Carbon Intensity(kgCO2e / SEK
1'000 revenue)
WeightedAverage Carbon
Intensity (kgCO2e/ SEK 1'000
revenue)
DisclosingTitles
by Weight(market value)
Portfolio 8'763.5 30'306.4 1.5 3.3 3.2 91.1% 97.9%
Benchmark 5'605.2 18'924.0 0.9 3.3 2.5 70.9% 96.9%
Total carbon emissions
- measure the carbon footprint of a portfolioconsidering Scope 1-2 as well as Scope 3emissions.*)
- SEB Teknologifond is associated withgreenhouse gas emissions of 8'763.5 tonsper year.
Relative carbon footprint
- is a normalized measure of the portfolio'scontribution.
- It enables comparisons with a benchmarkbetween multiple portfolios, over time andregardless of portfolio size.
Carbon intensity
- allows investors to measure how muchcarbon emissions per SEK of revenue aregenerated.
- It therefore measures the carbon efficiencyof a portfolio per unit of output.
This report analyses the portfolio of securities in terms of thecarbon emissions and other carbon related characteristics ofthe underlying portfolio companies, and compares this data tothe performance of a relevant respectively chosen marketbenchmark.
The portfolio’s intensity is 0.5% higher than the benchmark.
100.0 100.099.5
64.0
Carbon Intensity Carbon Emissions0.0
20.0
40.0
60.0
80.0
100.0
120.0
Portfolio Benchmark
The Sectors Information Technology, All other Sectors and (per GICSclassification) in the portfolio make up 100.0% of the weight vs.100.0% of the contribution to emissions.
97.9%
2.1%
100.0%
Sector Weight Contribution to Emissions
Information TechnologyAll other Sectors
5 smallest contributors to the emissions of the fund are:Financed
emissions(tCO2e)
% of total Relative carbonfootprint
(kg CO2e / SEK 1'000Invested)
Mastercard 3.5 0.0% 0.0
Apple 3.7 0.0% 0.0
Visa 4.6 0.1% 0.0
NVIDIA 5.9 0.1% 0.1
Intuit 6.2 0.1% 0.1
5 largest contributors to the emissions of the fund are:Financed
emissions(tCO2e)
% of total Relative carbonfootprint
(kg CO2e / SEK 1'000Invested)
Konica 1'266.2 14.8% 10.5
STMicroelectronics 1'007.2 11.7% 8.0
Fujitsu 907.7 10.6% 7.3
Kyocera 714.1 8.3% 5.9
Murata 591.2 6.9% 4.9
*) Scope 1 emissions are directly generated by company's operations, whereas indirect Scope 2 emissions are related to the company's energy consumption. Scope 3 emissions include other indirect emissions
including e.g. business travel, use of company's products sold, investments, and goods and services purchased.
3

Carbon Report - SEB Teknologifond
Sector weighting and relative carbon footprint
WeightRel. Carbon Footprint
tCO2e / Mio SEK invested Portfolio vs.Benchmark
Portfolio Benchmark Portfolio Benchmark
Information Technology 97.91% 96.29% 1.5 0.9 58.42%
Relative Carbon Footprint Comparison
Info
rmat
ion
Tech
nolo
gy
0.0
0.5
1.0
1.5
Portfolio Benchmark
Sector Analysis & Stock SelectionThe graph below shows how the carbon allocation in the portfolio differs from the average ofeach sector. Sectors have been defined using the GICS classification at theSupersector/Industry Group level.
App
licat
ion
Soft
war
eCo
mm
unic
atio
ns E
quip
men
t
Dat
a Pr
oces
sing
& O
utso
urce
d Se
rvic
esEl
ectr
onic
Com
pone
nts
Elec
tron
ic E
quip
men
t & In
stru
men
tsEl
ectr
onic
Man
ufac
turin
g Se
rvic
esIT
Con
sulti
ng &
Oth
er S
ervi
ces
Sem
icon
duct
or E
quip
men
t
Sem
icon
duct
ors
Syst
ems
Soft
war
e
Tech
nolo
gy H
ardw
are,
Sto
rage
& P
erip
hera
ls
0%
10%
20%
30%
40%
Portfolio GICS Sub-Industry Emissions
Benchmark, Average GICS Sub-Industry Emissions
4
Carbon Report - SEB Teknologifond
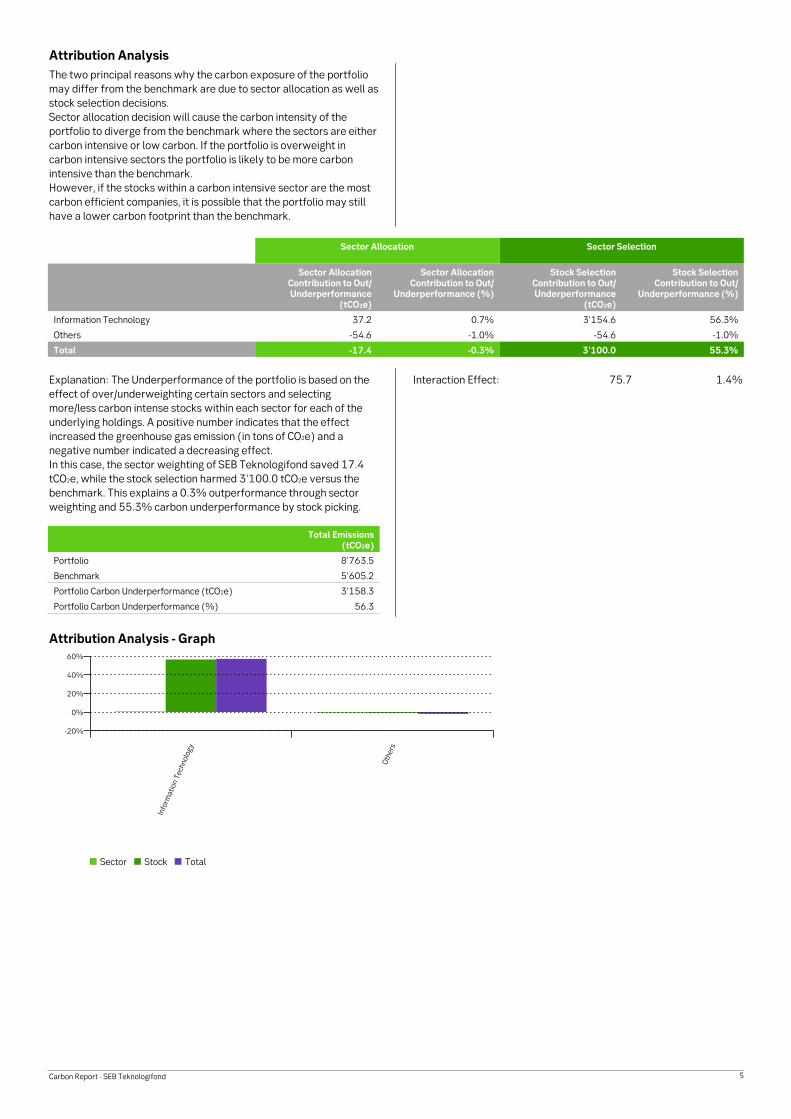
Attribution AnalysisThe two principal reasons why the carbon exposure of the portfoliomay differ from the benchmark are due to sector allocation as well asstock selection decisions.Sector allocation decision will cause the carbon intensity of theportfolio to diverge from the benchmark where the sectors are eithercarbon intensive or low carbon. If the portfolio is overweight incarbon intensive sectors the portfolio is likely to be more carbonintensive than the benchmark.However, if the stocks within a carbon intensive sector are the mostcarbon efficient companies, it is possible that the portfolio may stillhave a lower carbon footprint than the benchmark.
Sector Allocation Sector Selection
Sector AllocationContribution to Out/Underperformance
(tCO2e)
Sector AllocationContribution to Out/
Underperformance (%)
Stock SelectionContribution to Out/Underperformance
(tCO2e)
Stock SelectionContribution to Out/
Underperformance (%)
Information Technology 37.2 0.7% 3'154.6 56.3%
Others -54.6 -1.0% -54.6 -1.0%
Total -17.4 -0.3% 3'100.0 55.3%
Explanation: The Underperformance of the portfolio is based on theeffect of over/underweighting certain sectors and selectingmore/less carbon intense stocks within each sector for each of theunderlying holdings. A positive number indicates that the effectincreased the greenhouse gas emission (in tons of CO2e) and anegative number indicated a decreasing effect.In this case, the sector weighting of SEB Teknologifond saved 17.4tCO2e, while the stock selection harmed 3'100.0 tCO2e versus thebenchmark. This explains a 0.3% outperformance through sectorweighting and 55.3% carbon underperformance by stock picking.
Total Emissions(tCO2e)
Portfolio 8'763.5
Benchmark 5'605.2
Portfolio Carbon Underperformance (tCO2e) 3'158.3
Portfolio Carbon Underperformance (%) 56.3
Interaction Effect: 75.7 1.4%
Attribution Analysis - Graph
Info
rmat
ion
Tech
nolo
gy
Oth
ers
-20%
0%
20%
40%
60%
Sector Stock Total
5
Carbon Report - SEB Teknologifond
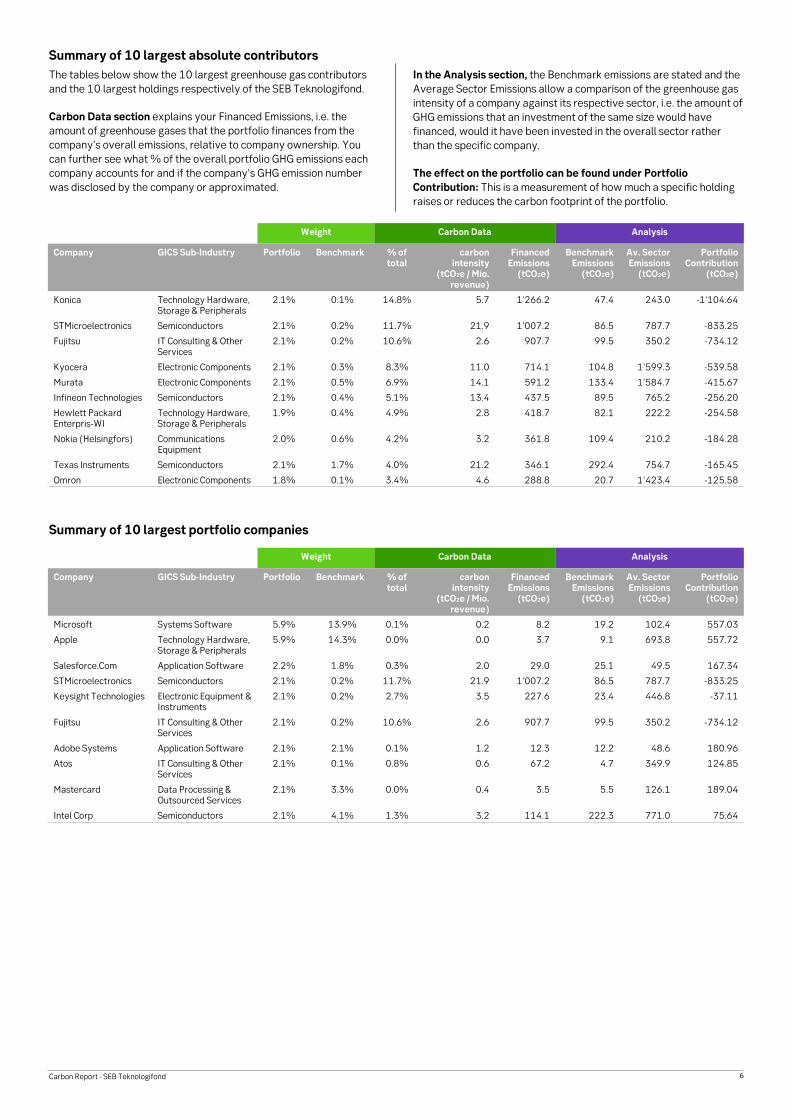
Summary of 10 largest absolute contributorsThe tables below show the 10 largest greenhouse gas contributorsand the 10 largest holdings respectively of the SEB Teknologifond.
Carbon Data section explains your Financed Emissions, i.e. theamount of greenhouse gases that the portfolio finances from thecompany’s overall emissions, relative to company ownership. Youcan further see what % of the overall portfolio GHG emissions eachcompany accounts for and if the company’s GHG emission numberwas disclosed by the company or approximated.
In the Analysis section, the Benchmark emissions are stated and theAverage Sector Emissions allow a comparison of the greenhouse gasintensity of a company against its respective sector, i.e. the amount ofGHG emissions that an investment of the same size would havefinanced, would it have been invested in the overall sector ratherthan the specific company.
The effect on the portfolio can be found under PortfolioContribution: This is a measurement of how much a specific holdingraises or reduces the carbon footprint of the portfolio.
Weight Carbon Data Analysis
Company GICS Sub-Industry Portfolio Benchmark % oftotal
carbonintensity
(tCO2e / Mio.revenue)
FinancedEmissions
(tCO2e)
BenchmarkEmissions
(tCO2e)
Av. SectorEmissions
(tCO2e)
PortfolioContribution
(tCO2e)
Konica Technology Hardware,Storage & Peripherals
2.1% 0.1% 14.8% 5.7 1'266.2 47.4 243.0 -1'104.64
STMicroelectronics Semiconductors 2.1% 0.2% 11.7% 21.9 1'007.2 86.5 787.7 -833.25
Fujitsu IT Consulting & OtherServices
2.1% 0.2% 10.6% 2.6 907.7 99.5 350.2 -734.12
Kyocera Electronic Components 2.1% 0.3% 8.3% 11.0 714.1 104.8 1'599.3 -539.58
Murata Electronic Components 2.1% 0.5% 6.9% 14.1 591.2 133.4 1'584.7 -415.67
Infineon Technologies Semiconductors 2.1% 0.4% 5.1% 13.4 437.5 89.5 765.2 -256.20
Hewlett PackardEnterpris-WI
Technology Hardware,Storage & Peripherals
1.9% 0.4% 4.9% 2.8 418.7 82.1 222.2 -254.58
Nokia (Helsingfors) CommunicationsEquipment
2.0% 0.6% 4.2% 3.2 361.8 109.4 210.2 -184.28
Texas Instruments Semiconductors 2.1% 1.7% 4.0% 21.2 346.1 292.4 754.7 -165.45
Omron Electronic Components 1.8% 0.1% 3.4% 4.6 288.8 20.7 1'423.4 -125.58
Summary of 10 largest portfolio companies
Weight Carbon Data Analysis
Company GICS Sub-Industry Portfolio Benchmark % oftotal
carbonintensity
(tCO2e / Mio.revenue)
FinancedEmissions
(tCO2e)
BenchmarkEmissions
(tCO2e)
Av. SectorEmissions
(tCO2e)
PortfolioContribution
(tCO2e)
Microsoft Systems Software 5.9% 13.9% 0.1% 0.2 8.2 19.2 102.4 557.03
Apple Technology Hardware,Storage & Peripherals
5.9% 14.3% 0.0% 0.0 3.7 9.1 693.8 557.72
Salesforce.Com Application Software 2.2% 1.8% 0.3% 2.0 29.0 25.1 49.5 167.34
STMicroelectronics Semiconductors 2.1% 0.2% 11.7% 21.9 1'007.2 86.5 787.7 -833.25
Keysight Technologies Electronic Equipment &Instruments
2.1% 0.2% 2.7% 3.5 227.6 23.4 446.8 -37.11
Fujitsu IT Consulting & OtherServices
2.1% 0.2% 10.6% 2.6 907.7 99.5 350.2 -734.12
Adobe Systems Application Software 2.1% 2.1% 0.1% 1.2 12.3 12.2 48.6 180.96
Atos IT Consulting & OtherServices
2.1% 0.1% 0.8% 0.6 67.2 4.7 349.9 124.85
Mastercard Data Processing &Outsourced Services
2.1% 3.3% 0.0% 0.4 3.5 5.5 126.1 189.04
Intel Corp Semiconductors 2.1% 4.1% 1.3% 3.2 114.1 222.3 771.0 75.64
6

Carbon Report - SEB Teknologifond
Scope 3 OverviewThe following section provides a top-down approximation of thefinanced scope 3 emissions from each sector. The purpose of thisanalysis is to give an order of magnitude of the emissions in theportfolio on a sector level and should not be used as a basis forcomparing two individual companies.The methodology includes Scope 1, 2 and Scope 3 upstream andproduct use downstream.
The following graph shows the financed scope 1+2 emissions inrelation to the scope 3 emissions of the portfolio.
InformationTechnology
0%
10%
20%
30%
40%
50%
60%
70%
80%
90%
100%
21'543
8'764Scope 3Scope 1&2
The graph below compares the total emissions (including Scope 1,Scope2 and Scope 3) between portfolio and benchmark.
Portfolio Benchmark0
10000
20000
30000
40000
21'543
8'764
13'373
5'551Scope 3Scope 1&2
*) The methodology includes Scope 1, 2 and Scope 3 upstream and product use downstream.
7

Carbon Report - SEB Teknologifond
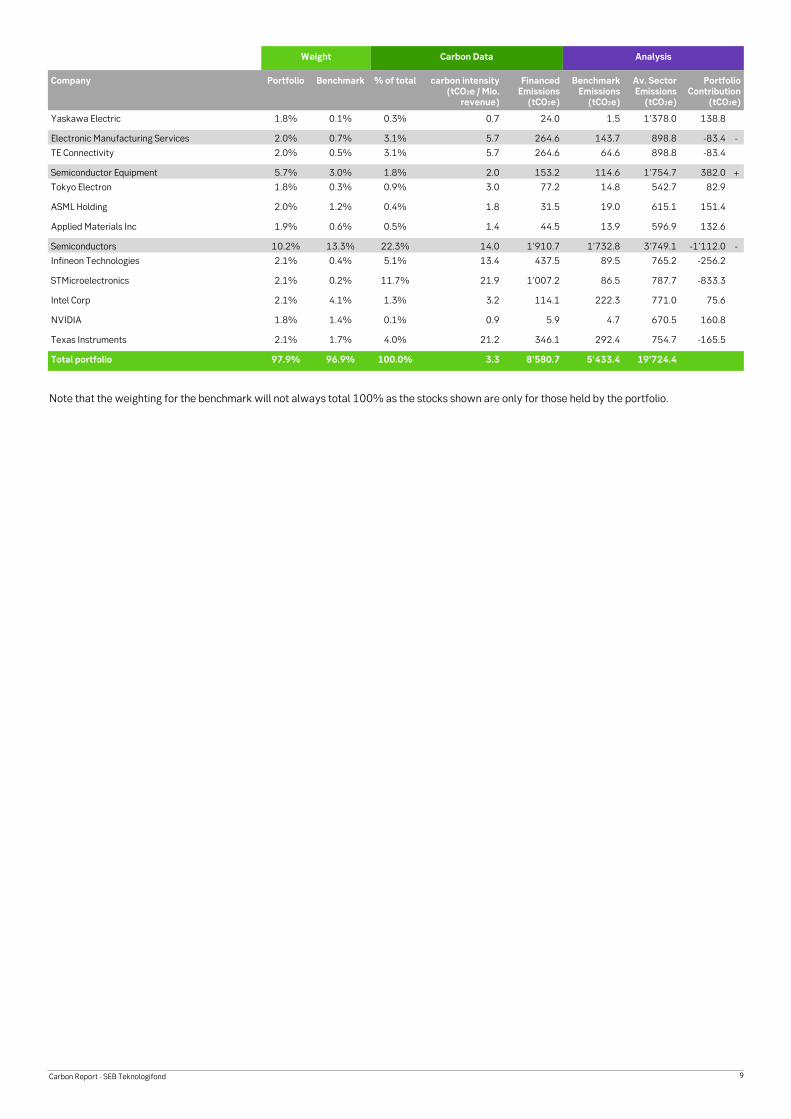
Company Sector & BreakdownThis table presents all holdings in the portfolio, sorted by sector,following the logic from the sections above.
It shows how each company contributes to the overall portfoliofootprint. It allows you to see which stocks are the greatestcontributors to the portfolio’s emission in absolute as well as relativeterms.
The -/+ signs on the far right indicate if a specific holding raises orreduces the carbon footprint of the portfolio. This helps with portfoliooptimization and in managing the overall carbon portfolio footprintwithout comprising the chosen sector allocation.
Weight Carbon Data Analysis
Company Portfolio Benchmark % of total carbon intensity(tCO2e / Mio.
revenue)
FinancedEmissions
(tCO2e)
BenchmarkEmissions
(tCO2e)
Av. SectorEmissions
(tCO2e)
PortfolioContribution
(tCO2e)
IT Consulting & Other Services 10.0% 5.7% 15.1% 2.0 1'293.5 392.0 1'658.5 -441.3 -
Atos 2.1% 0.1% 0.8% 0.6 67.2 4.7 349.9 124.8
Cap Gemini 1.8% 0.3% 1.3% 1.5 109.8 17.9 305.3 56.5
Accenture 1.9% 1.7% 0.5% 1.0 40.8 36.5 315.7 132.6
Fujitsu 2.1% 0.2% 10.6% 2.6 907.7 99.5 350.2 -734.1
Intl Business Machines Corp Com 2.0% 1.9% 2.0% 2.4 168.1 161.7 337.4 14.8
Data Processing & Outsourced Services 12.2% 15.2% 2.0% 1.1 167.8 130.5 733.0 1'060.7 +
Amadeus IT 2.1% 0.6% 0.2% 0.9 17.6 4.9 125.1 173.1
Automatic Data Processing 2.0% 1.1% 0.4% 1.2 34.0 18.6 119.0 146.8
Jack Henry & Associates 2.0% 0.2% 0.2% 1.1 20.2 1.9 119.9 162.3
Mastercard 2.1% 3.3% 0.0% 0.4 3.5 5.5 126.1 189.0
Visa 2.1% 4.4% 0.1% 0.5 4.6 9.7 125.1 186.5
WESTERN UNION CO 2.0% 0.1% 1.0% 1.2 87.9 6.4 117.9 90.2
Application Software 12.5% 10.6% 1.1% 1.0 96.1 95.8 286.4 1'168.1 +
SAP 2.0% 1.8% 0.2% 0.8 16.1 14.6 46.8 169.8
Dassault Systemes 2.1% 0.3% 0.1% 0.6 9.4 1.3 47.8 180.6
Adobe Systems 2.1% 2.1% 0.1% 1.2 12.3 12.2 48.6 181.0
Cadence Design Systems 2.0% 0.2% 0.3% 1.2 23.1 2.6 46.6 161.7
Intuit 2.1% 0.9% 0.1% 0.4 6.2 2.8 47.1 181.1
Salesforce.Com 2.2% 1.8% 0.3% 2.0 29.0 25.1 49.5 167.3
Systems Software 9.7% 18.6% 0.5% 0.5 43.5 82.9 168.1 920.8 +
Microsoft 5.9% 13.9% 0.1% 0.2 8.2 19.2 102.4 557.0
Oracle 2.0% 2.5% 0.3% 1.2 27.4 34.2 35.3 159.3
VMware 1.8% 0.2% 0.1% 0.5 7.9 0.9 30.4 152.6
Communications Equipment 2.0% 6.2% 4.2% 3.2 361.8 222.4 210.2 -184.3 -
Nokia (Helsingfors) 2.0% 0.6% 4.2% 3.2 361.8 109.4 210.2 -184.3
Technology Hardware, Storage & Peripherals 11.8% 17.4% 22.4% 2.8 1'921.1 837.9 1'387.0 -984.4 -
Konica 2.1% 0.1% 14.8% 5.7 1'266.2 47.4 243.0 -1'104.6
Apple 5.9% 14.3% 0.0% 0.0 3.7 9.1 693.8 557.7
HP 1.9% 0.6% 2.7% 1.1 232.5 73.5 228.0 -60.2
Hewlett Packard Enterpris-WI 1.9% 0.4% 4.9% 2.8 418.7 82.1 222.2 -254.6
Electronic Equipment & Instruments 13.8% 2.5% 8.7% 1.9 750.1 359.0 2'893.2 569.1 +
Ingenico 1.8% 0.1% 0.4% 0.8 33.7 1.2 386.2 134.2
Shimadzu 1.9% 0.1% 1.1% 1.8 96.6 4.2 402.8 77.4
Hitachi High-Technologies 1.9% 0.0% 1.4% 1.0 119.5 2.5 403.3 54.3
Yokogawa Electric 2.0% 0.1% 2.8% 2.8 237.8 8.7 426.7 -56.3
Cognex 2.0% 0.1% 0.2% 2.6 15.7 1.0 426.2 170.3
Keysight Technologies 2.1% 0.2% 2.7% 3.5 227.6 23.4 446.8 -37.1
Trimble Navigation 1.9% 0.2% 0.2% 0.7 19.1 1.5 401.2 155.7
Electronic Components 7.8% 2.3% 18.9% 8.1 1'618.2 1'004.2 5'985.4 -1'001.6 -
Omron 1.8% 0.1% 3.4% 4.6 288.8 20.7 1'423.4 -125.6
Kyocera 2.1% 0.3% 8.3% 11.0 714.1 104.8 1'599.3 -539.6
Murata 2.1% 0.5% 6.9% 14.1 591.2 133.4 1'584.7 -415.7
8
Carbon Report - SEB Teknologifond
Weight Carbon Data Analysis
Company Portfolio Benchmark % of total carbon intensity(tCO2e / Mio.
revenue)
FinancedEmissions
(tCO2e)
BenchmarkEmissions
(tCO2e)
Av. SectorEmissions
(tCO2e)
PortfolioContribution
(tCO2e)
Yaskawa Electric 1.8% 0.1% 0.3% 0.7 24.0 1.5 1'378.0 138.8
Electronic Manufacturing Services 2.0% 0.7% 3.1% 5.7 264.6 143.7 898.8 -83.4 -
TE Connectivity 2.0% 0.5% 3.1% 5.7 264.6 64.6 898.8 -83.4
Semiconductor Equipment 5.7% 3.0% 1.8% 2.0 153.2 114.6 1'754.7 382.0 +
Tokyo Electron 1.8% 0.3% 0.9% 3.0 77.2 14.8 542.7 82.9
ASML Holding 2.0% 1.2% 0.4% 1.8 31.5 19.0 615.1 151.4
Applied Materials Inc 1.9% 0.6% 0.5% 1.4 44.5 13.9 596.9 132.6
Semiconductors 10.2% 13.3% 22.3% 14.0 1'910.7 1'732.8 3'749.1 -1'112.0 -
Infineon Technologies 2.1% 0.4% 5.1% 13.4 437.5 89.5 765.2 -256.2
STMicroelectronics 2.1% 0.2% 11.7% 21.9 1'007.2 86.5 787.7 -833.3
Intel Corp 2.1% 4.1% 1.3% 3.2 114.1 222.3 771.0 75.6
NVIDIA 1.8% 1.4% 0.1% 0.9 5.9 4.7 670.5 160.8
Texas Instruments 2.1% 1.7% 4.0% 21.2 346.1 292.4 754.7 -165.5
Total portfolio 97.9% 96.9% 100.0% 3.3 8'580.7 5'433.4 19'724.4
Note that the weighting for the benchmark will not always total 100% as the stocks shown are only for those held by the portfolio.
9

Carbon Report - SEB Teknologifond
Carbon RankingThis is a standardized ranking of the fund based on the product'sweighted average carbon intensity using two peergroups. Oneconsisting of all other funds in the database (global percentile) andone where the fund is ranked taking the specific Lipper GlobalClassification into account (peer percentile). The ranking is based onpercentiles and ranges from 0 (worst) to 100 (best).
Global Percentile
97(n=5290)
Peer Percentile
99(Lipper Global Equity Global, n=935)
The carbon footprint provides a historic snapshot of the emissions from the equity holdings of the fund. The calculations are not comprehensive and indirect emissions, e.g. from suppliers, are based on reporteddata or estimates of emissions. The metric says nothing about how the portfolio contributes to a low-carbon society. For further information about the metric, see www.sebgroup.com.
10