carbon stock assessment in mangrove ecosystem...
TRANSCRIPT


Final Report
CARBON STOCK ASSESSMENT
IN MANGROVE ECOSYSTEM OF KUBU RAYA, WEST KALIMANTAN
submitted for Cooperation CFCRRD-FORDA and CIFOR
Research Team:
Haruni Krisnawati Wahyu Catur Adinugroho I Wayan Susi Dharmawan
Rinaldi Imanuddin Daniel Murdiyarso Joko Purbopuspito
Matthew Warren Adi Susmianto
CENTER FOR CONSERVATION AND REHABILITATION RESEARCH AND DEVELOPMENT FORESTRY RESEARCH AND DEVELOPMENT AGENCY
DECEMBER 2011

ii | P a g e
Preface
The Center for Conservation and Rehabilitation Research and Development, Forestry
Research and Development Agency (CFCRRD-FORDA) in collaboration with the Center for
International Forestry Research (CIFOR) have conducted a research on ‘Carbon Stock
Assessment in Mangrove Ecosystem of Kubu Raya, West Kalimantan’. The purpose of the
research is to quantify carbon pools of tropical mangrove forest and monitoring carbon
dynamics in Kubu Raya mangrove ecosystem. The completed research is expected to fill a
critical information gap in the tropical wetland ecosystems of Indonesia.
This technical report was prepared as an account of the research activities conducted in
Kubu Raya mangrove forests for the period of between June and December 2011.
Information on total carbon stock estimates of mangrove ecosystem provided in this
report has been updated since the technical progress report, produced while the study
was in progress, was submitted to CIFOR in August 2011.
On behalf of the Center for Conservation and Rehabilitation Research and Development,
we would like to thank the researchers involved in the research activities in Kubu Raya.
We also thank the staff of the District Forestry, Estate Crops, and Mining Service of Kubu
Raya, the Provincial Forestry Service of West Kalimantan, the Natural Resource
Conservation Agency of West Kalimantan, and PT Kandelia Alam for their help with the
field data collection. We are grateful to the Natural Resource Conservation Agency and
the Provincial Forestry Service of West Kalimantan for their cooperation in allowing us to
work in Kubu Raya mangrove forests. Financial support from CIFOR for conducting the
research activities was gratefully acknowledged.
We hope this report will be useful for policy makers, researchers, extension officers, and
all parties concern on mangrove and its conservation and management.

iii | P a g e
Table of Content
Preface ................................................................................................................................... ii
Table of Content ................................................................................................................... iii
List of Tables ......................................................................................................................... iv
List of Figures ......................................................................................................................... v
1. Introduction ....................................................................................................................... 1
2. Study Sites ......................................................................................................................... 3
3. Methods ............................................................................................................................. 5
3.1. Field sampling ............................................................................................................. 5
Trees .......................................................................................................................... 7
Saplings ...................................................................................................................... 8
Non-tree vegetation (nypa palm) .............................................................................. 8
Woody debris ............................................................................................................. 9
Soil .............................................................................................................................. 9
3.2. Sample analysis and allometric computation ........................................................... 10
Trees and saplings .................................................................................................... 10
Standing dead trees ................................................................................................. 11
Nypa palm ................................................................................................................ 12
Carbon pools of vegetation ..................................................................................... 12
Woody debris ........................................................................................................... 13
Soil analysis .............................................................................................................. 13
4. Structure and Composition of Mangrove Forests ........................................................... 14
5. Soil Carbon ....................................................................................................................... 18
6. Ecosystem Carbon Stocks ................................................................................................ 20
7. Conclusion ....................................................................................................................... 22
References ........................................................................................................................... 23
iv | P a g e
List of Tables
Table 1. Allometric equations used for computing biomass of mangrove trees ............... 11
Table 2. Constant values used for substraction to compute standing dead trees ............. 12
Table 3. Soil properties by sampling depth sampled from Pulau Panjang I and II mangrove
forests .................................................................................................................... 18
Table 4. Ecosystem carbon pools of Kubu Raya mangrove forests sampled from seven
transects in Pulau Panjang I and Pulau Panjang II. Numbers in paranthesis
indicate % of the total ........................................................................................... 21

v | P a g e
List of Figures
Figure 1. Map of study site in Kubu Raya District, West Kalimantan ................................... 4
Figure 2. Mangrove vegetation along the coastlines of Pulau Panjang I, Kubu Raya .......... 4
Figure 3. Location of the seven transects established in Pulau Panjang I and Pulau
Panjang II mangrove forests, Kubu Raya .............................................................. 5
Figure 4. Field sampling design in a transect to estimate aboveground and belowground
carbon in mangrove forest (Kauffman and Donato, unpublished; Murdiyarso et
al., 2009)................................................................................................................ 6
Figure 5. The team was ready for conducting field measurement in mangrove forests ..... 6
Figure 6. Measurement of Rhizophora apiculata trees with a diameter tape in mangrove
forests of Pulau Panjang I, Kubu Raya .................................................................. 7
Figure 7. Decay status of standing dead trees (SNI 7724, 2011) .......................................... 8
Figure 8. Nypa fruticans is the only palm tree among mangroves that we found in our
sampling plots (particularly in Transects 3 and 4) ................................................ 8
Figure 9. Large woody debris were often found in our sampling plots .............................. 9
Figure 10. Collection of soil samples in the sampling plots ................................................ 10
Figure 11. Characteristics of leaves of four mangrove tree species identified in the
sampling transects (A: Rhizophora apiculata Bl., B: Bruguiera gymnorrhiza (L.),
C: Xylocarpus granatum Koen., D: Sonneratia alba J.E. Smith) .......................... 14
Figure 12. Density of trees ≥ 5 cm in dbh (ind/ha) sampled from seven transects in Pulau
Panjang I and Pulau Panjang II mangrove forests, Kubu Raya............................ 16
Figure 13. Basal area of trees ≥ 5 cm in dbh (m2/ha) sampled from seven transects in
Pulau Panjang I and Pulau Panjang II mangrove forests, Kubu Raya .................. 16
Figure 14. Aboveground biomass of trees ≥ 5 cm in dbh (ton/ha) sampled from seven
transects in Pulau Panjang I and Pulau Panjang II mangrove forests, Kubu Raya
............................................................................................................................. 17
Figure 15. The distribution of trees (including saplings) in seven transects based on
diameter class ..................................................................................................... 17
Figure 16. Soil Carbon stock of Kubu Raya mangrove forests sampled from seven
transects. Error bars represent standard error of the mean .............................. 19
Figure 17. Ecosystem carbon stocks of Kubu Raya mangrove forests sampled from seven
transects in Pulau Panjang I and Pulau Panjang II .............................................. 20
1 | P a g e
1. Introduction
Tropical mangrove forests are known to provide valuable environmental and economic
sources as important nursery grounds as well as breeding and rearing habitats for many
organisms, and as a renewable source of woods and other forest products (e.g. medicines
and traditional foods). Perhaps most importantly, mangrove forests are accumulation
sites for contaminants, carbon and nutrients, sediments, and offer significant protection
against coastal erosions, storms and tsunamis, and regulation of water quality (Duke et
al., 2007; Alongi, 2009). This type of ecosystem have been under special focus recently
due to their importance as carbon sinks and stores and their role in the carbon cycle.
Despite their importance in sustaining livelihoods for many people living along some of
the most populous coastlines, tropical mangrove forests are disappearing at an alarming
rate. This type of forest are highly vulnerable to both global climate change and land use
or land cover change. Over the last twenty years, this forest ecosystem has undergone
severe changes due to anthropogenic influences to meet the increasing demand of lands,
food, fiber and charcoal. Rates of deforestation or conversion are among the highest of
all tropical forests, exceeding rates in upland forests (Valiela et al., 2001). FAO estimated
that a quarter of the world’s mangrove has been lost over the last twenty years. In
Indonesia, the rate of mangrove loss has been reported to be 1.8 percent per annum
(UNEP, 2004). Further, Langner et al. (2007) reported a higher rate of deforestation of
mangroves in Indonesia, which was around 8 percent per year between 2002 and 2005.
The conversion of mangroves into other land uses have resulted in the emission of the
green house relevant gas CO2 and a severe loss of mangrove biodiversity. However, this
ecosystem has been undervalued in the past and consequently subject to deforestation
and degradation.
Carbon pools of mangrove forests are among the highest of tropical forest types (Bouillon
et al., 2008). Because of the values and threats to mangrove ecosystem, measurement to
estimate and monitor carbon stocks in this type of ecosystem would therefore be
required to fill a critical information gap, especially when carbon accounting is required to
be more site specific to meet high quality of data and information.
The Center for Conservation and Rehabilitation Research and Development, Forestry
Research and Development Agency (CFCRRD-FORDA) has started a research project on
“Carbon Stock Assessment in Mangrove Ecosystem of Kubu Raya, West Kalimantan” with
a collaboration and funding from the Center for International Forestry Research (CIFOR).
The period of collaboration was set up from June to December 2011. This research
project is aiming at quantifying carbon pools of tropical mangrove forest in the research

2 | P a g e
site and monitoring carbon dynamics of this type of ecosystem to fill a critical information
gap in the tropical wetland ecosystems of Indonesia.
The research will provide outputs that will contribute in providing information necessary
in the development of REDD+ (reducing emissions from deforestation and forest
degradation, and the role of conservation, sustainable management of forest, and
enhancement of forest) strategies for mitigating climate change and adaptation
strategies for future climate regimes in tropical mangrove forests. The outputs will also
contribute to the development of the Indonesia’s National Carbon Accounting System
that will strive to support transparency and disclosure of information. This can help
contribute to further knowledge for REDD+ accounting and monitoring and developing
adequate strategies for conservation and sustainable use and management of mangrove
forest ecosystem.
This report describes the results of research activities conducted in Kubu Raya mangrove
forests, West Kalimantan, between the period of June – December 2011. It starts by
describing the general information of the research sites and followed by the
methodologies applied during the field sampling and data collection/measurement as
well as laboratory and data analyses. The main results from completed research activities
covering stand structure and composition of mangrove forests, as well as ecosystem
Carbon stocks (including aboveground and belowground pools) then follow. A suggestion
for future research is also presented.

3 | P a g e
2. Study Sites
The study was conducted in mangrove forest ecosystem located in Kubu Raya District,
West Kalimantan Province (Figure 1). The district was previously a part of Pontianak
District and has become a new district since 2007 (according to the Law No. 35/2007),
covering an area of 695,822 ha, but based on the calculation of a digital base map the
area of Kubu Raya reaches 881,322.41 ha. Geographycally, Kubu Raya District is located
between 10 00’ 53.09” – 0o 13’ 40.83” South latitude and 1090 02’ 19.32” – 109o 58’
32.16” East longitude. The Kubu Raya District is bordered by Pontianak City, Pontianak
and Landak Districts to the North, Sanggau and Ketapang Districts to the East, Mayong
Utara District to the South, and Natuna Sea to the West. The district consisted of nine
sub-dstricts. The field sampling was conducted in Kubu sub-district, the second largest
sub-district in Kubu Raya, which covers an area of 134,122 ha.
The air temperature of the study site is relatively high which is also followed by high air
humidity. The average air temperature is around 24 – 27 oC. The air humidity ranges from
83 to 87% with minimum and maximum humidity occur in September and March,
respectively. The mean annual rainfall is 3063.8 mm with the highest rainfall occurs
between October and January.
Kubu Raya, situated at the downstream of several districts in West Kalimantan, is
generally a lowland area which has dozens of major rivers and hundreds of small rivers.
The rivers are very important for communities as a source of water and transportation
connecting one village to another village and from a sub-distict to another sub-district.
The mainland area is particularly located in the northern and eastern parts of the district
with topography varies from relatively flat, sloping, undulating, to rolling. The dominant
soil type of the site is alluvial, accounting for more than 50% of the total land area of the
district. This soil type is mostly found in coastal area which is covered by mangroves,
vegetation that can tolerate saltwater or salty soil. The minor soil type includes peat
(organozol, gley humus) and red yellow podzol.
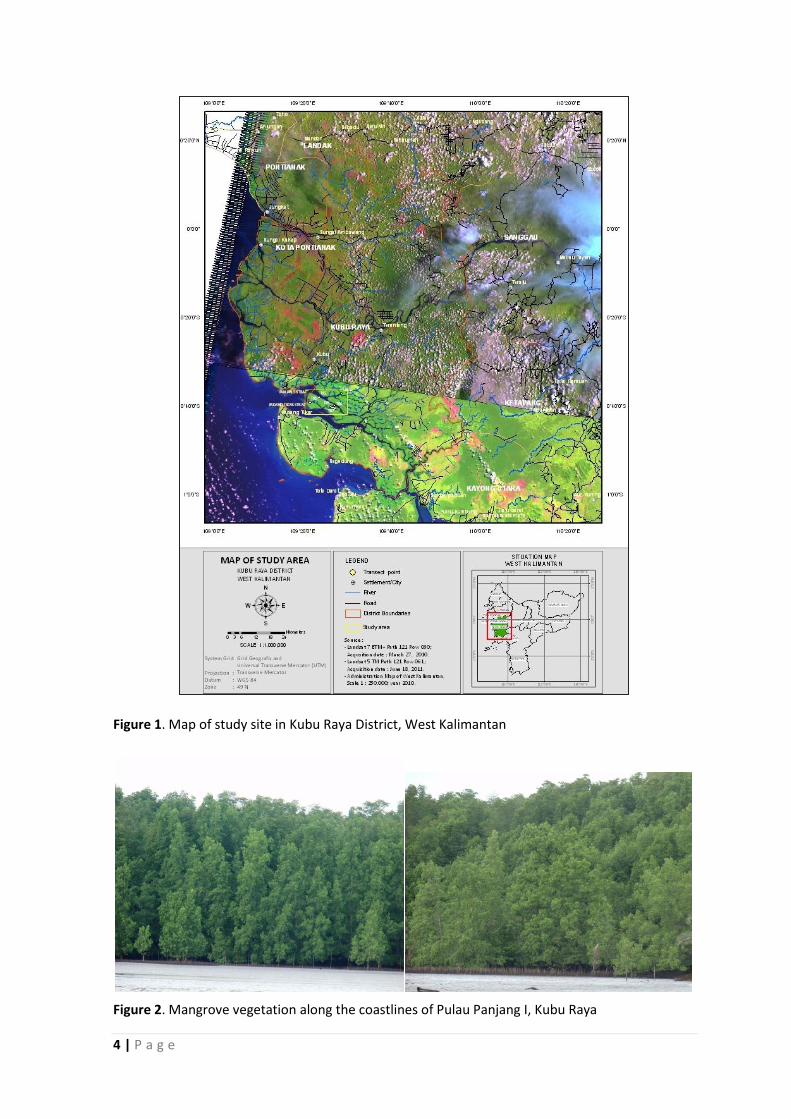
The land area of Kubu Raya District covered by mangroves is about 256,586.8 ha
consisting of both protection forest and production forest. The condition of mangrove
vegetation in our study sites is relatively good (see Figure 2). Local people commonly use
mangrove trees, locally known as bakau, for their daily needs, such as for firewood,
support for seaweed farming, fish traps and traditional medicines.
4 | P a g e
Figure 1. Map of study site in Kubu Raya District, West Kalimantan
Figure 2. Mangrove vegetation along the coastlines of Pulau Panjang I, Kubu Raya

5 | P a g e
3. Methods
3.1. Field sampling
The field sampling was conducted to collect data on carbon pools of mangrove
ecosystem. The sampling was conducted in two islands representative of mangrove
protection forests in Kubu Raya, i.e. Pulau Panjang I and Pulau Panjang II (see Figure 3).
Five transects arranged perpendicular from the coast or river shorelines were first
established on Pulau Panjang I (00 39‘ 7.5“ N, 1090 21‘ 39.8“ E; 00 37‘ 56.5“ N, 1090 23‘
43.4” E; 00 39‘ 48.0“ N, 1090 27‘ 06.8” E; 00 40‘ 11.6“ N, 1090 26‘ 48.2” E; 00 40‘ 05.3“ N,
1090 26‘ 15.7”E). Additional two transects were established on Pulau Panjang II (00 40‘
29.1“ N, 1090 27‘ 15.1” E; 00 40‘ 16.4“ N, 1090 26‘ 37.3” E). The coordinate positions of
the transects were purposively determined based on landsat imagery prior to going to
the field although slight adjustments might be applied due to the difficult situation in the
field, particularly if our small boats were not possible to land the sites. Six circular plots
with a radius of 7 m each (0.0154 ha) were established along the transect line at 25-m
intervals (see Figure 4).
Figure 3. Location of the seven transects established in Pulau Panjang I and Pulau Panjang II mangrove forests, Kubu Raya

6 | P a g e
Figure 4. Field sampling design in a transect to estimate aboveground and belowground carbon in mangrove forest (Kauffman and Donato, unpublished; Murdiyarso et al., 2009)
The field measurement was conducted collaboratively between CFCRRD-FORDA and
CIFOR scientists with supports from local staff from several forestry offices (e.g. the
Provincial Forestry Service of West Kalimantan, the Forestry, Estate Crop and Mining
Service of Kubu Raya, and the Natural Resource Conservation Agency of West
Kalimantan) (Figure 5). The fieldwork was also assisted by several workers from PT
Kandelia Alam, a mangrove production forest management unit operated in Kubu Raya.
Figure 5. The team was ready for conducting field measurement in mangrove forests

7 | P a g e
In each plot, sampling and measurement of trees, saplings, woody debris and soil were
conducted. In addition, non-tree vegetation such as nypa palm (Nypa fruticans Wumb)
which was present in the sampling plots was recorded. Litter was not included in our
sampling as most mangroves have little to no litter contributing negligible carbon pool
(Snedaker and Lahmann, 1988). Measurements of trees, saplings, non-tree vegetation,
woody debris and soil in the sampling plots were conducted as described below.
Trees
All trees with dbh (diameter at breast height = 130 cm above the ground) of ≥ 5 cm were
identified for species and measured for dbh using a diameter tape. These included all
living woody trees and dead woody stem found in the plots (snag or stump) that formed
an angle of less than 45o from the true vertical. For trees with the buttress exceeding 130
cm above the ground, stem diameter was measured around 20 cm above the buttress.
For stilt rooted species (e.g. Rhizophora apiculata Bl.), stem diameter was measured
above the highest stilt root (Figure 6). A tree was included in the sampling plot if at least
50% of the main stem is rooted inside the plot border. Data on species, dbh, and whether
the tree alive or dead were recorded for all individuals. The decay status of dead trees
was also recorded: (1) small branches and twigs are retained (no leaves), (2) no
twigs/small branches, and (3) few or no branches, standing stem only (see Figure 7).
Figure 6. Measurement of Rhizophora apiculata trees with a diameter tape in mangrove forests of Pulau Panjang I, Kubu Raya

8 | P a g e
Figure 7. Decay status of standing dead trees (SNI 7724, 2011)
Saplings
All woody stems with dbh of < 5 cm and height of > 1.3 m were categorized as saplings,
and they were measured using a tree caliper and recorded in the same way as for trees.
Individual trees that < 1.3 m in height were categorized as seedlings. Seedlings were only
recorded as a simple count of individuals. Inventory of saplings and seedlings was done
in a sub-plot with a radius of 2 m in each plot (see Figure 4).
Non-tree vegetation (nypa palm)
Non-tree vegetation was rarely found in our sampling transects but the exception was
nypa palm (Nypa fruticans Wumb, family Arecaceae (=Palmae)). If nypa palm (Figure 8)
was found within the sampling plots, only the number of nypa leaves were counted
(Kauffman and Donato, unpubl.). Mass of nypa palm could then be calculated as the
number of leaves in the plot multiplied by average leaf mass.
Figure 8. Nypa fruticans is the only palm tree among mangroves that we found in our sampling plots (particularly in Transects 3 and 4)
9 | P a g e
Woody debris
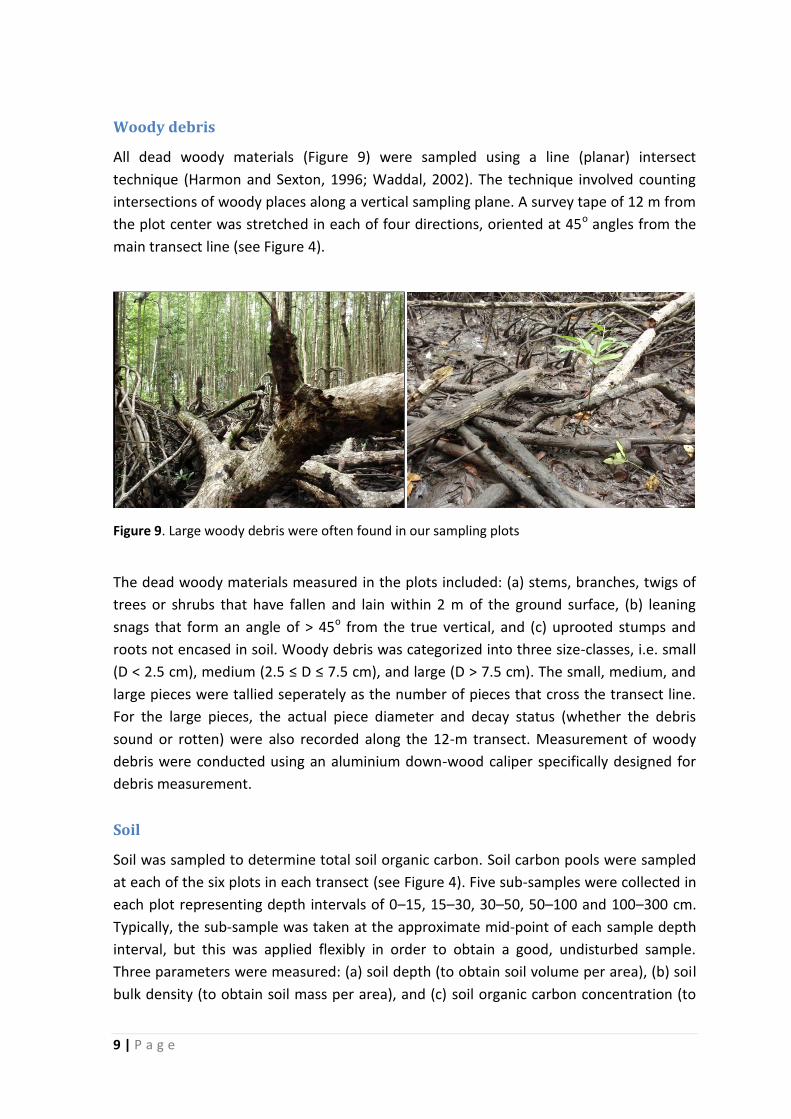
All dead woody materials (Figure 9) were sampled using a line (planar) intersect
technique (Harmon and Sexton, 1996; Waddal, 2002). The technique involved counting
intersections of woody places along a vertical sampling plane. A survey tape of 12 m from
the plot center was stretched in each of four directions, oriented at 45o angles from the
main transect line (see Figure 4).
Figure 9. Large woody debris were often found in our sampling plots
The dead woody materials measured in the plots included: (a) stems, branches, twigs of
trees or shrubs that have fallen and lain within 2 m of the ground surface, (b) leaning
snags that form an angle of > 45o from the true vertical, and (c) uprooted stumps and
roots not encased in soil. Woody debris was categorized into three size-classes, i.e. small
(D < 2.5 cm), medium (2.5 ≤ D ≤ 7.5 cm), and large (D > 7.5 cm). The small, medium, and
large pieces were tallied seperately as the number of pieces that cross the transect line.
For the large pieces, the actual piece diameter and decay status (whether the debris
sound or rotten) were also recorded along the 12-m transect. Measurement of woody
debris were conducted using an aluminium down-wood caliper specifically designed for
debris measurement.
Soil
Soil was sampled to determine total soil organic carbon. Soil carbon pools were sampled
at each of the six plots in each transect (see Figure 4). Five sub-samples were collected in
each plot representing depth intervals of 0–15, 15–30, 30–50, 50–100 and 100–300 cm.
Typically, the sub-sample was taken at the approximate mid-point of each sample depth
interval, but this was applied flexibly in order to obtain a good, undisturbed sample.
Three parameters were measured: (a) soil depth (to obtain soil volume per area), (b) soil
bulk density (to obtain soil mass per area), and (c) soil organic carbon concentration (to
10 | P a g e
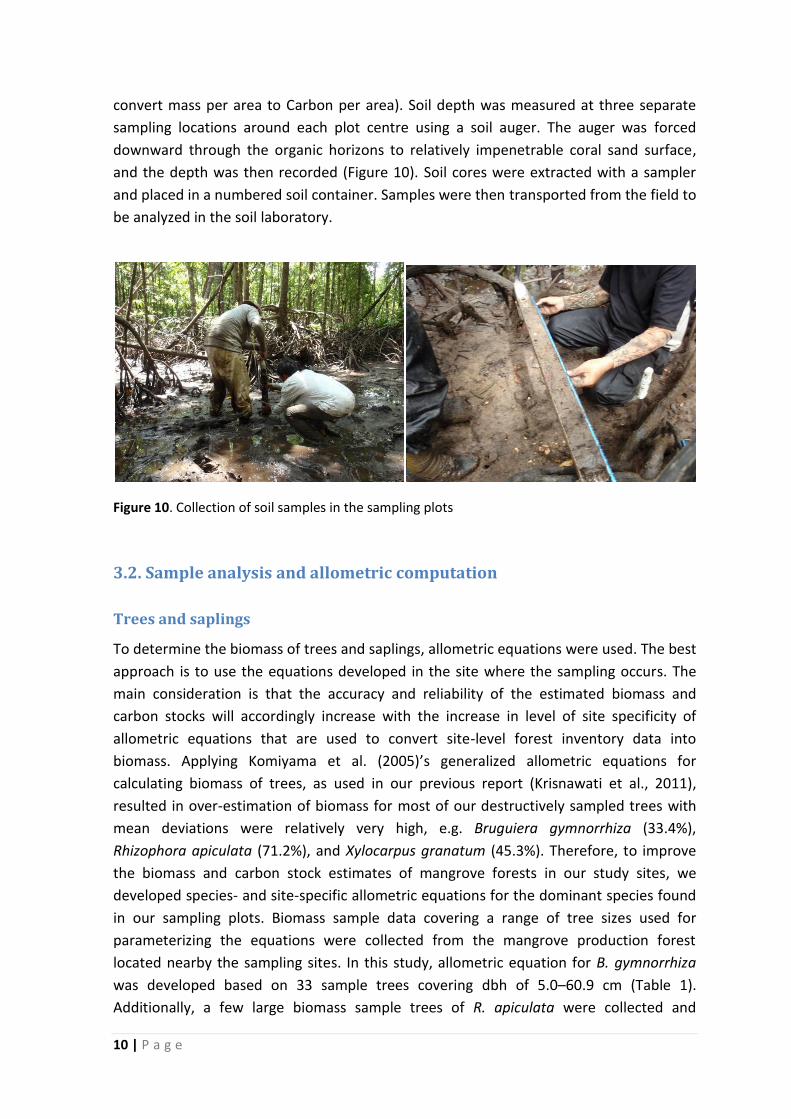
convert mass per area to Carbon per area). Soil depth was measured at three separate
sampling locations around each plot centre using a soil auger. The auger was forced
downward through the organic horizons to relatively impenetrable coral sand surface,
and the depth was then recorded (Figure 10). Soil cores were extracted with a sampler
and placed in a numbered soil container. Samples were then transported from the field to
be analyzed in the soil laboratory.
Figure 10. Collection of soil samples in the sampling plots
3.2. Sample analysis and allometric computation
Trees and saplings
To determine the biomass of trees and saplings, allometric equations were used. The best
approach is to use the equations developed in the site where the sampling occurs. The
main consideration is that the accuracy and reliability of the estimated biomass and
carbon stocks will accordingly increase with the increase in level of site specificity of
allometric equations that are used to convert site-level forest inventory data into
biomass. Applying Komiyama et al. (2005)’s generalized allometric equations for
calculating biomass of trees, as used in our previous report (Krisnawati et al., 2011),
resulted in over-estimation of biomass for most of our destructively sampled trees with
mean deviations were relatively very high, e.g. Bruguiera gymnorrhiza (33.4%),
Rhizophora apiculata (71.2%), and Xylocarpus granatum (45.3%). Therefore, to improve
the biomass and carbon stock estimates of mangrove forests in our study sites, we
developed species- and site-specific allometric equations for the dominant species found
in our sampling plots. Biomass sample data covering a range of tree sizes used for
parameterizing the equations were collected from the mangrove production forest
located nearby the sampling sites. In this study, allometric equation for B. gymnorrhiza
was developed based on 33 sample trees covering dbh of 5.0–60.9 cm (Table 1).
Additionally, a few large biomass sample trees of R. apiculata were collected and

11 | P a g e
combined with Amira (2008)’s data to improve the existing aboveground biomass
equation of R. apiculata trees extending a dbh range from 2.5–40 cm to 2.5–67.1 cm.
Biomass sample data of X. granatum from Talan (2008) were also re-analized to provide
better estimates of aboveground biomass for this species (dbh range of 5.9–49.4 cm)
including correction for bias and method of fitting.
Table 1. Allometric equations used for computing biomass of mangrove trees
Species Equation* CF Source
Aboveground component
B. gymnorrhiza logAGB = -0.552 + 2.244 logDBH 1.0001 this study
R. apiculata logAGB = -1.315 + 2.614 logDBH 1.0008 modified from Amira (2008) logSRB = -2.945 + 2.546 logDBH 1.153 Ong et al. (2004)
X. granatum logAGB = -0.735 + 2.211 logDBH 1.0003 re-analized from Talan (2008)’s data
S. alba AGB = 0.251 DBH2.46 Komiyama et al. (2005)
Belowground component
B. gymnorrhiza logBGB = -1.516 + 2.283 logDBH 1.0124 this study
R. apiculata logBGB = -3.454 + 2.611 logDBH 1.016 Ong et al. (2004)
X. granatum BGB = 0.199 0.899 DBH2.22 Komiyama et al. (2005)
S. alba BGB = 0.199 0.899 DBH2.22 Komiyama et al. (2005)
AGB = aboveground biomass (kg); BGB = belowground biomass (kg); SRB = Stilt root biomass (kg); DBH =
diameter at breast height (cm); CF = correction factor; Equation* = Equations before including correction
factor; (X. granatum) = 0.7; (S. alba) = 0.78
To calculate total aboveground biomass of R. apiculata, biomass of stilt roots would need
to be added. This component was calculated using a separate equation reported by Ong
et al. (2004) (Table 1).
Application of allometric equations in logarithmic units needs to include a correction
factor (Baskerville, 1972; Sprugel, 1981; Snowdon, 1990), as a bias is introduced when
log-transformed data are used in the least squares regression method and then back-
transformed to the arithmetic value. In this study, all allometric computations included a
correction factor (Table 1) to avoid under-estimation of biomass and carbon stocks.
Standing dead trees
The biomass of standing dead trees were estimated using the living tree biomass
equations (Table 1). However, the decay should be subtracted from the biomass
estimates following the decay status categories:
Decay status 1 (no leaves): above ground biomass estimates were substracted by a
portion of leaf biomass.
Decay status 2 (no leaves, no twigs): above ground biomass estimates were
substracted by a portion of leaf and twig biomasses.
Decay status 3 (no leaves, no twigs, no branches): above ground biomass estimates
were substracted by a portion of leaf, twig and branch biomasses.
12 | P a g e
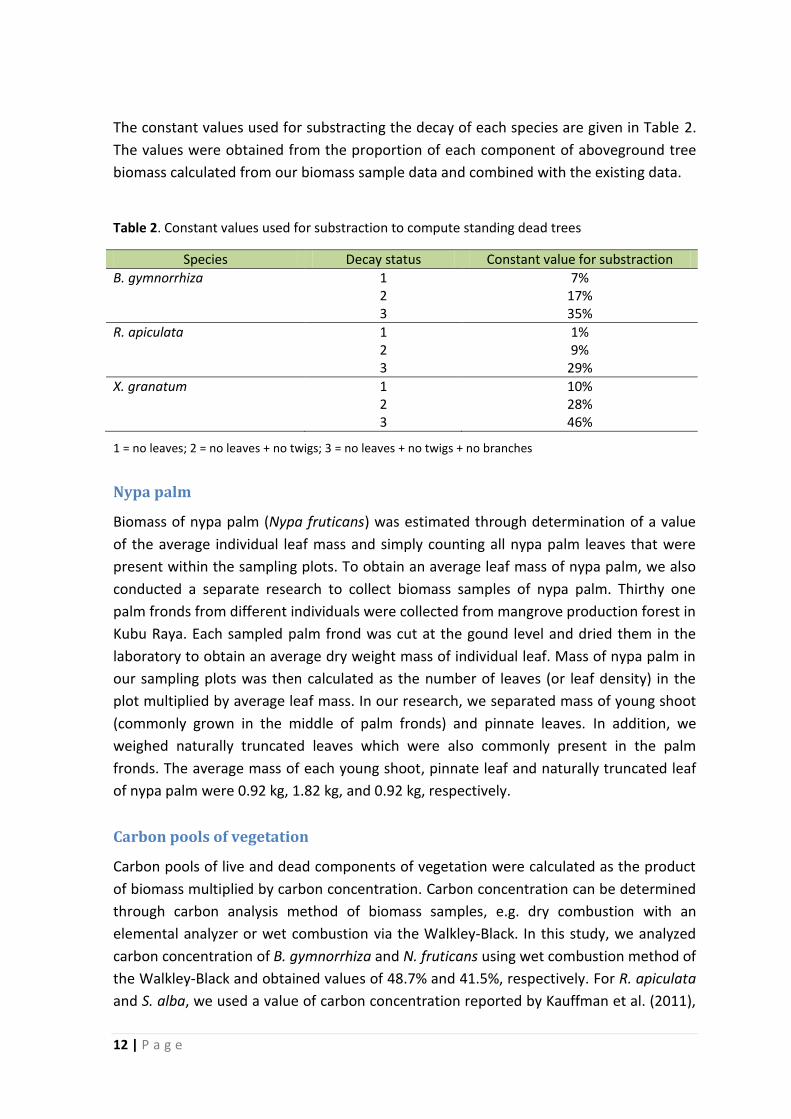
The constant values used for substracting the decay of each species are given in Table 2.
The values were obtained from the proportion of each component of aboveground tree
biomass calculated from our biomass sample data and combined with the existing data.
Table 2. Constant values used for substraction to compute standing dead trees
Species Decay status Constant value for substraction
B. gymnorrhiza 1 7% 2 17% 3 35%
R. apiculata 1 1% 2 9% 3 29%
X. granatum 1 10% 2 28% 3 46%
1 = no leaves; 2 = no leaves + no twigs; 3 = no leaves + no twigs + no branches
Nypa palm
Biomass of nypa palm (Nypa fruticans) was estimated through determination of a value
of the average individual leaf mass and simply counting all nypa palm leaves that were
present within the sampling plots. To obtain an average leaf mass of nypa palm, we also
conducted a separate research to collect biomass samples of nypa palm. Thirthy one
palm fronds from different individuals were collected from mangrove production forest in
Kubu Raya. Each sampled palm frond was cut at the gound level and dried them in the
laboratory to obtain an average dry weight mass of individual leaf. Mass of nypa palm in
our sampling plots was then calculated as the number of leaves (or leaf density) in the
plot multiplied by average leaf mass. In our research, we separated mass of young shoot
(commonly grown in the middle of palm fronds) and pinnate leaves. In addition, we
weighed naturally truncated leaves which were also commonly present in the palm
fronds. The average mass of each young shoot, pinnate leaf and naturally truncated leaf
of nypa palm were 0.92 kg, 1.82 kg, and 0.92 kg, respectively.
Carbon pools of vegetation
Carbon pools of live and dead components of vegetation were calculated as the product
of biomass multiplied by carbon concentration. Carbon concentration can be determined
through carbon analysis method of biomass samples, e.g. dry combustion with an
elemental analyzer or wet combustion via the Walkley-Black. In this study, we analyzed
carbon concentration of B. gymnorrhiza and N. fruticans using wet combustion method of
the Walkley-Black and obtained values of 48.7% and 41.5%, respectively. For R. apiculata
and S. alba, we used a value of carbon concentration reported by Kauffman et al. (2011),
13 | P a g e
i.e. 45.9% and 47.1%, respectively. For X. granatum, as a local or species-specific value is
not available, a conservative carbon concentration of 46% was used.
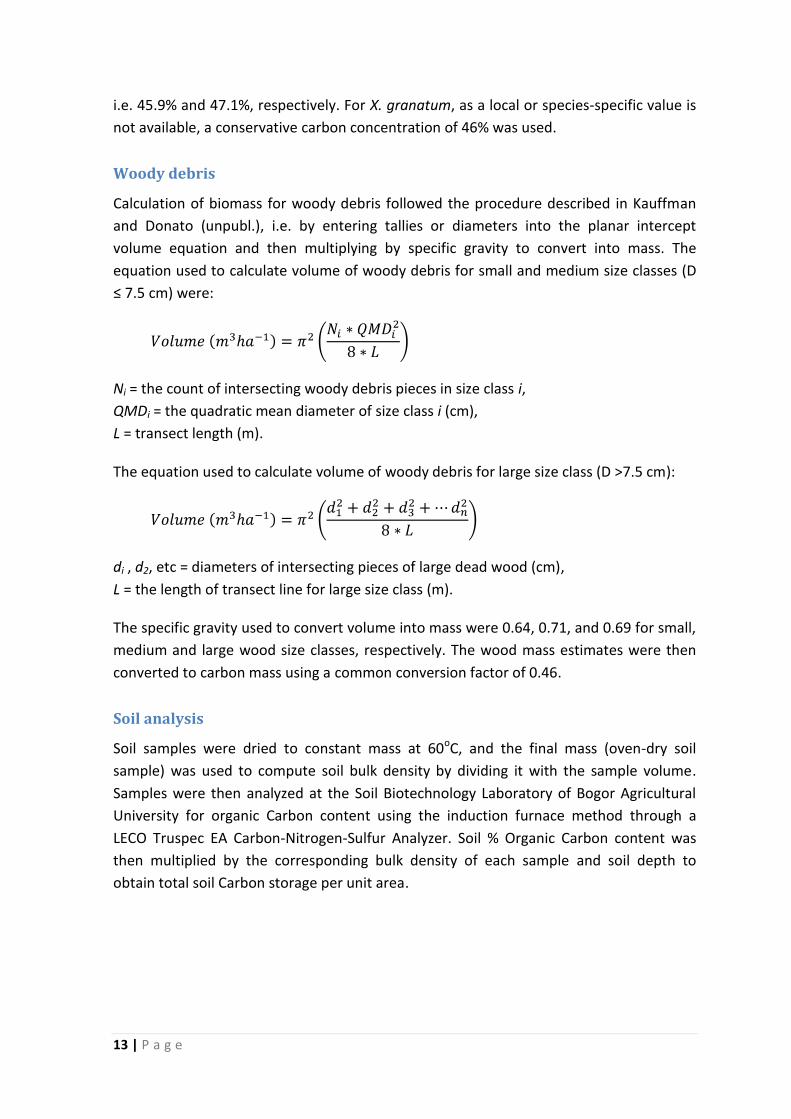
Woody debris
Calculation of biomass for woody debris followed the procedure described in Kauffman
and Donato (unpubl.), i.e. by entering tallies or diameters into the planar intercept
volume equation and then multiplying by specific gravity to convert into mass. The
equation used to calculate volume of woody debris for small and medium size classes (D
≤ 7.5 cm) were:
Ni = the count of intersecting woody debris pieces in size class i,
QMDi = the quadratic mean diameter of size class i (cm),
L = transect length (m).
The equation used to calculate volume of woody debris for large size class (D >7.5 cm):
di , d2, etc = diameters of intersecting pieces of large dead wood (cm),
L = the length of transect line for large size class (m).
The specific gravity used to convert volume into mass were 0.64, 0.71, and 0.69 for small,
medium and large wood size classes, respectively. The wood mass estimates were then
converted to carbon mass using a common conversion factor of 0.46.
Soil analysis
Soil samples were dried to constant mass at 60oC, and the final mass (oven-dry soil
sample) was used to compute soil bulk density by dividing it with the sample volume.
Samples were then analyzed at the Soil Biotechnology Laboratory of Bogor Agricultural
University for organic Carbon content using the induction furnace method through a
LECO Truspec EA Carbon-Nitrogen-Sulfur Analyzer. Soil % Organic Carbon content was
then multiplied by the corresponding bulk density of each sample and soil depth to
obtain total soil Carbon storage per unit area.
14 | P a g e
4. Structure and Composition of Mangrove Forests
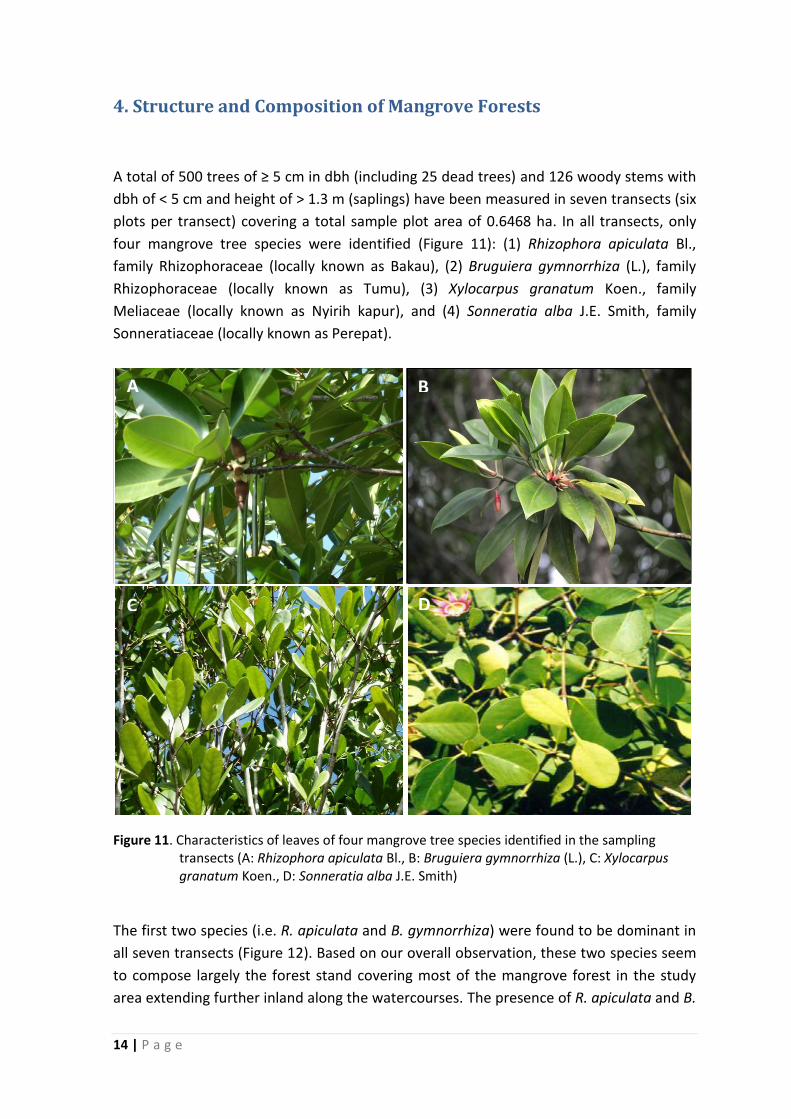
A total of 500 trees of ≥ 5 cm in dbh (including 25 dead trees) and 126 woody stems with
dbh of < 5 cm and height of > 1.3 m (saplings) have been measured in seven transects (six
plots per transect) covering a total sample plot area of 0.6468 ha. In all transects, only
four mangrove tree species were identified (Figure 11): (1) Rhizophora apiculata Bl.,
family Rhizophoraceae (locally known as Bakau), (2) Bruguiera gymnorrhiza (L.), family
Rhizophoraceae (locally known as Tumu), (3) Xylocarpus granatum Koen., family
Meliaceae (locally known as Nyirih kapur), and (4) Sonneratia alba J.E. Smith, family
Sonneratiaceae (locally known as Perepat).
Figure 11. Characteristics of leaves of four mangrove tree species identified in the sampling transects (A: Rhizophora apiculata Bl., B: Bruguiera gymnorrhiza (L.), C: Xylocarpus granatum Koen., D: Sonneratia alba J.E. Smith)
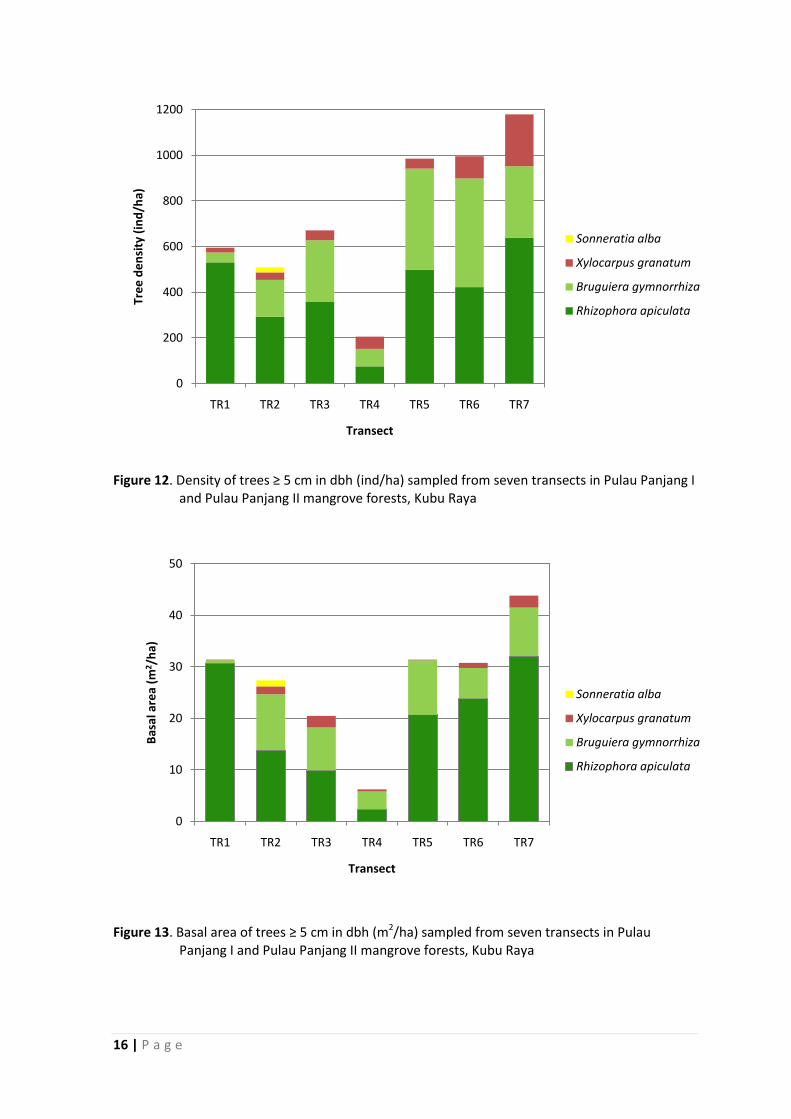
The first two species (i.e. R. apiculata and B. gymnorrhiza) were found to be dominant in
all seven transects (Figure 12). Based on our overall observation, these two species seem
to compose largely the forest stand covering most of the mangrove forest in the study
area extending further inland along the watercourses. The presence of R. apiculata and B.
A B
C D

15 | P a g e
gymnorrhiza in the sampling transects were almost similar (Figure 12); however, R.
apiculata contributed greater basal area than B. gymnorrhiza due to dominance by larger
trees (Figure 13). The exception to this was Transect 1 (TR1) in which the stand was
largely composed by R. apiculata accounting for 89% of the total number of trees ≥ 5 cm
in dbh and 98% of the basal area. Xylocarpus granatum was also found quite many in the
stand (4-26% of the total tree density) but contributed little to the basal area (less than
11%). Sonneratia alba was found only in one transect (i.e. Transect 2 (TR2)) with a very
small number. In addition to these tree mangrove species, we identified non-tree
vegetation in the stand, i.e. nypa palm (Nypa fruticans Wumb, family Arecaceae or
Palmae) which were present in three transects (in total 192 individuals). The occurrence
of nypa palm was relatively high in Transects 3 (TR3) and 4 (TR4) (more than 90
individuals found in one transect).
By including saplings, the average density of living trees was 3122 ind/ha, ranging from
1012 ind/ha to 7754 ind/ha. For living trees more than 5 cm in dbh, the average tree
density was 734 trees/ha (ranging from 206 to 1180 trees/ha). The average basal area of
living trees (dbh ≥ 5 cm) in the stand was generally high, ranging from 27.4 to 43.8 m2/ha
(Figure 13). The exceptions were Transect 3 and Transect 4, which only composed a basal
area of 20.5 m2/ha and even lower at 6.2 m2/ha, respectively. This condition was likely
due to the occurrence of nypa palm in the stand which occupied some growing spaces of
potential mangrove trees. The nypa palm may be regarded as a ‘nuisance palm’. The
existence of this non-tree vegetation could be a threat to the potential mangrove tree
species as this palm readily established itself before the natural regeneration of
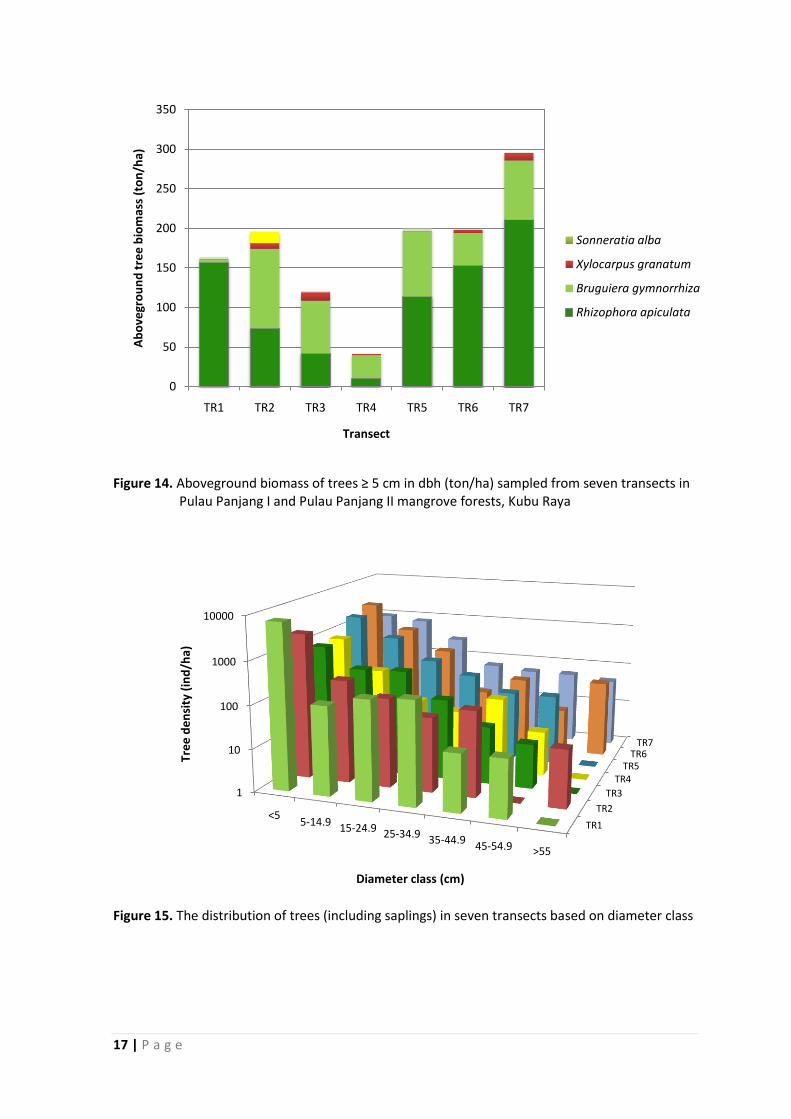
mangrove tree species could take place. Transects occupied by nypa palm were generally
dominated by smaller diameter trees and hence lower tree density, basal area and
aboveground tree biomass (Figures 12-14).
In general, mangrove forest in Pulau Panjang II (represented by Transects 6 and 7)
contained relatively higher tree density, basal area and aboveground biomass than Pulau
Panjang I (represented by Transects 1-5). Tree density at the Pulau Panjang II was almost
two-fold greater than that at the Pulau Panjang I, while basal area and aboveground
biomass at the Pulau Panjang II were 40% and 73% greater, respectively, owing to the
presence of larger diameter trees in the stands (Figure 14).
16 | P a g e
Figure 12. Density of trees ≥ 5 cm in dbh (ind/ha) sampled from seven transects in Pulau Panjang I and Pulau Panjang II mangrove forests, Kubu Raya
Figure 13. Basal area of trees ≥ 5 cm in dbh (m2/ha) sampled from seven transects in Pulau Panjang I and Pulau Panjang II mangrove forests, Kubu Raya
0
200
400
600
800
1000
1200
TR1 TR2 TR3 TR4 TR5 TR6 TR7
Tre
e d
en
sity
(in
d/h
a)
Transect
Sonneratia alba
Xylocarpus granatum
Bruguiera gymnorrhiza
Rhizophora apiculata
0
10
20
30
40
50
TR1 TR2 TR3 TR4 TR5 TR6 TR7
Bas
al a
rea
(m2 /
ha)
Transect
Sonneratia alba
Xylocarpus granatum
Bruguiera gymnorrhiza
Rhizophora apiculata
17 | P a g e
Figure 14. Aboveground biomass of trees ≥ 5 cm in dbh (ton/ha) sampled from seven transects in Pulau Panjang I and Pulau Panjang II mangrove forests, Kubu Raya
Figure 15. The distribution of trees (including saplings) in seven transects based on diameter class
0
50
100
150
200
250
300
350
TR1 TR2 TR3 TR4 TR5 TR6 TR7
Ab
ove
gro
un
d t
ree
bio
mas
s (t
on
/ha)
Transect
Sonneratia alba
Xylocarpus granatum
Bruguiera gymnorrhiza
Rhizophora apiculata
TR1
TR2
TR3
TR4TR5
TR6TR7
1
10
100
1000
10000
<55-14.9
15-24.9 25-34.935-44.9
45-54.9 >55
Tre
e d
en
sity
(in
d/h
a)
Diameter class (cm)

18 | P a g e
5. Soil Carbon
Chemical and physical properties of the soil analyzed from the seven transects are
presented in Table 3. Mean depth of the soil profile was 163 cm, ranging from 130 cm to
Table 3. Soil properties by sampling depth sampled from Pulau Panjang I and II mangrove forests
Transect Sampling
depth (cm)
Nitrogen (%) Carbon (%) Bulk density
(g/cm3)
Carbon mass (ton/ha)
Avg SE Avg SE Avg SE Avg SE
TR1 0-15 0.492 0.152 17.583 4.325 0.321 0.106 80.312 17.060
15-30 0.459 0.119 16.737 4.872 0.339 0.082 81.504 21.342
30-50 0.391 0.106 15.280 5.817 0.378 0.123 109.069 37.168
50-100 0.355 0.063 13.398 5.075 0.371 0.125 230.930 52.276
100-141 0.269 0.047 10.207 2.469 0.481 0.096 200.082 79.286
TR2 0-15 0.336 0.098 10.058 2.587 0.476 0.137 68.479 13.501
15-30 0.251 0.158 7.016 3.790 0.533 0.146 54.097 27.294
30-50 0.291 0.116 9.909 3.130 0.496 0.143 93.232 19.454
50-100 0.266 0.061 9.102 0.363 0.504 0.071 229.634 35.681
100-166 0.196 0.055 7.439 0.979 0.598 0.040 293.170 37.044
TR3 0-15 0.152 0.123 7.559 3.807 0.626 0.186 62.842 12.827
15-30 0.188 0.141 8.892 3.687 0.537 0.204 64.052 12.755
30-50 0.131 0.077 7.433 2.135 0.615 0.118 87.438 13.453
50-100 0.145 0.088 7.370 2.311 0.623 0.134 219.278 51.243
100-173 0.121 0.046 6.647 1.125 0.750 0.133 368.087 302.721
TR4 0-15 0.170 0.060 8.643 1.519 0.592 0.137 74.703 10.833
15-30 0.137 0.058 8.783 2.341 0.574 0.167 72.392 19.667
30-50 0.127 0.040 7.785 1.657 0.605 0.097 91.632 7.956
50-100 0.118 0.054 7.516 2.116 0.588 0.141 211.954 41.807
100-167 0.091 0.065 6.897 1.411 0.756 0.207 320.957 58.861
TR5 0-15 0.131 0.095 5.738 4.766 0.794 0.236 56.903 25.193
15-30 0.122 0.059 5.215 1.809 0.692 0.161 51.755 14.873
30-50 0.139 0.072 5.710 2.387 0.655 0.209 66.895 12.912
50-100 0.131 0.035 6.139 1.528 0.738 0.123 220.654 38.205
100-163 0.078 0.031 4.716 1.000 0.870 0.073 265.317 147.496
TR6 0-15 0.082 0.080 8.092 5.666 0.698 0.231 70.237 29.950
15-30 0.053 0.042 6.377 2.138 0.707 0.170 63.718 10.245
30-50 0.097 0.051 9.518 2.603 0.593 0.140 108.489 24.907
50-100 0.063 0.052 7.137 1.769 0.674 0.122 234.451 37.484
100-166 0.045 0.035 5.385 1.182 0.861 0.153 295.625 71.882
TR7 0-15 0.128 0.133 6.563 2.383 0.643 0.172 59.025 11.819
15-30 0.138 0.115 7.213 2.079 0.624 0.150 64.899 17.266
30-50 0.185 0.130 8.319 1.552 0.640 0.118 104.147 12.266
50-100 0.129 0.075 7.934 2.338 0.628 0.159 237.667 40.028
100-166 0.144 0.074 6.764 0.659 0.735 0.033 330.054 89.0398
Avg = average value; SE = standard error

19 | P a g e
285 cm. Relatively few changes were shown in both chemical or physical properties with
soil depth. Nitrogen, Carbon and soil bulk density were relatively invariable throughout
the soil depth profile in each transect. Mean carbon concentration of all depths in all
transects was 8.4% with a maximum value of 24.2%. Soil carbon mass of the sampling
transects ranged from 662 to 802 ton/ha with a mean value of 746 ton/ha (Figure 16).
There was no significant differences in soil (belowground) carbon stocks across the
transects.
Comparing the two mangrove forests in Pulau Panjang I (TR1 – TR5) and Pulau Panjang II
(TR6 – TR7), Carbon mass of the soil in Pulau Panjang II was relatively higher than that in
Pulau Panjang I, which was resulted from a higher bulk denisty coupled with greater soil
depth and higher Carbon concentration.
Figure 16. Soil Carbon stock of Kubu Raya mangrove forests sampled from seven transects. Error bars represent standard error of the mean
0
200
400
600
800
1000
1200
TR1 TR2 TR3 TR4 TR5 TR6 TR7
Soil
C (
ton
/ha)
Transect
20 | P a g e
6. Ecosystem Carbon Stocks
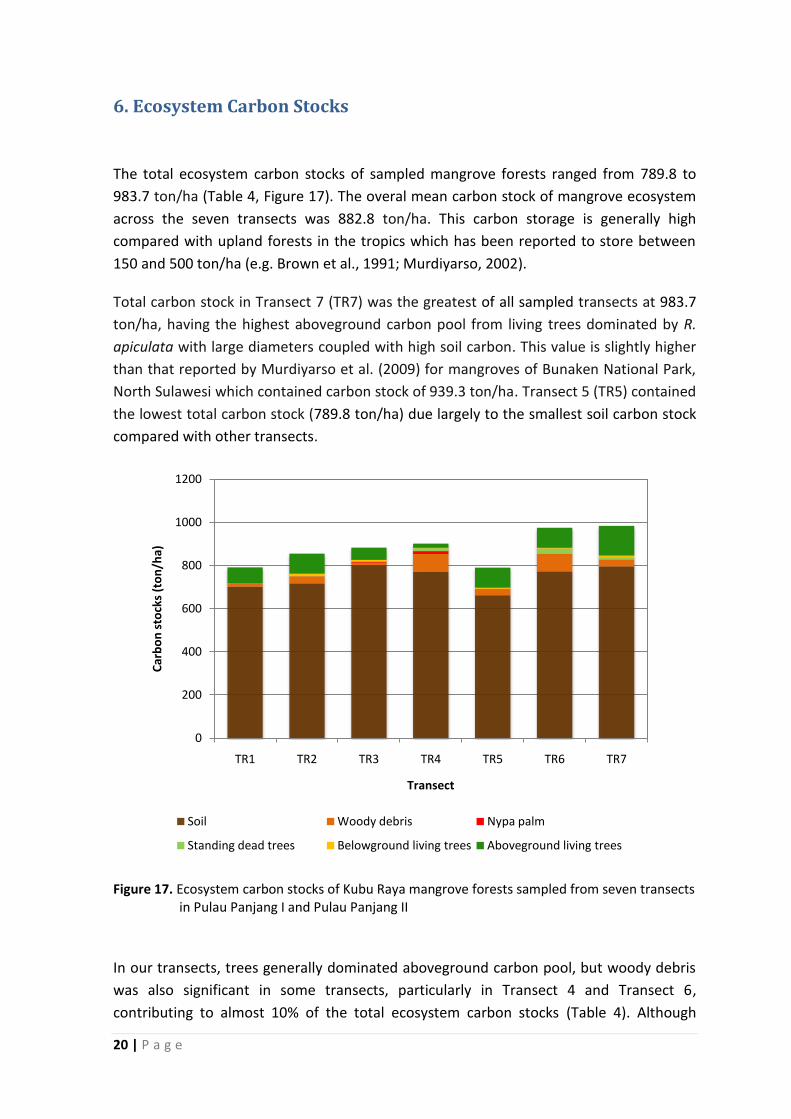
The total ecosystem carbon stocks of sampled mangrove forests ranged from 789.8 to
983.7 ton/ha (Table 4, Figure 17). The overal mean carbon stock of mangrove ecosystem
across the seven transects was 882.8 ton/ha. This carbon storage is generally high
compared with upland forests in the tropics which has been reported to store between
150 and 500 ton/ha (e.g. Brown et al., 1991; Murdiyarso, 2002).
Total carbon stock in Transect 7 (TR7) was the greatest of all sampled transects at 983.7
ton/ha, having the highest aboveground carbon pool from living trees dominated by R.
apiculata with large diameters coupled with high soil carbon. This value is slightly higher
than that reported by Murdiyarso et al. (2009) for mangroves of Bunaken National Park,
North Sulawesi which contained carbon stock of 939.3 ton/ha. Transect 5 (TR5) contained
the lowest total carbon stock (789.8 ton/ha) due largely to the smallest soil carbon stock
compared with other transects.
Figure 17. Ecosystem carbon stocks of Kubu Raya mangrove forests sampled from seven transects in Pulau Panjang I and Pulau Panjang II
In our transects, trees generally dominated aboveground carbon pool, but woody debris
was also significant in some transects, particularly in Transect 4 and Transect 6,
contributing to almost 10% of the total ecosystem carbon stocks (Table 4). Although
0
200
400
600
800
1000
1200
TR1 TR2 TR3 TR4 TR5 TR6 TR7
Car
bo
n s
tock
s (t
on
/ha)
Transect
Soil Woody debris Nypa palm
Standing dead trees Belowground living trees Aboveground living trees

21 | P a g e
aboveground carbon pools were large, they were relatively minor compared to
belowground pools and accounted for only 8 – 20% of the total ecosystem carbon stocks.
Soils which dominated belowground pools contained the majority of ecosystem carbon
pools, accounting for 80 – 92% of the total ecosystem carbon storage (Table 4).
Among the components of ecosystem carbon pools, the presence of nypa palm and roots
may be negligible for the purpose of carbon accounting as the carbon stocks from these
components tend to be relatively small, contributing very little to the total ecosystem
carbon stocks (less than 2% of the total).
Comparing the two mangrove forests in Pulau Panjang I (TR1 – TR5) and Pulau Panjang II
(TR6 – TR7), mangrove forest ecosystem in Pulau Panjang II contained relatively higher
carbon stocks than mangroves in Pulau Panjang I. The mean carbon stocks of mangrove
ecosystem in Pulau Panjang II was 979.1 ton/ha, which was 16% greater than that in
Pulau Panjang I. The combination of high aboveground vegetation and deep, organic-rich
soils resulted in large ecosystem carbon stocks for Pulau Panjang II mangrove forests.
Table 4. Ecosystem carbon pools of Kubu Raya mangrove forests sampled from seven transects in Pulau Panjang I and Pulau Panjang II. Numbers in paranthesis indicate % of the total
Transect Aboveground pools Belowground pools Total
ecosystem C-stocks
Living trees Dead trees Woody debris Nypa palm Roots Soil
TR1 74.1 0.3 14.4 0.0 0.9 701.9 791.5 (9.4) (0.0) (1.8) (0.0) (0.1) (88.7) (100.0)
TR2 92.8 0.6 32.9 0.0 11.6 717.2 855.1 (10.8) (0.1) (3.8) (0.0) (1.4) (83.9) (100.0)
TR3 56.6 0.0 11.7 4.6 8.2 801.7 882.8 (6.4) (0.0) (1.3) (0.5) (0.9) (90.8) (100.0)
TR4 19.7 12.7 82.0 13.4 2.4 771.6 901.8 (2.2) (1.4) (9.1) (1.5) (0.3) (85.6) (100.0)
TR5 92.6 0.3 29.3 0.5 5.5 661.5 789.8 (11.7) (0.0) (3.7) (0.1) (0.7) (83.8) (100.0)
TR6 92.1 23.5 82.0 0.0 4.5 772.5 974.6 (9.5) (2.4) (8.4) (0.0) (0.5) (79.3) (100.0)
TR7 137.6 9.9 31.6 0.0 8.8 795.8 983.7 (14.0) (1.0) (3.2) (0.0) (0.9) (80.9) (100.0)
Overall mean
80.8 6.8 40.5 2.6 6.0 746.0 882.8
9.2 0.8 4.6 0.3 0.7 84.5 100.0

22 | P a g e
7. Conclusion
Mangroves appear to be one of the most carbon-rich ecosystem types of tropical forests.
Data presented in this report show that mangroves in our research sites in Kubu Raya
store large carbon stocks compared to upland forests in the tropics. Belowground pools
(particularly soil) is an important component in mangrove ecosystem as it comprises a
relatively high proportion of the total ecosystem carbon storage.
Because of the values, mangroves should be kept intact from threats of land use or land
cover changes. Deforestation or conversion from mangroves to other land use changes
(e.g. shrimp or fishponds, charcoal production) may result in significant carbon emissions
arising from mangrove loss, wich could affect global climate change. The vulnerability to
climate change and land use change coupled with the high carbon storage of mangroves
and their other important ecological services emphasize the value and potential benefits
from conservation and sustainable use of resources.
Additional studies are required to monitor the dynamics within mangrove forest
ecosystem in which the changes may occur at individual tree, species, stand and
community levels throughout time due to loss of carbon during deforestation caused by
human activities or natural disturbances and accumulation of carbon during re-growth of
forests.

23 | P a g e
References
Alongi, D.M. 2009. The Energetics of Mangrove Forests. Springer Science and Business
Media BV, New York.
Amira, S. 2008. Pendugaan biomassa jenis Rhizophora apiculata Bl. di hutan mangrove,
Batu Ampar, Kabupaten Kubu Raya, Kalimantan Barat. Skripsi Departemen
Konservasi dan Sumberdaya Hutan, Fakultas Kehutanan IPB (unpublished).
Bouillon, S., Borges, A.V., Castaneda-Moya, E., Diele, K., Dittmar, T., Duke, N.C.,
Kristensen, E., Lee, S.Y., Marchand, C., Middolburg, J.J., Rivera-Monroy, V., Smith, T.J.
and Twilley, R.R. 2008. Mangrove production and carbon sinks; a revision of global
budget estimates. Global Biogeochemical Cycless 22.
Brown, S., Gillespie, A.J.R. and Lugo, A.E. 1991 Biomass of tropical forests of South and
Southeast Asia. Canadian Journal of Forestry Research 21:111–117.
Duke, N.C., Meynecke, J.O., Dittmann, S., Ellison, A.M., Anger, K., Berger, U., Cannicci, S.,
Diele, K., Ewel, K.C., Field, C.D., Koedam, N., Lee, S.Y., Marchand, C., Nordhaus, I. and
Dahdouh-Guebas, F., 2007. A world without mangroves. Science 317: 41.
Harmon, M.E. and Sexton, J. 1996. Guidelines for measurements of woodey debritus in
forest ecosystems. Publication No. 20. United States Long Term Ecological Research
Network Office. University of Washington, Seatle.
Kauffman, J.B. and Donato, D.C. Protocols for the measurement, monitoring, and
reporting of structure, biomass, and carbon stocks in mangrove forests.
(unpublished).
Kauffman, J.B., Heider, C., Cole, T.G., Dwire, K.A. and Donato, D.C. 2011. Ecosystem
carbon stocks of Micronesian Mangrove Forests. Wetlands 31:343–352.
Komiyama, A., Poungpam, S. and Kato, S. 2005. Common allometric equations for
estimating the tree weight of mangroves. Journal of Tropical Ecology 21: 471-477.
Krisnawati, H., Adinugroho, W.C., Dharmawan, I.WS., Imanuddin, R. and Susmianto, A.
2011. Carbon stock assessment in mangrove ecosystem of Kubu Raya, West
Kalimantan: technical progress report. Cooperation between the Center for
Conservation and Rehabilitation Research and Development-FORDA and CIFOR.
Langner, A., Micttinen, J. and Siegert, F. 2007. Land cover change 2002-2005 in Borneo
and the role of fire derived from MODIS imagery. Global Change Biology 12: 2329-
2340.
24 | P a g e
Murdiyarso, D. and Adiningsih, E.S. 2007. Climate anomalies, Indonesian vegetation fires
and terrestrial carbon emissions. Mitigation and Adaptation Strategies for Global
Change 12: 101-112.
Murdiyarso, D., Donato, D., Kauffman, J.B., Kurnianto, S., Stidham, M. and Kanninen, M.
2009. Carbon storage in mangrove and peatland ecosystems: a preliminary account
from plots in Indonesia. CIFOR Working Paper 48.
Ong, J.E., Gong, W.K., and Wong, C.H. 2004. Allometry and partitioning of the mangrove,
Rhizophora apiculata. Forest Ecology and Management 188: 395-408.
Snedaker, S.C. and Lahmann, E.J. 1988. Mangrove understorey absence: a consequence
of evolution? Journal of Tropical Ecology 4: 311-314.
SNI 7724. 2011. Pengukuran dan penghitungan cadangan karbon - Pengukuran lapangan
untuk penaksiran cadangan karbon hutan (ground based forest carbon accounting).
Badan Standardisasi Nasional, Jakarta.
Snowdon, P. 1990. A ratio estimator for bias correction in logarithmic regressions.
Canadian Journal of Forest Research 21: 720-724.
Sprugel, D.G. 1983. Correcting for bias in log-transformed allometric equations. Ecology
64: 209-210.
Talan, M.A. 2008. Persamaan penduga biomasa pohon jenis nyirih (Xylocarpus granatum
Koenig. 1784) dalam tegakan mangrove hutan alam di Batu Ampar, Kalimantan Barat.
Skripsi Departemen Konservasi Sumberdaya Hutan, Fakultas Kehutanan IPB
(unpublished).
UNEP (United Nations Environment Programme). 2004. Mangrove in the South China Sea.
UNEP/GEF/SCS Technical Publication No. 1.
Valiela, I., Bowen, J.L. and York, J.K. 2001. Mangrove forests: one of the world’s
threatened major tropical environments. Bioscisnce 51: 807-815.
Waddal, K.L. 2002. Sampling coarse woody debris for multiple attributes in extensive
resource inventories. Ecological Indicators 1: 139-153.