carburetor main body machining
TRANSCRIPT
Lean Six Sigma Final Project Report-Out
Carburetor Main Body MachiningGreen Belt Project
Project Lead: Jonathan IddingsSponsor (Champion): Jon BigleyCompany/Department: CarburetionProject Timeframe: June-04 : April-05
Additional Team MembersProduct Engineer: Mike CalvinProduct Technician: Rex McCoyQuality Technician: Jayn AdkisonSetup Operator: Jasmin Kovacevic

Define … the process
1
Main Body Machining
Carburetor main body machining consists of a manual/Kingsbury line for two and four barrel (high volume), and an old CNC cell for spread bore and HP (low volume). Each part requires a minimum of nine machines on the manual line and 2 machines on the CNC line.
Equipment Flexibility
# of Operators RequiredLabor Cost
Setup TimeLine/Cell Scalability
Efficiency
CPK / Sigma Level
FPY
Tooling Robustness
Machine/Fixture Rigidity
# of Lines/Cells Required
IPO DIAGRAM
INPUTS PROCESS OUTPUTS

Define … the business case
2
• Problem Statement– Current process is labor intensive, dedicated to the current part
design, difficult to setup, dependent on 50 year old machinery, and incapable of high accuracy or repeatability. The importance of this project our business is very high. The current process is responsible for almost $400,000 per year in waste.
• Project Goals– Reduce labor requirements from 10 operators to 5.– Improve FPY from 96% to 99%– Improve “key characteristic” CPK from .2 to 1.5– Reduce changeover time from 90 minutes to 15 minutes

3
Define … the voice of the customer
WHAT CUSTOMER WANTS RankCleanliness (Internal/External) 5 1 9Dimensional Accuracy/Repeatability (Internal) 3 9 3 3On-time Delivery (External) 5 9Fast Time to Market (Internal/External) 1 3Pleasing Appearance (External) 4 3 1Reduced Warranty Returns (Internal/External) 3 3 9 1Low Cost (Internal) 2 9 1 1
119 76 14 2 9
Reb
uild
Exi
stin
g M
achi
nes
Re-
Layo
ut E
xist
ing
Line
New
Sho
p Fl
oor C
MM
Carburetor Main Body Machining QFD
HO
W T
O IM
PA
CT
New
CN
C M
achi
nes
New
Par
ts W
ashe
r
Direct & Strong = 9Direct = 3Indirect = 1
Importance: 5 = High, 1 = Low
Key Takeaways
Implementation of new CNC cell will impact accuracy, repeatability, fill rate, time to market, appearance, part cost, and warranty cost.

Measure … the current process performance
4
Baseline Data : Sigma Level / CPK
Cpk Analysis
2.23
112.
2316
2.23
222.
2327
2.23
322.
2337
2.23
422.
2348
2.23
53
2.23
582.
2363
2.23
682.
2374
2.23
79
2.23
842.
2389
2.23
942.
2400
2.24
052.
2410
2.24
15
2.24
202.
2426
2.24
312.
2436
2.24
412.
2446
2.24
51
2.24
572.
2462
2.24
672.
2472
2.24
772.
2483
2.24
88
2.24
93
In specOut spec leftOut spec rightLSLUSL
Mean = 2.2415StdDev = 0.0017569USL = 2.238LSL = 2.232Sigma Level = -2.0033Sigma Capability = -.5033Cpk = -.6678Cp = .5692DPM = 977,429N = 30
Pump Shooter Boss HeightOld Process
Cpk Analysis
0.31
050.
3110
0.31
150.
3120
0.31
250.
3130
0.31
350.
3140
0.31
45
0.31
500.
3155
0.31
600.
3165
0.31
70
0.31
750.
3180
0.31
850.
3190
0.31
950.
3200
0.32
05
0.32
100.
3215
0.32
200.
3225
0.32
300.
3235
0.32
40
0.32
450.
3250
0.32
550.
3260
0.32
650.
3270
0.32
75
0.32
80
In specOut spec leftOut spec rightLSLUSL
Mean = 0.31931StdDev = 0.0019594USL = 0.316LSL = 0.314Sigma Level = -1.6918Sigma Capability = -.2279Cpk = -.5639Cp = .1701DPM = 957,993N = 30
Booster Hole SizeOld Process
Key Takeaways
• Boss height critical to performance, hole size critical to assembly.
• Baseline CPK was negative for both features.
• Our goal is to improve CPK to 1.5, which will yield Sigma Level of 4.5.

Measure … the current process performance
5
Baseline Data : First Pass YieldFPY OLD PROCESS
88%
90%
92%
94%
96%
98%
100%
Jun-04 Jul-04 Aug-04 Sep-04 Oct-04 Nov-04 Dec-04 Jan-05 Feb-05 Mar-05
MONTH
98%
Baseline Data : Labor
Key Takeaways•Scrap and rework data available at beginning of project was unreliable.
•FPY chart data reflects machining defects at flow, assembly, and machining.
•Labor chart is derived from actual labor hours and actual overtime hours. Source: Intranet Efficiency Report
OLD PROCESS LABOR USAGE (CY 2004)
$36,792.02
$25,434.10
$35,182.96
$33,252.63
$26,787.38$25,957.16
$23,299.67$21,961.22
$14,362.04
$10,311.17$10,876.21
$28,899.89
$-
$5,000.00
$10,000.00
$15,000.00
$20,000.00
$25,000.00
$30,000.00
$35,000.00
$40,000.00
Janu
ary
Febru
ary
March
April
May
June July
Augus
tSep
tembe
r
Octobe
rNov
embe
rDec
embe
r
MONTH
MO
NTH
LY L
AB
OR
CO
ST
OLD PROCESS
TOTAL LABOR USAGE = $293,116

Measure … the current process performance
6
Baseline Data : Changeover Time
Key Takeaways•Average Changeover Time Within Family = 40 minutes
•Average Changeover Time Between Families = 90 minutes
•Changeover involves removing multiple tools from multiple machines and replacing with alternate tooling.
•Opportunity for operator error very high.
•Changeover process largely dependent on knowledge of ONE employee.

Measure … the current process performance
7
Baseline Data:Process Map
Key Takeaways• Red shapes represent 55 minutes of waiting time through the process, which results from the batch flow of the line.
• Green shapes show the quantity of machines required.
• Orange shapes represent movement of the parts from one stage to another.
Analyze … the root causes of poor performance
8
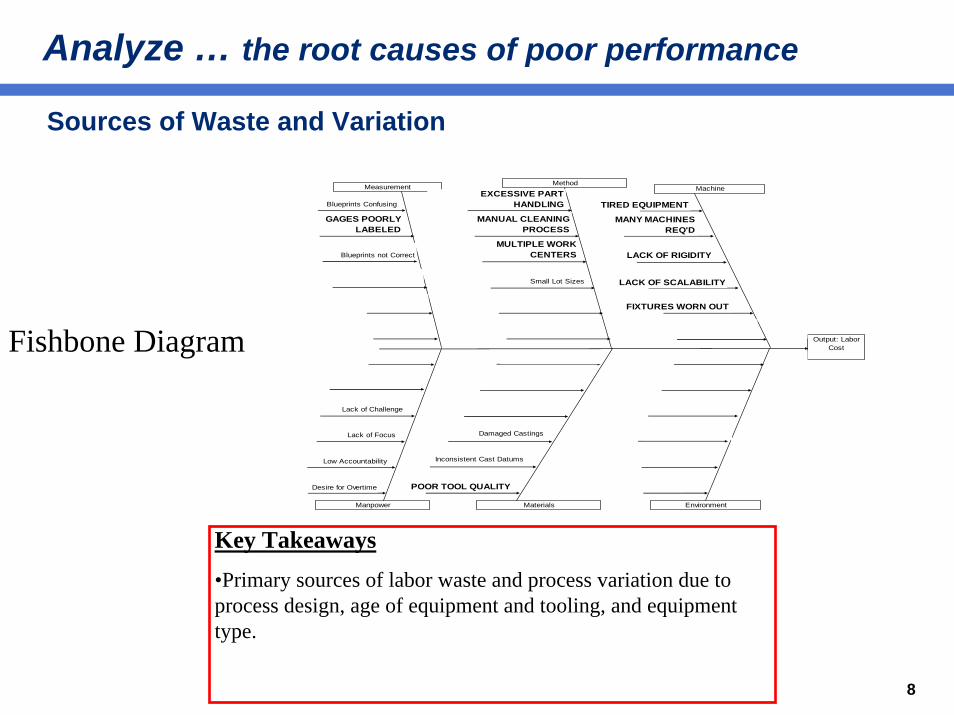
Sources of Waste and Variation
Measurement MethodMachine
Manpower Materials Environment
Output: Labor Cost
Blueprints not Correct
GAGES POORLY LABELED
Blueprints Confusing
Small Lot Sizes
MULTIPLE WORK CENTERS
MANUAL CLEANING PROCESS
EXCESSIVE PART HANDLING
FIXTURES WORN OUT
LACK OF SCALABILITY
LACK OF RIGIDITY
MANY MACHINES REQ'D
TIRED EQUIPMENT
Low Accountability
Desire for Overtime
Lack of Focus
Lack of Challenge
Inconsistent Cast Datums
POOR TOOL QUALITY
Damaged Castings
Fishbone Diagram
Key Takeaways•Primary sources of labor waste and process variation due to process design, age of equipment and tooling, and equipment type.

Improve … the process
9
• Alternate Solutions ConsideredDial Index/Transfer Machine Vertical Machining Centers- Complex - Cycle Times not Balanced- Costly - Tool capacity inadequate- Lacking Flexibility - Gravity works against us
• Actions– Decided on three Horizontal Machining Centers.– Determined Mori Seiki to be best overall choice.– Designed fixtures to allow completed part with every cycle.– Designed fixtures to allow rapid changeover from family to family.– Designed fixtures to require no changeover within family.– Specified/designed robust tooling solutions to yield long life, low cycle
times, and high part quality.– Wrote CNC programs utilizing advanced Macro B (Basic) to standardize
across part families, bullet-proof the changeover process, and allow streamlined response to part design changes.
Control … to hold the gains
10
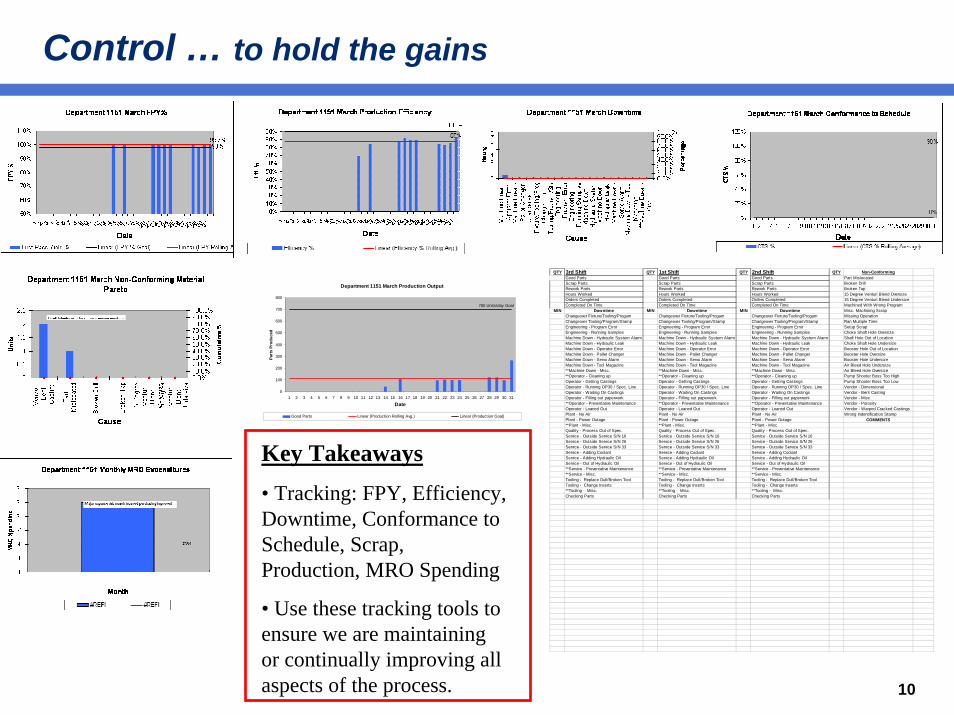
QTY 3rd Shift QTY 1st Shift QTY 2nd Shift QTY Non-ConformingGood Parts Good Parts Good Parts Part MislocatedScrap Parts Scrap Parts Scrap Parts Broken DrillRework Parts Rework Parts Rework Parts Broken TapHours Worked Hours Worked Hours Worked 15 Degree Venturi Blend OversizeOrders Completed Orders Completed Orders Completed 15 Degree Venturi Blend UndersizeCompleted On Time Completed On Time Completed On Time Machined With Wrong Program
MIN Downtime MIN Downtime MIN Downtime Misc. Machining ScrapChangeover Fixture/Tooling/Progam Changeover Fixture/Tooling/Progam Changeover Fixture/Tooling/Progam Missing OperationChangeover Tooling/Program/Stamp Changeover Tooling/Program/Stamp Changeover Tooling/Program/Stamp Ran Multiple TimeEngineering - Program Error Engineering - Program Error Engineering - Program Error Setup ScrapEngineering - Running Samples Engineering - Running Samples Engineering - Running Samples Choke Shaft Hole OversizeMachine Down - Hydraulic System Alarm Machine Down - Hydraulic System Alarm Machine Down - Hydraulic System Alarm Shaft Hole Out of LocationMachine Down - Hydraulic Leak Machine Down - Hydraulic Leak Machine Down - Hydraulic Leak Choke Shaft Hole UndersizeMachine Down - Operator Error Machine Down - Operator Error Machine Down - Operator Error Booster Hole Out of LocationMachine Down - Pallet Changer Machine Down - Pallet Changer Machine Down - Pallet Changer Booster Hole OversizeMachine Down - Servo Alarm Machine Down - Servo Alarm Machine Down - Servo Alarm Booster Hole UndersizeMachine Down - Tool Magazine Machine Down - Tool Magazine Machine Down - Tool Magazine Air Bleed Hole Undersize**Machine Down - Misc. **Machine Down - Misc. **Machine Down - Misc. Air Bleed Hole Oversize**Operator - Cleaning up **Operator - Cleaning up **Operator - Cleaning up Pump Shooter Boss Too HighOperator - Getting Castings Operator - Getting Castings Operator - Getting Castings Pump Shooter Boss Too LowOperator - Running OP30 / Spec. Line Operator - Running OP30 / Spec. Line Operator - Running OP30 / Spec. Line Vendor - Dimensional Operator - Waiting On Castings Operator - Waiting On Castings Operator - Waiting On Castings Vendor - Bent CastingOperator - Filling out paperwork Operator - Filling out paperwork Operator - Filling out paperwork Vendor - Misc. **Operator - Preventative Maintenance **Operator - Preventative Maintenance **Operator - Preventative Maintenance Vendor - PorosityOperator - Loaned Out Operator - Loaned Out Operator - Loaned Out Vendor - Warped Cracked CastingsPlant - No Air Plant - No Air Plant - No Air Wrong Indentification StampPlant - Power Outage Plant - Power Outage Plant - Power Outage COMMENTS**Plant - Misc. **Plant - Misc. **Plant - Misc.Quality - Process Out of Spec. Quality - Process Out of Spec. Quality - Process Out of Spec.Service - Outside Service S/N 16 Service - Outside Service S/N 16 Service - Outside Service S/N 16Service - Outside Service S/N 26 Service - Outside Service S/N 26 Service - Outside Service S/N 26Service - Outside Service S/N 33 Service - Outside Service S/N 33 Service - Outside Service S/N 33Service - Adding Coolant Service - Adding Coolant Service - Adding CoolantService - Adding Hydraulic Oil Service - Adding Hydraulic Oil Service - Adding Hydraulic OilService - Out of Hydraulic Oil Service - Out of Hydraulic Oil Service - Out of Hydraulic Oil**Service - Preventative Maintenance **Service - Preventative Maintenance **Service - Preventative Maintenance**Service - Misc. **Service - Misc. **Service - Misc.Tooling - Replace Dull/Broken Tool Tooling - Replace Dull/Broken Tool Tooling - Replace Dull/Broken ToolTooling - Change Inserts Tooling - Change Inserts Tooling - Change Inserts**Tooling - Misc. **Tooling - Misc. **Tooling - Misc.Checking Parts Checking Parts Checking Parts
Department 1151 March Production Output
700 Units/day Goal
0
100
200
300
400
500
600
700
800
1 2 3 4 5 6 7 8 9 10 11 12 13 14 15 16 17 18 19 20 21 22 23 24 25 26 27 28 29 30 31
Date
Part
s P
rodu
ced
Good Parts Linear (Production Rolling Avg.) Linear (Production Goal)
Key Takeaways• Tracking: FPY, Efficiency, Downtime, Conformance to Schedule, Scrap, Production, MRO Spending
• Use these tracking tools to ensure we are maintaining or continually improving all aspects of the process.

Project Results … Verification of Improvement
11
BEFOREPROCESS MAPS
Key Takeaways• Total distance traveled reduced from 87 feet to 16 feet.
• Total waiting time reduced from 55 minutes to 3.2 minutes
• Each part now complete after one machine, compared to 8-15 machines previously.
• Cleared 600 sq. ft. of floor space. AFTER
Project Results … Verification of Improvement
12
Cpk Analysis
0.31
050.
3110
0.31
150.
3120
0.31
25
0.31
300.
3135
0.31
400.
3145
0.31
500.
3155
0.31
60
0.31
650.
3170
0.31
75
0.31
800.
3185
0.31
90
0.31
950.
3200
0.32
050.
3210
0.32
150.
3220
0.32
25
0.32
300.
3235
0.32
40
0.32
450.
3250
0.32
55
0.32
600.
3265
0.32
70
0.32
750.
3280
In specOut spec leftOut spec rightLSLUSL
Mean = 0.31931StdDev = 0.0019594USL = 0.316LSL = 0.314Sigma Level = -1.6918Sigma Capability = -.2279Cpk = -.5639Cp = .1701DPM = 957,993N = 30
Booster Hole SizeOld Process
Cpk Analysis
2.23
112.
2316
2.23
222.
2327
2.23
32
2.23
372.
2342
2.23
482.
2353
2.23
582.
2363
2.23
68
2.23
742.
2379
2.23
84
2.23
892.
2394
2.24
00
2.24
052.
2410
2.24
152.
2420
2.24
262.
2431
2.24
36
2.24
412.
2446
2.24
51
2.24
572.
2462
2.24
67
2.24
722.
2477
2.24
83
2.24
882.
2493
In specOut spec leftOut spec rightLSLUSL
Mean = 2.2415StdDev = 0.0017569USL = 2.238LSL = 2.232Sigma Level = -2.0033Sigma Capability = -.5033Cpk = -.6678Cp = .5692DPM = 977,429N = 30
Pump Shooter Boss HeightOld Process
Cpk Analysis
0.31
390.
3140
0.31
410.
3141
0.31
420.
3142
0.31
430.
3144
0.31
440.
3145
0.31
450.
3146
0.31
470.
3147
0.31
480.
3148
0.31
490.
3150
0.31
500.
3151
0.31
510.
3152
0.31
530.
3153
0.31
540.
3154
0.31
550.
3156
0.31
560.
3157
0.31
570.
3158
0.31
590.
3159
0.31
600.
3160
In specOut spec leftOut spec rightLSLUSL
Mean = 0.31541StdDev = 0.00010196USL = 0.316LSL = 0.314Sigma Level = 5.8015Sigma Capability = 7.3015Cpk = 1.9338Cp = 3.2693DPM = .00328685N = 30
Booster Hole SizeNew Process
BEFORE AFTERCpk Analysis
2.23
072.
2310
2.23
122.
2315
2.23
18
2.23
202.
2323
2.23
26
2.23
282.
2331
2.23
34
2.23
362.
2339
2.23
42
2.23
442.
2347
2.23
50
2.23
522.
2355
2.23
57
2.23
602.
2363
2.23
65
2.23
682.
2371
2.23
73
2.23
762.
2379
2.23
81
2.23
842.
2387
2.23
89
2.23
922.
2395
2.23
97
2.24
00
In specOut spec leftOut spec rightLSLUSL
Mean = 2.2354StdDev = 0.0010372USL = 2.238LSL = 2.232Sigma Level = 2.5263Sigma Capability = 3.9935Cpk = .8421Cp = .9642DPM = 6,324N = 30
Pump Shooter Boss HeightNew Process
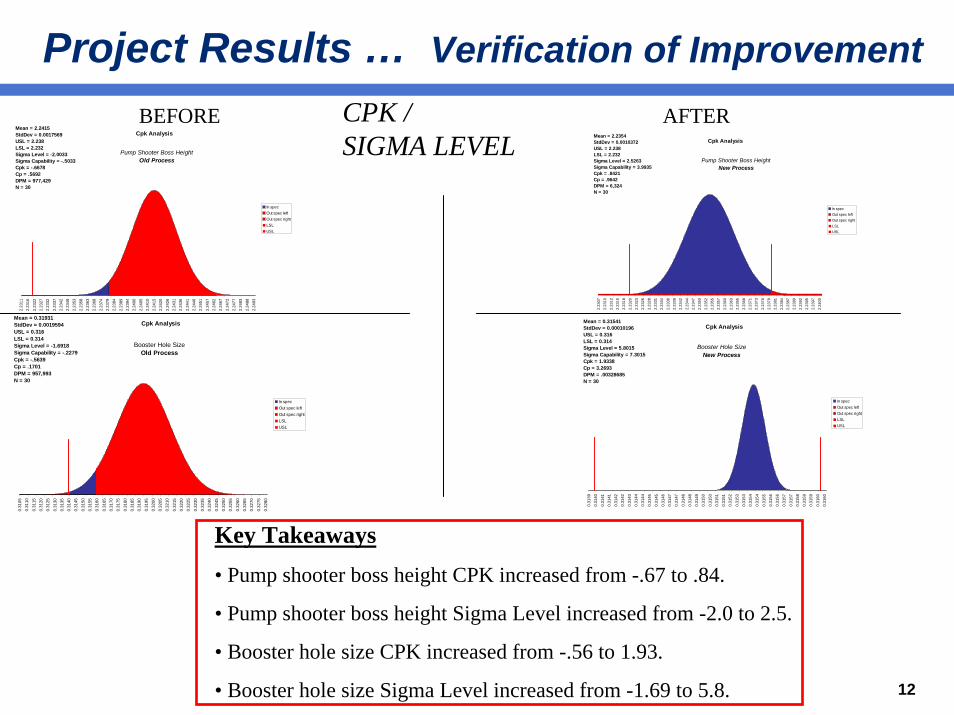
CPK / SIGMA LEVEL
Key Takeaways• Pump shooter boss height CPK increased from -.67 to .84.
• Pump shooter boss height Sigma Level increased from -2.0 to 2.5.
• Booster hole size CPK increased from -.56 to 1.93.
• Booster hole size Sigma Level increased from -1.69 to 5.8.

13
Project Results … Verification of Improvement
MONTHLY LABOR COST
Key Takeaways• Blue line represents actual 2004 labor cost from intranet efficiency report.
• Red line represents estimated 2005 labor cost based on measured throughput of new cell and equal sales to 2004.
• 2004 Labor Cost: $293,116
• 2006 Labor Cost: $128,300
• Savings: $164,816$-
$5,000.00
$10,000.00
$15,000.00
$20,000.00
$25,000.00
$30,000.00
$35,000.00
$40,000.00
Janu
ary
Februa
ry
March
April
May
June July
Augus
tSep
tembe
r
Octobe
rNove
mber
Decembe
r
OLD PROCESSNEW PROCESS

Project Results … Verification of Improvement
14
First Pass Yield
80%
82%
84%
86%
88%
90%
92%
94%
96%
98%
100%
Jun-04 Jul-04 Aug-04 Sep-04 Oct-04 Nov-04 Dec-04 Jan-05 Feb-05 Mar-05
OLD PROCESSNEW PROCESSTARGET
Key Takeaways• Blue line represents FPY of old line.
• Red line represents FPY of new cell.
• We are exceeding our goal of 98% FPY.

Project Results … Verification of Improvement
15
Key Takeaways• Changeover time within family reduced from 40 minutes to 5 minutes.
• Changeover time between families reduced from 90 minutes to 15 minutes.
CHANGEOVER TIME
Within Family
Within Family
Between Families
Between Families
0
10
20
30
40
50
60
70
80
90
100
Before After
MIN
UTE
S

Project Summary
16
• Problem– Carburetor main body machining consisted of antiquated manual/Kingsbury line for
two and four barrel (high volume), and an old CNC cell for spread bore and HP (low volume). Each part requires a minimum of nine machines on the manual line and 3 machines on the CNC line.
• Baseline and Target Performance– Reduce labor cost from $412k to $128k– Reduce warranty cost by $100,000– Improve “key characteristic” CPK from .6 to 1.33– Improve FPY from 87% to 98%– Reduce setup time from 90 minutes to 15 minutes
• Analysis and Solution– Analysis revealed that process design, type of equipment, age of equipment, and
age of tooling were primary contributors to labor waste and process variation.– Our new CNC machining cell consists of three computerized horizontal machining
centers with automatic work piece changers, state-of-the-art tooling, and quick change fixtures.

Project Summary Scorecard … before and after
17
metric before after improvementLabor $293,116 annually $128,304 annually $164,816
CPK / Sigma Level -0.6 CPK-0.75 Sigma Level
1.5 CPK3.5 Sigma Level
Delta= 2 CPKDelta= 4.25 Sigma Level
Setup Time 90 minutes 15 minutes 84% Reduction
Tooling Cost $57,600 $14,400 $43,200
Repair Parts Cost $57,000 annually for Carb BU 10% Reduction $5,700
Floor Space 1800 Sq. Feet 1200 Sq. Feet 600 Sq. Feet
Line Shutdown Risk Series production yields 100% down if 1 machine down
Parallel production yields 33% down if 1 machine down
66% Reduction
FPY(Scrap/Rework Cost)
96%(7000 scrap/rework units per year)
99.5%(875 scrap/rework units per year)
$52,924
Total: $267,000