carcinogenesis bioassay of di(2-ethylhexyl)adipate … · national toxicology program technical...
TRANSCRIPT
NATIONAL TOXICOLOGY PROGRAM Technical Report Series No. 212
CARCINOGENESIS BIOASSAY OF
DI(2-ETHYLHEXYL)ADIPATE
(CAS NO. 103-23-1)
F344 RATS AND B6C3F1 MICE (FEED STUDY)
U.S. DEPARTMENT OF HEALTH AND HUMAN SERVICES Public Health Service
National Institutes of Health
NATIONAL TOXICOLOGY PROGRAM
The National Toxicology Program (NTP), established in 1978, develops and evaluates scientific information about potentially toxic and hazardous chemicals. This knowledge can be used for protecting the health of the American people and for the primary prevention of chemically induced disease. By bringing together the relevant programs, staff, and resources from the U.S. Public Health Service, DHHS, the National Toxicology Program has centralized and strengthened activities relating to toxicology research, testing and test development/validation efforts, and the dissemination of toxicological information to the public and scientific communities and to the research and regulatory agencies.
The NTP is comprised of four charter DHHS agencies: the National Cancer Institute, National Institutes of Health; the National Institute of Environmental Health Sciences, National Institutes of Health; the National Center for Toxicological Research, Food and Drug Administration; and the National Institute for Occupational Safety and Health, Centers for Disease Control. In June 1981, the Carcinogenesis Bioassay Testing Program, NCI, was transferred to the NIEHS.
NTP Technical Report
on the
CARCINOGENESIS BIOASSAY
of
DI(2-ETHYLHEXYL)ADIPATE
(CAS No. 103-23-1)
IN F344 RATS AND B6C3F1 MICE
(FEED STUDY)
National Cancer Institute NATIONAL TOXICOLOGY PROGRAM
P. 0. Box 12233 Research Triangle Park North Carolina 27709
and Bethesda, Maryland 20205
March 1982 (This revised Technical Report
replaces the one dated May 1981)
NTP-80-29 NIH Publication No. 81-1768
U.S. DEPARTMENT OF HEALTH AND HUMAN SERVICES
Public Health Service
National Institutes of Health
Copies of these Reports are available for sale from the National Technical Information Service, U.S. Department of Commerce, 5285 Port Royal Road, Springfield, VA 22161 (703-487-4650).
Comments and questions about the National Toxicology Program Technical Reports on Carcinogenesis Bioassays should be directed to Ms. Joan Chase, Technical Information Section, Room A-306, Landow Building, Bethesda, MD 20014 (301-496-1152).
CARCINOGENESIS BIOASSAY OF
DI(2-ETHYLHEXYL)ADIPATE (CAS NO. 103-23-1)
Carcinogenesis Testing Program National Cancer Institute/National Toxicology Program
FOREWORD
This report presents the results of the bioassay of di(2-ethylhexyl)adipate conducted for the Carcinogenesis Testing Program, National Cancer Institute (NCI)/National Toxicology Program (NTP). This is one of a series of experiments designed to determine whether selected chemicals have the capacity to produce cancer in animals. A negative result, in which the test animals do not have a greater incidence of cancer than control animals, does not necessarily mean that a test chemical is not a carcinogen inasmuch as the experiments are conducted under a limited set of circumstances. A positive result demonstrates that a test chemical is carcinogenic for animals under the conditions of the test and indicates that exposure to the chemical may pose a potential risk to man. The actual determination of the risk to man from chemicals found to be carcinogenic in animals requires a wider analysis which extends beyond the preview of this study.
CONTRIBUTORS
The bioassay of di(2-ethylhexyl)adipate was conducted from April 1977 to May 1979 at EG&G Mason Research Institute, Worcester, Massachusetts, under a subcontract to Tracer Jitco, Inc., the prime contractor for the NCI Carcinogenesis Testing Program.
The bioassay was conducted under the supervision of Drs. H. Lilja (1) and E. Massaro (1,2), principal investigators, and Mr. G. Wade (1). Doses of the test chemical were selected by Drs. 0. G. Fitzhugh (3,4), J. F. Robens (3,5), and C. Cueto (6,7). The program manager was Ms. R. Monson (1). Ms. A. Good (1) supervised the technicians in charge of animal care, and Ms. E. Zepp (1) supervised the preparation of the feed mixtures and collected samples of the diets for analysis. Ms. D. Bouthot (1) kept all daily records of the test. Dr. A. S. Krishna Murthy (1) and Dr. D. S. Wyand (1), pathologists, directed the necropsies and performed the histopathologic evaluations. The pathology report and selected slides were evaluated by the NCI Pathology Working Group as described in Ward et al. (1978). The diagnoses represent a consensus of contracting pathologists and the NCI Pathology Working Group, with final approval by the NCI Pathology Working Group.
Animal pathology tables and survival tables were compiled at EG&G Mason Research Institute, Rockville, Maryland (8). The statistical analyses were performed by Dr. J. R. Joiner (3) and Ms. S. Vatsan (3), using methods selected for the bioassay program by Dr. J. J. Gart (9).
iii
Chemicals used in this bioassay were analyzed at Midwest Research Institute (10), and dosed feed mixtures were analyzed by Dr. M. Hagopian (1).
This report was prepared at Tracor Jitco (3) and reviewed by NCI. Those responsible for the report at Tracor Jitco were Dr. L. A. Campbell, Acting Director of the Bioassay Program; Dr. S. S. Olin, Associate Director; Dr. M. A. Stedham, pathologist; Dr. D. J. Beach, reports manager; Dr. A. C. Jacobs, bioscience writer; and Dr. W. D. Theriault and Ms. M. W. Glasser, technical editors.
The following scientists at NCI (6) were responsible for evaluating the bioassay experiment, interpreting the results, and reporting the findings: Dr. J. Fielding Douglas, Dr. Richard A. Griesemer, Dr. Charles K. Grieshaber, Dr. Thomas E. Hamm, Dr. Larry Hart, Dr. William V. Hartwell, Dr. Joseph Haseman, Dr. James E. Huff, Dr. C. W. Jameson, Dr. Mary R. Kornreich, Dr. Ernest E. McConnell, Dr. John A. Moore, Dr. Marcelina B. Powers (Chemical Manager), Dr. Sherman F. Stinson, Dr. Raymond Tennant, and Dr. Jerrold M. Ward.
On June 27, 1980, this report underwent peer review by the National Toxicology Program Board of Scientific Counselors' Technical Reports Review Subcommittee and associated Panel of Experts. The review meeting began at 9 a.m. in Room 1331, Switzer Building, 330 C Street, S.W., Washington, D.C. Members of the Subcommittee are: Drs. Margaret Hitchcock (Chairperson), Curtis Harper, Thomas Shepard, and Alice Whittemore. Members of the Panel are: Drs. Norman Breslow, Joseph Highland, Charles Irving, Frank Mirer, Sheldon Murphy, Svend Nielsen, Bernard Schwetz, Roy Shore, James Swenberg, and Gary Williams. Drs. Highland, Schwetz, and Swenberg were unable to attend the review.
Dr. Murphy, the primary reviewer for the report on the bioassay of di(2-ethylhexyl)adipate, agreed with the conclusion in the report that, under the conditions of the test, di(2-ethylhexyl)adipate was not carcinogenic to F344 rats of either sex and that the compound was carcinogenic for female B6C3F1 mice, causing increased incidences of hepatocellular adenomas or carcinomas. Although there is less certain evidence for carcinogenicity in male mice, he thought that the compound is "probably" rather than "possibly" carcinogenic for male mice because there were higher incidences of liver tumors in both dosage groups, albeit only the findings in the high-dose group were statistically significant, and because there was a reduced latent period for appearance of hepatocellular carcinomas. Dr. Murphy noted there were significant negative trends for tumors of the hematopoietic system in mice and there were no "toxic" lesions seen in the livers of dosed mice. However, there was a small dose-related increase in colon nematodiasis in both sexes of both species.
As the secondary reviewer, Dr. Mirer agreed with the conclusions in the report, including Dr. Murphy's modification. He stated a concern relating to the fact that test animals shared rooms with animals being fed other phthalate esters, which raised the question of cross contamination.
iv
Dr. Murphy moved that the report on the bioassay of di(2-ethylhexyl)adipate be accepted with the proviso that NTP staff incorporate clarifications regarding the conclusions on the findings in male mice. Dr. Mirer seconded the motion and it was approved unanimously.
(1) EG&G Mason Research Institute, 57 Union Street, Worcester, Massachusetts 01608.
(2) Now with Pennsylvania State University, 226 Fenske Laboratory, University Park, Pennsylvania 16802.
(3) Tracer Jitco, Inc., 1776 East Jefferson Street, Rockville, Maryland 20852.
(4) Now at 4208 Dresden Street, Kensington, Maryland 20795. (5) Now with Bureau of Veterinary Medicine, Food and Drug Administration,
5600 Fishers Lane, Rockville, Maryland 20851. (6) Carcinogenesis Testing Program, National Cancer Institute, National
Institutes of Health, Bethesda, Maryland 20205; National Toxicology Program, Research Triangle Park, Box 12233, North Carolina 27709.
(7) Now with Tracor Jitco, Inc., 1776 East Jefferson Street, Rockville, Maryland 20852.
(8) EG&G Mason Research Institute, 1530 East Jefferson Street, Rockville, Maryland 20852.
(9) Mathematical Statistics and Applied Mathematics Section, Biometry Branch, Field Studies and Statistics, Division of Cancer Cause and Prevention, National Cancer Institute, National Institutes of Health, Bethesda, Maryland 20205.
(10) Midwest Research Institute, 425 Volker Boulevard, Kansas City, Missouri 64110.
v

vi
SUMMARY
Di(2-ethylhexyl)adipate is a plasticizer used to give flexibility to vinyl plastics. A carcinogenesis bioassay was conducted by feeding diets containing 12,000 or 25,000 ppm of di(2-ethylhexyladipate to groups of 50 male and 50 female F344 rats and 50 male and 50 female B6C3F1 mice for 103 weeks. Groups of 50 undosed rats and mice of each sex served as controls. All surviving animals were killed at 104 to 107 weeks.
Mean body weights of high-dose rats and mice of either sex were lower than those of the controls throughout the study.
Compound administration was not associated with tumor formation in F344 rats of either sex.
Hepatocellular carcinomas or adenomas occurred in mice of both sexes in a dose-related fashion at incidences that were significantly higher for high-dose males and for low- and high-dose females than those in the controls. When compared with the incidence in historical laboratory control mice, however, the liver tumors in male mice could not be clearly related to compound administration.
Under the conditions of this bioassay, di(2-ethylhexyl)adipate was not carcinogenic for F344 rats. Di(2-ethylhexyl)adipate was carcinogenic for female B6C3F1 mice, causing increased incidences of hepatocellular carcinomas, and was probably carcinogenic for male B6C3F1 mice, causing hepatocellular adenomas.
vii

viii
TABLE OF CONTENTS
Page
Foreword iii Contributors iii Peer-Review Panel Members and Comments.. iv Summary vii
I. Introduction 1
II. Materials and Methods 3
A. Chemical 3 B. Dietary Preparation 3 C. Animals 4 D. Animal Maintenance 4 E. Acute Toxicity and 14-Day Repeated Dose Studies 5 F. Subchronic Studies 9 G. Chronic Studies 9 H. Clinical Examinations and Pathology 9 I. Data Recording and Statistical Analyses 13
III. Results - Rats 17
A. Body Weights and Clinical Signs (Rats) 17 B. Survival (Rats) 17 C. Pathology (Rats) 17 D. Statistical Analyses of Results (Rats) 20
IV. Results - Mice 33
A. Body Weights and Clinical Signs (Mice) 33 B. Survival (Mice) 33 C. Pathology (Mice) 33 D. Statistical Analyses of Results (Mice) 37
V. Discussion 47
VI. Conclusions 49
VII. Bibliography 51
APPENDIXES
Appendix A Summary of the Incidence of Neoplasms in Rats Fed Diets Containing Di(2-ethylhexyl) adipate 55
Table A1 Summary of the Incidence of Neoplasms in Male Rats Fed Diets Containing Di(2-ethylhexyl)adipate 57
Table A2 Summary of the Incidence of Neoplasms in Female Rats Fed Diets Containing Di(2-ethylhexyl) adipate 62
ix
Appendix B
Table B1
Table B2
Appendix C
Table C1
Table C2
Appendix D
Table D1
Table D2
Appendix E
Appendix F
Appendix G
Appendix H
Summary of the Incidence of Neoplasms in Mice Fed Diets Containing Di(2-ethylhexyl)adipate
Summary of the Incidence of Neoplasms in Male Mice Fed Diets Containing Di(2-ethylhexyl)adipate
Summary of the Incidence of Neoplasms in Female Mice Fed Diets Containing Di(2-ethylhexyl)adipate
Summary of the Incidence of Nonneoplastic Lesions in Rats Fed Diets Containing Di(2-ethylhexyl)adipate
Summary of the Incidence of Nonneoplastic Lesions in Male Rats Fed Diets Containing Di(2-ethylhexyl)adipate
Summary of the Incidence of Nonneoplastic Lesions in Female Rats Fed Diets Containing Di(2-ethylhexyl)adipate
Summary of the Incidence of Nonneoplastic Lesions in Mice Fed Diets Containing Di(2-ethylhexyl)adipate
Summary of the Incidence of Nonneoplastic Lesions in Male Mice Fed Diets Containing Di(2-ethylhexyl)adipate
Summary of the Incidence of Nonneoplastic Lesions in Female Mice Fed Diets Containing Di(2-ethylhexyl)adipate
Analysis of Di(2-ethylhexyl)adipate (Lot No. 0-62-494) Midwest Research Ins titute
Analysis of Di(2-ethylhexyl)adipate (Lot No. GC-2-27-76) Midwest Research Institute
Stability Analysis of Di(2-ethylhexyl)adipate in Formulated Diets
Analysis of Formulated Diets for Concentrations of Di(2-ethylhexyl)adipate
67
69
73
77
79
85
89
91
95
99
107
115
119
x
TABLES
Table 1
Table 2
Table 3
Table 4
Table 5
Table 6
Table 7
Table 8
Table 9
Table 10
Table 11
Dosage and Survival of Rats and Mice Administered a Single Dose of Di(2-ethylhexyl)adipate by Gavage
Dosage, Survival, and Mean Body Weights of Rats Fed Diets Containing Di(2-ethylhexyl)adipate for 14 Days
Dosage, Survival, and Mean Body Weights of Mice Fed Diets Containing Di(2-ethylhexyl)adipate for 14 Days
Dosage, Survival, and Mean Body Weights of Rats Fed Diets Containing Di(2-ethylhexyl)adipate for 13 Weeks
Dosage, Survival, and Mean Body Weights of Mice Fed Diets Containing Di(2-ethylhexyl)adipate for 13 Weeks
Experimental Design of Chronic Feeding Studies with Di(2-ethylhexyl)adipate in Rats and Mice
Analyses of the Incidence of Primary Tumors in Male Rats Fed Diets Containing Di(2-ethylhexyl)adipate
Analyses of the Incidence of Primary Tumors in Female Rats Fed Diets Containing Di(2-ethylhexyl)adipate
Hepatocellular Neoplasms and Sites of Metastases in Mice Fed Diets Containing Di(2-ethylhexyl)adipate
Analyses of the Incidence of Primary Tumors in Male Mice Fed Diets Containing Di(2-ethylhexyl)adipate
Analyses of the Incidence of Primary Tumors in Female Mice Fed Diets Containing Di(2-ethylhexyl)adipate
10
11
12
22
28
36
39
42
xi
FIGURES
Figure 1 Growth Curve for Rats Fed DietsDi(2-ethylhexyl)adipate
Containing 18
Figure 2 Survival Curves for Rats Fed Diets Containing Di(2-ethylhexyl)adipate 19
Figure 3 Growth Curves for Mice Fed DietsDi(2-ethylhexyl)adipate
Containing 34
Figure 4 Survival Curves for Mice Fed Diets Containing Di(2-ethylhexyl)adipate 35
Figure 5 Infrared Absorption Spectrum of Di(2-ethylhexyl)adipate (Lot No. 0-62-494) 104
Figure 6 Nuclear Magnetic Resonance Spectrum of Di(2-ethylhexyl)adipate (Lot No. 0-62-494) 105
Figure 7 Infrared Absorption Spectrum of Di(2-ethylhexyl)adipate (Lot No. GC-2-27-76).... 112
Figure 8 Nuclear Magnetic Resonance Spectrum of Di(2-ethylhexyl)adipate (Lot No. GC-2-27-76) 114
xil
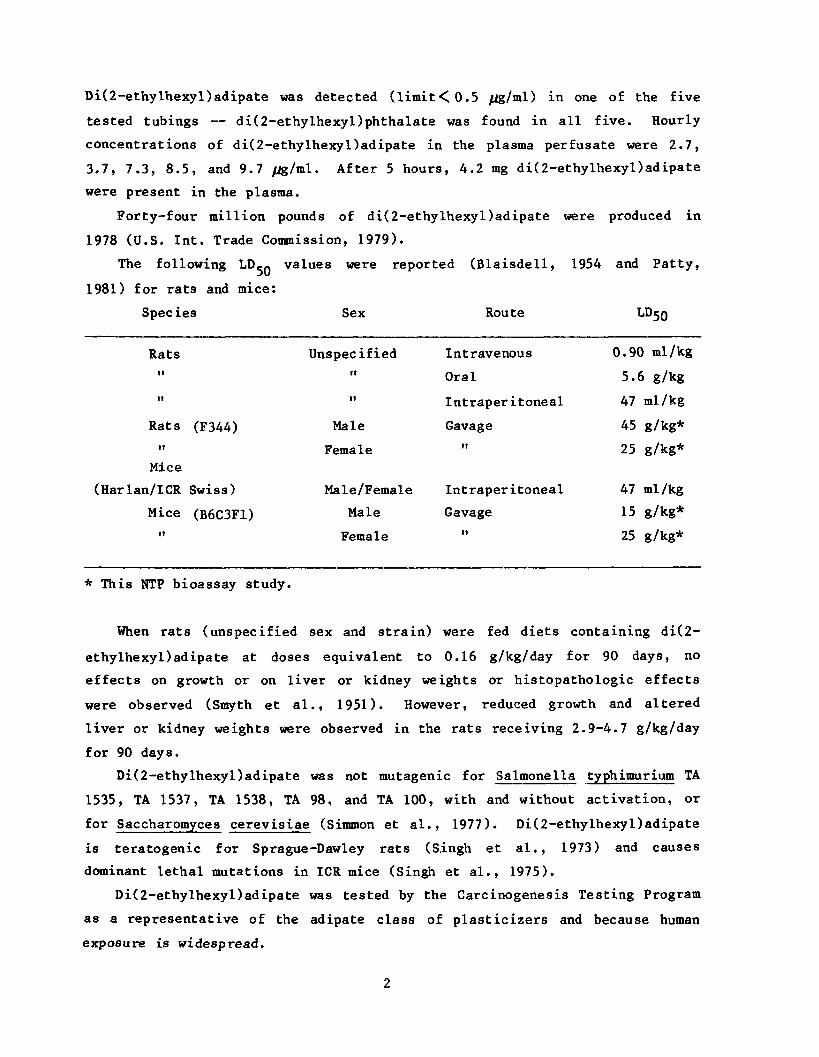
Di(2-ethylhexyl)adipate was detected (limit<0.5 jig/ml) in one of the five
tested tubings — di(2-ethylhexyl)phthalate was found in all five. Hourly
concentrations of di(2-ethylhexyl)adipate in the plasma perfusate were 2.7,
3.7, 7.3, 8.5, and 9.7 fjg/ml. After 5 hours, 4.2 mg di(2-ethylhexyl)adipate
were present in the plasma.
Forty-four million pounds of di(2-ethylhexyl)adipate were produced in
1978 (U.S. Int. Trade Commission, 1979).
The following LD-0 values were reported (Blaisdell, 1954 and Patty,
1981) for rats and mice:
Species Sex Route LD50
Rats Unspecified Intravenous 0.90 ml /kg ii it Oral 5.6 g/kg ii ii Intraperitoneal 47 ml /kg
Rats (F344) Male Gavage 45 g/kg* ii Female ii 25 g/kg*
Mice
(Harlan/ICR Swiss) Male/Female Intraperitoneal 47 ml /kg
Mice (B6C3F1) Male Gavage 15 g/kg* ii Female ii 25 g/kg*
* This NTP bioassay study.
When rats (unspecified sex and strain) were fed diets containing di(2
ethylhexyDadipate at doses equivalent to 0.16 g/kg/day for 90 days, no
effects on growth or on liver or kidney weights or histopathologic effects
were observed (Smyth et al., 1951). However, reduced growth and altered
liver or kidney weights were observed in the rats receiving 2.9-4.7 g/kg/day
for 90 days.
Di(2-ethylhexyl)adipate was not mutagenic for Salmonella typhimurium TA
1535, TA 1537, TA 1538, TA 98, and TA 100, with and without activation, or
for Saccharomyces cerevisiae (Simmon et al., 1977). Di(2-ethylhexyl)adipate
is teratogenic for Sprague-Dawley rats (Singh et al., 1973) and causes
dominant lethal mutations in ICR mice (Singh et al., 1975).
Di(2-ethylhexyl)adipate was tested by the Carcinogenesis Testing Program
as a representative of the adipate class of plasticizers and because human
exposure is widespread.
II. MATERIALS AND METHODS
A. Chemical
Di(2-ethylhexyl)adipate (CAS No. 103-23-1), a clear colorless liquid, was
obtained from W. R. Grace Co. (Fords, NJ) in two batches: Lot. No. GC-2-27
76 was used for the subchronic studies and for the first 57 weeks of the
chronic studies; and Lot No. 0-62-494 was used for the final 46 weeks of the
chronic studies. Identity and purity analyses of di(2-ethylhexyl)adipate
(elemental analysis, boiling point, thin-layer and vapor-phase chromato
graphy; and spectral analyses including infrared, ultraviolet, and nuclear
magnetic resonance) performed at Midwest Research Institute confirmed the
identity of di(2-ethylhexyl)adipate (Appendixes E and F).
Results of thin-layer chromatography indicated only one component for
both Lot No. GC-2-27-76 and Lot No. 0-62-494. Results of vapor-phase chroma
tography of Lot No. GC-2-27-76 indicated seven impurities with a 1.9% total
area relative to the major peak. Results of vapor-phase chromatography of
Lot No. 0-62-494 by one system indicated two impurities which totaled 0.11%
of the major peak area. Results of vapor-phase chroma tography of Lot No.
0-62-494 by a second system indicated five impurities with areas totaling
0.27% of the major peak area. Chroma tography systems are described in
Appendixes E and F.
Ester titration indicated a purity of 100.5% for Lot No. 0-62-494 and
101.4% for Lot No. GC-2-27-76. Di(2-ethylhexyl)adipate was stored at 4°C
in its original container.
B. Dietary Preparation
Test diets were prepared by mixing the chemical with an aliquot of pow
dered Wayne® Lab Blox animal feed (Allied Mills, Chicago, IL), placing the
mixture in a Patterson-Kelly twin-shell intensifier bar V-blender with the
remainder of the feed, and mixing for 10 minutes. Test diets were sealed in
labelled plastic bags and stored at 4°C for no longer than 14 days.
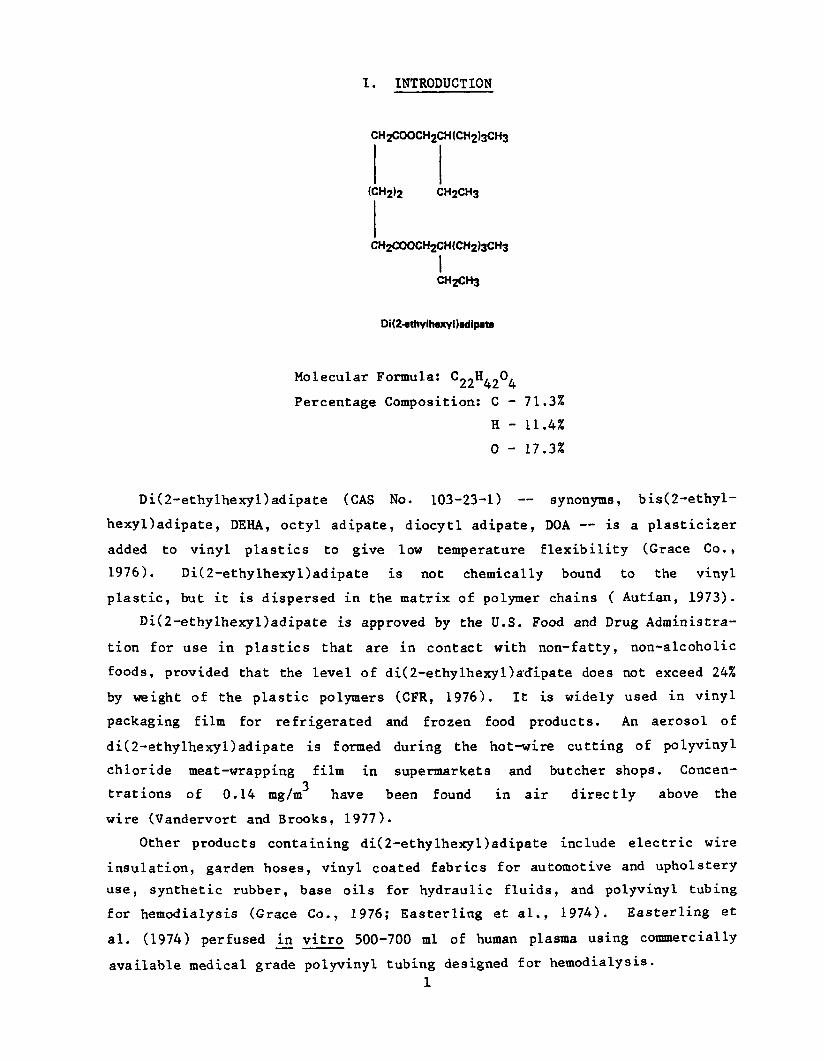
I. INTRODUCTION
CH2COOCH2CH(CH2)3CH3
(CH2)2 CH2CH3
CH2COOCH2CH(CH2)3CH3
I CH2CHs
Di(2-ethylhexYl)adipate
Molecular Formula: ^22^^2^U
Percentage Composition: C - 71.3%
H - 11.4%
0 - 17.3%
Di(2-ethylhexyl)adipate (CAS No. 103-23-1) — synonyms, bis(2-ethyl
hexyDadipate, DEHA, octyl adipate, diocytl adipate, DOA — is a plasticizer
added to vinyl plastics to give low temperature flexibility (Grace Co.,
1976). Di(2-ethylhexyl)adipate is not chemically bound to the vinyl
plastic, but it is dispersed in the matrix of polymer chains ( Autian, 1973).
Di(2-ethylhexyl)adipate is approved by the U.S. Food and Drug Administra
tion for use in plastics that are in contact with non-fatty, non-alcoholic
foods, provided that the level of di(2-ethylhexyl)adipate does not exceed 24%
by weight of the plastic polymers (CFR, 1976). It is widely used in vinyl
packaging film for refrigerated and frozen food products. An aerosol of
di(2-ethylhexyl)adipate is formed during the hot-wire cutting of polyvinyl
chloride meat-wrapping film in supermarkets and butcher shops. Concen3
trations of 0.14 mg/m have been found in air directly above the
wire (Vandervort and Brooks, 1977).
Other products containing di(2-ethylhexyl)adipate include electric wire
insulation, garden hoses, vinyl coated fabrics for automotive and upholstery
use, synthetic rubber, base oils for hydraulic fluids, and polyvinyl tubing
for hemodialysis (Grace Co., 1976; Easterling et al., 1974). Easterling et
al. (1974) perfused in vitro 500-700 ml of human plasma using commercially
available medical grade polyvinyl tubing designed for hemodialysis.
The stability of di(2-ethylhexyl)adipate in feed was determined at Mid
west Research Institute by assaying sample diet mixtures containing 100,000
ppm di(2-ethylhexyl)adipate that had been stored at -20°, 5°, 25°, or
45 C for 2 weeks. The amounts of the test chemical found to be present by
vapor-phase chromatography (Appendix G) indicate that the compound was stable
in feed for 2 weeks at temperatures as high as 45 C.
The amounts of di(2-ethylhexyl)adipate in selected batches of feed were
measured by vapor-phase chromatography of 50-ml methanol extracts of 2-g sam
ples. At each dietary concentration, the mean of the analytical concentra
tion was usually within +^10% of the theoretical (Appendix H).
C. Animals
Three-week old F344 rats and 4-week old B6C3F1 mice obtained from the NCI
Frederick Cancer Research Center, Frederick, Maryland, were observed for 2
weeks, examined for the absence of parasites or other diseases, and then
assigned to control or dosed groups so that average cage weights were
approximately equal for all animals of the same sex and species.
D. Animal Maintenance
Rats and mice were each housed five per cage in solid bottom suspended
polycarbonate cages (Lab Products, Inc., Garfield, NJ) equipped with dis®
posable nonwoven fiber filter sheets (Lab Products). Aspen-bed hardwood chips
(American Excelsior, Baltimore, MD) were used as bedding. Clean bedding and
cages were provided twice weekly, and cage racks were changed every 2 weeks.
Water, available via an Edstrom automatic watering system (Waterford, ©
WI), and powdered Wayne Lab Blox diet in stainless-steel, gang-style hoppers
(Scientific Cages, Inc., Bryan, TX), were available ad libitum.
Temperature in the animal rooms was 18 -31 C and relative humidity
was 10%-88%. Incoming air was filtered through Tri-Dek 15/40 denier Dacron
filters, with 10 air changes per hour. Fluorescent lighting was provided 12
hours per day.
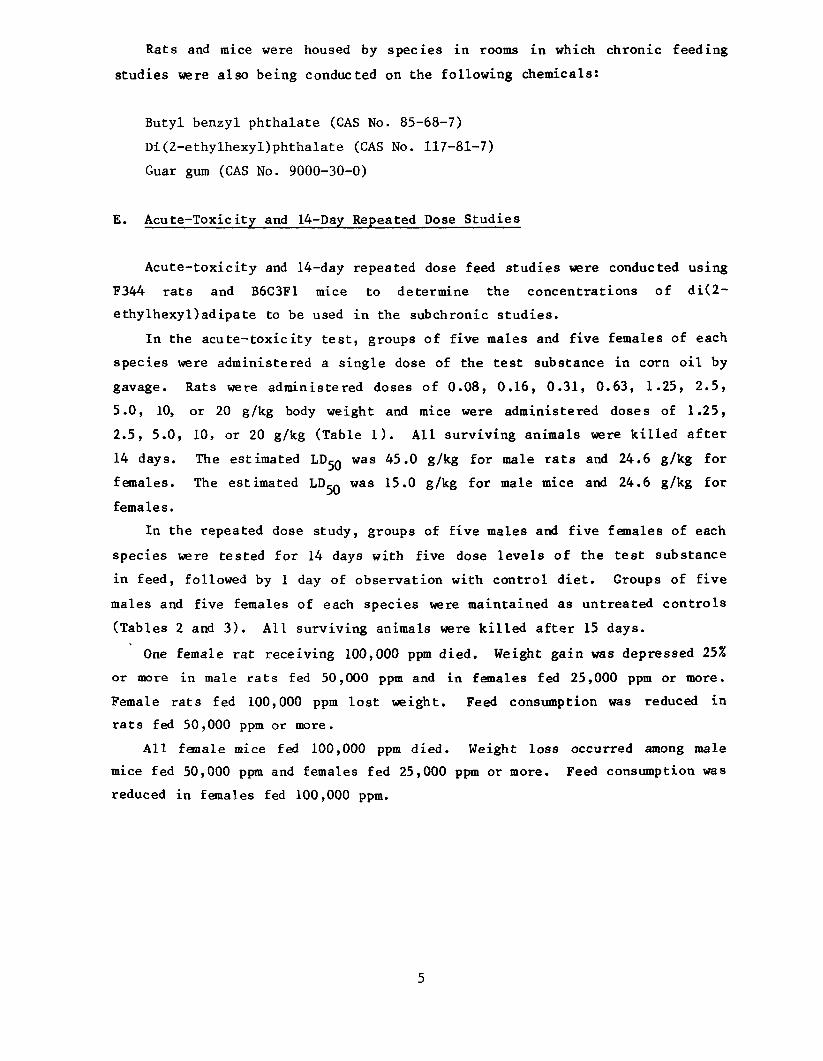
Rats and mice were housed by species in rooms in which chronic feeding
studies were also being conducted on the following chemicals:
Butyl benzyl phthalate (CAS No. 85-68-7)
Di(2-ethylhexyl)phthalate (CAS No. 117-81-7)
Guar gum (CAS No. 9000-30-0)
E. Acute-Toxicity and 14-Day Repeated Dose Studies
Acute-toxicity and 14-day repeated dose feed studies were conducted using
F344 rats and B6C3F1 mice to determine the concentrations of di(2
ethylhexyDadipate to be used in the subchronic studies.
In the acute-toxicity test, groups of five males and five females of each
species were administered a single dose of the test substance in corn oil by
gavage. Rats were administered doses of 0.08, 0.16, 0.31, 0.63, 1.25, 2.5,
5.0, 10, or 20 g/kg body weight and mice were administered doses of 1.25,
2.5, 5.0, 10, or 20 g/kg (Table 1). All surviving animals were killed after
14 days. The estimated LDcn was 45.0 g/kg for male rats and 24.6 g/kg for
females. The estimated L.D,-0 was 15.0 g/kg for male mice and 24.6 g/kg for
females.
In the repeated dose study, groups of five males and five females of each
species were tested for 14 days with five dose levels of the test substance
in feed, followed by 1 day of observation with control diet. Groups of five
males and five females of each species were maintained as untreated controls
(Tables 2 and 3). All surviving animals were killed after 15 days.
One female rat receiving 100,000 ppm died. Weight gain was depressed 25%
or more in male rats fed 50,000 ppm and in females fed 25,000 ppm or more.
Female rats fed 100,000 ppm lost weight. Feed consumption was reduced in
rats fed 50,000 ppm or more.
All female mice fed 100,000 ppm died. Weight loss occurred among male
mice fed 50,000 ppm and females fed 25,000 ppm or more. Feed consumption was
reduced in females fed 100,000 ppm.

Table 1. Dosage and Survival of Rats and Mice Administered a Single Dose of Di(2-ethylhexyl)adipate by Gavage
Survival (a) Dose Male Female (g/kg)
Rats
0.08 5/5 5/5
0.16 5/5 5/5
0.31 5/5 5/5
0.63 5/5 5/5
1.25 5/5 5/5
1.25 (b) 5/5 5/5
2.50 (b) 5/5 5/5
5.00 (b) 5/5 5/5
10.00 (b) 3/5 5/5
20.00 (b) 4/5 4/5
Mice
1.25 4/5 (c) 5/5
2.5 5/5 5/5
5.0 5/5 5/5
10.0 3/5 5/5
20.0 2/5 4/5
(a) Number surviving /number per group (b) The single dose acute toxicity stv idy at these hi gher doses was
initiated 1 week after the single dose acute toxicity study at lower doses,
(c) Accidental death
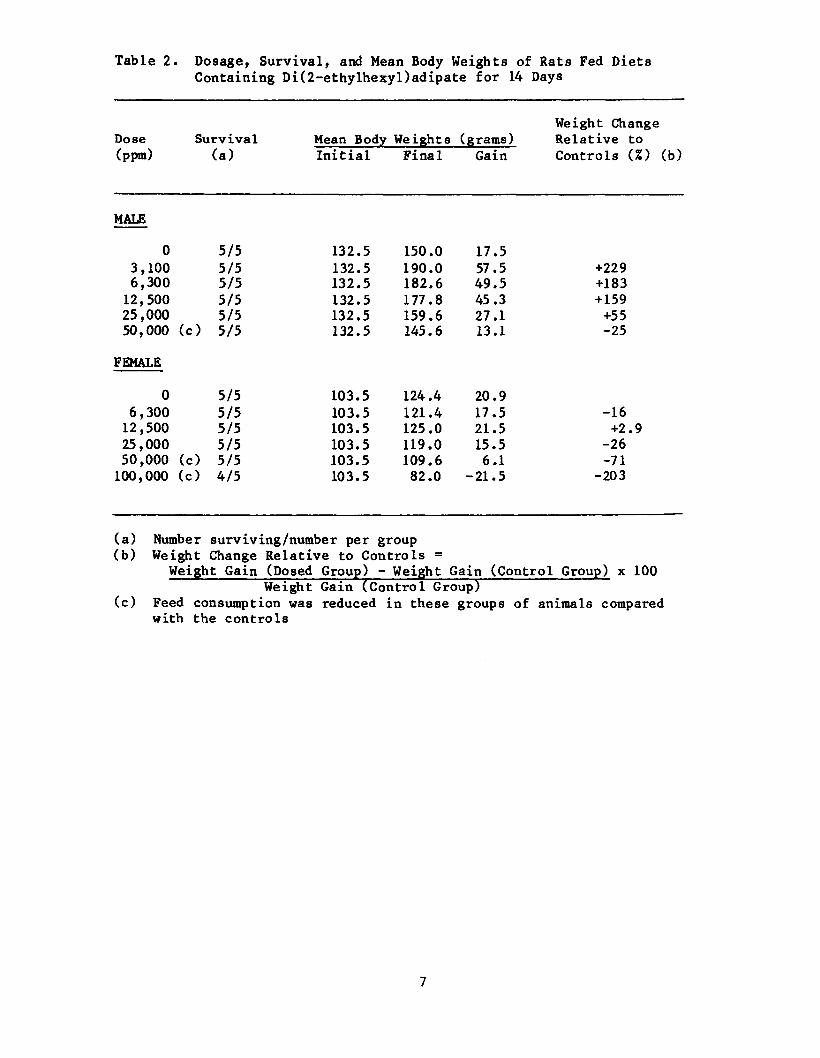
Table 2. Dosage, Survival, and Mean Body Weights of Rats Fed Diets Containing Di(2-ethylhexyl)adipate for 14 Days
Weight Change Dose Survival Mean Body Weights (grams) Relative to (ppm) (a) Initial Final Gain Controls (%) (b)
MALE
0 5/5 132, 150.0 17, 3,100 5/5 132. 190.0 57, +229 6,300 5/5 132. 182.6 49, +183 12,500 5/5 132. 177.8 45, +159 25,000 5/5 132. 159.6 27, +55 50,000 (c) 5/5 132.5 145.6 13.1 -25
FEMALE
0 5/5 103.5 124.4 20 6,300 5/5 103.5 121.4 17 -16 12,500 5/5 103.5 125.0 21 +2.9 25,000 5/5 103.5 119.0 15 -26 50,000 (c) 5/5 103.5 109.6 6.1 -71 100,000 (c) 4/5 103.5 82.0 -21.5 -203
(a) Number surviving/number per group (b) Weight Change Relative to Controls =
Weight Gain (Dosed Group) - Weight Gain (Control Group) x 100 Weight Gain (Control Group)
(c) Feed consumption was reduced in these groups of animals compared with the controls
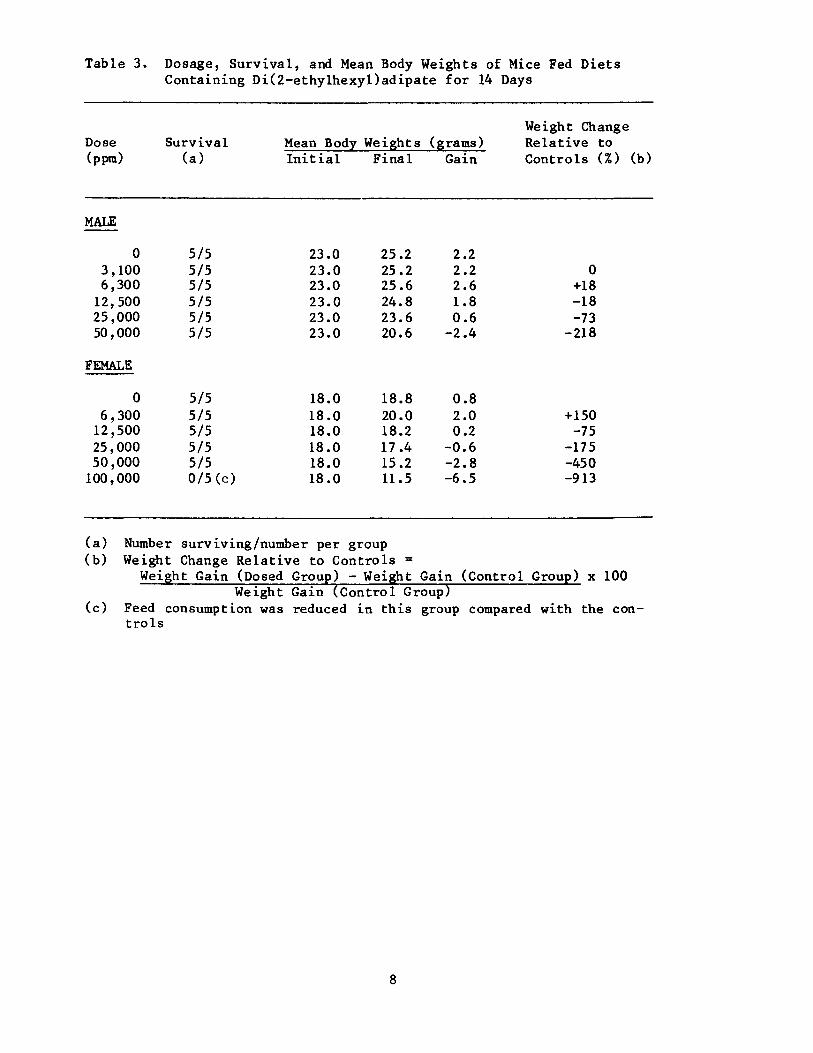
Table 3. Dosage, Survival, and Mean Body Weights of Mice Fed Diets Containing Di(2-ethylhexyl)adipate for 14 Days
Weight Change Dose Survival Mean Body Weights (grams) Relative to (ppm) (a) Initial Final Gain Controls (%) (b)
MALE
0 5/5 23.0 25.2 2.2 3,100 5/5 23.0 25.2 2.2 0 6,300 5/5 23.0 25.6 2.6 +18 12,500 5/5 23.0 24.8 1.8 -18 25,000 5/5 23.0 23.6 0.6 -73 50,000 5/5 23.0 20.6 -2.4 -218
FEMALE
0 5/5 18.0 18.8 0.8 6,300 5/5 18.0 20.0 2.0 + 150 12,500 5/5 18.0 18.2 0.2 -75 25,000 5/5 18.0 17.4 -0.6 -175 50,000 5/5 18.0 15.2 -2.8 -450 100,000 0/5(c) 18.0 11.5 -6.5 -913
(a) Number surviving/number per group (b) Weight Change Relative to Controls =
Weight Gain (Dosed Group) - Weight Gain (Control Group) x 100 Weight Gain (Control Group)
(c) Feed consumption was reduced in this group compared with the controls
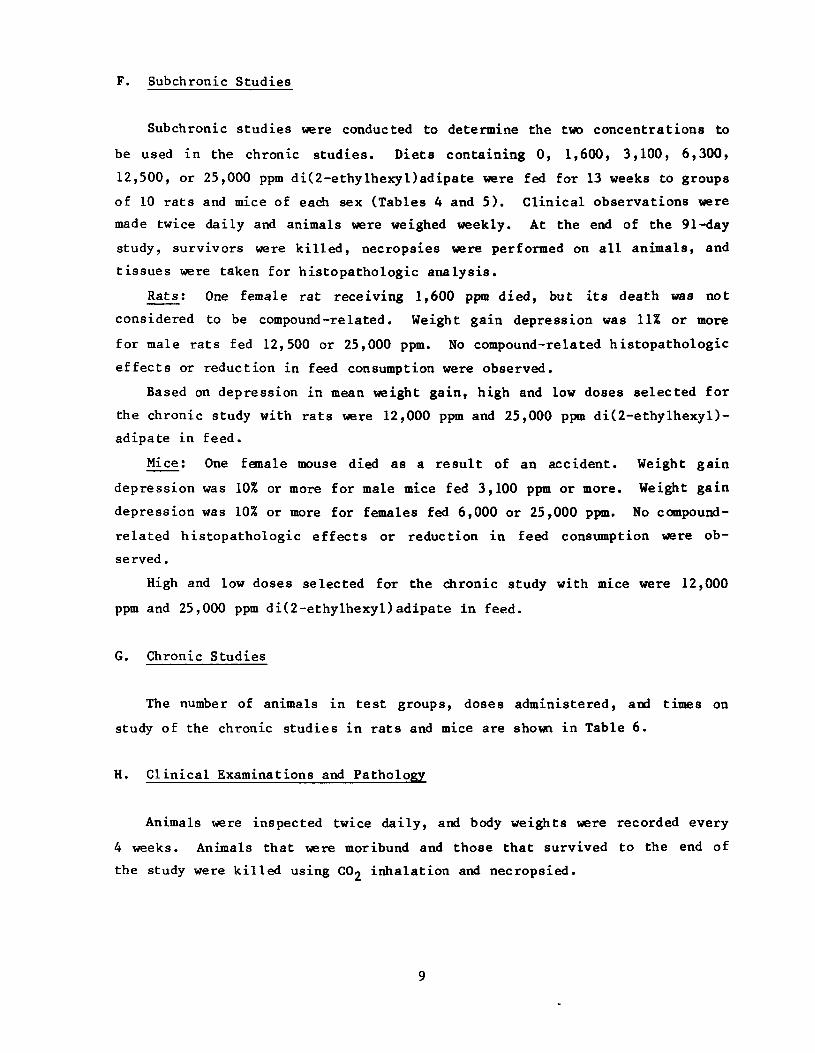
F. Subchronic Studies
Subchronic studies were conducted to determine the two concentrations to
be used in the chronic studies. Diets containing 0, 1,600, 3,100, 6,300,
12,500, or 25,000 ppm di(2-ethylhexyl)adipate were fed for 13 weeks to groups
of 10 rats and mice of each sex (Tables 4 and 5). Clinical observations were
made twice daily and animals were weighed weekly. At the end of the 91-day
study, survivors were killed, necropsies were performed on all animals, and
tissues were taken for histopathologic analysis.
Rats; One female rat receiving 1,600 ppm died, but its death was not
considered to be compound-related. Weight gain depression was 11% or more
for male rats fed 12,500 or 25,000 ppm. No compound-related histopathologic
effects or reduction in feed consumption were observed.
Based on depression in mean weight gain, high and low doses selected for
the chronic study with rats were 12,000 ppm and 25,000 ppm di(2-ethylhexyl)
adipate in feed.
Mice; One female mouse died as a result of an accident. Weight gain
depression was 10% or more for male mice fed 3,100 ppm or more. Weight gain
depression was 10% or more for females fed 6,000 or 25,000 ppm. No compound-
related histopathologic effects or reduction in feed consumption were ob
served.
High and low doses selected for the chronic study with mice were 12,000
ppm and 25,000 ppm di(2-ethylhexyl)adipate in feed.
G. Chronic Studies
The number of animals in test groups, doses administered, and times on
study of the chronic studies in rats and mice are shown in Table 6.
H. Clinical Examinations and Pathology
Animals were inspected twice daily, and body weights were recorded every
4 weeks. Animals that were moribund and those that survived to the end of
the study were killed using CC inhalation and necropsied.
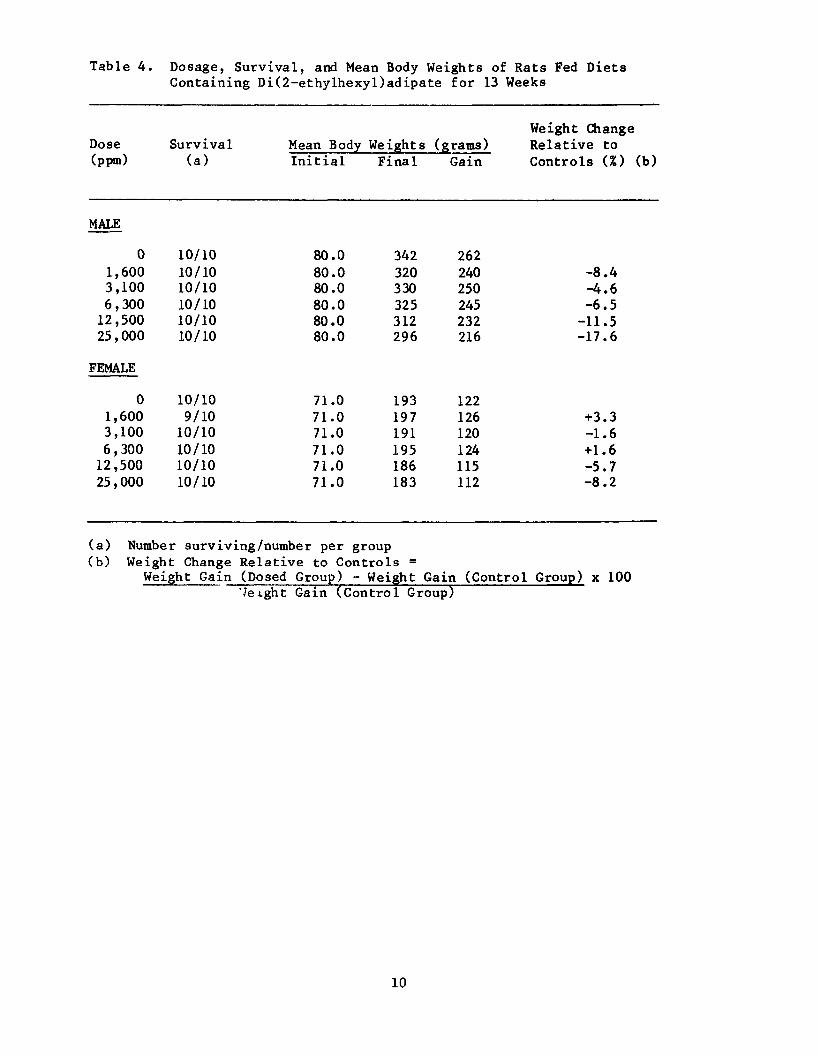
Table 4. Dosage, Survival, and Mean Body Weights of Rats Fed Diets Containing Di(2-ethylhexyl)adipate for 13 Weeks
Weight Change Dose Survival Mean Body Weights (grams) Relative to (ppm) (a) Initial Final Gain Controls (%) (b)
MALE
0 10/10 80.0 342 262 1,600 10/10 80.0 320 240 -8.4 3,100 10/10 80.0 330 250 -4.6 6,300 10/10 80.0 325 245 -6.5
12,500 10/10 80.0 312 232 -11.5 25,000 10/10 80.0 296 216 -17.6
FEMALE
0 10/10 71.0 193 122 1,600 9/10 71.0 197 126 +3.3 3,100 10/10 71.0 191 120 -1.6 6,300 10/10 71.0 195 124 +1.6
12,500 10/10 71.0 186 115 -5.7 25,000 10/10 71.0 183 112 -8.2
(a) Number surviving/number per group (b) Weight Change Relative to Controls =
Weight Gain (Dosed Group) - Weight Gain (Control Group) x 100 "Jeight Gain (Control Group)
10
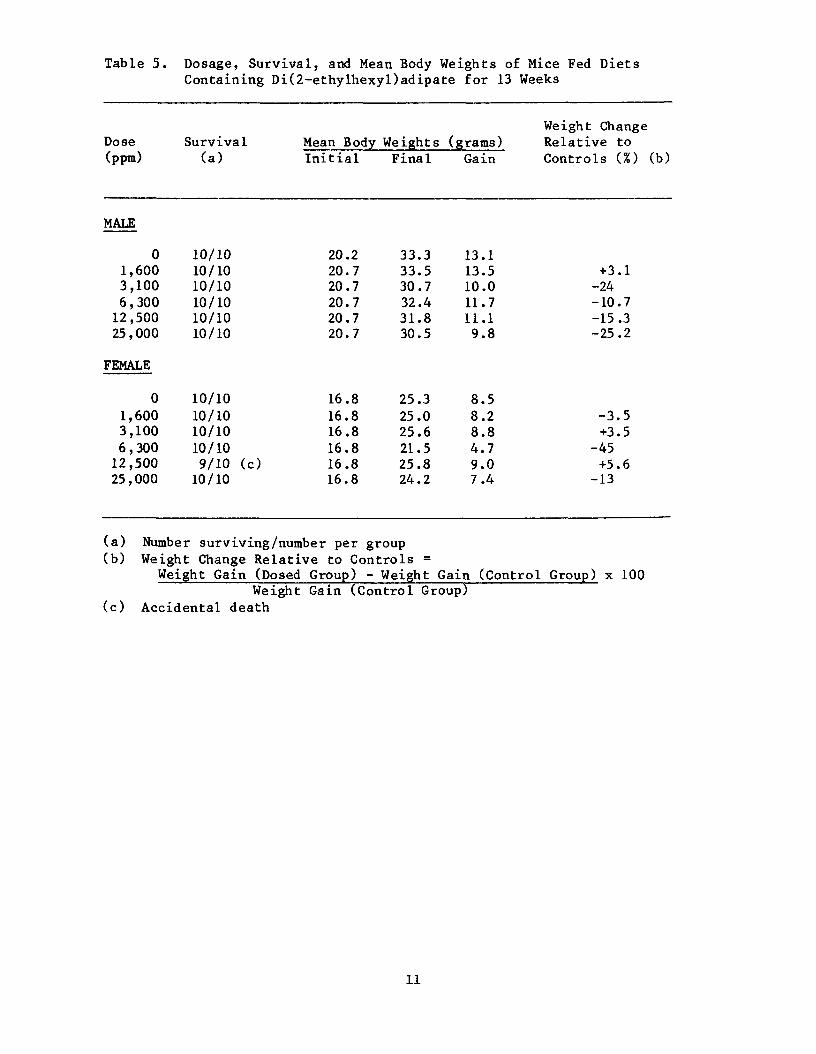
Table 5. Dosage, Survival, and Mean Body Weights of Mice Fed Diets Containing Di(2-ethylhexyl)adipate for 13 Weeks
Weight Change Dose Survival Mean Body Weights (grams) Relative to (ppra) (a) Initial Final Gain Controls (%) (b)
MALE
0 10/10 20 33.3 13.1 1,600 10/10 20, 33.5 13.5 +3.1 3,100 10/10 20 30.7 10.0 -24 6,300 10/10 20, 32.4 11.7 -10.7
12,500 10/10 20 31.8 11.1 -15.3 25,000 10/10 20.7 30.5 9.8 -25.2
FEMALE
0 10/10 16.8 25.3 8.5 1,600 10/10 16.8 25.0 8.2 -3.5 3,100 10/10 16.8 25, 8.8 +3.5 6,300 10/10 16.8 21. 4.7 -45
12,500 9/10 (c) 16.8 25.8 9.0 +5.6 25,000 10/10 16.8 24.2 7.4 -13
(a) Number surviving/number per group (b) Weight Change Relative to Controls =
Weight Gain (Dosed Group) - Weight Gain (Control Group) x 100 Weight Gain (Control Group)
(c) Accidental death
11

Table 6. Experimental Design of Chronic Feeding Studies with Di(2-ethylhexyl)adipate in Rats and Mice
Test Group
Male Rats
Control
Low-Dose
High-Dose
Female Rats
Control
Low-Dose
High -Dose
Male Mice
Control
Low-Dose
High-Dose
Female Mice
Control
Low-Dose
High-Dose
Initial No. of Animals
50
50
50
50
50
50
50
50
50
50
50
50
Di(2-ethylhexyl) adipate
(ppm)
0
12,000
25,000
0
12,000
25,000
0
12,000
25,000
0
12,000
25,000
Time Dosed
(weeks)
0
103
103
0
103
103
0
103
103
0
103
103
on Study Observed
(weeks)
106-107
3
1-2
107
1-3
2
106
2-3
1-2
106
2-3
2
12
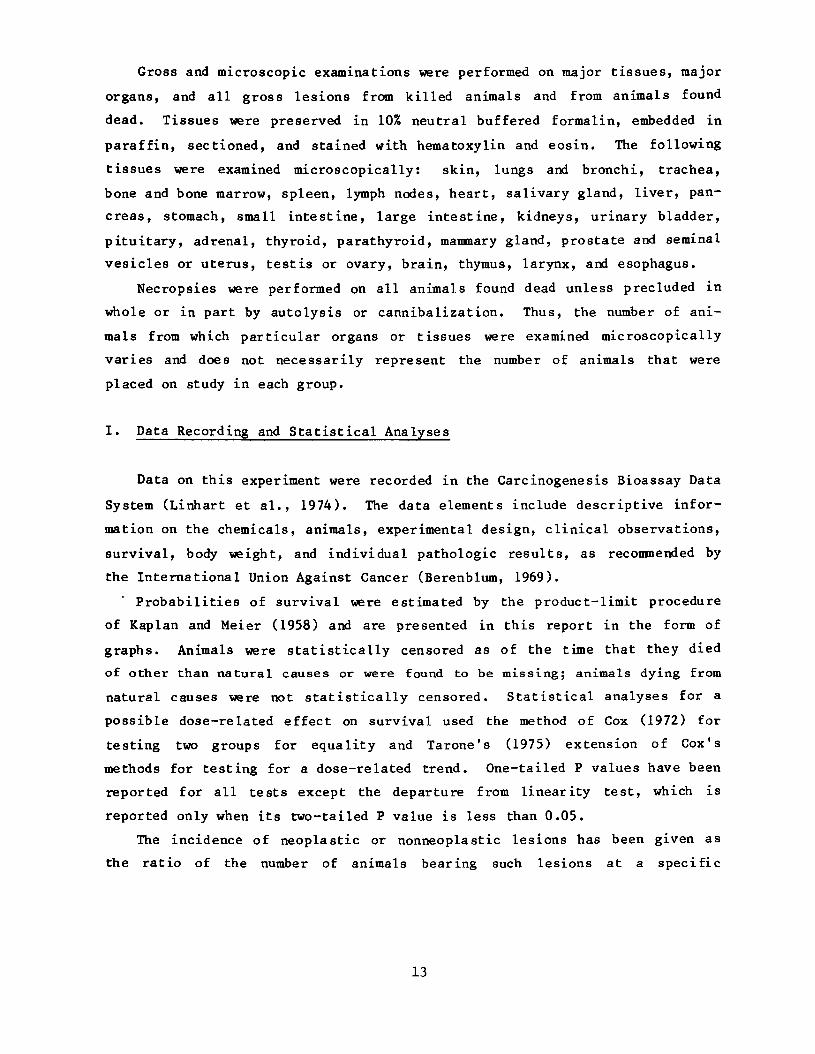
Gross and microscopic examinations were performed on major tissues, major
organs, and all gross lesions from killed animals and from animals found
dead. Tissues were preserved in 10% neutral buffered formalin, embedded in
paraffin, sectioned, and stained with hematoxylin and eosin. The following
tissues were examined microscopically: skin, lungs and bronchi, trachea,
bone and bone marrow, spleen, lymph nodes, heart, salivary gland, liver, pan
creas, stomach, small intestine, large intestine, kidneys, urinary bladder,
pituitary, adrenal, thyroid, parathyroid, mammary gland, prostate and seminal
vesicles or uterus, testis or ovary, brain, thymus, larynx, and esophagus.
Necropsies were performed on all animals found dead unless precluded in
whole or in part by autolysis or cannibalization. Thus, the number of ani
mals from which particular organs or tissues were examined microscopically
varies and does not necessarily represent the number of animals that were
placed on study in each group.
I. Data Recording and Statistical Analyses
Data on this experiment were recorded in the Careinogenesis Bioassay Data
System (Linhart et al., 1974). The data elements include descriptive infor
mation on the chemicals, animals, experimental design, clinical observations,
survival, body weight, and individual pathologic results, as recommended by
the International Union Against Cancer (Berenblum, 1969).
Probabilities of survival were estimated by the product-limit procedure
of Kaplan and Meier (1958) and are presented in this report in the form of
graphs. Animals were statistically censored as of the time that they died
of other than natural causes or were found to be missing; animals dying from
natural causes were not statistically censored. Statistical analyses for a
possible dose-related effect on survival used the method of Cox (1972) for
testing two groups for equality and Tarone's (1975) extension of Cox's
methods for testing for a dose-related trend. One-tailed P values have been
reported for all tests except the departure from linearity test, which is
reported only when its two-tailed P value is less than 0.05.
The incidence of neoplastic or nonneoplastic lesions has been given as
the ratio of the number of animals bearing such lesions at a specific
13
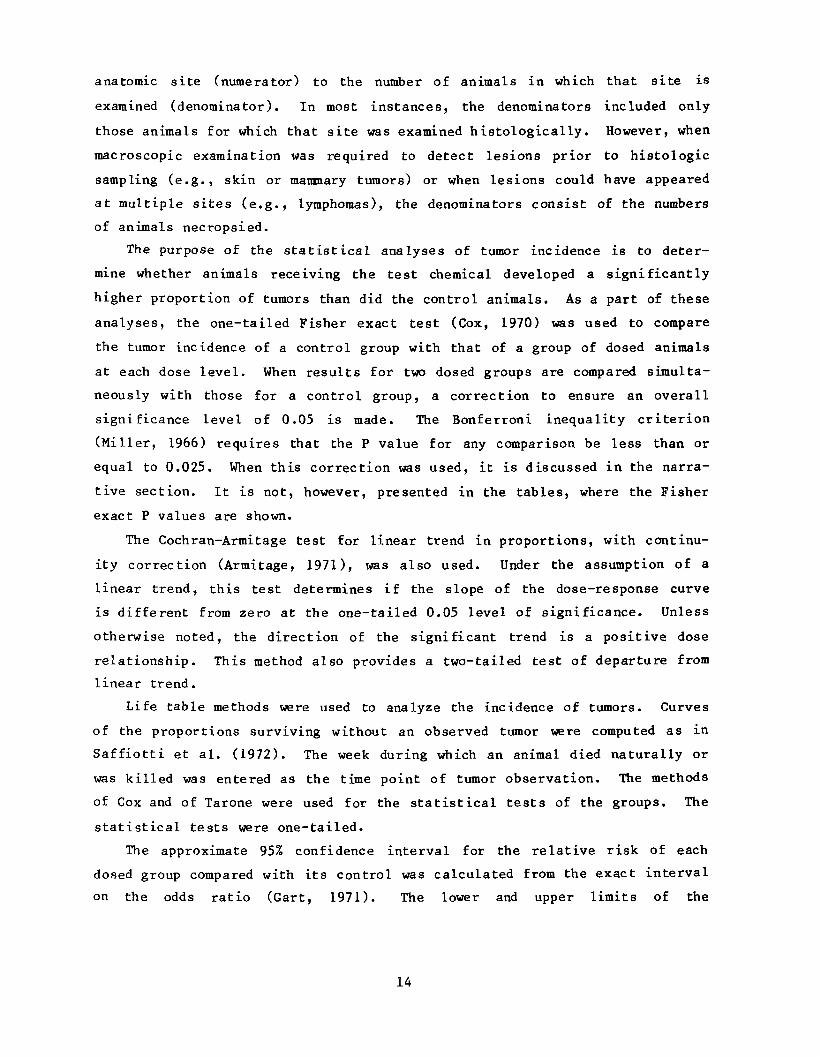
anatomic site (numerator) to the number of animals in which that site is
examined (denominator). In most instances, the denominators included only
those animals for which that site was examined histologically. However, when
macroscopic examination was required to detect lesions prior to histologic
sampling (e.g., skin or mammary tumors) or when lesions could have appeared
at multiple sites (e.g., lymphomas), the denominators consist of the numbers
of animals necropsied.
The purpose of the statistical analyses of tumor incidence is to deter
mine whether animals receiving the test chemical developed a significantly
higher proportion of tumors than did the control animals. As a part of these
analyses, the one-tailed Fisher exact test (Cox, 1970) was used to compare
the tumor incidence of a control group with that of a group of dosed animals
at each dose level. When results for two dosed groups are compared simulta
neously with those for a control group, a correction to ensure an overall
significance level of 0.05 is made. The Bonferroni inequality criterion
(Miller, 1966) requires that the P value for any comparison be less than or
equal to 0.025. When this correction was used, it is discussed in the narra
tive section. It is not, however, presented in the tables, where the Fisher
exact P values are shown.
The Cochran-Armitage test for linear trend in proportions, with continu
ity correction (Armitage, 1971), was also used. Under the assumption of a
linear trend, this test determines if the slope of the dose-response curve
is different from zero at the one-tailed 0.05 level of significance. Unless
otherwise noted, the direction of the significant trend is a positive dose
relationship. This method also provides a two-tailed test of departure from
linear trend.
Life table methods were used to analyze the incidence of tumors. Curves
of the proportions surviving without an observed tumor were computed as in
Saffiotti et al. (1972). The week during which an animal died naturally or
was killed was entered as the time point of tumor observation. The methods
of Cox and of Tarone were used for the statistical tests of the groups. The
statistical tests were one-tailed.
The approximate 95% confidence interval for the relative risk of each
dosed group compared with its control was calculated from the exact interval
on the odds ratio (Gart, 1971). The lower and upper limits of the
14
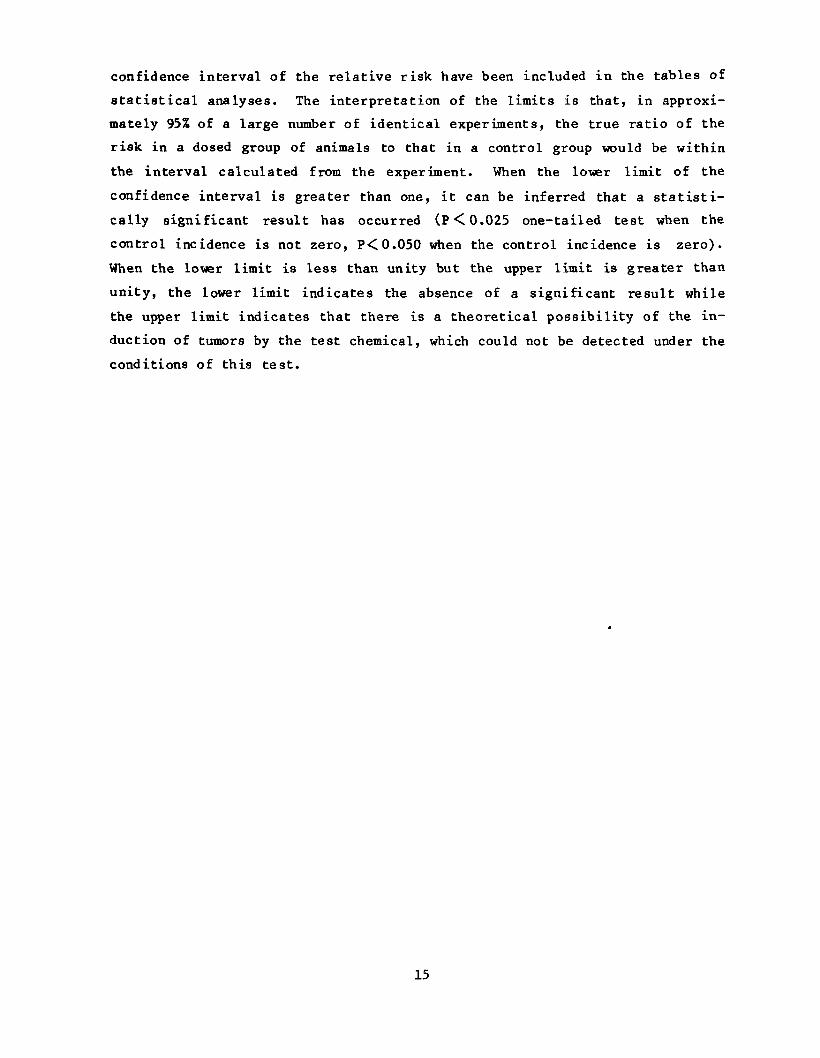
confidence interval of the relative risk have been included in the tables of
statistical analyses. The interpretation of the limits is that, in approxi
mately 95% of a large number of identical experiments, the true ratio of the
risk in a dosed group of animals to that in a control group would be within
the interval calculated from the experiment. When the lower limit of the
confidence interval is greater than one, it can be inferred that a statisti
cally significant result has occurred (P <C 0.025 one-tailed test when the
control incidence is not zero, P<0.050 when the control incidence is zero).
When the lower limit is less than unity but the upper limit is greater than
unity, the lower limit indicates the absence of a significant result while
the upper limit indicates that there is a theoretical possibility of the in
duction of tumors by the test chemical, which could not be detected under the
conditions of this test.
15

16

III. RESULTS - RATS
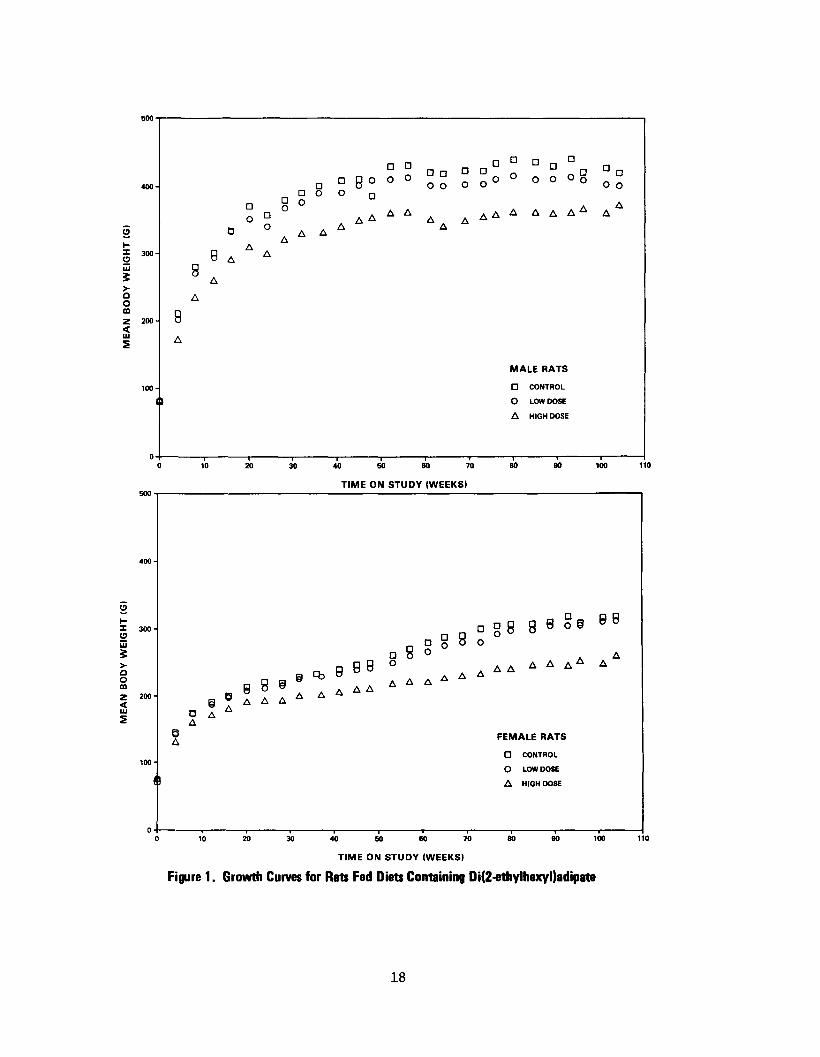
A. Body Weights and Clinical Signs (Rats)
Mean body weights of high-dose rats of either sex were lower than those
of the controls throughout the study (Figure 1). No other compound - related
clinical signs were observed.
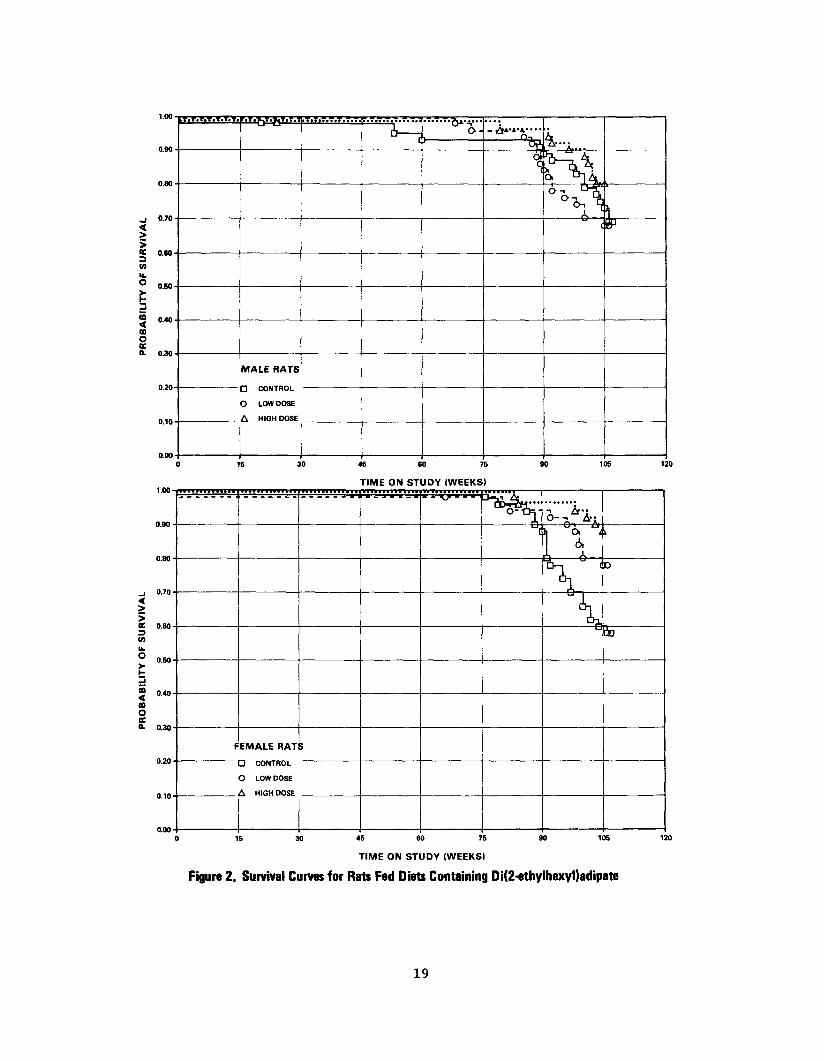
B. Survival (Rats)
Estimates of the probabilities of survival for male and female rats
administered di(2-ethylhexyl)adipate in feed at the doses of this bioassay,
and those of the controls, are shown by the Kaplan and Meier curves in Figure
2. Survival in the female control group declined relative to the dosed
groups after 80 weeks on study. The survival between the dosed groups in
females and among all three groups in males were comparable.
In male rats, 34/50 (68%) of the control and low-dose groups and 40/50
(80%) of the high-dose group lived to the end of the study at 105-107 weeks.
In females, 29/50 (58%) of the controls, 39/50 (78%) of the low-dose group,
and 44/50 (88%) of the high-dose group lived to the end of the study at 105
107 weeks.
C. Pathology (Rats)
Histopathologic findings on neoplasms in rats are summarized in Appendix
A, Tables Al and A2; findings on nonneoplastic lesions are summarized in
Appendix C, Tables Cl and C2.
A variety of neoplasms were seen in both control and dosed rats. Tumors
noted were those seen routinely in this strain of rat, and they occurred in
comparable numbers in control and dosed rats.
Several nonneoplastic lesions were seen in control and dosed rats. None
appeared to be related to chemical administration.
17
pr, D
§ D 8
D D D no o
A A
D ° o o
*
n a o p o o ° 0 0 ° :
A A A A A '
u D O O
ui S
Q O m z
ui 5
200 8 A
MALE RATS
D
O
A
CONTROL
LOW DOSE
HIGH DOSE
30 40 SO 60 70 80 90 110
TIME ON STUDY (WEEKS)
O
I- 88 X 300- 8 8 (9 ui S >- A A A AA AQO A A Am
A A A A A
e FEMALE RATS A O CONTROL
O LOW DOSE
A HIGH DOSE
60
TIME ON STUDY (WEEKS)
Figure 1. Growth Curves for Rats Fed Diets Containing Di(2-ethylhexyl)adipate
18
CO
o 050. j
£ 040< CO o E
0.20
0.10
~*"'\[ I
MALE RATS
D CONTROL
O LOW DOSE
A HIGH DOSE
45 60 75
TIME ON STUDY (WEEKS)
'VSj
£-;...
P^ t̂ WT
°o-.I^1 On 9 3)
c BP
*1 fif * • Q— ™* gy •
IV\ •L
D
Bo
0
<
s ;
SU
RV
IVA
L
u. 0
e s „„.
to oK
FEMALE RAT 5
0.20 " Q CONTROL
O LOW DOSE
0.10 A HIGH DOSE
nun.
TIME ON STUDY (WEEKS)
Figure 2. Survival Curves for Rats Fed Diets Containing Di(2-ethylhexyl)adipate
AB
ILIT
Y
o §
19

The results of histopathologic examination indicated that, under
conditions of this bioassay, di(2-ethylhexyl)adipate was not carcinogenic in
F344 rats.
D. Statistical Analysis of Results (Rats)
Tables 7 and 8 contain the statistical analysis of those primary tumors
that occurred in at least two animals of one group and at an incidence of at
least 5% in one or more than one group.
The incidence of interstitial tumors in the testes was dose-related
(P=0.010) and significantly higher (P=0.013) in the high-dose group of male
rats, but this type of lesion occurs at a very high incidence in aging F344
rats. Historical records of the Mason control male rats indicate that
incidences are usually over 80%. The test for differences in time to obser
vation of these tumors was not significant.
In female rats the Cochran-Armitage test was not significant for the in
cidences of adenomas in the pituitary gland, but a departure from linear
trend (P=0.037) was due to higher incidence in the low-dose group than in
the other two groups. The result of the Fisher exact test is not
significant when the low-dose group is compared with the control group.
When the incidence of animals with either adenomas or carcinomas is
considered, no significant results are obtained.
Pheochromocytomas in the adrenal glands of male rats occurred with a
negative trend (P=0.031) and the incidence in the high-dose group was
significantly lower than that in the controls. A negative trend (P=0.040)
is also indicated in the incidence of cortical adenomas in the adrenal of
female rats.
Fibroadenomas in the mammary gland occurred with a negative dose-related
trend (P=0.001), and the incidence in the low- and high-dose groups of
female rats was significantly lower (P=0.033 and P=0.002, respectively) than
that in the controls.
The statistical analysis indicates no significant increase in tumor
incidence that was associated with the administration of the chemical at any
site. In each of the 95% confidence intervals for relative risk shown in
the tables, except for the incidence of interstitial-cell tumors in the
testis of high-dose group males, the value of one or less than one is
20

included, suggesting the absence of significant positive results. It should
also be noted that each of the intervals, except for the incidence of
fibroadenomas in the mammary gland of high-dose group females, has an
upper limit greater than one, indicating the theoretical possibility of
tumor induction by di(2-ethylhexyl)adipate which could not be detected
under the conditions of this test.
21
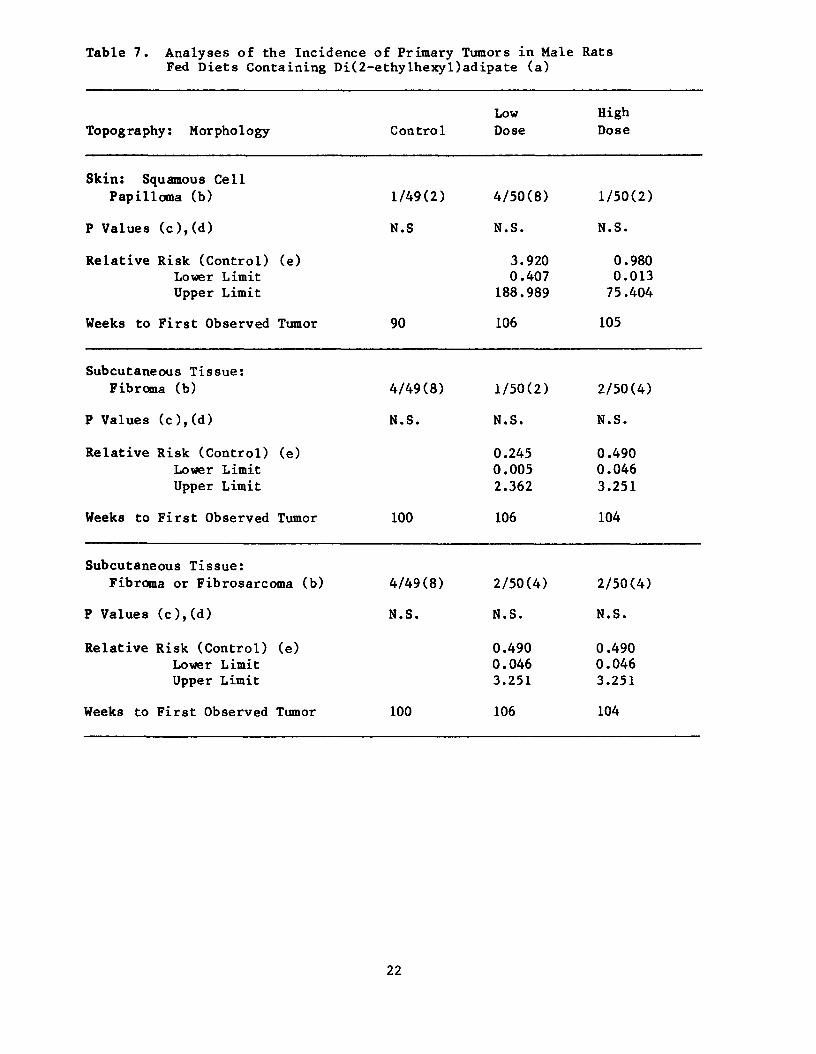
Table 7. Analyses of the Incidence of Primary Tumors in Male Rats Fed Diets Containing Di(2-ethylhexyl)adipate (a)
Topography: Morphology
Skin: Squamous Cell Papilloma (b)
P Values (c),(d)
Relative Risk (Control) (e) Lower Limit Upper Limit
Weeks to First Observed Tumor
Subcutaneous Tissue: Fibroma (b)
P Values (c),(d)
Relative Risk (Control) (e) Lower Limit Upper Limit
Weeks to First Observed Tumor
Subcutaneous Tissue: Fibroma or Fibrosarcoma (b)
P Values (c),(d)
Relative Risk (Control) (e) Lower Limit Upper Limit
Weeks to First Observed Tumor
Low High Control Dose Dose
1/49(2) 4/50(8) 1/50(2)
N.S N.S. N.S.
3.920 0.980 0.407 0.013
188.989 75.404
90 106 105
4/49(8) 1/50(2) 2/50(4)
N.S. N.S. N.S.
0.245 0.490 0.005 0.046 2.362 3.251
100 106 104
4/49(8) 2/50(4) 2/50(4)
N.S. N.S. N.S.
0.490 0.490 0.046 0.046 3.251 3.251
100 106 104
22
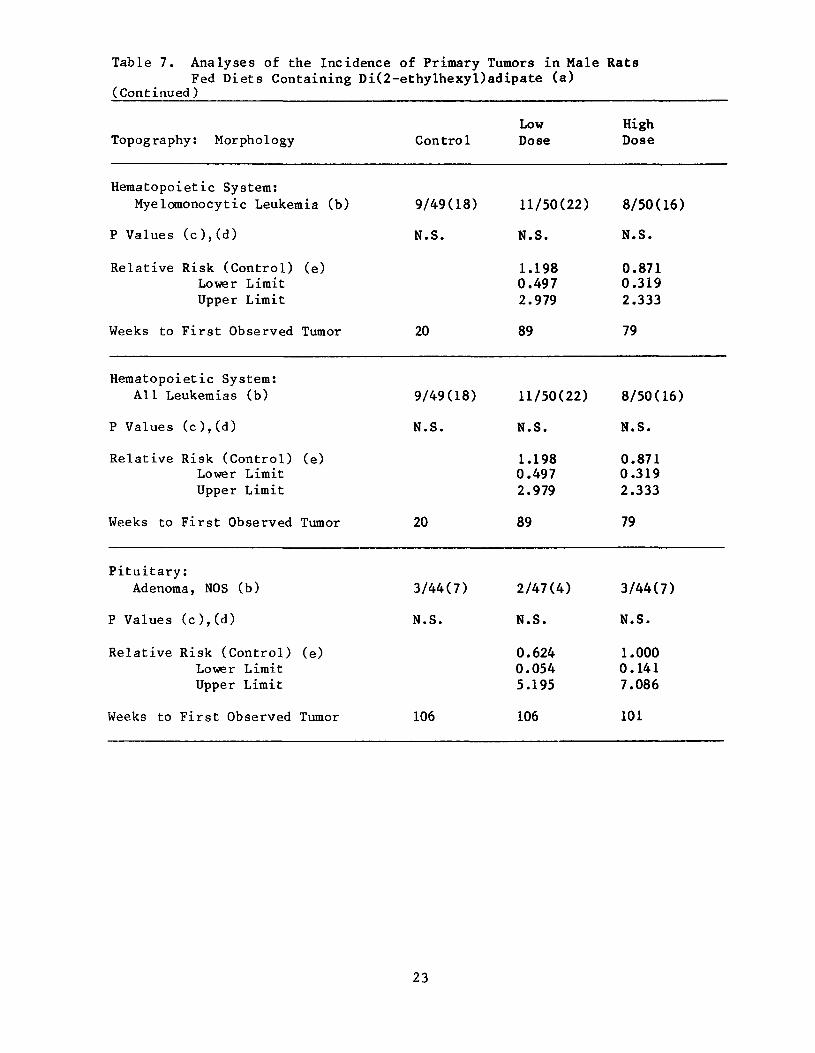
Table 7. Analyses of the Incidence of Primary Tumors in Male Rats Fed Diets Containing
(Continued)
Topography: Morphology
Hematopoietic System: Myelomonocytic Leukemia (b)
P Values ( c ) , ( d )
Relative Risk (Control) (e) Lower Limit Upper Limit
Weeks to First Observed Tumor
Hematopoietic System: All Leukemias (b)
P Values ( c ) , ( d )
Relative Risk (Control) (e) Lower Limit Upper Limit
Weeks to First Observed Tumor
Pituitary: Adenoma, NOS (b)
P Values ( c ) , ( d )
Relative Risk (Control) (e) Lower Limit Upper Limit
Weeks to First Observed Tumor
Di(2-ethylhexyl)adipate (a)
Low Control Dose
9/49(18) 11/50(22)
N.S. N.S.
1.198 0.497 2.979
20 89
9/49(18) 11/50(22)
N.S. N.S.
1.198 0.497 2.979
20 89
3/44(7) 2/47(4)
N.S. N.S.
0.624 0.054 5.195
106 106
High Dose
8/50(16)
N.S.
0.871 0.319 2.333
79
8/50(16)
N.S.
0.871 0.319 2.333
79
3/44(7)
N.S.
1.000 0.141 7.086
101
23

Table 7. Analyses of the Incidence of Primary Tumors in Male Rats Fed Diets Containing Di(2-ethylhexyl)adipate (a)
(Continued)
Topography: Morphology
Pituitary: Adenoma, NOS, or Carcinoma, NOS (b)
P Values (c),(d)
Relative Risk (Control) (e) Lower Limit Upper Limit
Weeks to First Observed Tumor
Adrena1: Pheochromocytoma (b)
P Values (c),(d)
Relative Risk (Control) (e) Lower Limit Upper Limit
Weeks to First Observed Tumor
Adrenal: Pheochromocytoma, Malignant (b)
P Values (c),(d)
Relative Risk (Control) (e) Lower Limit Upper Limit
Weeks to First Observed Tumor
Control
4/44(9)
N.S.
90
3/48(6)
N.S.
106
3/48(6)
P=0.036(N)
106
Low High Dose Dose
3/47(6) 3/44(7)
N.S. N.S.
0.702 0.750 0.108 0.116 3.919 4.174
106 101
3/50(6) 1/50(2)
N.S. N.S.
0.960 0.320 0.135 0.006 6.844 3.822
106 105
0/50(0) 0/50(0)
N.S. N.S.
0.000 0.000 0.000 0.000 1.596 1.596
24
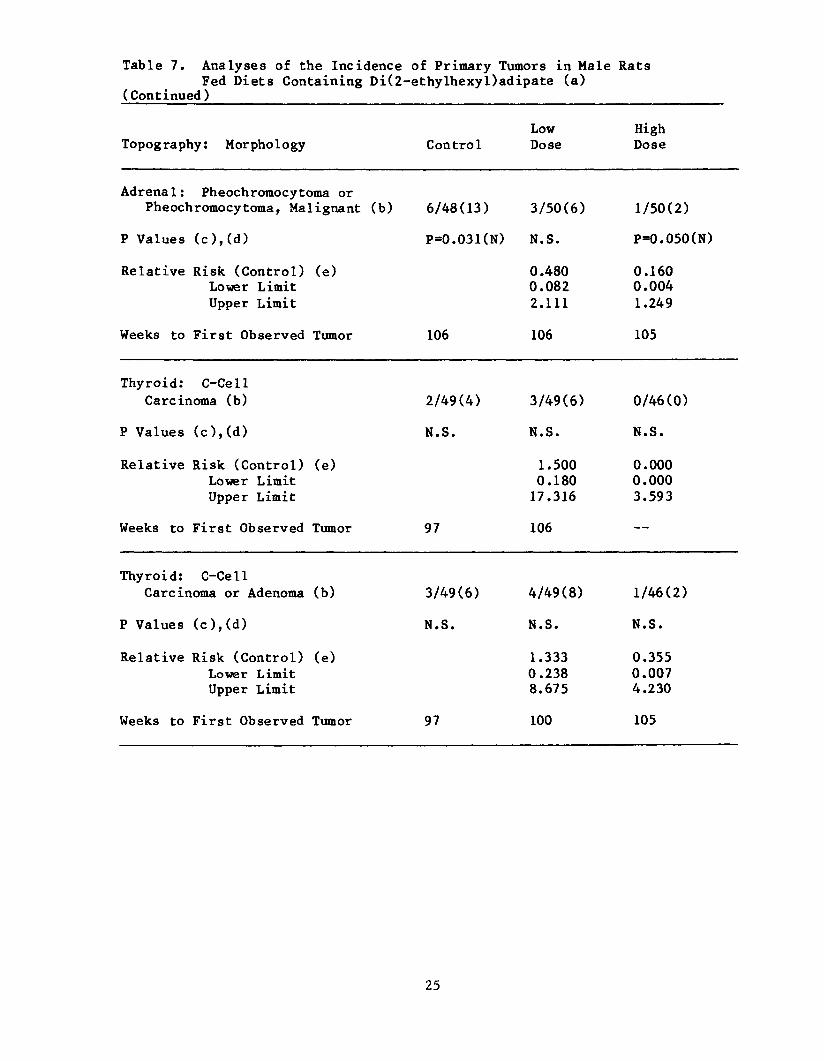
Table 7. Analyses of the Incidence of Primary Tumors in Male Rats Fed Diets Containing Di(2-ethylhexyl)adipate (a)
(Continued)
Topography: Morphology
Adrenal: Pheochromocytoma or Pheochromocytoma, Malignant (b)
P Values (c),(d)
Relative Risk (Control) (e) Lower Limit Upper Limit
Weeks to First Observed Tumor
Thyroid: C-Cell Carcinoma (b)
P Values (c),(d)
Relative Risk (Control) (e) Lower Limit Upper Limit
Weeks to First Observed Tumor
Thyroid: C-Cell Carcinoma or Adenoma (b)
P Values (c),(d)
Relative Risk (Control) (e) Lower Limit Upper Limit
Weeks to First Observed Tumor
Control
6/48(13)
P=0.031(N)
106
2/49(4)
N.S.
97
3/49(6)
N.S.
97
Low Dose
3/50(6)
N.S.
0.480 0.082 2.111
106
3/49(6)
N.S.
1.500 0.180 17.316
106
4/49(8)
N.S.
1.333 0.238 8.675
100
High Dose
1/50(2)
P=0.050(N)
0.160 0.004 1.249
105
0/46(0)
N.S.
0.000 0.000 3.593
—
1/46(2)
N.S.
0.355 0.007 4.230
105
25
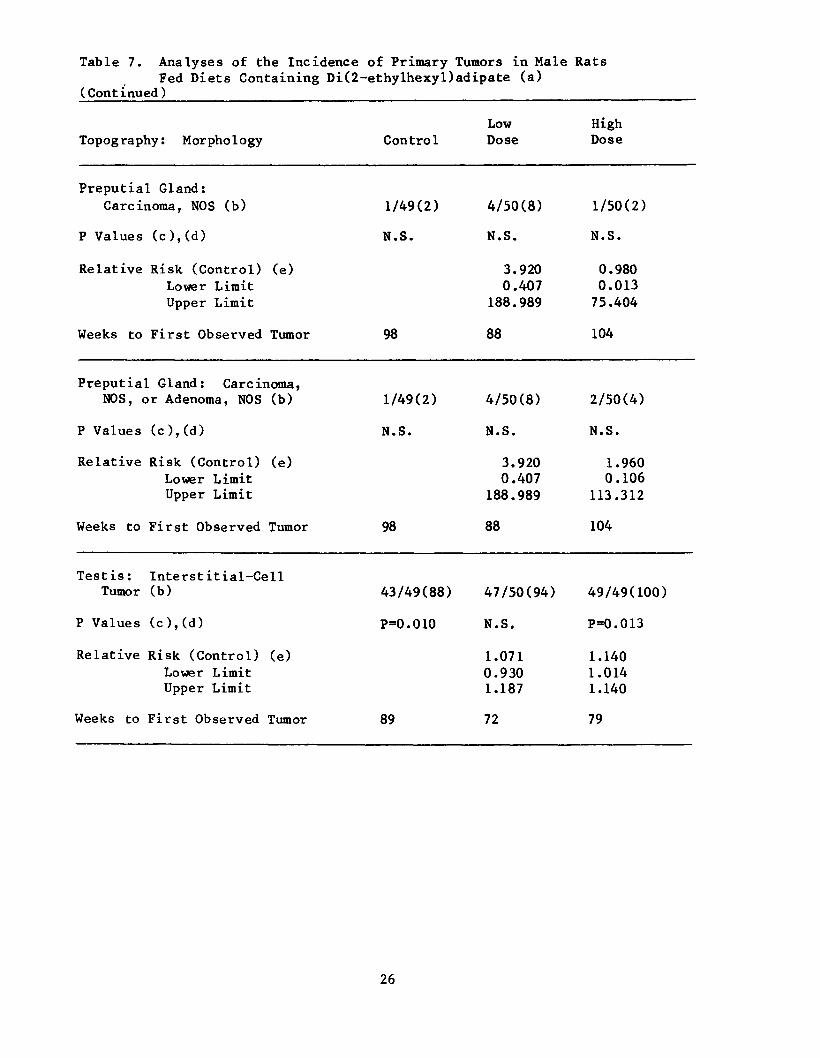
Table 7. Analyses of the Incidence of Primary Tumors in Male Rats Fed Diets Containing Di(2-ethylhexyl)adipate (a)
(Continued)
Low Topography: Morphology Control Dose
Preputial Gland: Carcinoma, NOS (b) 1/49(2) 4/50(8)
P Values ( c ) , ( d ) N.S. N.S.
Relative Risk (Control) (e) 3.920 Lower Limit 0.407 Upper Limit 188.989
Weeks to First Observed Tumor 98 88
Preputial Gland: Carcinoma, NOS, or Adenoma, NOS (b) 1/49(2) 4/50(8)
P Values ( c ) , ( d ) N.S. N.S.
Relative Risk (Control) (e) 3.920 Lower Limit 0.407 Upper Limit 188.989
Weeks to First Observed Tumor 98 88
Testis: Interstitial-Cell Tumor (b) 43/49(88) 47/50(94)
P Values ( c ) , ( d ) P=0.010 N.S.
Relative Risk (Control) (e) 1.071 Lower Limit 0.930 Upper Limit 1.187
Weeks to First Observed Tumor 89 72
High Dose
1/50(2)
N.S.
0.980 0.013
75.404
104
2/50(4)
N.S.
1.960 0.106
113.312
104
49/49(100)
P=0.013
1.140 1.014 1.140
79
26
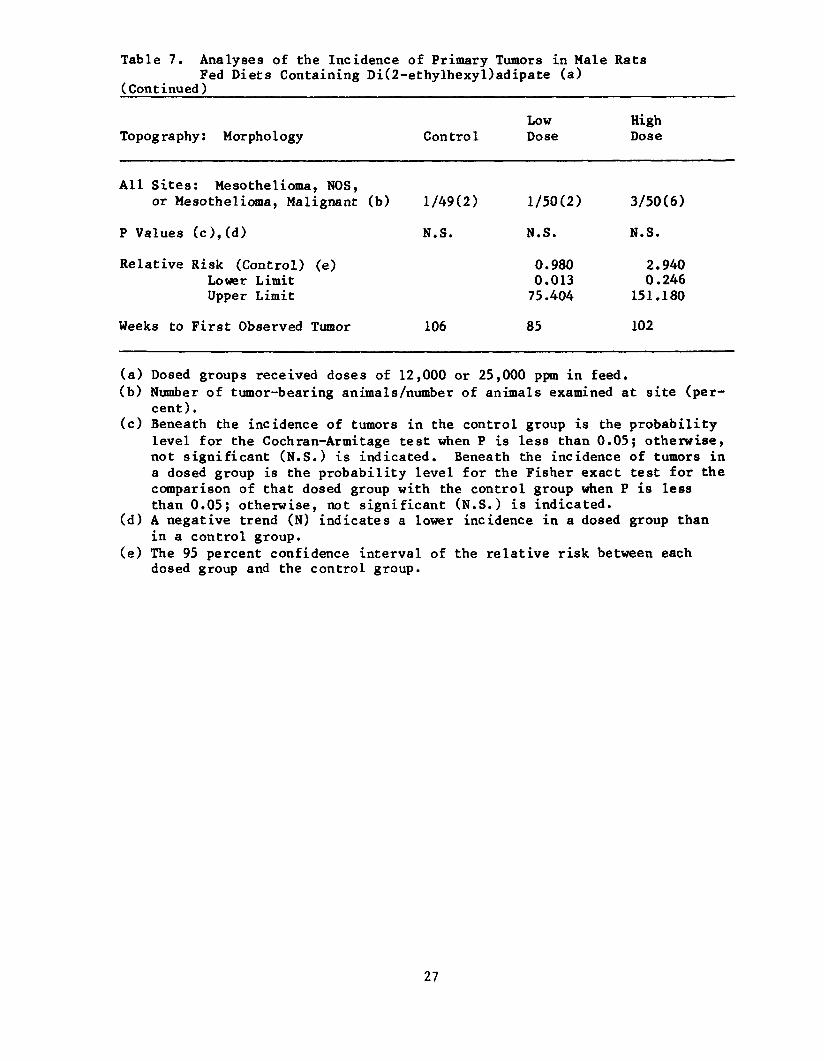
Table 7. Analyses of the Incidence of Primary Tumors in Male Rats Fed Diets Containing Di(2-ethylhexyl)adipate (a)
(Continued)
Low High Topography: Morphology Control Dose Dose
All Sites: Mesothelioma, NOS, or Mesothelioma, Malignant (b) 1/49(2) 1/50(2) 3/50(6)
P Values (c),(d) N.S. N.S. N.S.
Relative Risk (Control) (e) 0.980 2.940 Lower Limit 0.013 0.246 Upper Limit 75.404 151.180
Weeks to First Observed Tumor 106 85 102
(a) Dosed groups received doses of 12,000 or 25,000 ppm in feed. (b) Number of tumor-bearing animals/number of animals examined at site (per
cent). (c) Beneath the incidence of tumors in the control group is the probability
level for the Cochran-Armitage test when P is less than 0.05; otherwise, not significant (N.S.) is indicated. Beneath the incidence of tumors in a dosed group is the probability level for the Fisher exact test for the comparison of that dosed group with the control group when P is less than 0.05; otherwise, not significant (N.S.) is indicated.
(d) A negative trend (N) indicates a lower incidence in a dosed group than in a control group.
(e) The 95 percent confidence interval of the relative risk between each dosed group and the control group.
27
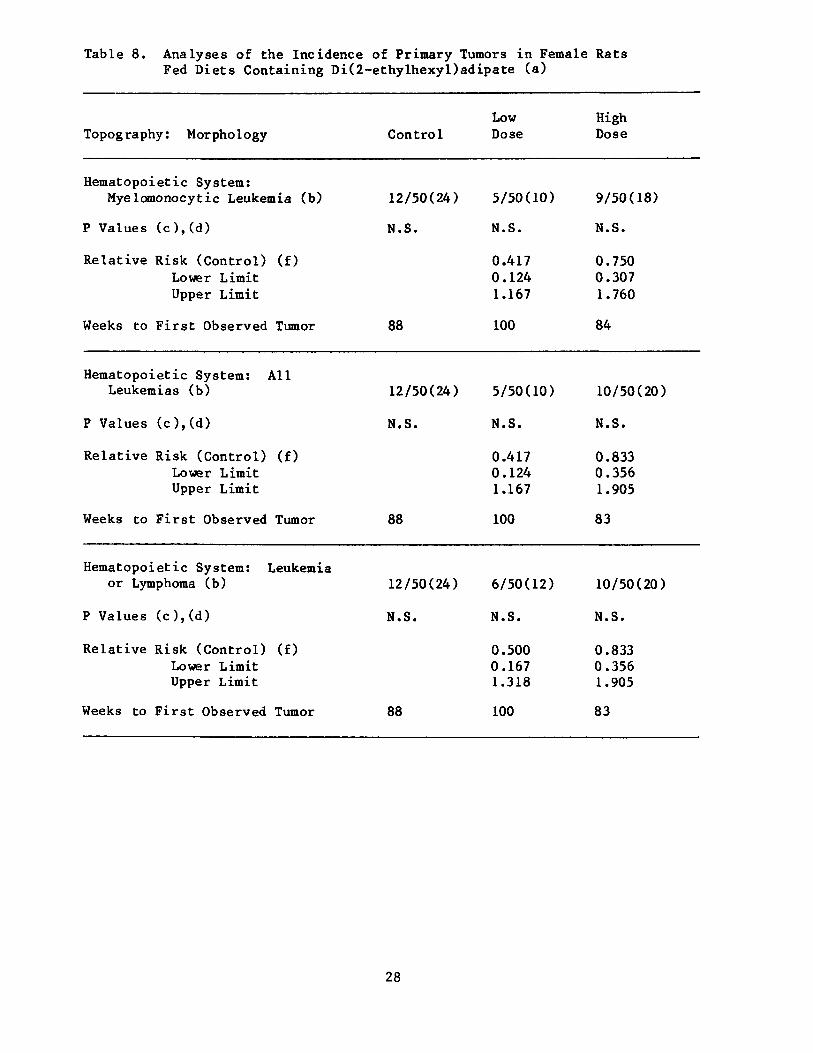
Table 8. Analyses of the Incidence of Primary Tumors in Female Rats Fed Diets Containing Di(2-ethylhexyl)adipate (a)
Topography: Morphology
Hematopoietic System: Myelomonocytic Leukemia (b)
P Values (c),(d)
Relative Risk (Control) (f) Lower Limit Upper Limit
Weeks to First Observed Tumor
Hematopoietic System: All Leukemias (b)
P Values (c),(d)
Relative Risk (Control) (f) Lower Limit Upper Limit
Weeks to First Observed Tumor
Hematopoietic System: Leukemia or Lymphoma (b)
P Values (c),(d)
Relative Risk (Control) (f) Lower Limit Upper Limit
Weeks to First Observed Tumor
Control
12/50(24)
N.S.
88
12/50(24)
N.S.
88
12/50(24)
N.S.
88
Low Dose
5/50(10)
N.S.
0.417 0.124 1.167
100
5/50(10)
N.S.
0.417 0.124 1.167
100
6/50(12)
N.S.
0.500 0.167 1.318
100
High Dose
9/50(18)
N.S.
0.750 0.307 1.760
84
10/50(20)
N.S.
0.833 0.356 1.905
83
10/50(20)
N.S.
0.833 0.356 1.905
83
28
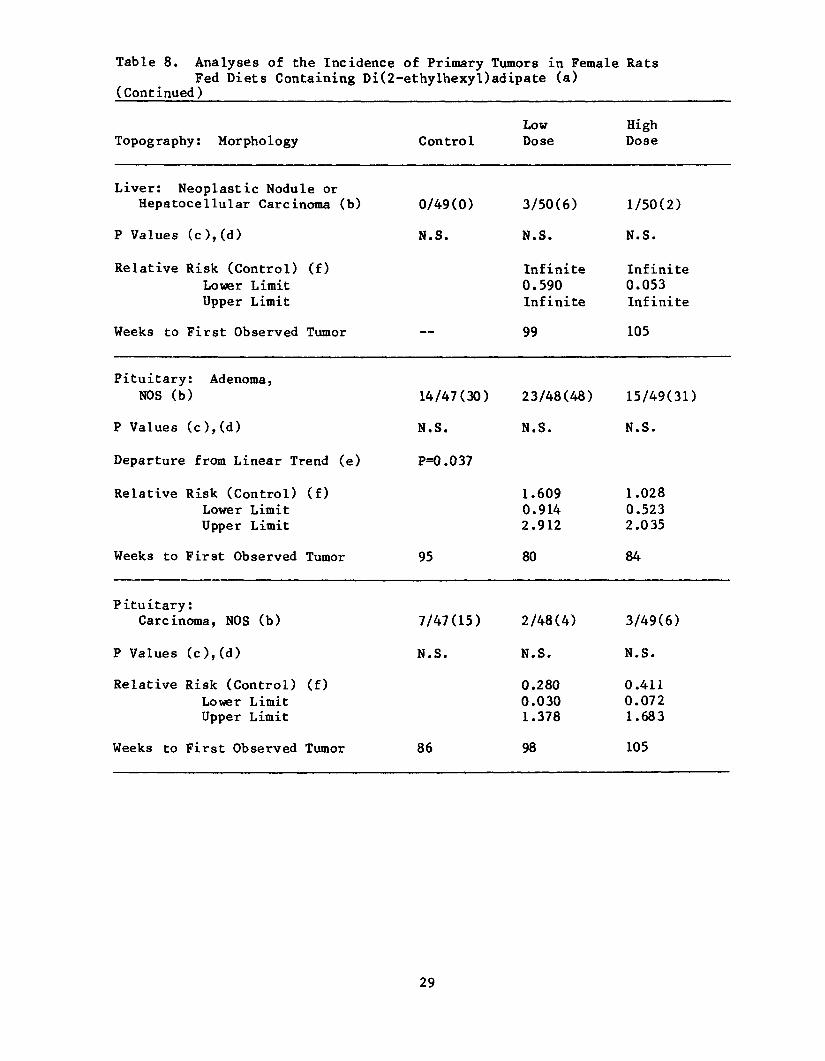
Table 8. Analyses of the Incidence of Primary Tumors in Female Rats Fed Diets Containing Di(2-ethylhexyl)adipate (a)
(Continued)
Low Topography: Morphology Control Dose
Liver: Neoplastic Nodule or Hepatocellular Carcinoma (b) 0/49(0) 3/50(6)
P Values (c) ,(d) N.S. N.S.
Relative Risk (Control) (f) Infinite Lower Limit 0.590 Upper Limit Infinite
Weeks to First Observed Tumor 99
Pituitary: Adenoma, NOS (b) 14/47(30) 23/48(48)
P Values (c) , (d) N.S. N.S.
Departure from Linear Trend (e) P=0.037
Relative Risk (Control) (f) 1.609 Lower Limit 0.914 Upper Limit 2.912
Weeks to First Observed Tumor 95 80
Pituitary: Carcinoma, NOS (b) 7/47(15) 2/48(4)
P Values (c) ,(d) N.S. N.S.
Relative Risk (Control) (f) 0.280 Lower Limit 0.030 Upper Limit 1.378
Weeks to First Observed Tumor 86 98
High Dose
1/50(2)
N.S.
Infinite 0.053 Infinite
105
15/49(31)
N.S.
1.028 0.523 2.035
84
3/49(6)
N.S.
0.411 0.072 1.683
105
29
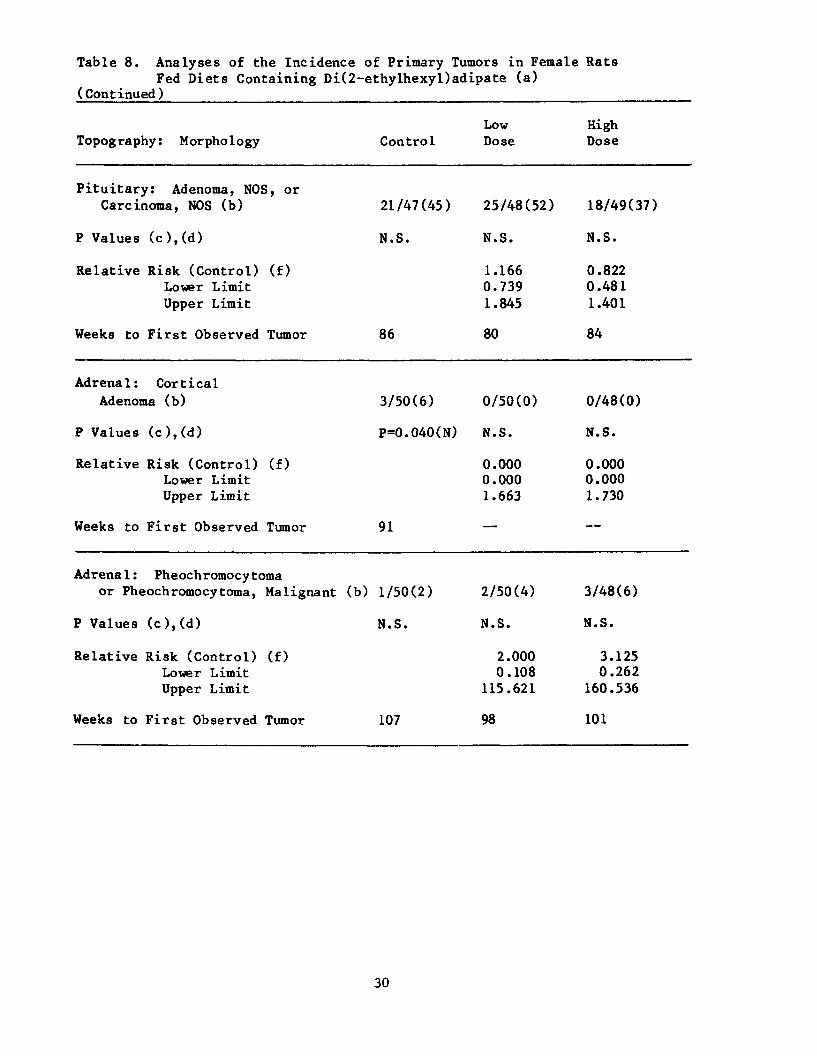
Table 8. Analyses of the Incidence of Primary Tumors in Female Rats Fed Diets Containing Di(2-ethylhexyl)adipate (a)
(Continued)
Topography: Morphology
Pituitary: Adenoma, NOS, or Carcinoma, NOS (b)
P Values (c),(d)
Relative Risk (Control) (f) Lower Limit Upper Limit
Weeks to First Observed Tumor
Adrenal: Cortical Adenoma (b)
P Values (c),(d)
Relative Risk (Control) (f) Lower Limit Upper Limit
Weeks to First Observed Tumor
Adrenal: Pheochromocytoma
Control
21/47(45)
N.S.
86
3/50(6)
P=0.040(N)
91
or Pheochromocytoma, Malignant (b) 1/50(2)
P Values (c),(d) N.S.
Relative Risk (Control) (f) Lower Limit Upper Limit
Weeks to First Observed Tumor 107
Low Dose
25/48(52)
N.S.
1.166 0.739 1.845
80
0/50(0)
N.S.
0.000 0.000 1.663
—
2/50(4)
N.S.
2.000 0.108
115.621
98
High Dose
18/49(37)
N.S.
0.822 0.481 1.401
84
0/48(0)
N.S.
0.000 0.000 1.730
—
3/48(6)
N.S.
3.125 0.262
160.536
101
30
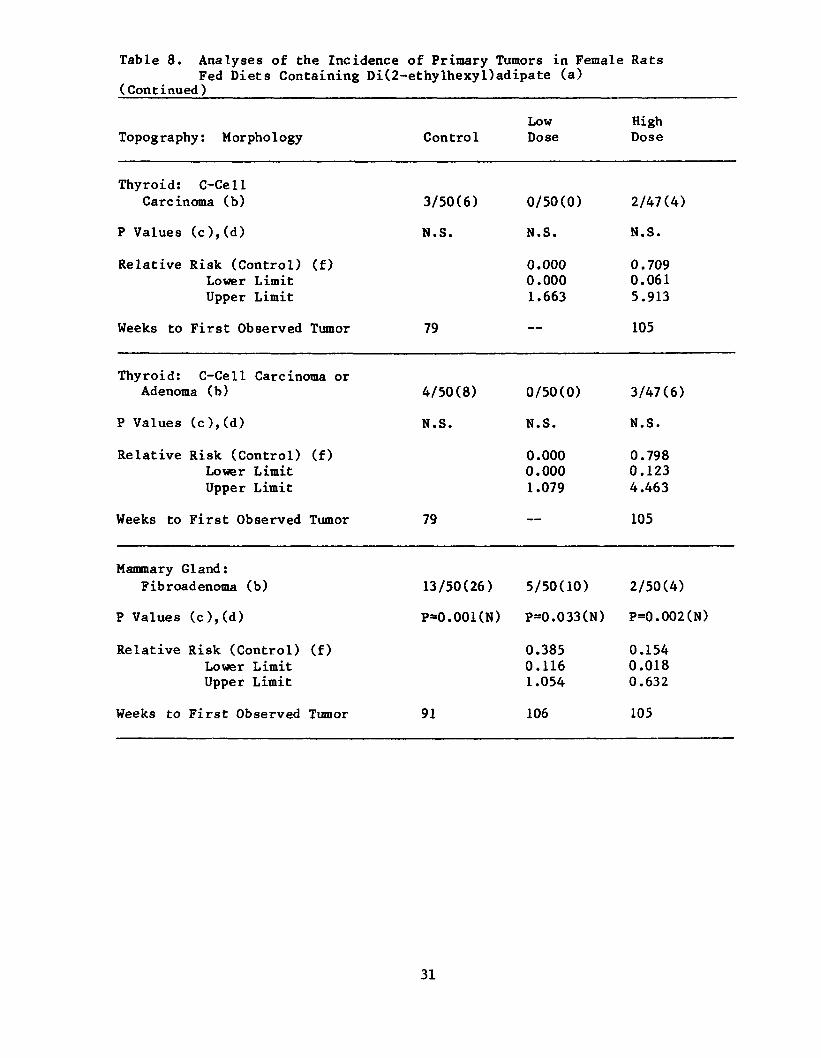
Table 8. Analyses of the Incidence of Primary Tumors in Female Rats Fed Diets Containing Di(2-ethylhexyl)adipate (a)
(Continued)
Low Topography: Morphology Control Dose
Thyroid: C-Cell Carcinoma (b) 3/50(6) 0/50(0)
P Values (c ) , (d ) N.S. N.S.
Relative Risk (Control) (f) 0.000 Lower Limit 0.000 Upper Limit 1.663
Weeks to First Observed Tumor 79
Thyroid: C-Cell Carcinoma or Adenoma (b) 4/50(8) 0/50(0)
P Values (c) ,(d) N.S. N.S.
Relative Risk (Control) (f) 0.000 Lower Limit 0.000 Upper Limit 1.079
Weeks to First Observed Tumor 79
Mammary Gland: Fibroadenoma (b) 13/50(26) 5/50(10)
P Values ( c ) , ( d ) P=0.001(N) P=0.033(N)
Relative Risk (Control) (f) 0.385 Lower Limit 0.116 Upper Limit 1.054
Weeks to First Observed Tumor 91 106
High Dose
2/47(4)
N.S.
0.709 0.061 5.913
105
3/47(6)
N.S.
0.798 0.123 4.463
105
2/50(4)
P=0.002(N)
0.154 0.018 0.632
105
31
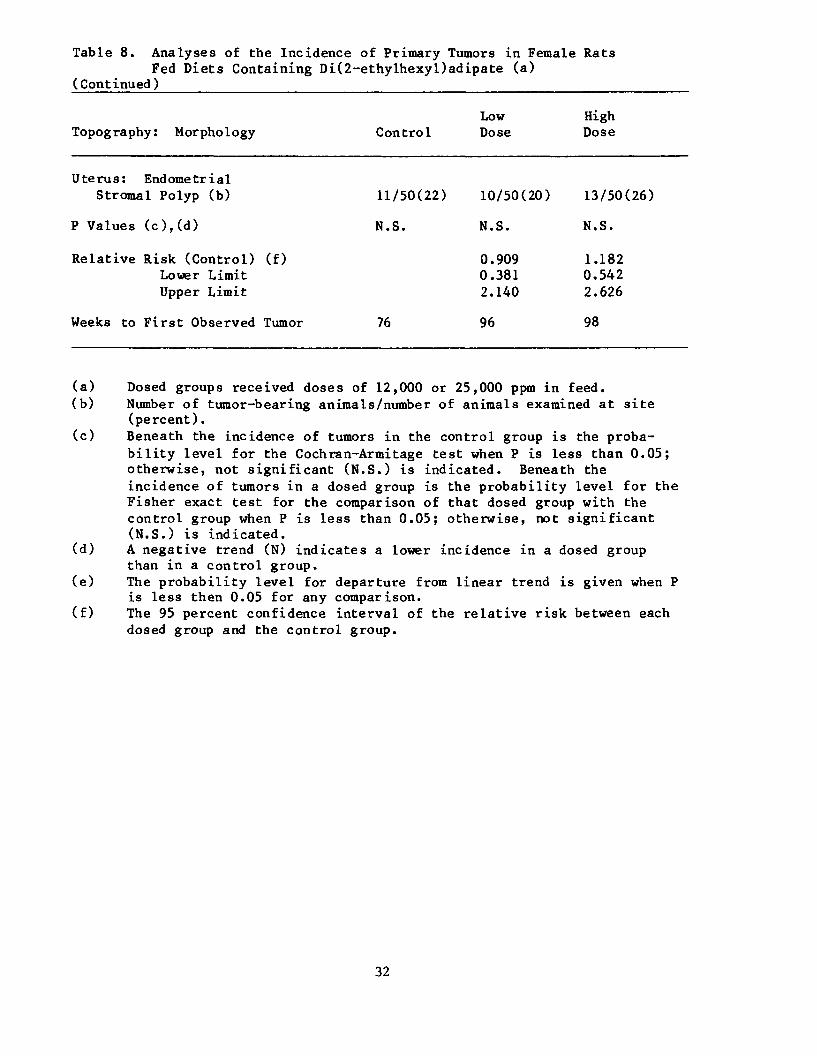
Table 8. Analyses of the Incidence of Primary Tumors in Female Rats Fed Diets Containing Di(2-ethylhexyl)adipate (a)
(Continued)
Low High Topography: Morphology Control Dose Dose
Uterus: Endometrial Stromal Polyp (b) 11/50(22) 10/50(20) 13/50(26)
P Values (c ) , (d ) N.S. N.S. N.S.
Relative Risk (Control) (f) 0.909 1.182 Lower Limit 0.381 0.542 Upper Limit 2.140 2.626
Weeks to First Observed Tumor 76 96 98
(a) Dosed groups received doses of 12,000 or 25,000 ppm in feed. (b) Number of tumor-bearing animals/number of animals examined at site
(percent). (c) Beneath the incidence of tumors in the control group is the proba
bility level for the Cochran-Armitage test when P is less than 0.05; otherwise, not significant (N.S. ) is indicated. Beneath the incidence of tumors in a dosed group is the probability level for the Fisher exact test for the comparison of that dosed group with the control group when P is less than 0.05; otherwise, not significant (N.S.) is indicated.
(d) A negative trend (N) indicates a lower incidence in a dosed group than in a control group.
(e) The probability level for departure from linear trend is given when P is less then 0.05 for any comparison.
(f) The 95 percent confidence interval of the relative risk between each dosed group and the control group.
32
IV. RESULTS - MICE
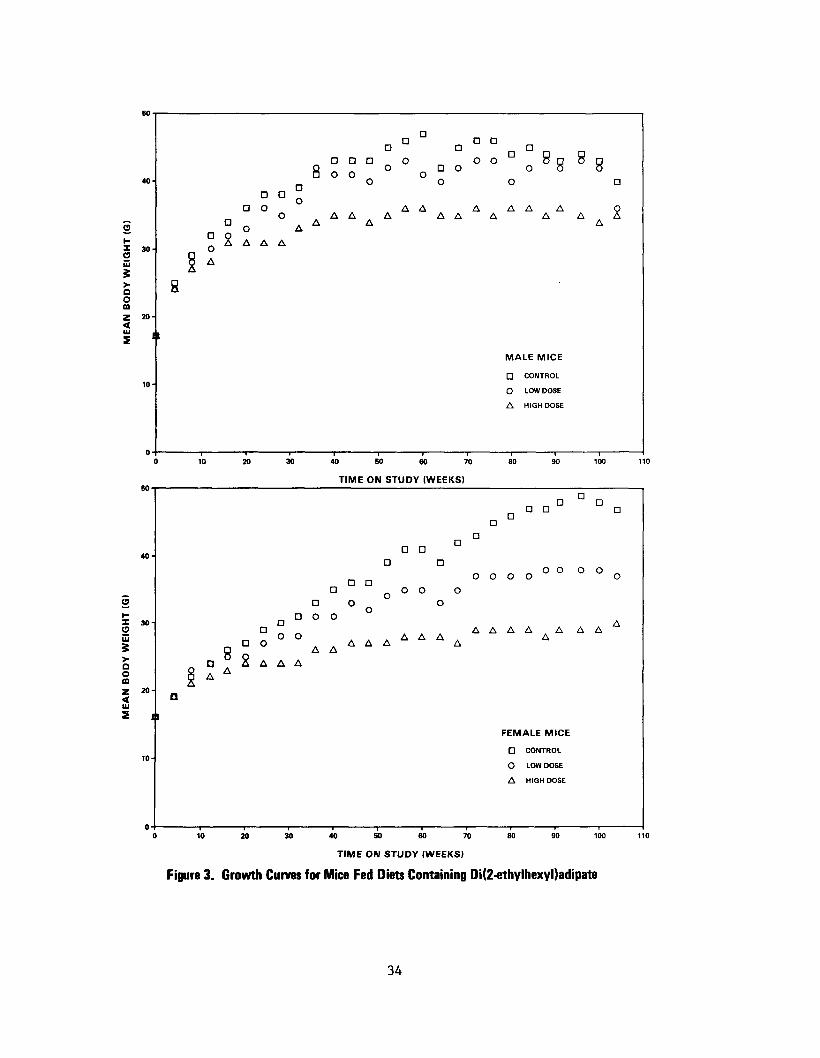
A. Body Weights and Clinical Signs (Mice)
Mean body weights of dosed mice of either sex were lower than those of
the corresponding controls throughout the bioassay, and the decrease in
weight gain was dose related (Figure 3). No other compound-related clinical
signs were observed.
B. Survival (Mice)
Estimates of the probabilities of survival for male and female mice
administered di(2-ethylhexyl)adipate in feed at the doses of this bioassay,
and those of the controls, are shown by the Kaplan and Meier curves in Figure
4. The Cox test indicates significantly less (P=0.040) survival in the low-
dose group than in the high-dose group of male mice, and survival in this
group was less than that in the control from week 15 to the end of the
study. The survival among all three groups of females was comparable.
In male mice, 36/50 (72%) of the control group, 32/50 (64%) of the low-
dose group, and 41/50 (82%) of the high-dose group lived to the end of the
study at 105-106 weeks. In females, 42/50 (84%) of the control group, 39/50
(78%) of the low-dose group, and 36/49 (73%) of the high-dose group were
alive at the end of the study at 105-106 weeks.
C. Pathology (Mice)
Histopathologic findings on neoplasms in mice are summarized in Appendix
B, Tables Bl and B2; findings on nonneoplastic lesions are summarized in
Appendix D, Tables Dl and D2.
In mice, the incidence of neoplasms of the liver appeared to be related
to the feeding of di(2-ethylhexyl)adipate. The numbers of mice with hepato
cellular neoplasms and the sites of metastases are summarized in Table 9.
33
D 0 °° 8
2
D
O
D
O D
O
o
A A
A A A
AA
A A
AA
AA
A A A A
A
O A
A A A
QO m z 20-1
MALE MICE
D CONTROL 10
O LOW DOSE
A HIGH DOSE
10 20 40 60 60 70 90 100 110
TIME ON STUDY (WEEKS)
D D
D a a a
0 0 0 0 ° ° ° ° 0 D D a o o o
D O O
X O uj D O
O
a
O
o o
A A . . . A A AA A A
.A
A A A A A
A A A A
QO m
a
A A
A A A A
20
FEMALE MICE
D CONTROL
O LOW DOSE
A HIGH DOSE
10 20 30 40 SO 60 70 80 90 100 110
TIME ON STUDY (WEEKS)
Figure 3. Growth Curves for Mice Fed Diets Containing Di(2-ethylhexyl)adipate
34

PR
OB
AB
ILIT
Y O
F S
UR
VIV
AL
PR
OB
AB
ILIT
Y O
F S
UR
VIV
AL
) 1•i
t
3iS
;s !
C
; s s
sS ci
g!aS
8 S
! i 3
Ci
H$ 1;
i 3 I;
c,
g I iS
8 O
•
t-
i'
ri 5
•
_J
; _
^j0
1-
1 I';
v»
«•
>
O G
^~
>
0
0
S
-<
̂3
I
r-0
I r o
1
<•
°
§ z
OJ_
g
§
I
C
§ 1
p 3m
3r»
o
o
m
( M
—
m—
g-
3-
r?
^ s
H
ft
8
=!
ft-
r J
' 31
s
m3
°-o
0
o
z
ZQ
J
w1
§3
UJ
c
8-
c 8
f»
0
o
<
( I
EC-
i i
I
9J
—
• m
m
)T
a
m
m
Q
1'
*""*
*
01
2
S!
O
/
fr>n
'
T3
fe:
i!
sj.
&"
lo.J
••
0
-J
i •?"
"S.
„ fr
' ~
n
l ^
i
ijj]
4 ^
h-
1
o-i )-J
I
0J
*
°̂
pJ
CM
8"̂
f -
-Hhr
-6
— #
* ̂
3
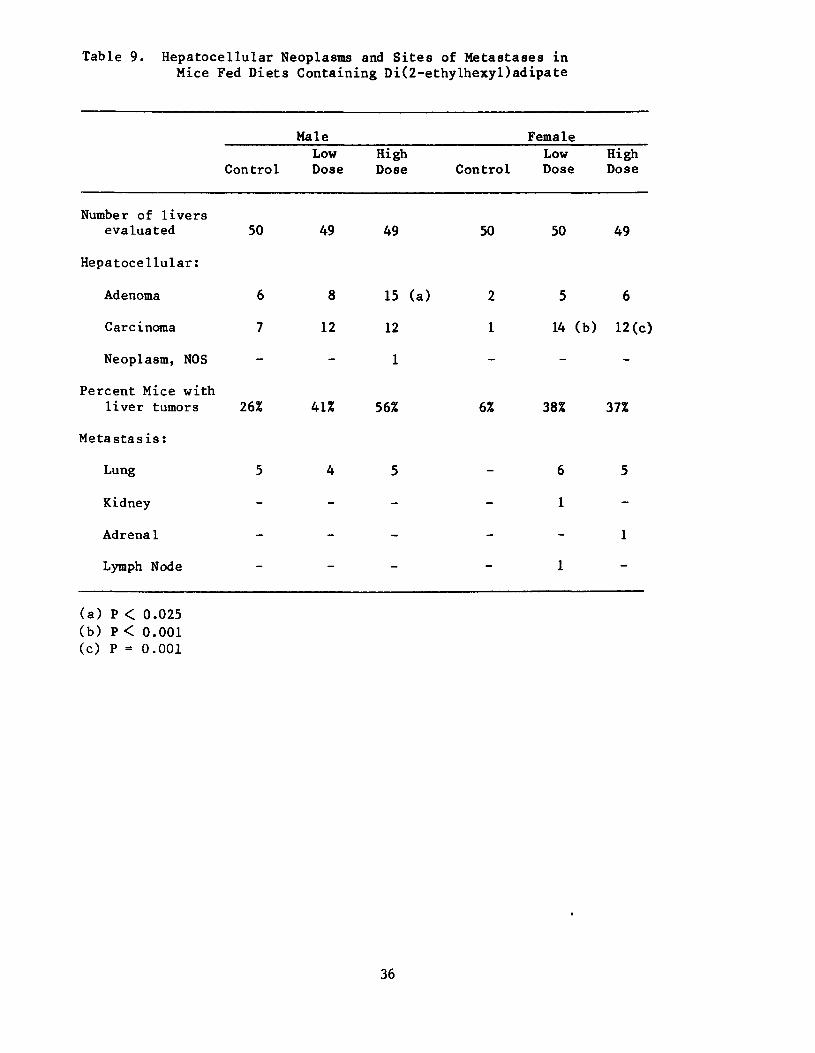
Table 9. Hepatocellular Neoplasms and Sites of Metastases in Mice Fed Diets Containing Di(2-ethylhexyl)adipate
Male Female Low High Low High
Control Dose Dose Control Dose Dose
Number of livers evaluated 50 49 49 50 50 49
Hepatocellular:
Adenoma 6 8 15 (a) 2 5 6
Carcinoma
Neoplasm, NOS
7 _
12 _
12
1
1 14 (b) 12(c)
Percent Mice with liver tumors 26% 41% 56% 6% 38% 37%
Metastasis:
Lung 5 4 5 6
Kidney 1
Adrenal
Lymph Node
(a) P < 0.025 (b) P < 0.001 (c) P = 0.001
36
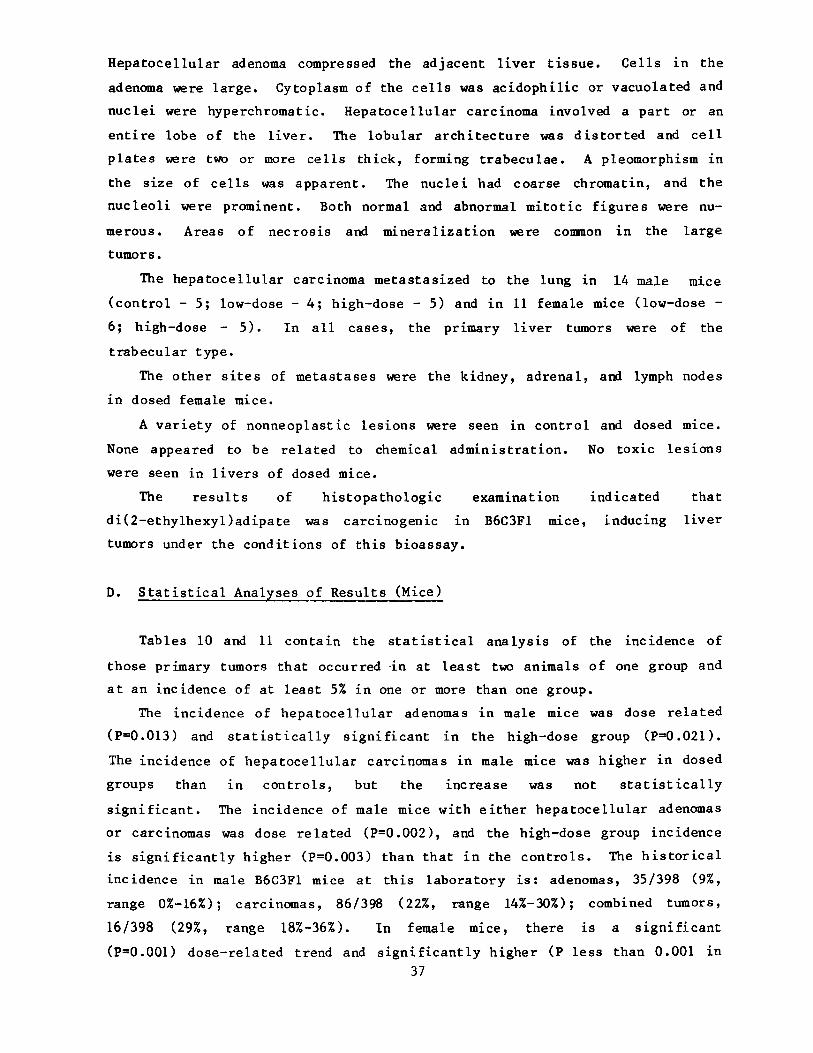
Hepatocellular adenoma compressed the adjacent liver tissue. Cells in the
adenoma were large. Cytoplasm of the cells was acidophilic or vacuolated and
nuclei were hyperchromatic. Hepatocellular carcinoma involved a part or an
entire lobe of the liver. The lobular architecture was distorted and cell
plates were two or more cells thick, forming trabeculae. A pleomorphism in
the size of cells was apparent. The nuclei had coarse chromatin, and the
nucleoli were prominent. Both normal and abnormal mitotic figures were nu
merous. Areas of necrosis and mineralization were common in the large
tumors.
The hepatocellular carcinoma metastasized to the lung in 14 male mice
(control - 5; low-dose - 4; high-dose - 5) and in 11 female mice (low-dose
6; high-dose - 5). In all cases, the primary liver tumors were of the
trabecular type.
The other sites of metastases were the kidney, adrenal, and lymph nodes
in dosed female mice.
A variety of nonneoplastic lesions were seen in control and dosed mice.
None appeared to be related to chemical administration. No toxic lesions
were seen in livers of dosed mice.
The results of histopathologic examination indicated that
di(2-ethylhexyl)adipate was carcinogenic in B6C3F1 mice, inducing liver
tumors under the conditions of this bioassay.
D. Statistical Analyses of Results (Mice)
Tables 10 and 11 contain the statistical analysis of the incidence of
those primary tumors that occurred in at least two animals of one group and
at an incidence of at least 5% in one or more than one group.
The incidence of hepatocellular adenomas in male mice was dose related
(P=0.013) and statistically significant in the high-dose group (P=0.021).
The incidence of hepatocellular carcinomas in male mice was higher in dosed
groups than in controls, but the increase was not statistically
significant. The incidence of male mice with either hepatocellular adenomas
or carcinomas was dose related (P=0.002), and the high-dose group incidence
is significantly higher (P=0.003) than that in the controls. The historical
incidence in male B6C3F1 mice at this laboratory is: adenomas, 35/398 (9%,
range 0%-16%); carcinomas, 86/398 (22%, range 14%-30%); combined tumors,
16/398 (29%, range 18%-36%). In female mice, there is a significant
(P=0.001) dose-related trend and significantly higher (P less than 0.001 in 37

each instance) incidence of animals with hepatocellular adenomas or
carcinomas in each of the dosed groups than in the control group. The his
torical incidence in female B6C3F1 mice at this laboratory is: adenomas,
18/397 (5%, range 0%-18%); carcinomas, 14/397 (4%, range 0%-8%); combined
tumors, 31/397 (8%, range 2%-20%). A departure (P=0.024) from a linear
trend has been indicated in females due to a sharp increase in the dosed
groups' incidences. The test for the time to observation of this tumor in
female mice indicates that there is a significantly shorter (P=0.002) time
to the observation of these tumors in the dosed groups compared with the
control group. In male mice, the result of this test was not significant.
Negative trends (P=0.010 in males and P=0.001 in females) and signifi
cantly lower incidences of animals with lymphomas or leukemias in the hemato
poietic system in each of the dosed groups were observed (P=0.028 and P=0.016
in males and P=0.048 and P=0.001, respectively, in females). Incidences that
are higher in the control groups (16/50 or 32% in males and 23/50 or 46% in
females) than their respective incidence in the pooled historical controls
were found in studies conducted at this laboratory for 100 weeks or more
(165/3,543 or 5% in males and 331/3,617 or 9% in females).
A negative trend (P=0.005) and significantly lower (P=0.003) incidence
of adenomas in the pituitary of high-dose group female mice were observed.
The pooled historical control incidence for this tumor type in female B6C3F1
mice at this laboratory is 18/253 (7%) as compared with 8/39 (21%) in the
control group.
Statistical analysis indicates that the incidence of liver tumors in mice
of both sexes in this study is related to the administration of di(2
ethylhexyDadipate in feed.
38
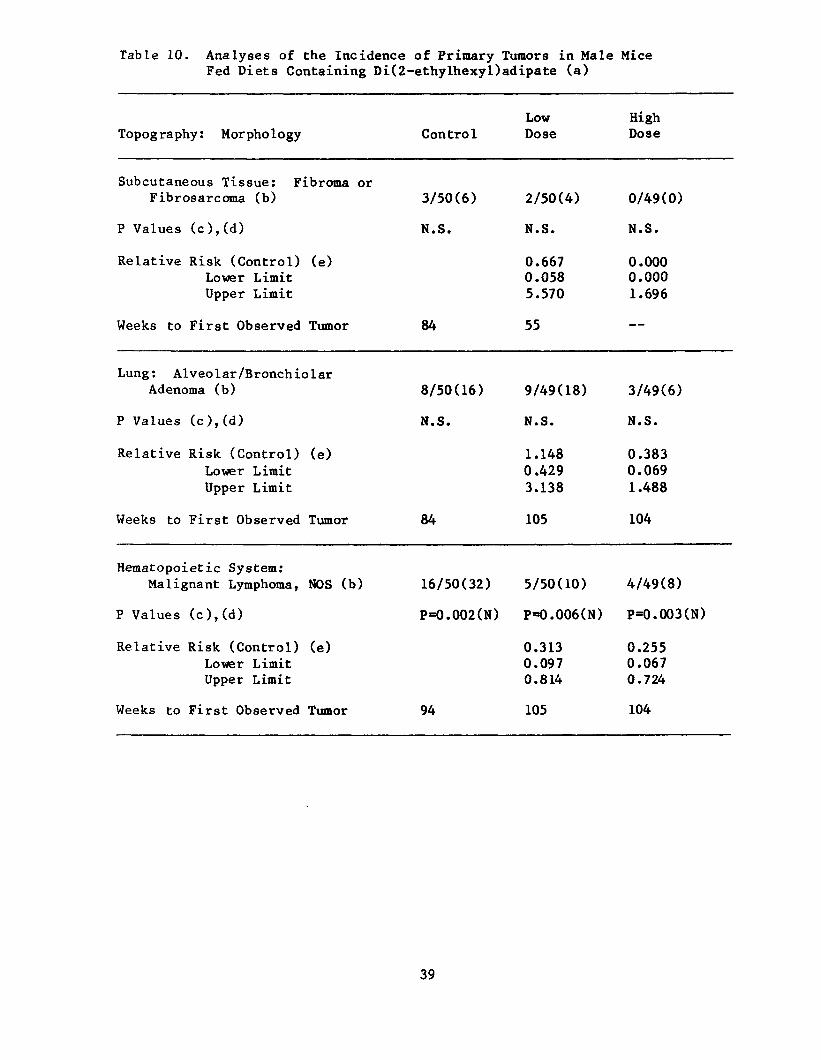
Table 10. Analyses of the Incidence of Primary Tumors in Male Mice Fed Diets Containing Di(2-ethylhexyl)adipate (a)
Low Topography: Morphology Control Dose
Subcutaneous Tissue:Fibrosarcoma (b)
Fibroma or 3/50(6) 2/50(4)
P Values ( c ) , (d ) N.S. N.S.
Relative Risk (Control) (e) Lower Limit Upper Limit
0.667 0.058 5.570
Weeks to First Observed Tumor 84 55
Lung: Alveolar/Bronchiolar Adenoma (b) 8/50(16) 9/49(18)
P Values (c) , (d) N.S. N.S.
Relative Risk (Control) (e) 1.148 Lower Limit 0.429 Upper Limit 3.138
Weeks to First Observed Tumor 84 105
Hematopoietic System: Malignant Lymph oma, NOS (b) 16/50(32) 5/50(10)
P Values (c ) , (d ) P=0.002(N) P*0.006(N)
Relative Risk (Control) (e) 0.313 Lower Limit 0.097 Upper Limit 0.814
Weeks to First Observed Tumor 94 105
High Dose
0/49(0)
N.S.
0.000 0.000 1.696
—
3/49(6)
N.S.
0.383 0.069 1.488
104
4/49(8)
P=0.003(N)
0.255 0.067 0.724
104
39
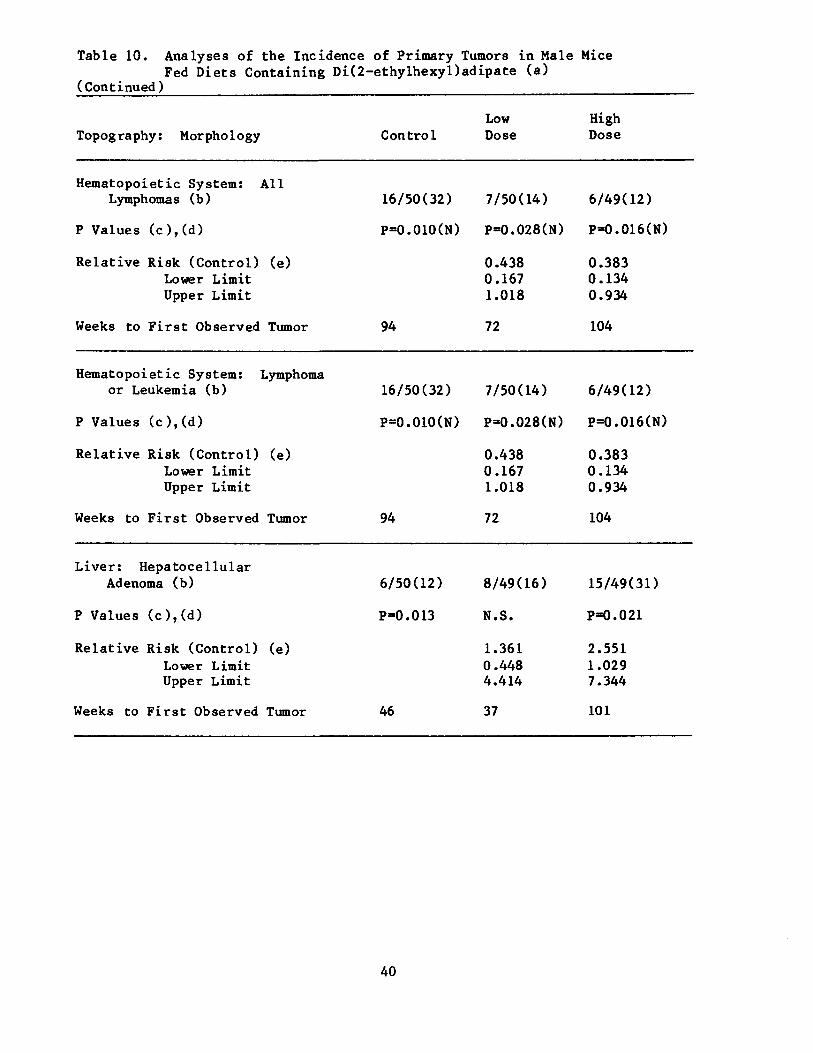
Table 10. Analyses of the Incidence of Primary Tumors in Male Mice Fed Diets Containing Di(2-ethylhexyl)adipate (a)
(Continued)
Topography: Morphology
Hematopoietic System: All Lymphomas (b)
P Values (c),(d)
Relative Risk (Control) (e) Lower Limit Upper Limit
Weeks to First Observed Tumor
Hematopoietic System: Lymphoma or Leukemia (b)
P Values (c),(d)
Relative Risk (Control) (e) Lower Limit Upper Limit
Weeks to First Observed Tumor
Liver: Hepatocellular Adenoma (b)
P Values (c),(d)
Relative Risk (Control) (e) Lower Limit Upper Limit
Weeks to First Observed Tumor
Control
16/50(32)
P=0.010(N)
94
16/50(32)
P=0.010(N)
94
6/50(12)
P=0.013
46
Low Dose
7/50(14)
P=0.028(N)
0.438 0.167 1.018
72
7/50(14)
P=0.028(N)
0.438 0.167 1.018
72
8/49(16)
N.S.
1.361 0.448 4.414
37
High Dose
6/49(12)
P=0.016(N)
0.383 0.134 0.934
104
6/49(12)
P=0.016(N)
0.383 0.134 0.934
104
15/49(31)
P=0.021
2.551 1.029 7.344
101
40

Table 10. Analyses of the Incidence of Primary Tumors in Male Mice Fed Diets Containing Di(2-ethylhexyl)adipate (a)
(Continued)
Low High Topography: Morphology Control Dose Dose
Liver: Hepatocellular Carcinoma (b) 7/50(14) 12/49(24) 12/49(24)
P Values ( c ) , ( d ) N.S. N.S. N.S.
Relative Risk (Control) (e) 1.749 1.749 Lower Limit 0.696 0.696 Upper Limit 4.802 4.802
Weeks to First Observed Tumor 86 68 65
Liver: Hepatocellular Adenoma or Carcinoma (b) 13/50(26) 20/49(41) 27/49(55)
P Values (c),(d) P=0.002 N.S. P=0.003
Relative Risk (Control) (e) 1.570 2.119 Lower Limit 0.843 1.216 Upper Limit 3.013 3.821
Weeks to First Observed Tumor 46 37 65
(a) Dosed groups received doses of 12,000 or 25,000 ppm in feed. (b) Number of tumor-bearing animals/number of animals examined at site (per
cent) . (c) Beneath the incidence of tumors in the control group is the probability
level for the Cochran-Armitage test when P is less than 0.05; otherwise, not significant (N.S.) is indicated. Beneath the incidence of tumors in a dosed group is the probability level for the Fisher exact test for the comparison of that dosed group with the control group when P is less than 0.05; otherwise, not significant (N.S.) is indicated.
(d) A negative trend (N) indicates a lower incidence in a dosed group than in a control group.
(e) The 95 percent confidence interval of the relative risk between each dosed group and the control group.
41
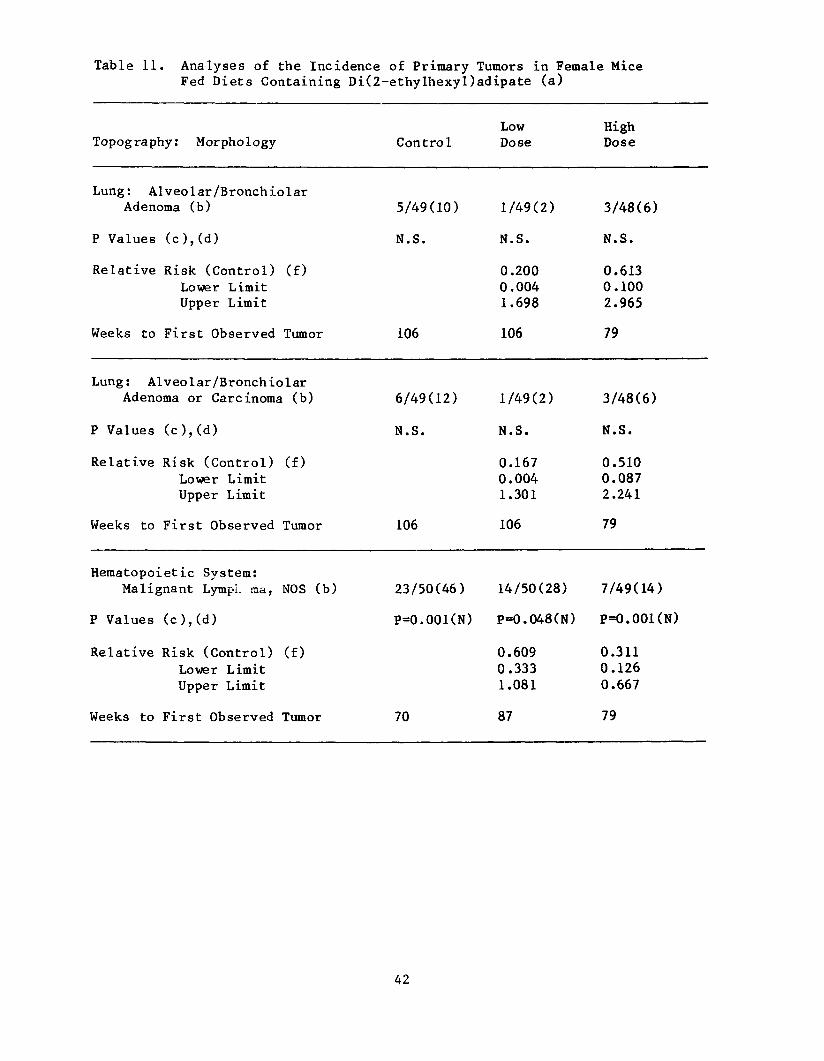
Table 11. Analyses of the Incidence of Primary Tumors in Female Mice Fed Diets Containing Di(2-ethylhexyl)adipate (a)
Topography: Morphology
Lung: Alveolar /Bronchiolar Adenoma (b)
P Values (c),(d)
Relative Risk (Control) (f) Lower Limit Upper Limit
Weeks to First Observed Tumor
Lung: Alveolar /Bronchiolar Adenoma or Carcinoma (b)
P Values (c),(d)
Relative Risk (Control) (f) Lower Limit Upper Limit
Weeks to First Observed Tumor
Hematopoietic System: Malignant Lympi. ma, NOS (b)
P Values (c),(d)
Relative Risk (Control) (f) Lower Limit Upper Limit
Weeks to First Observed Tumor
Low Control Dose
5/49(10) 1/49(2)
N.S. N.S.
0.200 0.004 1.698
106 106
6/49(12) 1/49(2)
N.S. N.S.
0.167 0.004 1.301
106 106
23/50(46) 14/50(28)
P=0.001(N) P=0.048(N)
0.609 0.333 1.081
70 87
High Dose
3/48(6)
N.S.
0.613 0.100 2.965
79
3/48(6)
N.S.
0.510 0.087 2.241
79
7/49(14)
P=0.001(N)
0.311 0.126 0.667
79
42
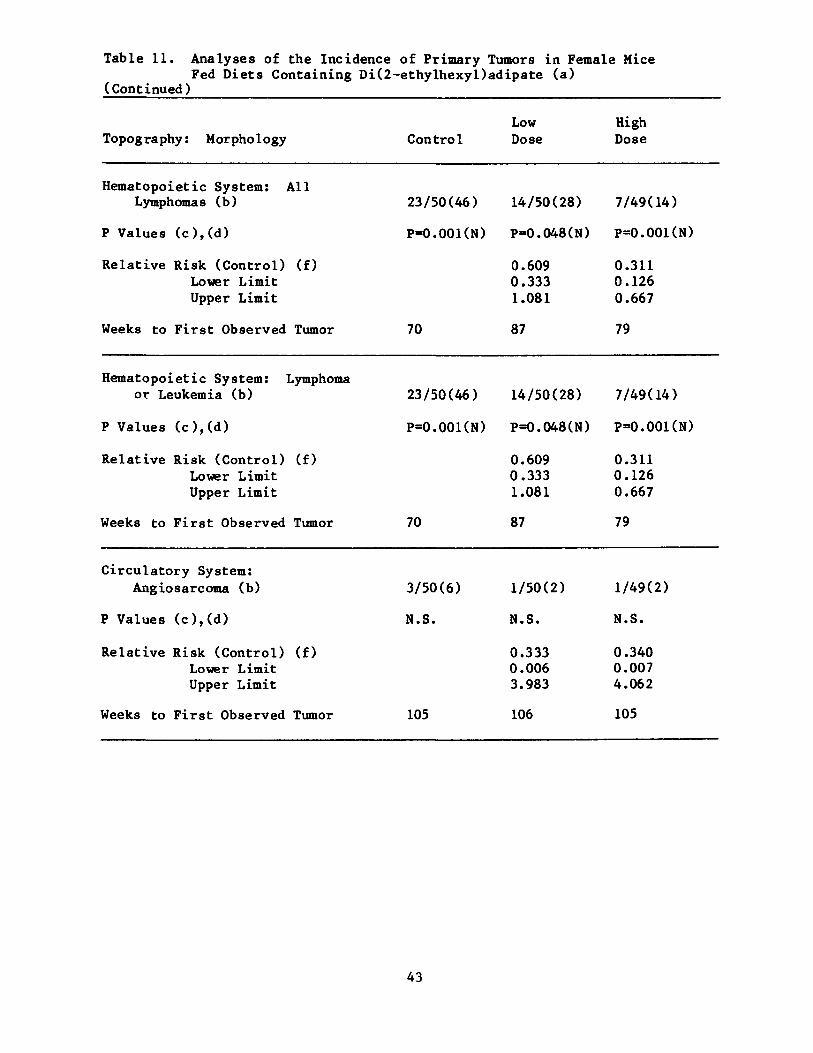
Table 11. Analyses of the Incidence of Primary Tumors in Female Mice Fed Diets Containing Di(2-ethylhexyl)adipate (a)
(Continued)
Low Topography: Morphology Control Dose
Hematopoietic System: All Lymphomas (b) 23/50(46) 14/50(28)
P Values (c),(d) P=0.001(N) P=0.048(N)
Relative Risk (Control) (f) 0.609 Lower Limit 0.333 Upper Limit 1.081
Weeks to First Observed Tumor 70 87
Hematopoietic System: Lymphoma or Leukemia (b) 23/50(46) 14/50(28)
P Values (c),(d) P=0.001(N) P=0.048(N)
Relative Risk (Control) (f) 0.609 Lower Limit 0.333 Upper Limit 1.081
Weeks to First Observed Tumor 70 87
Circulatory System: Angiosarcoma (b) 3/50(6) 1/50(2)
P Values (c),(d) N.S. N.S.
Relative Risk (Control) (f) 0.333 Lower Limit 0.006 Upper Limit 3.983
Weeks to First Observed Tumor 105 106
High Dose
7/49(14)
P=0.001(N)
0.311 0.126 0.667
79
7/49(14)
P=0.001(N)
0.311 0.126 0.667
79
1/49(2)
N.S.
0.340 0.007 4.062
105
43

Table 11. Analyses of the Incidence of Primary Tumors in Female Mice Fed Diets Containing Di(2-ethylhexyl)adipate (a)
(Continued)
Topography: Morphology
Liver: Hepatocellular Adenoma (b)
P Values (c) , (d)
Relative Risk (Control) (f) Lower Limit Upper Limit
Weeks to First Observed Tumor
Liver: Hepatocellular Carcinoma (b)
P Values ( c ) , ( d )
Departure from Linear Trend (e)
Relative Risk (Control) (f) Lower Limit Upper Limit
Weeks to First Observed Tumor
Liver: Hepatocellular Adenoma or Carcinoma (b)
P Values ( c ) , (d )
Departure from Linear Trend (e)
Relative Risk (Control) (f) Lower Limit Upper Limit
Weeks to First Observed Tumor
Control
2/50(4)
N.S.
106
1/50(2)
P=0.003
P=0.022
106
3/50(6)
P=0.001
P=0.024
106
Low Dose
5/50(10)
N.S.
2.500 0.432 25.286
103
14/50(28)
K0.001
14.000 2.274
575.964
85
19/50(38)
P<0.001
6.333 2.034 31.235
85
High Dose
6/49(12)
N.S.
3.061 0.581 29.826
84
12/49(24)
P=0.001
12.245 1.931
509.639
79
18/49(37)
P<0.001
6.122 1.949 30.333
79
44

Table 11. Analyses of the Incidence of Primary Tumors in Female Mice Fed Diets Containing Di(2-ethylhexyl)adipate (a)
(Continued)
Low High Topography: Morphology Control Dose Dose
Pituitary: Adenoma, NOS (b) 8/39(21) 6/37(16) 0/39(0)
P Values ( c ) , ( d ) P=0.005(N) N.S. P=0.003(N)
Relative Risk (Control) (f) 0.791 0.000 Lower Limit 0.250 0.000 Upper Limit 2.339 0.433
Weeks to First Observed Tumor 106 105
(a) Dosed groups received doses of 12,000 or 25,000 ppm in feed. (b) Number of tumor-bearing animaIs/number of animals examined at site (per
cent). (c) Beneath the incidence of tumors in the control group is the probability
level for the Cochran-Armitage test when P is less than 0.05*; otherwise, not significant (N.S.) is indicated. Beneath the incidence of tumors in a dosed group is the probability level for the Fisher exact test for the comparison of that dosed group with the control group when P is less than 0.05; otherwise, not significant (N.S.) is indicated.
(d) A negative trend (N) indicates a lower incidence in a dosed group than in a control group.
(e) The probability level for departure from linear trend is given when P is less then 0.05 for any comparison.
(f) The 95 percent confidence interval of the relative risk between each dosed group and the control group.
45

46

V. DISCUSSION
Mean body weights of high-dose rats and mice of either sex were lower
than those of the controls throughout the study. No other clinical signs
were observed.
Interstitial cell tumors in the testes occurred in high-dose male rats
at an incidence significantly higher (P=0.013) than that in the controls;
however, since this type of lesion normally occurs at incidences approaching
100 per cent in aging F344 male rats (Goodman et al., 1979), the increased
incidence is probably not compound related.
Hepatocellular adenomas or carcinomas occurred in high-dose mice of
either sex and in low-dose female mice at incidences that were dose related
and significantly higher than those in the controls. The time to
observation of hepatocellular adenomas or carcinomas in the dosed female
mice, but not in dosed male mice, was significantly shorter than the time to
observation of these tumors in the controls. Because the incidence of
hepatocellular adenomas or carcinomas in the male high-dose group is not
greatly increased over that in the male B6C3F1 historical control mice in the
same laboratory and because the time to observation of tumors in dosed
groups as compared with the control group was not significantly different ,
the association of liver tumors in the males with administration of
di(2-ethylhexyl)adipate is not considered conclusive.
Di(2-ethylhexyl)adipate was tested in the same room with three other
chemicals—butyl benzyl phthalate, di(2-ethylhexyl)phthalate, and guar gum—
undergoing carcinogenesis bioassays. Butyl benzyl phthalate (NCI/NTP, in
press) was probably carcinogenic for female F344 rats, causing
myelomonocytic leukemia; di(2-ethylhexyl)phthalate (NCI/NTP, in press-a) was
carcinogenic for female F344 rats, causing hepatocellular carcinomas and
neoplastic nodules and for male and female B6C3F1 mice, causing
hepatocellular carcinomas; guar gum (NCI/NTP, in press-b) was not
carcinogenic for male or female F344 rats or B6C3F1 mice.
Although chemical cross-contamination among groups cannot be excluded
completely, the responses in the separate testing experiments persuade that
any adjacent chemical ef fec t was absent or minimal. The results of these
other studies support the conclusion that di(2-ethylhexyl)adipate caused
47

carcinomas of the liver in female mice and adenomas of the liver in male
mice. These data stand independently because the guar gum exposed groups
did not show any compound-related tumor development, because butyl benzyl
phthalate exposed animals did not exhibit any liver tumor induction, and
because di(2-ethylhexyl)phthalate induced, in addition to liver carcinomas
in female mice, these same lesions in female rats and in male mice.
48
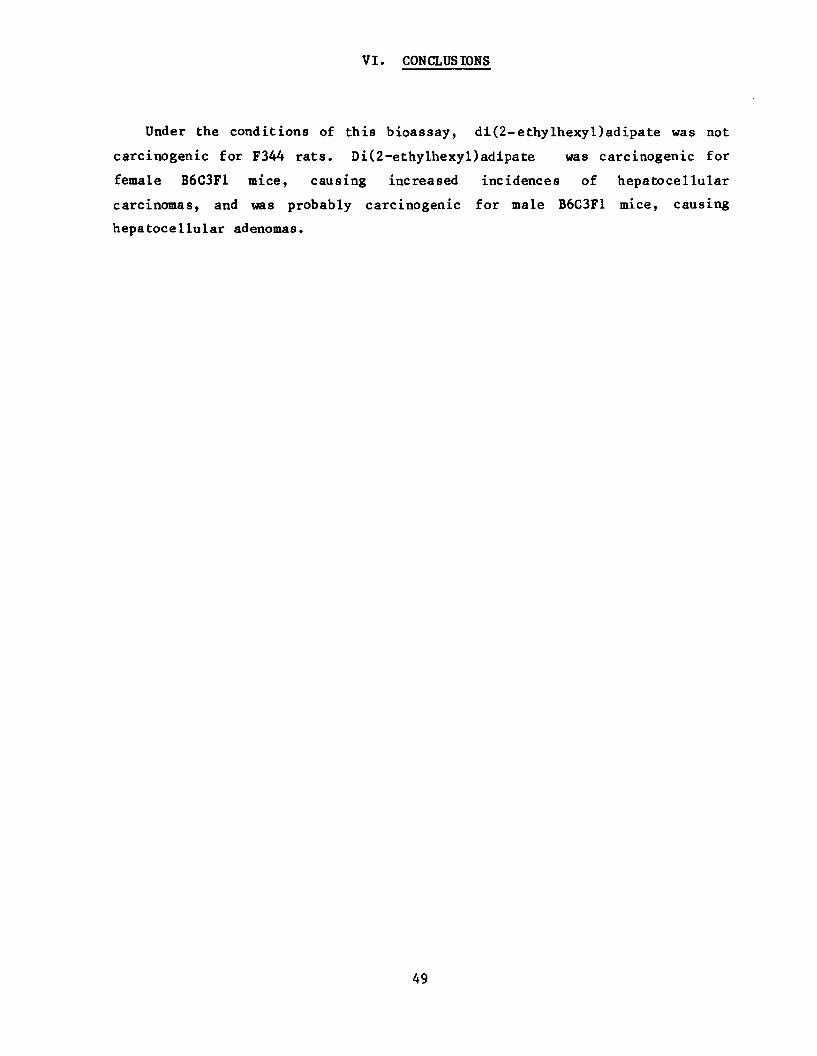
VI. CONCLUSIONS
Under the conditions of this bioassay, di(2-ethylhexyl)adipate was not
carcinogenic for F344 rats. Di(2-ethylhexyl)adipate was carcinogenic for
female B6C3F1 mice, causing increased incidences of hepatocellular
carcinomas, and was probably carcinogenic for male B6C3F1 mice, causing
hepatocellular adenomas.
49

50
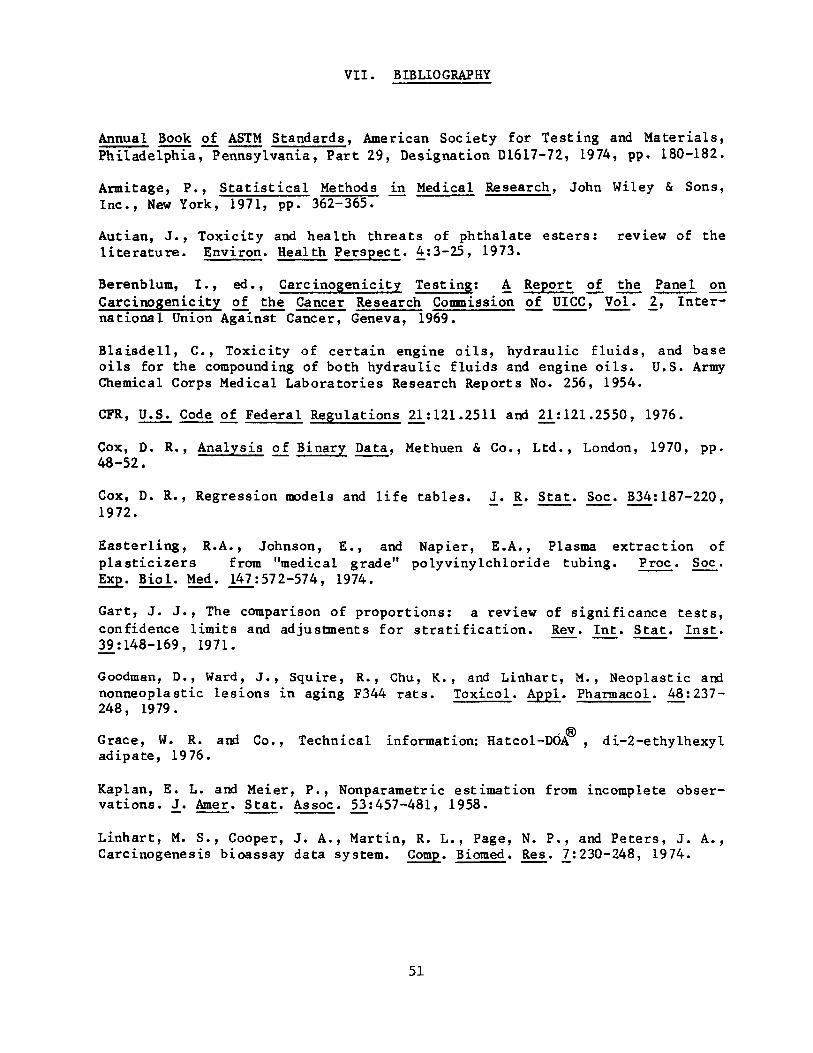
VII. BIBLIOGRAPHY
Annual Book of_ ASTM Standards, American Society for Testing and Materials, Philadelphia, Pennsylvania, Part 29, Designation D1617-72, 1974, pp. 180-182.
Armitage, P., StatisticalInc., New York, 1971, pp.
Methods 362-365.
in Medical Research, John Wiley & Sons,
Autian, J., Toxicityliterature. Environ.
and health threats of ph Health Perspect. 4_:3-25,
thalate 1973.
esters: review of the
Berenblum, I., ed., Carcinogenicity Testing; A Report of_ the Panel on Carcinogenicity of_ the Cancer Research Commission o_f UICC, Vol. 2, International Union Against Cancer, Geneva, 1969.
Blaisdell, C., Toxicity of certain engine oils, hydraulic fluids, and base oils for the compounding of both hydraulic fluids and engine oils. U.S. Army Chemical Corps Medical Laboratories Research Reports No. 256, 1954.
CFR, U.S. Code of Federal Regulations 21:121.2511 and 21^:121.2550, 1976.
Cox, D. R., Analysis of Binary Data, Methuen & Co., Ltd., London, 1970, pp. 48-52.
Cox, D. R., Regression models and life tables. J_. R. Stat. Soc. 634:187-220, 1972.
Easterling, R.A., Johnson, E., and Napier, E.A., Plasma extraction of plasticizers from "medical grade" polyvinylchloride tubing. Proc. Soc. Exp. Biol. Med. jA7_:572-574, 1974.
Gart, J. J., The comparison of proportions: a review of significance tests, confidence limits and adjustments for stratification. Rev. Int. Stat. Inst. 39:148-169, 1971.
Goodman, D. , Ward, J., Squire, R. , Chu, K . , and Linhart, M . , Neoplastic and nonneoplastic lesions in aging F344 rats. Toxicol. Appl. Pharmacol. 48:237248, 1979.
Grace, W. R. and Co., Technical information: Hatcol-DOA , di-2-ethylhexyl adipate, 1976.
Kaplan, E. L. and Meier, P., Nonparametric estimation from incomplete observations. J. Amer. Stat. Assoc. 53^457-481, 1958.
Linhart, M. S., Cooper, J. A. , Martin, R. L., Page, N. P., and Peters, J. A. , Careinogenesis bioassay data system. Comp. Biomed. Res. 7.' 230-248, 1974.
51
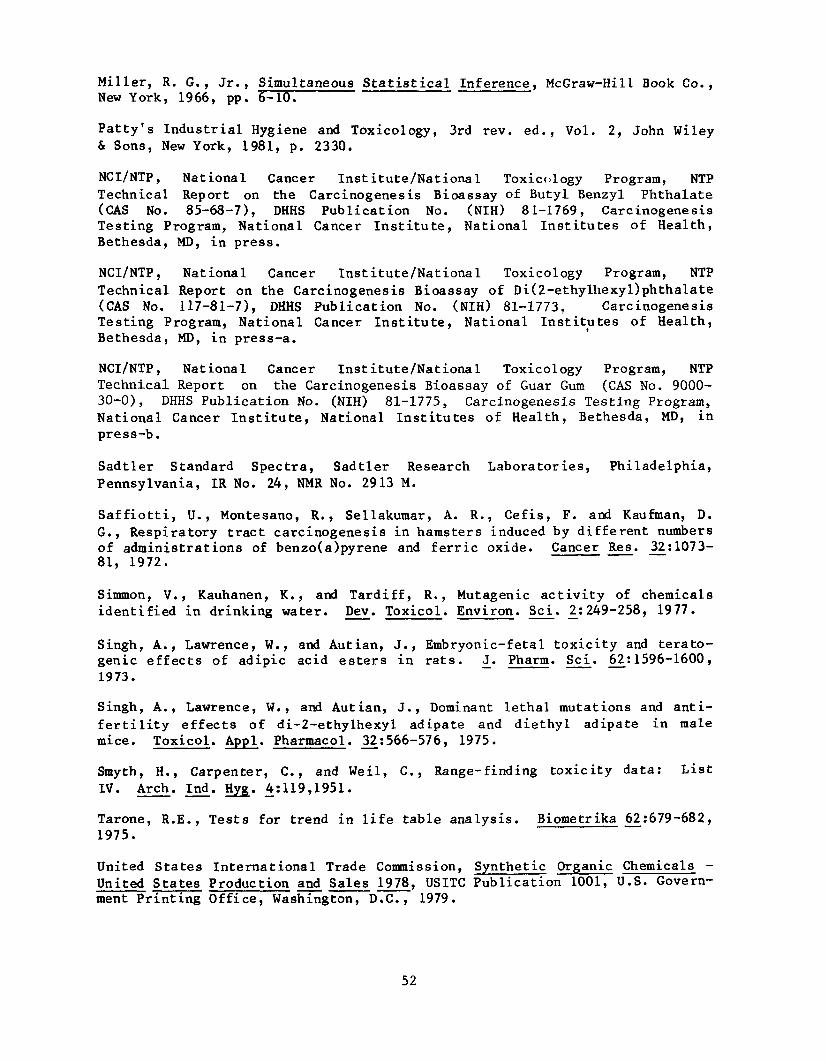
Miller, R. G., Jr., Simultaneous Statistical Inference, McGraw-Hill Book Co., New York, 1966, pp. 6-10.
Patty's Industrial Hygiene and Toxicology, 3rd rev. ed., Vol. 2, John Wiley & Sons, New York, 1981, p. 2330.
NCI/NTP, National Cancer Institute/National Toxicology Program, NTP Technical Report on the Carcinogenesis Bioassay of Butyl Benzyl Phthalate (CAS No. 85-68-7), DHHS Publication No. (NIH) 81-1769, Carcinogenesis Testing Program, National Cancer Institute, National Institutes of Health, Bethesda, MD, in press.
NCI/NTP, National Cancer Institute/National Toxicology Program, NTP Technical Report on the Carcinogenesis Bioassay of Di(2-ethylhexyl)phthalate (CAS No. 117-81-7), DHHS Publication No. (NIH) 81-1773, Carcinogenesis Testing Program, National Cancer Institute, National Institutes of Health, Bethesda, MD, in press-a.
NCI/NTP, National Cancer Institute/National Toxicology Program, NTP Technical Report on the Carcinogenesis Bioassay of Guar Gum (CAS No. 900030-0), DHHS Publication No. (NIH) 81-1775, Carcinogenesis Testing Program, National Cancer Institute, National Institutes of Health, Bethesda, MD, in press-b.
Sadtler Standard Spectra, Sadtler Research Laboratories, Philadelphia, Pennsylvania, IR No. 24, NMR No. 2913 M.
Saffiott i , U. , Montesano, R., Sellakumar, A. R. , Cefis, F. and Kaufman, D. G. , Respiratory tract Carcinogenesis in hamsters induced by different numbers of administrations of benzo(a)pyrene and ferric oxide. Cancer Res. 32:107381, 1972.
Simmon, V. , Kauhanen, K. , and Tardiff , R., Mutagenic activity of chemicals identified in drinking water. Dev. Toxicol. Environ. Sci. 2^:249-258, 1977.
Singh, A., Lawrence, W., and Autian, J., Embryonic-fetal toxicity and teratogenic effects of adipic acid esters in rats. J_. Pharm. Sci. 62; 1596-1600, 1973.
Singh, A., Lawrence, W . , and Autian, J., Dominant lethal mutations and antifertility effects of di-2-ethylhexyl adipate and diethyl adipate in male mice. Toxicol. Appl. Pharmacol. 32_:566-576, 1975.
Smyth, H., Carpenter, C., and Weil, C., Range-finding toxicity data: List IV. Arch. Ind. Hyg. 4:119,1951.
Tarone, R.E., Tests for trend in life table analysis. Biometrika 62:679-682, 1975.
United States International Trade Commission, Synthetic Organic Chemicals United States Production and Sales 1978, USITC Publication 1001, U.S. Government Printing Office, Washington, D.C., 1979.
52

Vandervort, R. and Brooks, S., Polyvinyl chloride film thermal decomposition products as an occupational illness. J_. Occup. Med. Jj):188-191, 1977.
Ward, J. M., Goodman, D. G., Griesemer, R. A., Hardisty, J. F., Schueler, R. L., Squire, R. A., and Strandberg, J. D., Quality assurance for pathology in rodent carcinogenesis tests. J. Environ. Pathol. Toxicol. 2:371-378, 1978.
53

54

APPENDIX A
SUMMARY OF THE INCIDENCE OF NEOPLASMS IN RATS FED DIETS CONTAINING DI(2-ETHYLHEXYL)ADIPATE
55

56
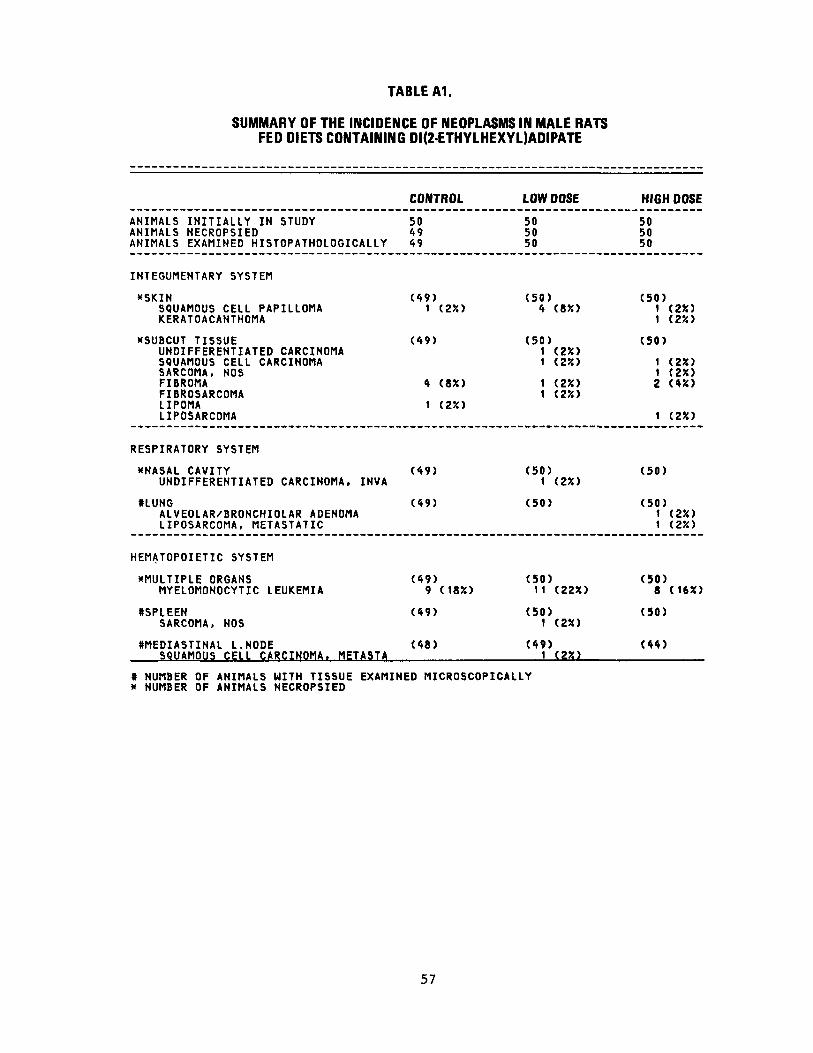
TABLE A1.
SUMMARY OF THE INCIDENCE OF NEOPLASMS IN MALE RATS FED DIETS CONTAINING DI(2-ETHYLHEXYL)ADIPATE
CONTROL LOW DOSE HIGH DOSE
ANIMALS INITIALLY IN STUDY 50 50 50 ANIMALS NECROPSIED 49 50 50 ANIMALS EXAMINED HISTOPATHOLOGICALLY 49 50 50
INTEGUMENTARY SYSTEM
*SKIN SQUAMOUS CELL PAPILLOMA KERATOACANTHOMA
(49)1 (2%)
(50)4 (8*)
(50)1 (2X) 1 (2%)
KSUBCUT TISSUE UNDIFFERENTIATED CARCINOMA SQUAMOUS CELL CARCINOMA SARCOMA, NOS FIBROMA FIBROSARCOMA LIPOMA LIPOSARCOMA
(49)
4 (85O
1 (250
(50)1 (23O 1 (25O
1 (2X) 1 (2JO
(50)
1 (2X) 1 (250 2 (4X)
1 (250
RESPIRATORY SYSTEM
XNASAL CAVITY UNDIFFERENTIATED CARCINOMA, INVA
(49) (50)1 (23O
(50)
SLUNG ALVEOLAR/BRONCHIOLAR ADENOMA LIPOSARCOMA, METASTATIC
(49) (50) (50)1 (2%) 1 (25O
HEMATOPOIETIC SYSTEM
^MULTIPLE ORGANS MYELOMONOCYTIC LEUKEMIA
(49)9 (1830
(50)11 (22X)
(50)8 (16X)
*SPLEEN SARCOMA, NOS
(49) (50)1 (250
(50)
«MEDIASTINAL L.NODE SQUAMOUS CELL CARCINOMA, METASTA
(48) (49)1 (2JO
(44)
« NUMBER OF ANIMALS WITH TISSUE EXAMINED MICROSCOPICALLY x NUMBER OF ANIMALS NECROPSIED
57
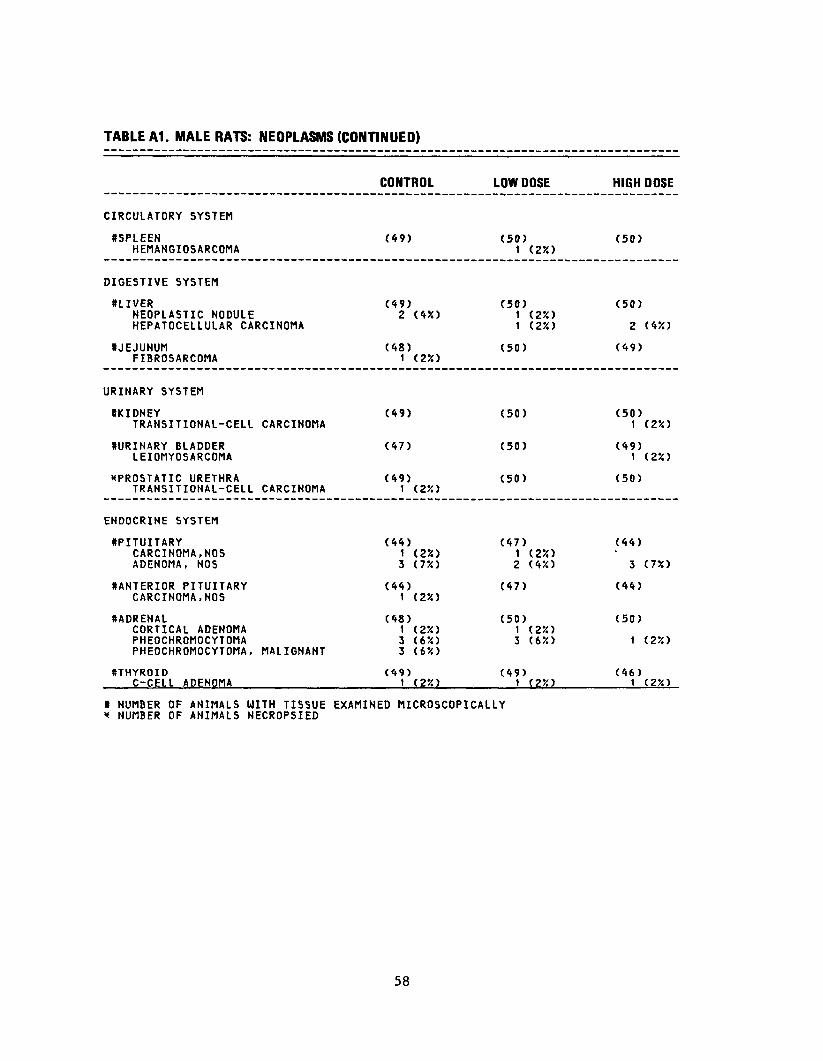
TABLE A1. MALE RATS: NEOPLASMS (CONTINUED)
CONTROL LOW DOSE HIGH DOSE
CIRCULATORY SYSTEM
•SPLEEN HEMANGIOSARCOMA
(49) (50) 1 (2X)
(50)
DIGESTIVE SYSTEM
•LIVER NEOPLASTIC NODULE HEPATOCELLULAR CARCINOMA
(49)2 (4X)
(50) 1 (2%) 1 (25O
(50)
2 (45()
•JEJUNUM FIBROSARCOMA
(48)1 (25O
(50) (49)
URINARY SYSTEM
•KIDNEY TRANSITIONAL-CELL CARCINOMA
(49) (50) (50) 1 (2X)
•URINARY BLADDER LEIOMYOSARCOMA
(47) (50) (49) 1 (2*)
*PROSTATIC URETHRA TRANSITIONAL-CELL CARCINOMA
(49) 1 (25O
(50) (50)
ENDOCRINE SYSTEM
•PITUITARY CARCINOMA, NOS ADENOMA, NOS
(44) 1 (2%) 3 (75O
(47)1 (2%) 2 (4X)
(44)• 3 (7X)
•ANTERIOR PITUITARY CARCINOMA, NOS
(44) 1 (2%)
(47) (44)
•ADRENAL CORTICAL ADENOMA PHEOCHROMOCYTOMA PHEOCHROMOCYTOMA, MALIGNANT
(48) 1 (2X) 3 (65O 3 (6X)
(50)1 (2%) 3 (6X)
(50)
1 (25O
•THYROID C-CELL ADENOMA
(49) t (2X)
(49)1 (2%)
(46)1 (ZX)
» NUMBER OF ANIMALS WITH TISSUE EXAMINED MICROSCOPICALLY * NUMBER OF ANIMALS NECROPSIED
58
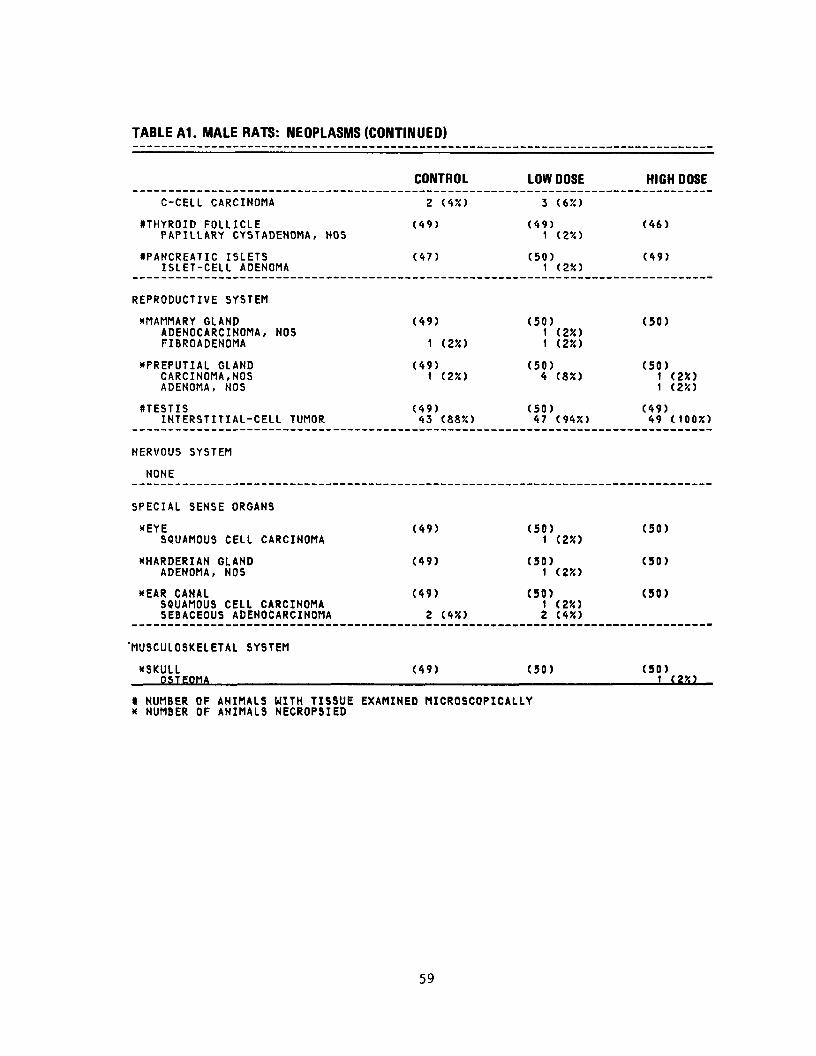
TABLE A1. MALE RATS: NEOPLASMS (CONTINUED)
CONTROL LOW DOSE HIGH DOSE
C-CELL CARCINOMA
•THYROID FOLLICLE PAPILLARY CYSTADENOMA, NOS
•PANCREATIC ISLETS ISLET-CELL ADENOMA
2 (4X)
(49)
(47)
3 (6X)
(49)1 (2X)
(50)1 (2X)
(46)
(49)
REPRODUCTIVE SYSTEM
XMAMMARY GLAND ADENOCARCINOMA, NOS FIBROADENOMA
XPREPUTIAL GLAND CARCINOMA, NOS ADENOMA, NOS
•TESTIS INTERSTITIAL-CELL TUMOR
(49)
1 (23O
(49)1 (2X)
(49)43 (88X)
(50)1 (25O 1 (2X)
(50)4 (8%)
(50)47 (94X)
(50)
(50)1 (2X) 1 (2K)
(49)49 (10055)
NERVOUS SYSTEM
NONE
SPECIAL SENSE ORGANS
XEYE SQUAMOUS CELL CARCINOMA
XHARDERIAN GLAND ADENOMA, NOS
*EAR CANAL SQUAMOUS CELL CARCINOMA SEBACEOUS ADENOCARCINOMA
(49)
(49)
(49)
2 (4X)
(50)1 (2X)
(50) t (2%)
(50)1 (2X) 2 (<*'/.)
(50)
(50)
(50)
MUSCULOSKELETAL SYSTEM
XSKULL OSTEOMA
(49) (50)
* NUMBER OF ANIMALS WITH TISSUE EXAMINED MICROSCOPICALLY * NUMBER OF ANIMALS NECROPSIED
(50)1 (2%)
59

TABLE A1. MALE RATS: NEOPLASMS (CONTINUED)
CONTROL LOW DOSE
XMANDIBLE (49) (50) FIBROSARCOMA 1 (2X) ODONTOMA 1 (2X)
BODY CAVITIES
^ABDOMINAL CAVITY (49) (50) SARCOMA, NOS
*TUNICA VAGINALIS (49) (50) MESOTHELIOMA, NOS 1 (2%)
ALL OTHER SYSTEMS
((MULTIPLE ORGANS (49) (50) MESOTHELIOMA, NOS MESOTHELIOMA, MALIGNANT 1 (2%)
ANIMAL DISPOSITION SUMMARY
ANIMALS INITIALLY IN STUDY 50 50 NATURAL DEATHS 8 8 MORIBUND SACRIFICE 7 8 SCHEDULED SACRIFICE ACCIDENTALLY KILLED TERMINAL SACRIFICE ANIMAL MISSING
a INCLUDES AUTOLYZED ANIMALS
» NUMBER OF ANIMALS WITH TISSUE EXAMINED MICROSCOPICALLY x NUMBER OF ANIMALS NECROPSIED
HIGH DOSE
(50)
(50) 1 (25O
(50) 2 (450
(50) 1 (25O
50 9 1
60
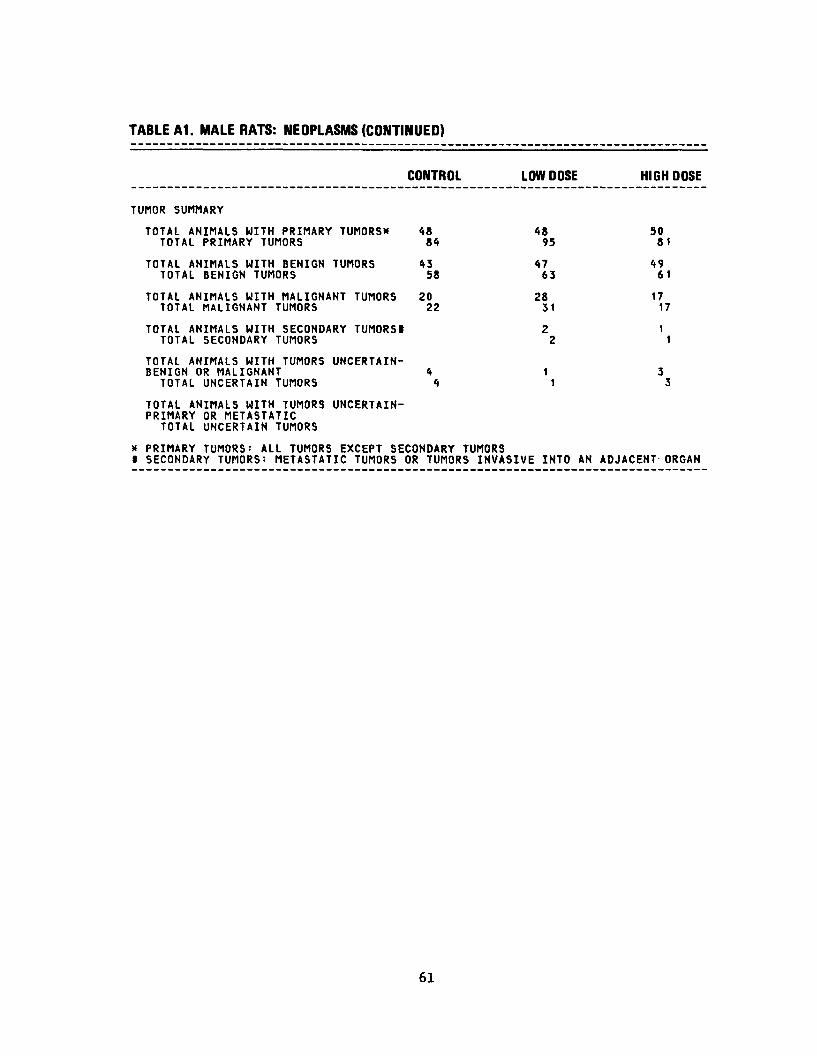
TABLE A1. MALE RATS: NEOPLASMS (CONTINUED)
CONTROL LOW DOSE HIGH DOSE
TUMOR SUMMARY
TOTAL ANIMALS WITH PRIMARY TUMORS* 48 48 50 TOTAL PRIMARY TUMORS 84 95 81
TOTAL ANIMALS WITH BENIGN TUMORS 43 47 49 TOTAL BENIGN TUMORS 58 63 61
TOTAL ANIMALS WITH MALIGNANT TUMORS 20 28 17 TOTAL MALIGNANT TUMORS 22 31 17
TOTAL ANIMALS WITH SECONDARY TUMORS! 2 1 TOTAL SECONDARY TUMORS 2 1
TOTAL ANIMALS WITH TUMORS UNCERTAINBENIGN OR MALIGNANT 4 1 3
TOTAL UNCERTAIN TUMORS 4 1 3
TOTAL ANIMALS WITH TUMORS UNCERTAINPRIMARY OR METASTATIC
TOTAL UNCERTAIN TUMORS
* PRIMARY TUMORS: ALL TUMORS EXCEPT SECONDARY TUMORS * SECONDARY TUMORS: METASTATIC TUMORS OR TUMORS INVASIVE INTO AN ADJACENT ORGAN
61
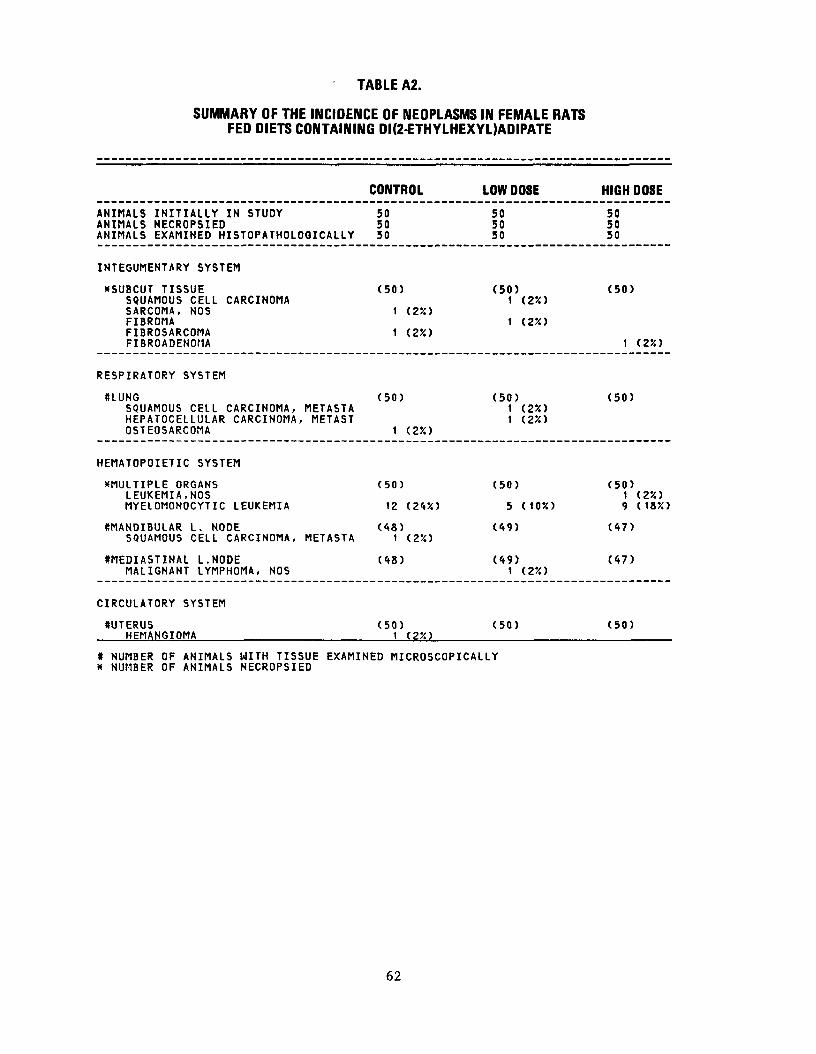
TABLE A2.
SUMMARY OF THE INCIDENCE OF NEOPLASMS IN FEMALE RATS FED DIETS CONTAINING DI(2-ETHYLHEXYL)ADIPATE
CONTROL LOW DOSE
ANIMALS INITIALLY IN STUDY 50 50 ANIMALS NECROPSIED 50 50 ANIMALS EXAMINED HISTOPATHOLOGICALLY 50 50
INTEGUMENTARY SYSTEM
KSUBCUT TISSUE (50) (50)SQUAMOUS CELL CARCINOMA 1 (2%) SARCOMA, NOS 1 (25O FIBROMA 1 (250 FIBROSARCOMA 1 (2X) FIBROADENOHA
RESPIRATORY SYSTEM
SLUNG (50) (50)SQUAMOUS CELL CARCINOMA, METASTA 1 (2%) HEPATOCELLULAR CARCINOMA, METAST 1 (2X) OSTEOSARCOMA 1 (23O
HEMATOPOIETIC SYSTEM
^MULTIPLE ORGANS (50) (50) LEUKEMIA, NOS MYELOMONOCYTIC LEUKEMIA 12 (24X) 5 (10X)
SMANDIBULAR L. NODE (48) (49) SQUAMOUS CELL CARCINOMA, METASTA 1 (2%)
#MEDIASTINAL L.NODE (48) (49)MALIGNANT LYMPHOMA, NOS 1 (2X)
CIRCULATORY SYSTEM
•UTERUS (50) (50) HEMANGIOMA 1 (22)
t NUMBER OF ANIMALS WITH TISSUE EXAMINED MICROSCOPICALLY * NUMBER OF ANIMALS NECROPSIED
HIGH DOSE
50 50 50
(50)
1 (25O
(50)
(50)1 (2%) 9 (18%)
(47)
(47)
(50)
62
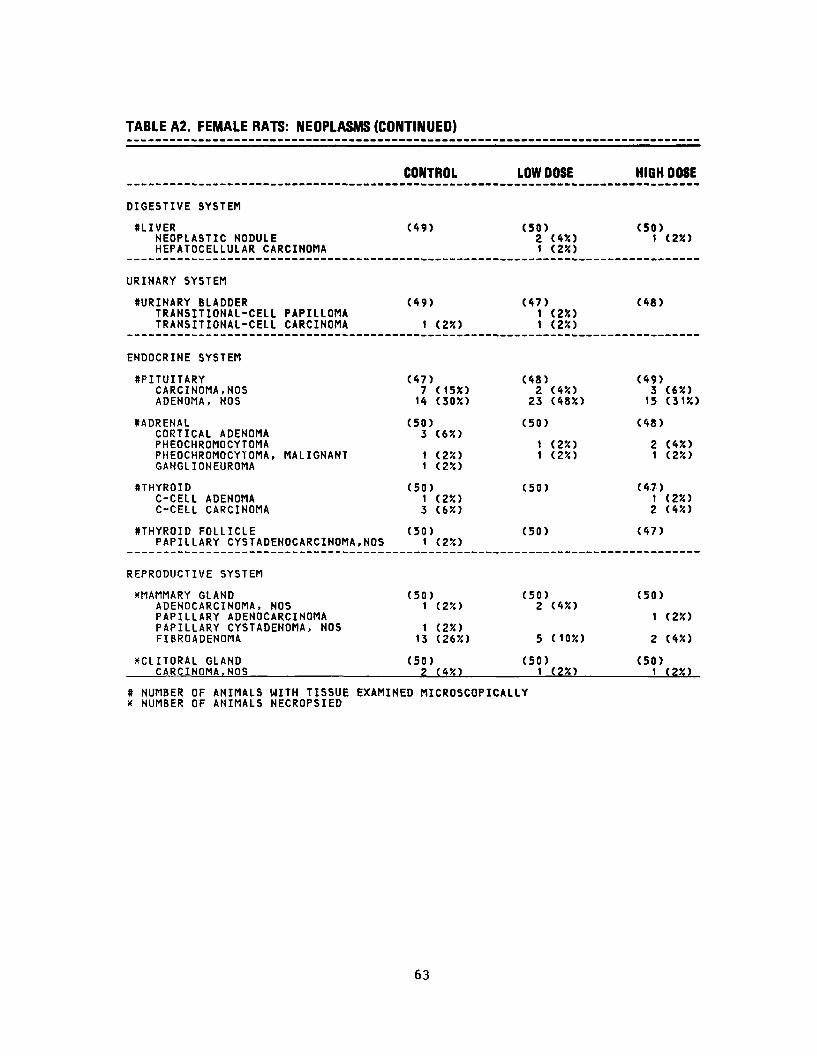
TABLE A2. FEMALE RATS: NEOPLASMS (CONTINUED)
DIGESTIVE SYSTEM
OLIVER NEOPLASTIC NODULE HEPATOCELLULAR CARCINOMA
URINARY SYSTEM
•URINARY BLADDER TRANSITIONAL-CELL PAPILLOMA TRANSITIONAL-CELL CARCINOMA
ENDOCRINE SYSTEM
SPITUITARY CARCINOMA, NOS ADENOMA, NOS
#ADRENAL CORTICAL ADENOMA PHEOCHROMOCYTOMA PHEOCHROMOCYTOMA, MALIGNANT GANGLIONEUROMA
*THYROID C-CELL ADENOMA C-CELL CARCINOMA
8THYROID FOLLICLE PAPILLARY CYSTADENOCARCINOMA, NOS
REPRODUCTIVE SYSTEM
XMAMMARY GLAND ADENOCARCINOMA, NOS PAPILLARY ADENOCARCINOMA PAPILLARY CYSTADENOMA, NOS FIBROADENOMA
KCLITORAL GLAND CARCINOMA, NOS
CONTROL LOW DOSE HIGH DOSE
(49) (50)2 (45O 1 (25O
(50)1 (2%)
(49)
1 (25O
(47) 1 (2%) 1 (2JO
(48)
(47) 7 (1555) 14 (305O
(48)2 (4%) 23 (485O
(49)3 (6%) 15 (3150
(50)3 (65O
1 (25O 1 (2%)
(50)
1 (2X) 1 (2X)
(48)
2 (45O 1 (25O
(50)1 (2%) 3 (65O
(50) (47)1 (250 2 (450
(50)1 (2%)
(50) (47)
(50)1 (2%)
1 (25O 13 (26%)
(50)2 (4%)
5 (1050
(50)
1 (250
2 (45O
(50)2 (45O
(50)1 (2%)
(50)1 (2%)
» NUMBER OF ANIMALS WITH TISSUE EXAMINED MICROSCOPICALLY x NUMBER OF ANIMALS NECROPSIED
63
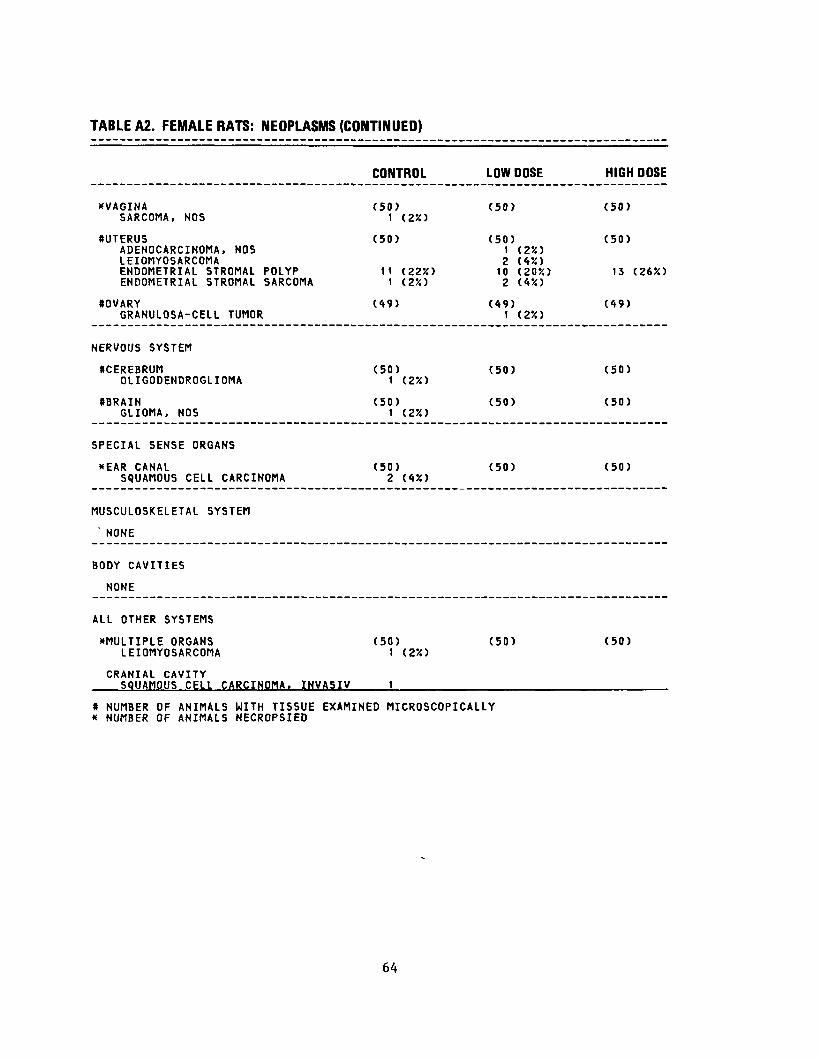
TABLE A2. FEMALE RATS: NEOPLASMS (CONTINUED)
*VAGINA SARCOMA, NOS
*UTERUS ADENOCARCINOMA, NOS LEIOMYOSARCOMA ENDOMETRIAL STROMAL POLYP ENDOMETRIAL STROMAL SARCOMA
*OVARY GRANULOSA-CELL TUMOR
NERVOUS SYSTEM
HCEREBRUM OLIGODENDROGLIOMA
OBRAIN GLIOMA, NOS
SPECIAL SENSE ORGANS
HEAR CANAL SQUAMOUS CELL CARCINOMA
MUSCULOSKELETAL SYSTEM
NONE
BODY CAVITIES
NONE
ALL OTHER SYSTEMS
^MULTIPLE ORGANS LEIOMYOSARCOMA
CRANIAL CAVITY SQUAMOUS CELL CARCINOMA. INVASIV
CONTROL LOW DOSE HIGH DOSE
(50)1 (2X)
(50) (50)
(50)
11 (22%) 1 (2%)
(50)1 (2%) 2 (4%) 10 (20%)2 (4%)
(50)
13 (26%)
(49) (49)1 (2%) (49)
(50) 1 (2%)
(50) (50)
(50) 1 (2%)
(50) (50)
(50) 2 (4%)
(50) (50)
(50) (50) (50) 1 (2%)
• NUMBER OF ANIMALS WITH TISSUE EXAMINED MICROSCOPICALLY * NUMBER OF ANIMALS NECROPSIED
64
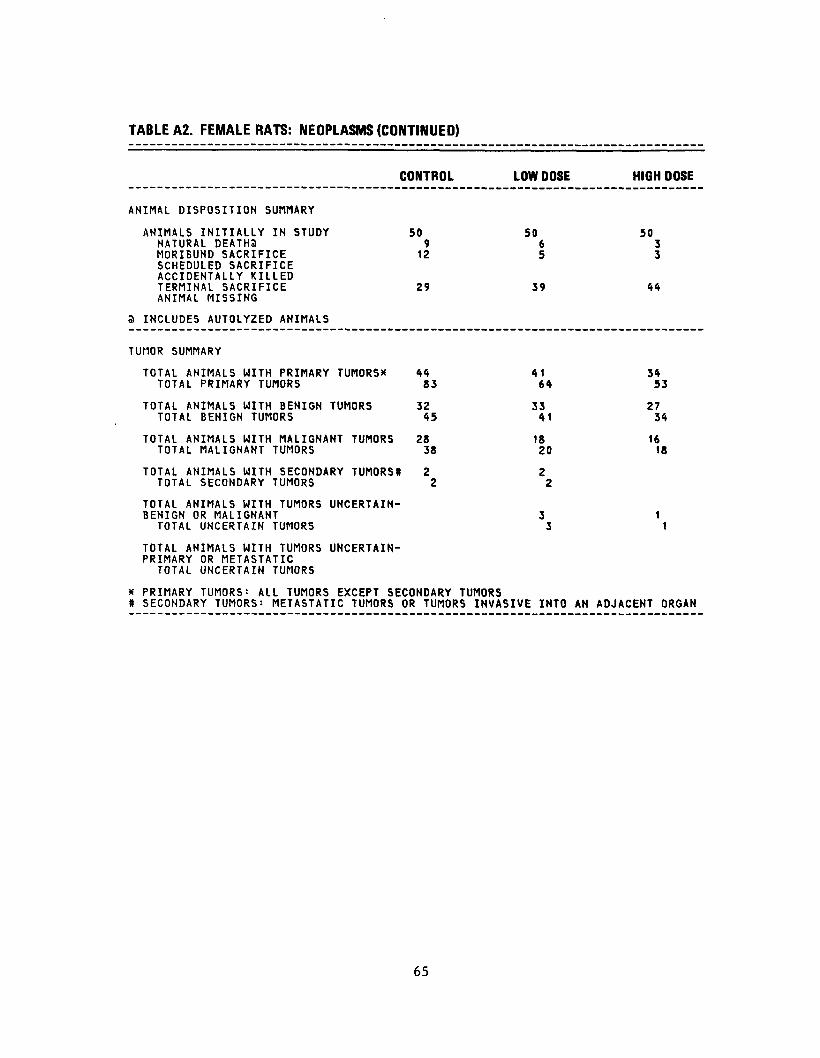
TABLE A2. FEMALE RATS: NEOPLASMS (CONTINUED)
CONTROL LOW DOSE HIGH DOSE
ANIMAL DISPOSITION SUMMARY
ANIMALS INITIALLY IN STUDY 50 50 50 NATURAL DEATHS 9 6 3 MORIBUND SACRIFICE 12 5 3 SCHEDULED SACRIFICE ACCIDENTALLY KILLED TERMINAL SACRIFICE 29 39 44 ANIMAL MISSING
3 INCLUDES AUTOLYZED ANIMALS
TUMOR SUMMARY
TOTAL ANIMALS WITH PRIMARY TUMORS* 44 41 34 TOTAL PRIMARY TUMORS 83 64 53
TOTAL ANIMALS WITH BENIGN TUMORS 32 33 27 TOTAL BENIGN TUMORS 45 41 34
TOTAL ANIMALS WITH MALIGNANT TUMORS 28 18 16 TOTAL MALIGNANT TUMORS 38 20 18
TOTAL ANIMALS WITH SECONDARY TUMORSf 2 2 TOTAL SECONDARY TUMORS 2 2
TOTAL ANIMALS WITH TUMORS UNCERTAINBENIGN OR MALIGNANT 3 1
TOTAL UNCERTAIN TUMORS 3 1
TOTAL ANIMALS WITH TUMORS UNCERTAINPRIMARY OR METASTATIC
TOTAL UNCERTAIN TUMORS
* PRIMARY TUMORS: ALL TUMORS EXCEPT SECONDARY TUMORS » SECONDARY TUMORS: METASTATIC TUMORS OR TUMORS INVASIVE INTO AN ADJACENT ORGAN
65

66
APPENDIX B
SUMMARY OF THE INCIDENCE OF NEOPLASMS IN MICE FED DIETS CONTAINING DI(2-ETHYLHEXYL)ADIPATE
67

68
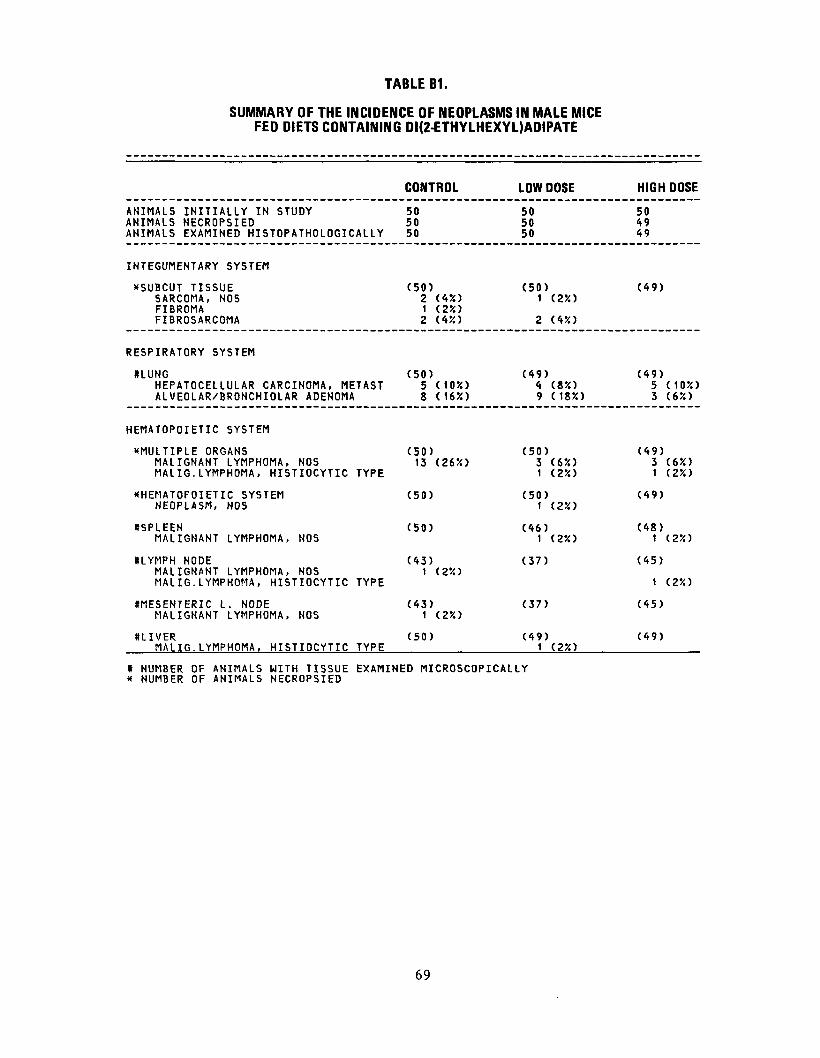
TABLE B1.
SUMMARY OF THE INCIDENCE OF NEOPLASMS IN MALE MICE FED DIETS CONTAINING DI(2-ETHYLHEXYL)ADIPATE
CONTROL LOW DOSE HIGH DOSE
ANIMALS INITIALLY IN STUDY 50 50 50 ANIMALS NECROPSIED 50 50 49 ANIMALS EXAMINED HISTOPATHOLOGICALLY 50 50 49
INTEGUMENTARY SYSTEM
*SUBCUT TISSUE (50) (50)SARCOMA, NOS 2 (4%) 1 (2%) FIBROMA 1 (2%) FIBROSARCOMA 2 (4%) 2 (4%)
(49)
RESPIRATORY SYSTEM
SLUNG (50) (49)HEPATOCELLULAR CARCINOMA, METAST 5 (10%) 4 (8%) ALVEOLAR/BRONCHIOLAR ADENOMA 8 (16%) 9 (18%)
(49)5 (10%) 3 (6%)
HEMATOPOIETIC SYSTEM
"MULTIPLE ORGANS (50) (50)MALIGNANT LYMPHOMA, NOS 13 (26%) 3 (6%) MALIG.LYMPHOMA, HISTIOCYTIC TYPE 1 (2%)
(49)3 (6%) 1 (2%)
XHEMATOPOIETIC SYSTEM (50) (50)NEOPLASM, NOS 1 (2%)
(49)
SSPLEEN (50) (46)MALIGNANT LYMPHOMA, NOS 1 (2%)
(48) 1 (2%)
HYMPH NODE (43) (37) MALIGNANT LYMPHOMA, NOS 1 (2%) MALIG.LYMPHOMA, HISTIOCYTIC TYPE
(45)
1 (2%)
SMESENTERIC L. NODE (43) (37) MALIGNANT LYMPHOMA, NOS 1 (2%)
(45)
SLIVER (50) (49) MALIG.LYMPHOMA, HISTIOCYTIC TYPE 1 (2%)
(49)
* NUMBER OF ANIMALS WITH TISSUE EXAMINED MICROSCOPICALLY * NUMBER OF ANIMALS NECROPSIED
69
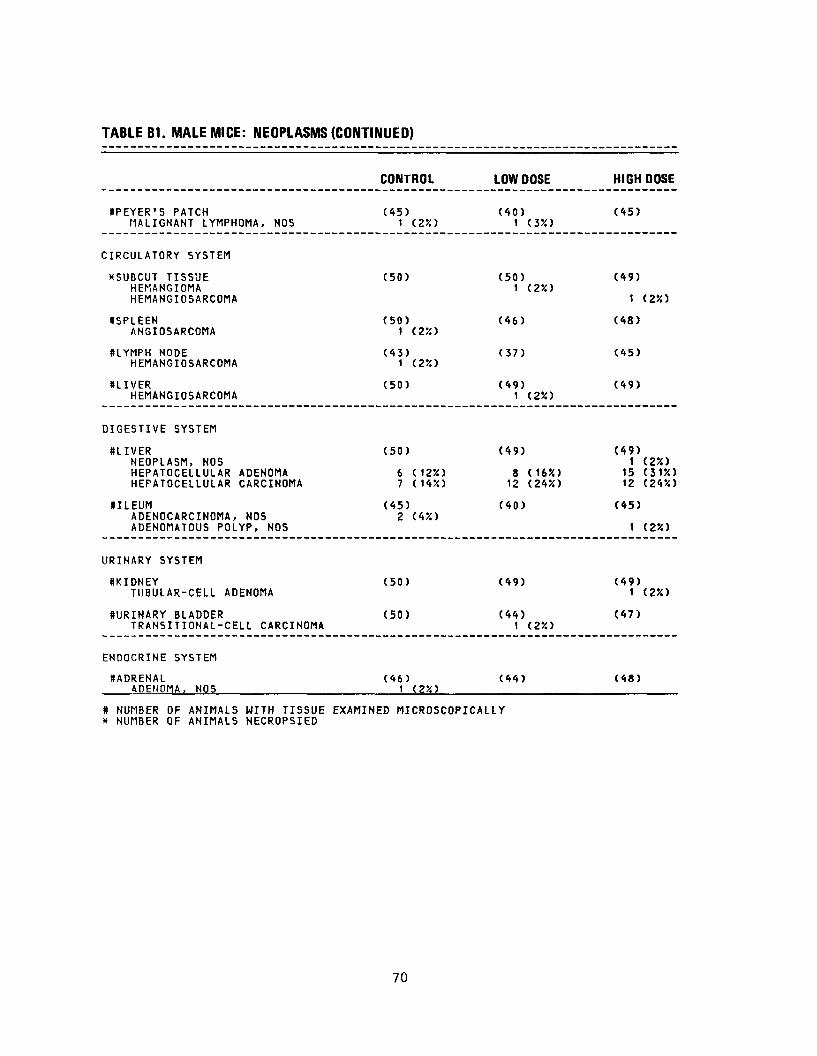
TABLE B1. MALE MICE: NEOPLASMS (CONTINUED)
CONTROL LOW DOSE
RPEYER'S PATCH (45) (40)MALIGNANT LYMPHOMA, N05 1 (2X) 1 (3X)
CIRCULATORY SYSTEM
*SUBCUT TISSUE (50) (50)HEMANGIOMA 1 (2X) HEMANGIOSARCOMA
HSPLEEN (50) (46) ANGIOSARCOMA 1 (2%)
SLYMPH NODE (43) (37) HEMANGIOSARCOMA 1 (2%)
SLIVER (50) (49) HEMANGIOSARCOMA 1 (2%)
DIGESTIVE SYSTEM
#LIVER (50) (49) NEOPLASM, NOS HEPATOCELLULAR ADENOMA 6 (12%) 8 (16%) HEPATOCELLULAR CARCINOMA 7 ( H3O 12 (245O
dlLEUM (45) (40) ADENOCARCINOMA, NOS 2 (45O ADENOMATOUS POLYP, NOS
URINARY SYSTEM
SKIDNEY (50) (49) TUBULAR-CELL ADENOMA
SURINARY BLADDER (50) (44)TRANSITIONAL-CELL CARCINOMA 1 (2X)
ENDOCRINE SYSTEM
SADRENAL (46) (44) ADENOMA, NOS 1 (2%)
# NUMBER OF ANIMALS WITH TISSUE EXAMINED MICROSCOPICALLY * NUMBER OF ANIMALS NECROPSIED
HIGH DOSE
(45)
(49)
1 (2%)
(48)
(45)
(49)
(49)1 (25C)
15 (31X) 12 (24%)
(45)
1 (2%)
(49)1 (2%)
(47)
(48)
70
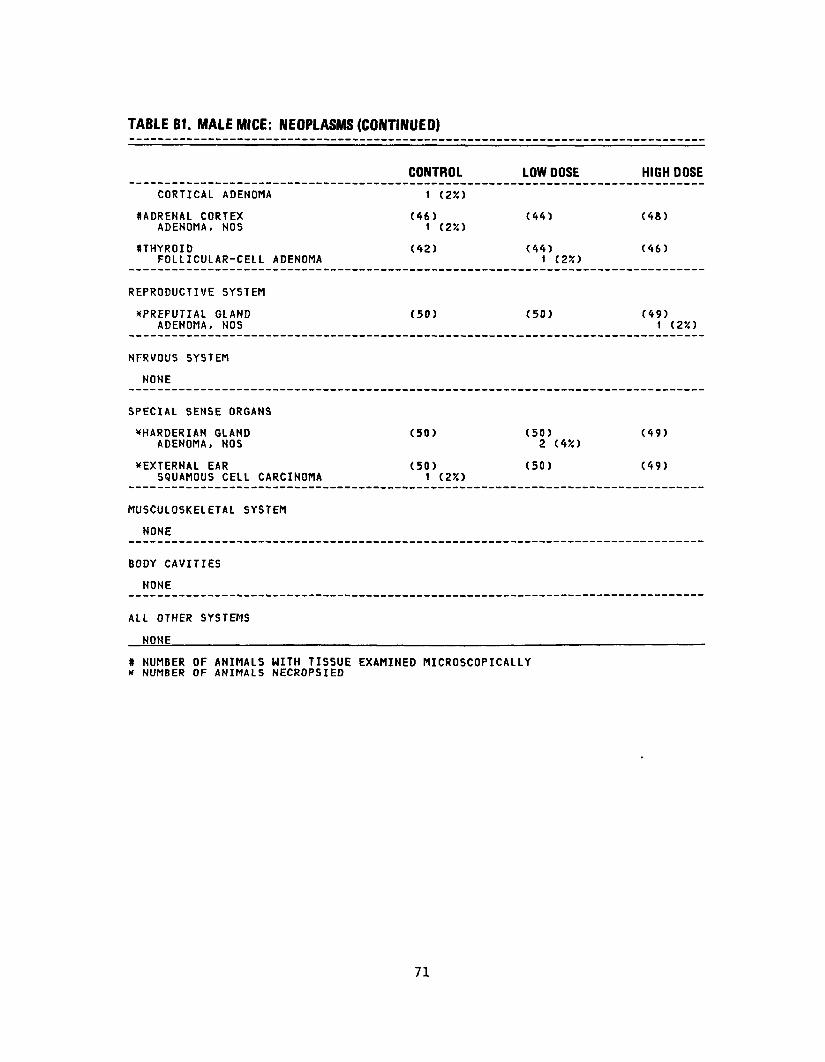
TABLE B1. MALE MICE: NEOPLASMS (CONTINUED)
CONTROL LOW DOSE HIGH DOSE
CORTICAL ADENOMA 1 (2X)
HADRENAL CORTEX (46) (44) (48) ADENOMA, NOS 1 (2%)
HTHYROID (42) (44) (46) FOLLICULAR-CELL ADENOMA 1 (25C)
REPRODUCTIVE SYSTEM
XPREPUTIAL GLAND (50) (50) (49) ADENOMA, NOS 1 (2%)
NERVOUS SYSTEM
NONE
SPECIAL SENSE ORGANS
XHARDERIAN GLAND (50) (50) (49) ADENOMA, NOS 2 (4*)
^EXTERNAL EAR (50) (50) (49) SQUAMOUS CELL CARCINOMA 1 (2%)
MUSCULOSKELETAL SYSTEM
NONE
BODY CAVITIES
NONE
ALL OTHER SYSTEMS
NONE
« NUMBER OF ANIMALS WITH TISSUE EXAMINED MICROSCOPICALLY * NUMBER OF ANIMALS NECROPSIED
71
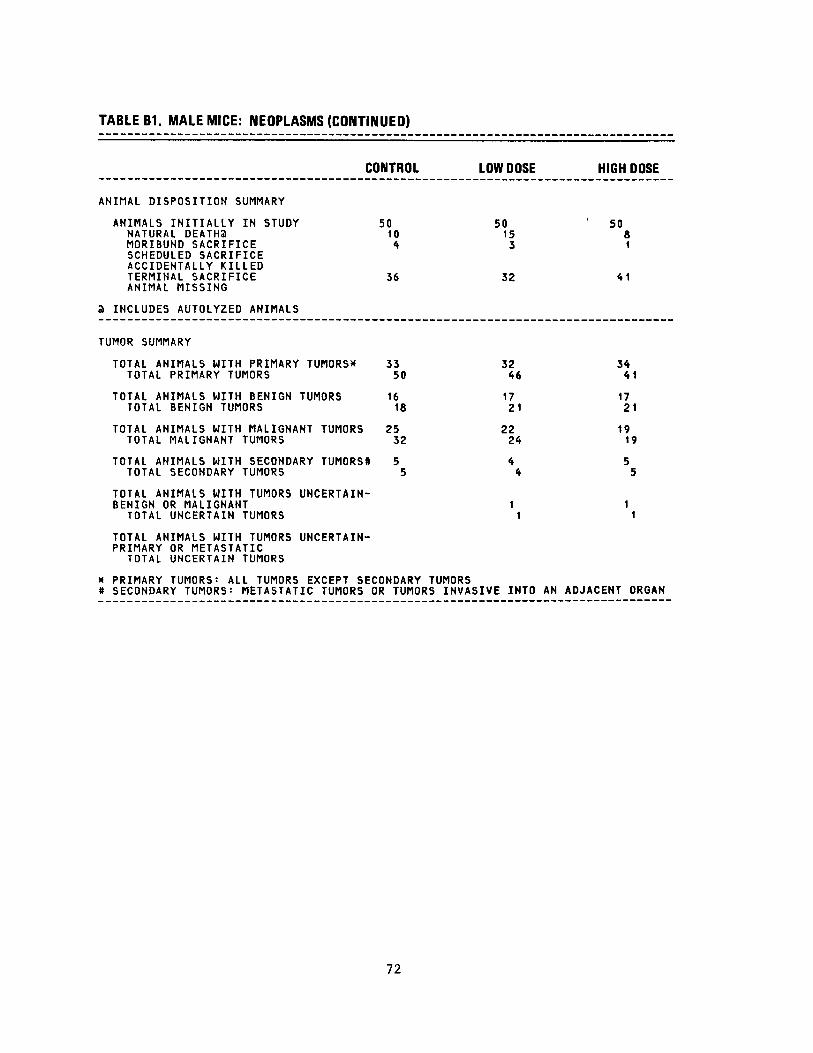
TABLE B1. MALE MICE: NEOPLASMS (CONTINUED)
CONTROL LOW DOSE HIGH DOSE
ANIMAL DISPOSITION SUMMARY
ANIMALS INITIALLY IN STUDY 50 50 50 NATURAL DEATHS 10 15 8 MORIBUND SACRIFICE 4 3 1 SCHEDULED SACRIFICE ACCIDENTALLY KILLED TERMINAL SACRIFICE 36 32 ANIMAL MISSING
INCLUDES AUTOLYZED ANIMALS
TUMOR SUMMARY
TOTAL ANIMALS WITH PRIMARY TUMORS* 33 32 34 TOTAL PRIMARY TUMORS 50 46 41
TOTAL ANIMALS WITH BENIGN TUMORS 16 17 17 TOTAL BENIGN TUMORS 18 21 21
TOTAL ANIMALS WITH MALIGNANT TUMORS 25 22 19 TOTAL MALIGNANT TUMORS 32 24 19
TOTAL ANIMALS WITH SECONDARY TUMORS* 5 4 5 TOTAL SECONDARY TUMORS 5 4 5
TOTAL ANIMALS WITH TUMORS UNCERTAINBENIGN OR MALIGNANT 1 1
TOTAL UNCERTAIN TUMORS 1 1
TOTAL ANIMALS WITH TUMORS UNCERTAINPRIMARY OR METASTATIC
TOTAL UNCERTAIN TUMORS
* PRIMARY TUMORS: ALL TUMORS EXCEPT SECONDARY TUMORS # SECONDARY TUMORS: METASTATIC TUMORS OR TUMORS INVASIVE INTO AN ADJACENT ORGAN
72
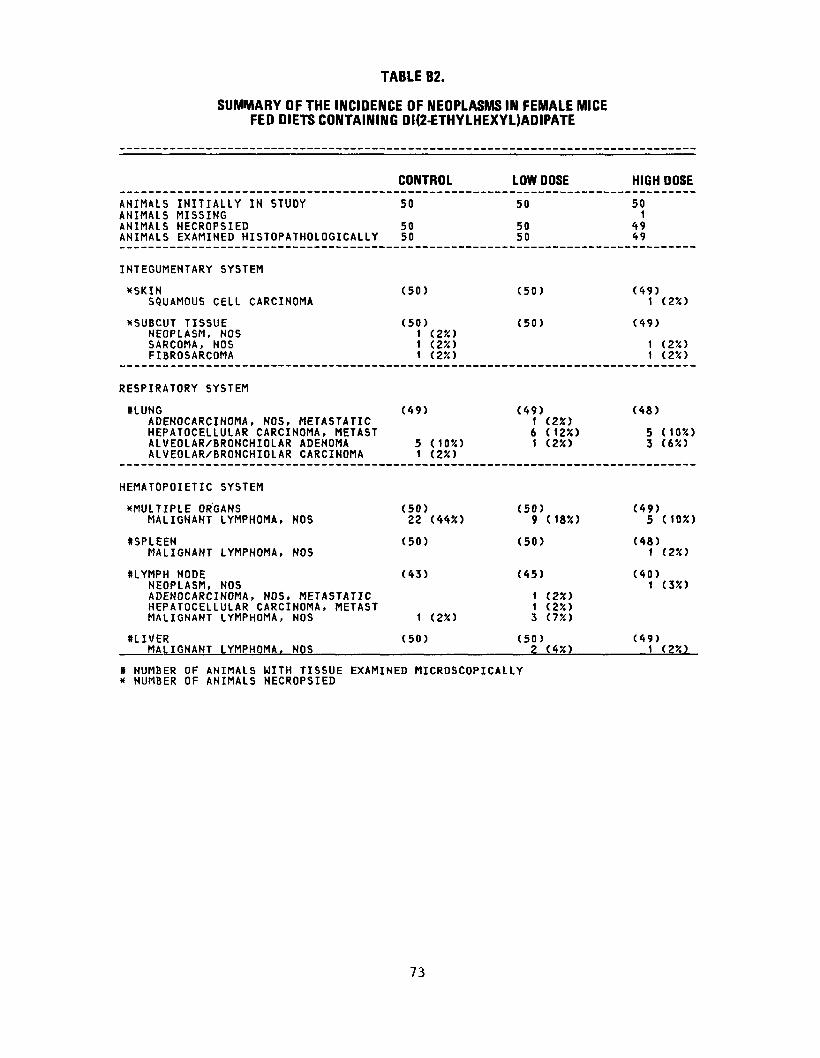
TABLE B2.
SUMMARY OF THE INCIDENCE OF NEOPLASMS IN FEMALE MICE FED DIETS CONTAINING DI(2-ETHYLHEXYL)ADIPATE
CONTROL LOW DOSE HIGH DOSE
ANIMALS INITIALLY IN STUDY 50 50 50 ANIMALS MISSING 1 ANIMALS NECROPSIED 50 50 49 ANIMALS EXAMINED HISTOPATHOLOGICALLY 50 50 49
INTEGUMENTARY SYSTEM
XSKIN (50) (50) (49) SQUAMOUS CELL CARCINOMA 1 (2%)
XSUBCUT TISSUE (50) (50) (49) NEOPLASM, N05 1 (2%) SARCOMA, NOS 1 (2%) 1 (2%) FIBROSARCOMA 1 (2%) 1 (2%)
RESPIRATORY SYSTEM
HUNG (49) (49) (48) ADENOCARCINOMA, NOS, METASTATIC 1 (2%) HEPATOCELLULAR CARCINOMA, METAST 6 (12%) 5 (10%) ALVEOLAR/BRONCHIOLAR ADENOMA 5 (10%) 1 (2%) 3 (655) ALVEOLAR/BRONCHIOLAR CARCINOMA 1 (2%)
HEMATOPOIETIC SYSTEM
^MULTIPLE ORGANS (50) (50) (49)MALIGNANT LYMPHOMA, NOS 22 (44%) 9 (18%) 5 (10%)
•SPLEEN (50) (50) (48)MALIGNANT LYMPHOMA, NOS 1 (2%)
8LYMPH NODE (43) (45) (40)NEOPLASM, NOS 1 (3%) ADENOCARCINOMA, NOS, METASTATIC 1 (2%) HEPATOCELLULAR CARCINOMA, METAST 1 (255) MALIGNANT LYMPHOMA, NOS 1 (2%) 3 (7%)
#LIVER (50) (50) (49)MALIGNANT LYMPHOMA, NOS 2 (4%) 1 (2%)
* NUMBER OF ANIMALS WITH TISSUE EXAMINED MICROSCOPICALLY * NUMBER OF ANIMALS NECROPSIED
73
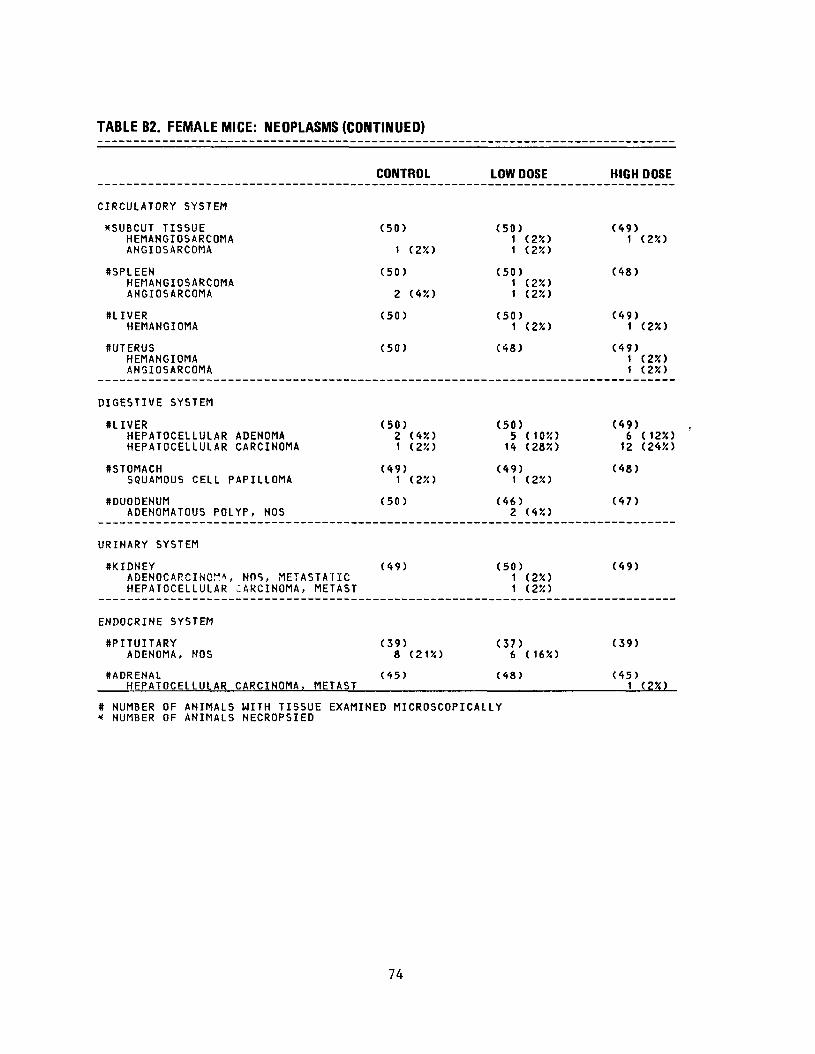
TABLE B2. FEMALE MICE: NEOPLASMS (CONTINUED)
CONTROL LOW DOSE
CIRCULATORY SYSTEM
XSUBCUT TISSUE (50) (50) HEMANGIOSARCOMA 1 (2%) ANGIOSARCOMA 1 (2%) 1 (2%)
HSPLEEN (50) (50) HEMANGIOSARCOMA 1 (2%) ANGIOSARCOMA 2 (4%) 1 (2%)
8LIVER (50) (50) HEMANGIOMA 1 (2X)
8UTERUS (50) (48) HEMANGIOMA ANGIOSARCOMA
DIGESTIVE SYSTEM
SLIVER (50) (50) HEPATOCELLULAR ADENOMA 2 (4%) 5 (10%) HEPATOCELLULAR CARCINOMA 1 (2%) 14 (28X)
•STOMACH (49) (49)SQUAMOUS CELL PAPILLOMA 1 (2%) 1 (2JJ)
((DUODENUM (50) (46)ADENOMATOUS POLYP, NOS 2 (42)
URINARY SYSTEM
((KIDNEY (49) (50) ADENOCARCINC^*, NOS, METASTATIC 1 (2X) HEPATOCELLULAR CARCINOMA, METAST 1 (250
ENDOCRINE SYSTEM
((PITUITARY (39) (37)ADENOMA, NOS 8 (21%) 6 (16%)
#ADRENAL (45) (48) HEPATOCELLULAR CARCINOMA, METAST
* NUMBER OF ANIMALS WITH TISSUE EXAMINED MICROSCOPICALLY * NUMBER OF ANIMALS NECROPSIED
HIGH DOSE
(49) 1 (2%)
(48)
(49)1 (2%)
(49)1 (2%) 1 (2%)
(49)6 (12%) 12 (24%)
(48)
(47)
(49)
(39)
(45) 1 (2%)
74
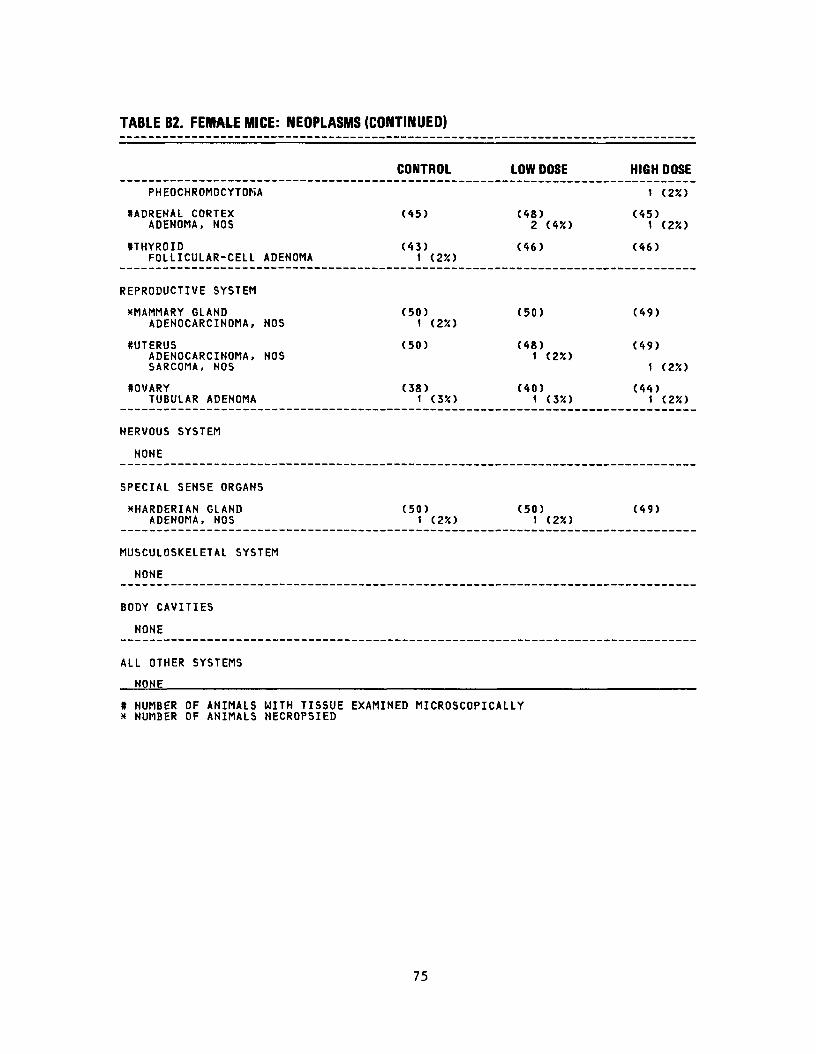
TABLE B2. FEMAiEMICE: NEOPLASMS (CONTINUED)
PHEOCHROMOCYTONA
UADRENAL CORTEXADENOMA, NOS
ttTHYROIDFOLLICULAR-CELL ADENOMA
REPRODUCTIVE SYSTEM
XMAMMARY GLANDADENOCARCINOMA, NOS
*UTERUSADENOCARCINOMA, NOSSARCOMA, NOS
•OVARYTUBULAR ADENOMA
NERVOUS SYSTEM
NONE
SPECIAL SENSE ORGANS
KHARDERIAN GLANDADENOMA, NOS
MUSCULOSKELETAL SYSTEM
NONE
BODY CAVITIES
NONE
ALL OTHER SYSTEMS
NONE
CONTROL LOW DOSE HIGH DOSE
1 (2%)
(45) (48) (45) 2 (45O 1 (2%)
(43) 1 (25O
(46) (46)
(50) 1 (2%)
(50) (49)
(50) (48)1 (2%) (49)
1 (2X)
(38) 1 (3X)
(40) 1 (33O
(44) 1 (2X)
(50) 1 (2X)
(50) 1 (2*)
(49)
f NUMBER OF ANIMALS WITH TISSUE EXAMINED MICROSCOPICALLY * NUMBER OF ANIMALS NECROPSIED
75
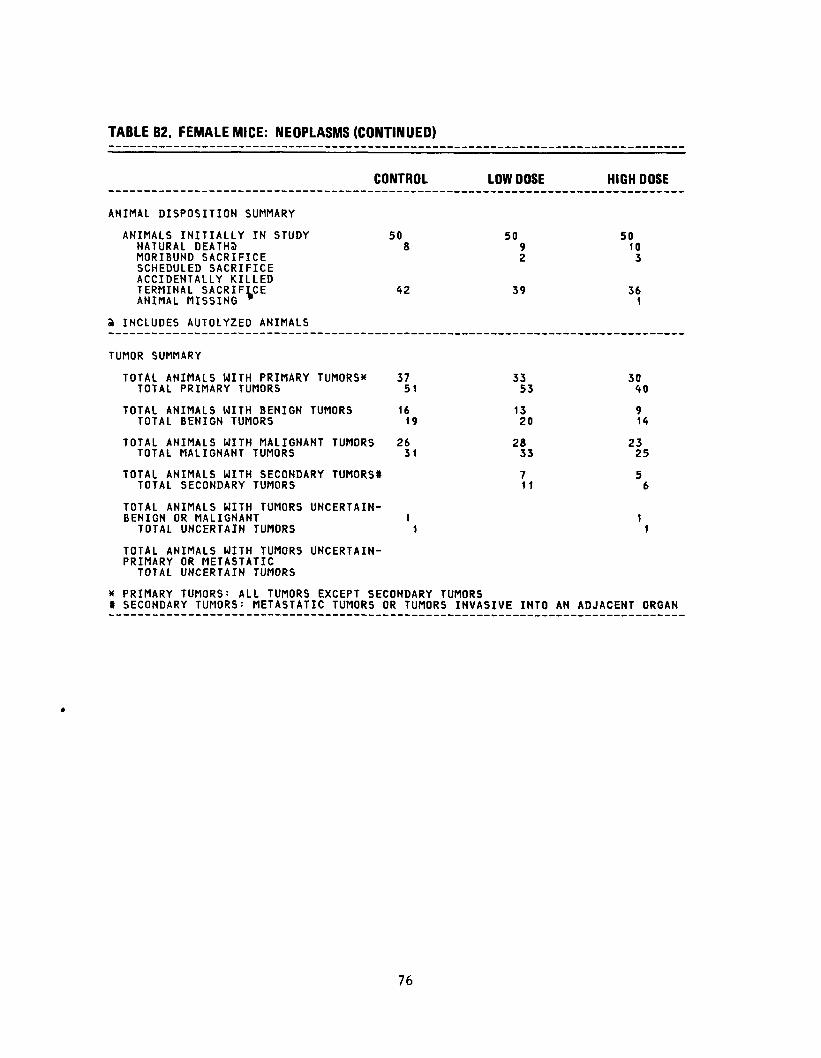
TABLE B2. FEMALE MICE: NEOPLASMS (CONTINUED)
CONTROL LOW DOSE HIGH DOSE
ANIMAL DISPOSITION SUMMARY
ANIMALS INITIALLY IN STUDY 50 50 50 NATURAL DEATHS 8 9 10 MORIBUND SACRIFICE 2 3 SCHEDULED SACRIFICE ACCIDENTALLY KILLED TERMINAL SACRIFICE 42 39 36 ANIMAL MISSING * 1
a INCLUDES AUTOLYZED ANIMALS
TUMOR SUMMARY
TOTAL ANIMALS WITH PRIMARY TUMORS* 37 33 30 TOTAL PRIMARY TUMORS 51 53 40
TOTAL ANIMALS WITH BENIGN TUMORS 16 13 9 TOTAL BENIGN TUMORS 19 20 H
TOTAL ANIMALS WITH MALIGNANT TUMORS 26 28 23 TOTAL MALIGNANT TUMORS 31 33 25
TOTAL ANIMALS WITH SECONDARY TUMORS* 7 5 TOTAL SECONDARY TUMORS 11 6
TOTAL ANIMALS WITH TUMORS UNCERTAINBENIGN OR MALIGNANT 1 1
TOTAL UNCERTAIN TUMORS 1 1
TOTAL ANIMALS WITH TUMORS UNCERTAINPRIMARY OR METASTATIC
TOTAL UNCERTAIN TUMORS
* PRIMARY TUMORS: ALL TUMORS EXCEPT SECONDARY TUMORS » SECONDARY TUMORS: METASTATIC TUMORS OR TUMORS INVASIVE INTO AN ADJACENT ORGAN
76

APPENDIX C
SUMMARY OF THE INCIDENCE OF NONNEOPLASTIC LESIONS IN RATS FED DIETS CONTAINING DI(2-ETHYLHEXYL)ADIPATE
77

78

TABLE C1.
SUMMARY OF THE INCIDENCE OF NONNEOPLASTIC LESIONS IN MALE RATS FED DIETS CONTAINING DI(2-ETHYLHEXYL)ADIPATE
CONTROL LOW DOSE HIGH DOSE
ANIMALS INITIALLY IN STUDY 50 50 50 ANIMALS NECROPSIED 49 50 50 ANIMALS EXAMINED HISTOPATHOLOGICALLY 49 50 50
INTEGUMENTARY SYSTEM
*SKIN (49) (50) (50) ULCER, FOCAL 1 (2X) HYPERKERATOSIS 1 (2X) 1 (2X) ACANTHOSIS 1 (2X) 1 (2'/O
*SUBCUT TISSUE (49) (50) (50) EPIDERMAL INCLUSION CYST 1 (2%) NECROSIS, FAT 1 (25O
RESPIRATORY SYSTEM
STRACHEA (49) (50) (49) INFLAMMATION, CHRONIC 1 (2X)
*LUNG (49) (50) (50) INFLAMMATION, INTERSTITIAL 1 (2%) PNEUMONIA, CHRONIC MURINE 1 (2X) HYPERPLASIA, ALVEOLAR EPITHELIUM 1 (25O
HEMATOPOIETIC SYSTEM
*SPLEEN (49) (50) (50) HEMATOPOIESIS 3 (6X)
ULYMPH NODE (48) (49) (44) HYPERPLASIA, NOS 1 (2X)
*MANDIBULAR L. NODE (48) (49) (44) INFLAMMATION, CHRONIC 1 (2X) NECROSIS, FOCAL 1 (2X) HYPERPLASIA. PLASMA CELL 4 (8X) 1 (2X)
» NUMBER OF ANIMALS WITH TISSUE EXAMINED MICROSCOPICALLY X NUMBER OF ANIMALS NECROPSIED
79
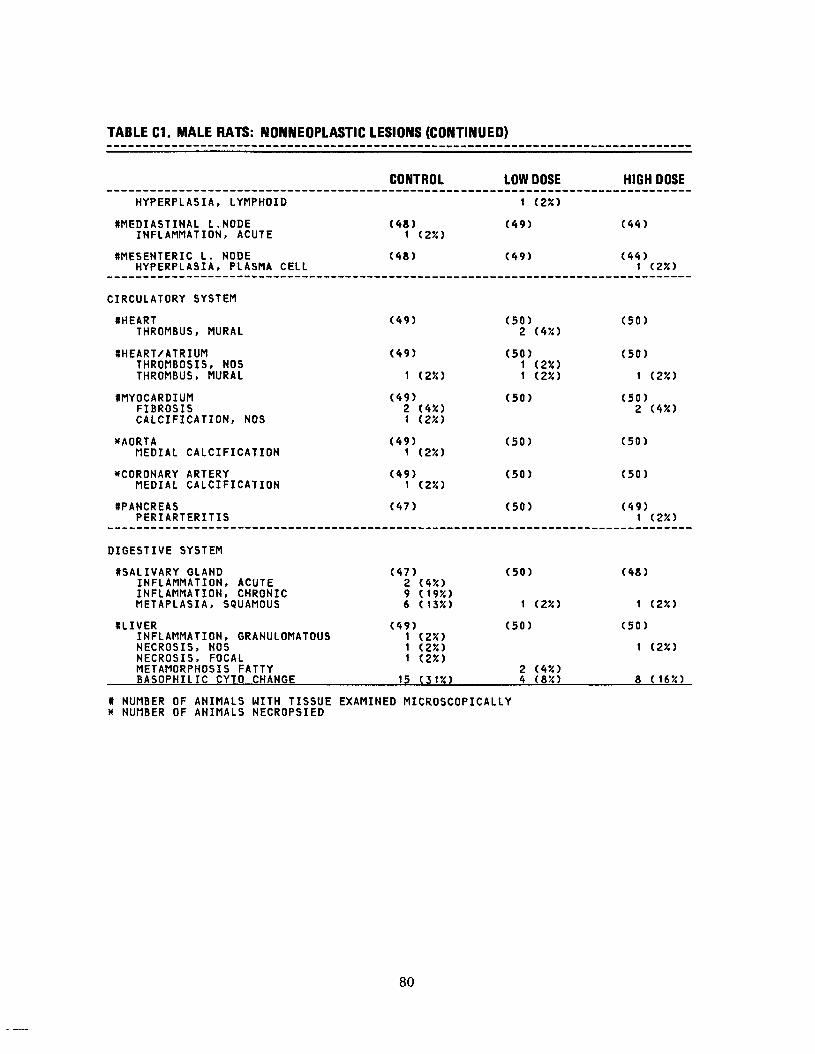
TABLE C1. MALE RATS: NONNEOPLASTIC LESIONS (CONTINUED)
HYPERPLASIA, LYMPHOID
*MEDIASTINAL L.NODE INFLAMMATION, ACUTE
«MESENTERIC L. NODE HYPERPLASIA, PLASMA CELL
CIRCULATORY SYSTEM
*HEART THROMBUS, MURAL
SHEART/ATRIUM THROMBOSIS, NOS THROMBUS, MURAL
HMYOCARDIUM FIBROSIS CALCIFICATION, NOS
*AORTA MEDIAL CALCIFICATION
^CORONARY ARTERY MEDIAL CALCIFICATION
((PANCREA((PANCREASS PERIARTERITIPERIARTERITISS
DIGESTIVE SYSTEM
#SALIVARY GLAND INFLAMMATION, ACUTE INFLAMMATION, CHRONIC METAPLASIA, SQUAMOUS
tLIVER INFLAMMATION, GRANULOMATOUS NECROSIS, NOS NECROSIS, FOCAL METAMORPHOSIS FATTY BASOPHILIC CYTO CHANGE
* NUMBER OF ANIMALS WITH TISSUEx NUMBER OF ANIMALS NECROPSIED
HIGH DOSE
(44)
( 4 4 ) 1 (25O
( 5 0 )
(50)
1 (250
(50)2 (4%)
(50)
(50)
(49(49))11 (25O(25{)
(48)
1 (25O
(50)
1 (2X)
8 (165O
CONTROL
(48) 1 (2%)
(48)
(49)
(49)
1 (25O
(49)2 (45O 1 (250
(49)1 (250
(49)1 (25O
(47(47))
(47) 2 (4%) 9 (195O 6 (135O
(49) 1 (23O 1 (25O 1 (250
15 (31%)
LOW DOSE
1 (25O
(49)
(49)
(50)2 (45O
(50) 1 (2/O 1 (25O
(50)
(50)
(50)
(50(50))
(50)
1 (25O
(50)
2 (4X)4 (83O
EXAMINED MICROSCOPICALLY
80
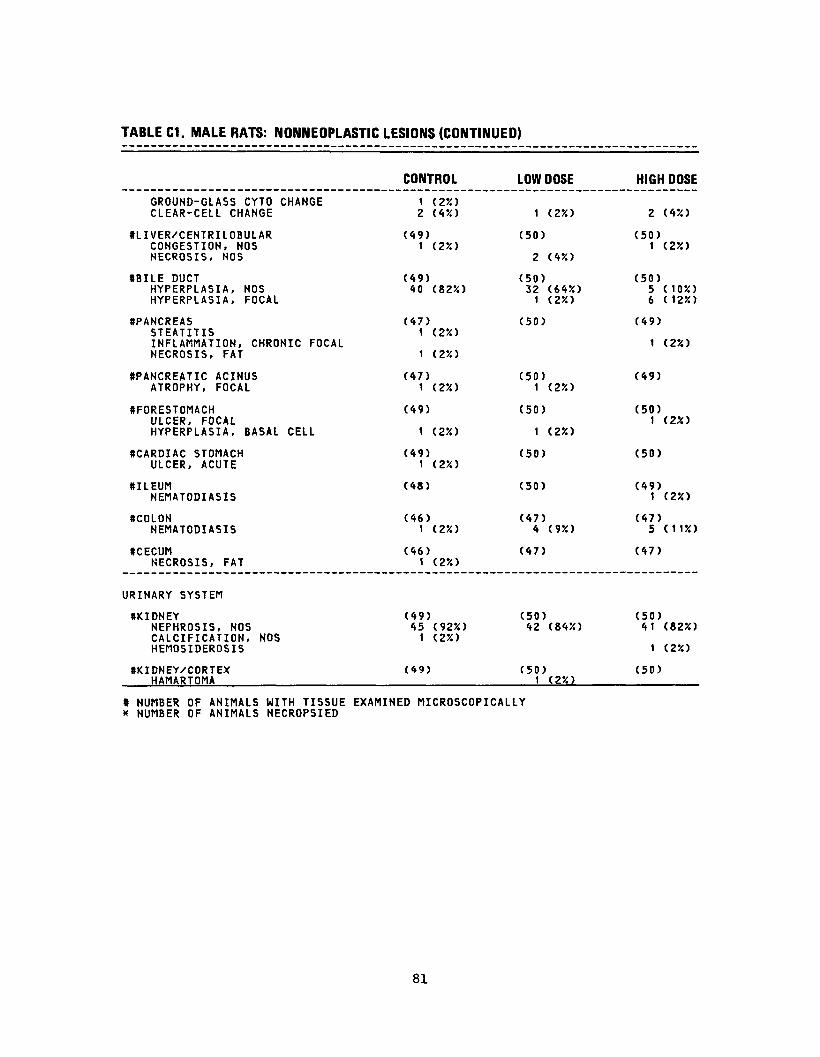
TABLE C1. MALE RATS: NONNEOPLASTIC LESIONS (CONTINUED)
CONTROL LOW DOSE
GROUND-GLASS CYTO CHANGE CLEAR-CELL CHANGE
12 (2%) (4%) 1 (2%)
tLIVER/CENTRILOBULAR CONGESTION, NOS NECROSIS, NOS
(49)1 (2%)
(50)
2 (45O
*BILE DUCT HYPERPLASIA, NOS HYPERPLASIA, FOCAL
(49)40 (82%)
(50)32 (64%)
1 (25O
8PANCREAS STEATITIS INFLAMMATION, CHRONIC FOCAL
(47) 1 (2%)
(50)
NECROSIS, FAT 1 (2%)
•PANCREATIC ACINUS ATROPHY, FOCAL
(47) 1 (2%)
(50)1 (2%)
*FORESTOMACH ULCER, FOCAL
(49) (50)
HYPERPLASIA, BASAL CELL 1 (2%) 1 (23O
*CARDIAC STOMACH ULCER, ACUTE
(49)1 (2%)
(50)
8ILEUM NEMATODIASIS
(48) (50)
ftCOLON NEMATODIASIS
(46) 1 (2%)
(47)4 (9X)
*CECUM NECROSIS, FAT
(46) 1 (2%)
(47)
URINARY SYSTEM
8KIDNEY (49) (50)NEPHROSIS, NOS 45 (92X) 42 (84%) CALCIFICATION, NOS 1 (2X) HEMOSIDEROSIS
tKIDNEY/CORTEX (49) (50)HAMARTOMA 1 (2%)
* NUMBER OF ANIMALS WITH TISSUE EXAMINED MICROSCOPICALLY x NUMBER OF ANIMALS NECROPSIED
HIGH DOSE
2 (45{)
(50) 1 (2%)
(50) 5 (10X) 6 (12%)
(49)
1 (2%)
(49)
(50) 1 (23O
(50)
(49)1 (25O
(47) 5 (11%)
(47)
(50) 41 (82%)
1 (2%)
(50)
81
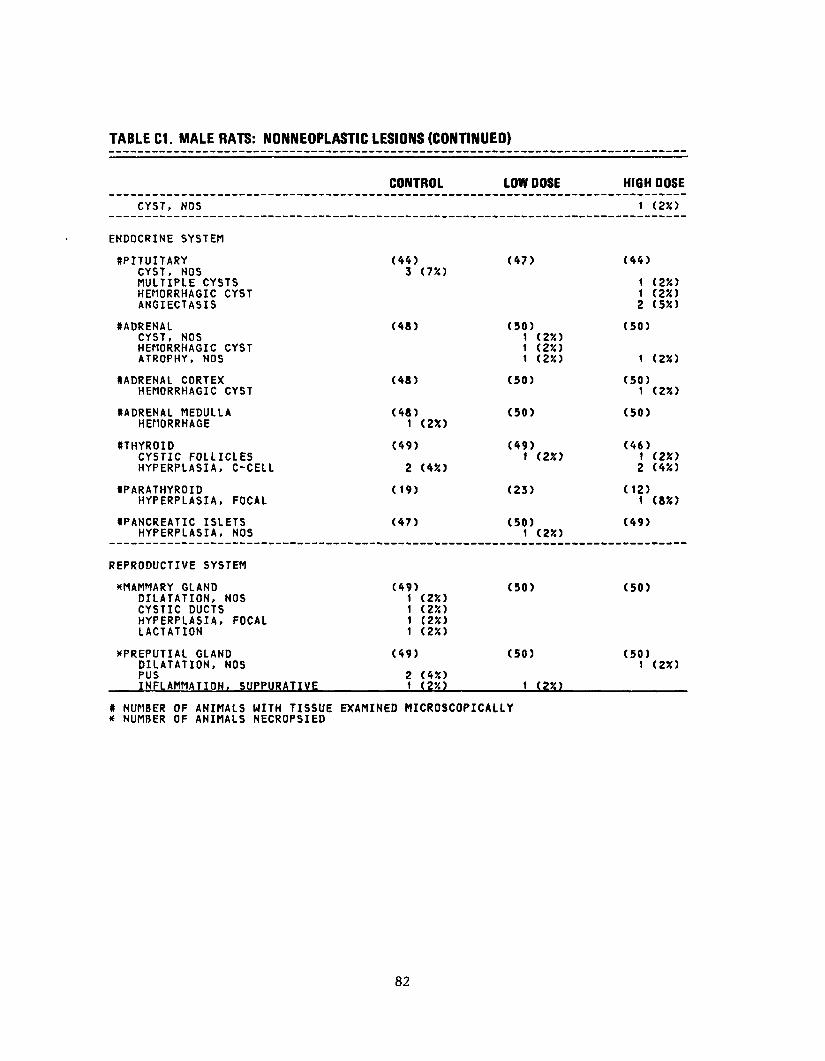
TABLE C1. MALE RATS: NONNEOPLASTIC LESIONS (CONTINUED)
HIGH DOSE
1 (2%)
(44)
1 (25O 1 (23O 2 (5%)
(50)
1 (2X)
(50)1 (2X)
(50)
(46)1 (25O 2 (4%)
(12)1 (8%)
(49)
(50)
(50)1 (2X)
CYST, NOS
ENDOCRINE SYSTEM
•PITUITARY CYST, NOS MULTIPLE CYSTS HEMORRHAGIC CYST ANGIECTASIS
•ADRENAL CYST, NOS HEMORRHAGIC CYST ATROPHY, NOS
•ADRENAL CORTEX HEMORRHAGIC CYST
SADRENAL MEDULLA HEMORRHAGE
•THYROID CYSTIC FOLLICLES HYPERPLASIA, C-CELL
•PARATHYROID HYPERPLASIA, FOCAL
•PANCREATIC ISLETS HYPERPLASIA, NOS
REPRODUCTIVE SYSTEM
*MAMMARY GLAND DILATATION, NOS CYSTIC DUCTS HYPERPLASIA, FOCAL LACTATION
XPREPUTIAL GLAND DILATATION, NOS PUS INFLAMMATION, SUPPURATIVE
CONTROL
(44)3 (750
(48)
(48)
(48)1 (250
(49)
Z (4*)
(19)
(47)
(49)1 (250 1 (25O 1 (25O 1 (25O
(49)
2 (4%) 1 (2JO
LOW DOSE
(47)
(50)1 (25O 1 (25O 1 (250
(50)
(50)
(49)1 (22)
(23)
(50)1 (25O
(50)
(50)
1 (2%)
* NUMBER OF ANIMALS WITH TISSUE EXAMINED MICROSCOPICALLY * NUMBER OF ANIMALS NECROPSIED
82
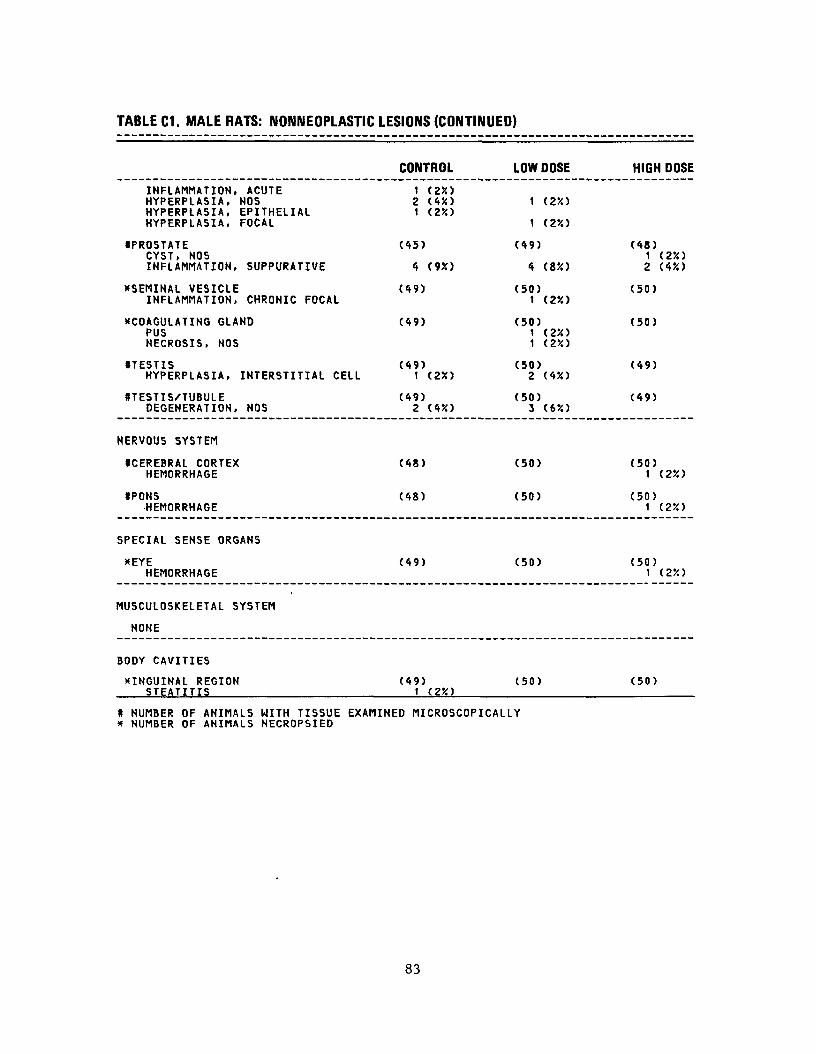
TABLE C1. MALE RATS: NONNEOPLASTIC LESIONS (CONTINUED)
CONTROL LOW DOSE HIGH DOSE
INFLAMMATION, ACUTE 1 (2X) HYPERPLA5IA, NOS 2 (4X) 1 (2X) HYPERPLASIA, EPITHELIAL 1 (250 HYPERPLASIA, FOCAL 1 (25O
•PROSTATE (45) (49) (48)CYST, NOS 1 (2%) INFLAMMATION, SUPPURATIVE 4 (95O 4 (83O 2 (45O
XSEMINAL VESICLE (49) (50) (50) INFLAMMATION, CHRONIC FOCAL 1 (2X)
^COAGULATING GLAND (49) (50) (50) PUS 1 (2%) NECROSIS, NOS 1 (2X)
*TESTIS (49) (50) (49) HYPERPLASIA, INTERSTITIAL CELL 1 (25O 2 (4X)
UTESTIS/TUBULE (49) (50) (49) DEGENERATION, NOS 2 (45O 3 (655)
NERVOUS SYSTEM
•CEREBRAL CORTEX (48) (50) (50)HEMORRHAGE 1 (2X)
*PONS (48) (50) (50)HEMORRHAGE 1 (2X)
SPECIAL SENSE ORGANS
*EYE (49) (50) (50)HEMORRHAGE 1 (25O
MUSCULOSKELETAL SYSTEM
NONE
BODY CAVITIES
*INGUINAL REGION (49) (50) (50) STEA TITIS
t NUMBER OF ANIMALS WITH TISSUE EXAMINED MICROSCOPICALLY * NUMBER OF ANIMALS NECROPSIED
83
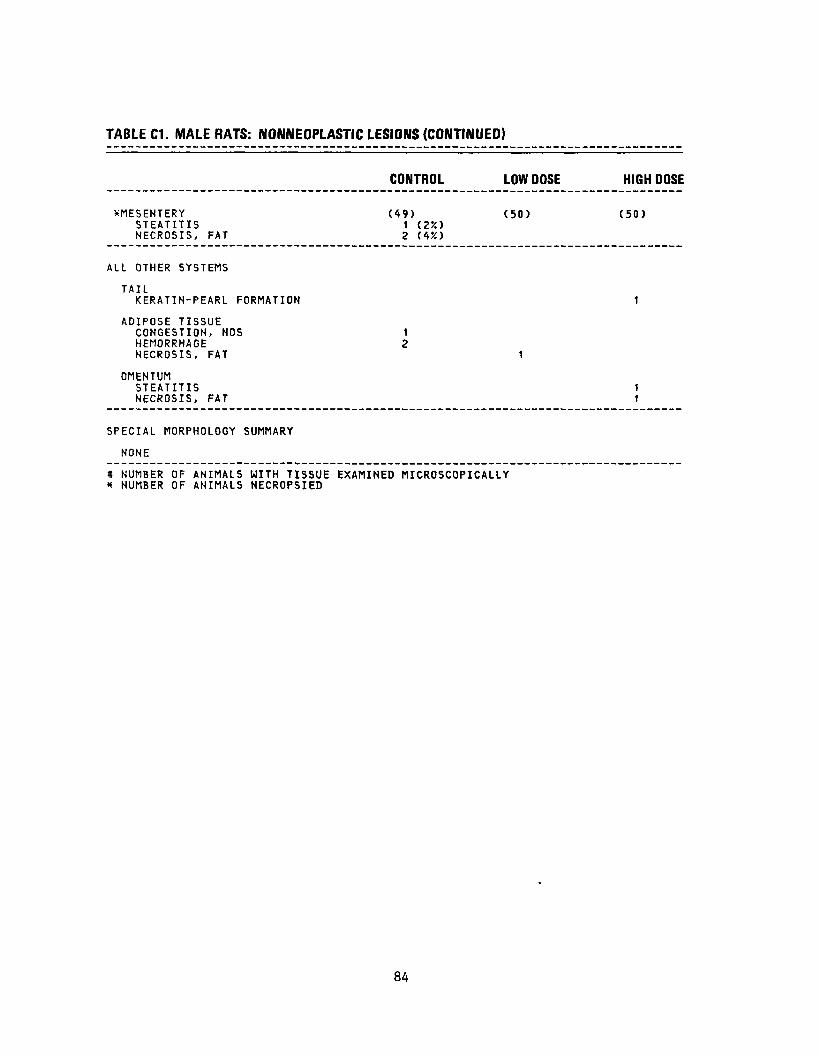
TABLE C1. MALE RATS: NONNEOPLASTIC LESIONS (CONTINUED)
CONTROL LOW DOSE HIGH DOSE
XMESENTERY (49) (50) (50) STEATITIS 1 (25O NECROSIS, FAT 2
ALL OTHER SYSTEMS
TAIL KERATIN-PEARL FORMATION 1
ADIPOSE TISSUE CONGESTION, NOS 1 HEMORRHAGE 2 NECROSIS, FAT 1
OMENTUM STEATITIS 1 NECROSIS, FAT 1
SPECIAL MORPHOLOGY SUMMARY
NONE
* NUMBER OF ANIMALS WITH TISSUE EXAMINED MICROSCOPICALLY * NUMBER OF ANIMALS NECROPSIED

TABLE C2.
SUMMARY OF THE INCIDENCE OF NONNEOPLASTIC LESIONS IN FEMALE RATS FED DIETS CONTAINING DI(2-ETHYLHEXYL)ADIPATE
CONTROL LOW DOSE HIGH DOSE
ANIMALS INITIALLY IN STUDY ANIMALS NECROPSIED ANIMALS EXAMINED HISTOPATHOLOGICALLY
INTEGUMENTARY SYSTEM
*SUBCUT TISSUE NECROSIS, FAT
RESPIRATORY SYSTEM
«TRACHEAL SUBMUCOSA INFLAMMATION, SUPPURATIVE
ttLUNG INFLAMMATION, INTERSTITIAL BRONCHOPNEUMONIA, ACUTE
HEMATOPOIETIC SYSTEM
ttBONE MARROW HYPOPLASIA, NOS
•SPLEEN HEMOSIDEROSIS HEMATOPOIESIS ERYTHROPOIESIS
#MANDIBULAR L. NODE HYPERPLASIA, PLASMA CELL
SMEDIASTINAL L.NODE CONGESTION, NOS HYPERPLASIA, PLASMA CELL
CIRCULATORY SYSTEM
(tHEART/ATRIUMTHROMBUS, MURAL
50 50 50 50 50 50
(50) (50)1 (2V.)
(50)1 (25O
(50)
(50)
1 (2%)
(50)2 (4%)
(49) (49)
(49)1 (2X) 2 (4%) 1 (2X)
(50)1 (2X) 2 (4X)
(48)1 (2X)
(49)1 (2X)
(48) (49)
1 (25{)
(50)1 (25O
(50)1 (2%)
# NUMBER OF ANIMALS WITH TISSUE EXAMINED MICROSCOPICALLY * NUMBER OF ANIMALS NECROPSIED
85
50 50 50
(50)
(48)
(50)1 (2%)
(46)1 (2%)
(50)
1 (230
(47)
(47)1 (25C)
(50)1 (2%)

TABLE C2. FEMALE RATS: NONNEOPLASTIC LESIONS (CONTINUED)
CONTROL LOW DOSE HIGH DOSE
((RIGHT VENTRICLE SCAR
((MYOCARDIUM CALCIFICATION, NOS
(50)
(50) 1 (2%)
(50) 1 (2%)
(50)
(50)
(50)
DIGESTIVE SYSTEM
((SALIVARY GLAND INFLAMMATION, ACUTE INFLAMMATION, CHRONIC METAPLASIA, SQUAMOUS
((LIVER FIBR05IS, FOCAL NECROSIS, FOCAL METAMORPHOSIS FATTY CYTOPLASMIC VACUOLIZATION BASOPHILIC CYTO CHANGE CLEAR-CELL CHANGE
ULIVER/CENTRILOBULAR CONGESTION, NOS NECROSIS, NOS
SBILE DUCT HYPERPLASIA, NOS HYPERPLASIA, FOCAL
((PANCREAS INFLAMMATION, CHRONIC FOCAL
(48) 1 (2%) 1 (2%) 3 (6X)
(49) 1 (2%)
2 (4%) 1 (2%)
28 (57%) 2 (4%)
(49)
(49) 12 (24%)
(49)
(50) 1 (2%)
1 (2%)
(50)
1 (2%) 3 (6%) 1 (2%)
38 (76%) 2 (4%)
(50)
1 (2%)
(50) 16 (32%) 2 (4%)
(50) 1 (2%)
SGASTRISGASTRICC MUCOSMUCOSAA INFLAMMATIONINFLAMMATION,, CHRONICHRONICC ULCER, CHRONIC
itFORESTOMACH ULCER, ACUTE HYPERPLASIA, BASAL CELL
((COLON ULCER, ACUTE NEMATODIASIS
(50(50))
1 (2%)
(50)
1 (2%)
(48)
1 (2%)
(50(50))
(50) 1 (2%)
(49) 1 (2%)5 ( 10%)
# NUMBER OF ANIMALS WITH TISSUE * NUMBER OF ANIMALS NECROPSIED
EXAMINED MICROSCOPICALLY
(48)1 1
(50)
1 39 2
(50)1
(50)17 2
(48)
(2%) (2%)
(2%) (78%) (4%)
(2%)
(34%) (4%)
) (48(48))
11 (2%(2%)
(48)
(47)
4 (9%)
86
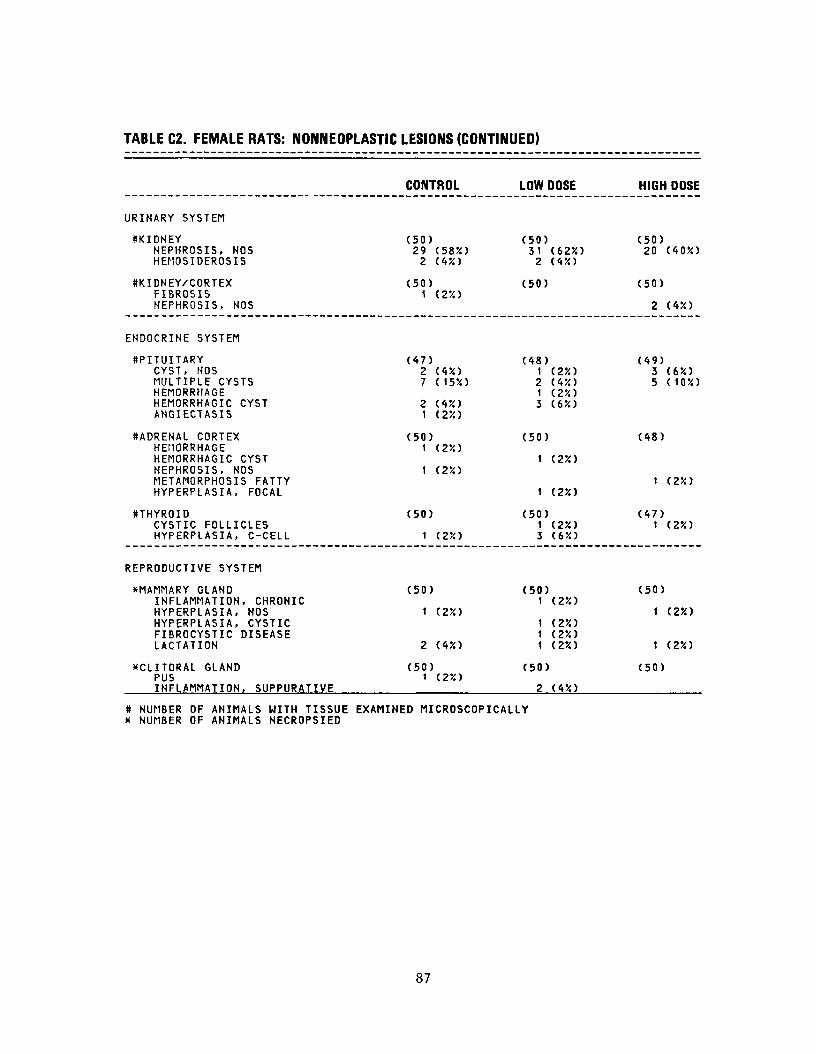
TABLE C2. FEMALE RATS: NONNEOPLASTIC LESIONS (CONTINUED)
CONTROL LOW DOSE HIGH DOSE
URINARY SYSTEM
8KIDNEY (50) (50) (50) NEPHROSIS, NOS 29 (585O 31 (625O 20 (405O HEMOSIDEROSIS 2 (450 2 (45O
ttKIDNEY/CORTEX (50) (50) (50) FIBROSIS 1 (25O NEPHROSIS, NOS 2 (450
ENDOCRINE SYSTEM
SPITUITARY (47) (48) (49) CYST, NOS 2 (45O 1 (2X) 3 ( 65O MULTIPLE CYSTS 7 (155O 2 (45O 5 ( 105O HEMORRHAGE 1 (25O HEMORRHAGIC CYST 2 (45O 3 (65O ANGIECTASIS 1 (255)
SADRENAL CORTEX (50) (50) (48) HEMORRHAGE 1 (25O HEMORRHAGIC CYST 1 (2X) NEPHROSIS, NOS 1 (25O METAMORPHOSIS FATTY 1 ( 25S ) HYPERPLASIA, FOCAL 1 (2X)
HTHYROID (50) (50) (47)CYSTIC FOLLICLES 1 (25O 1 (25O HYPERPLASIA, C-CELL 1 (250 3 (65O
REPRODUCTIVE SYSTEM
*MAMMARY GLAND (50) (50) (50) INFLAMMATION, CHRONIC 1 (25O HYPERPLASIA, NOS 1 (25O 1 (25O HYPERPLASIA, CYSTIC 1 (25O FIBROCYSTIC DISEASE 1 (25O LACTATION 2 (450 1 (25O 1 (2X)
XCLITORAL GLAND (50) (50) (50) PUS 1 (250 INFLAMMATION, SUPPURATIVE 2 (45O
# NUMBER OF ANIMALS WITH TISSUE EXAMINED MICROSCOPICALLY x NUMBER OF ANIMALS NECROPSIED
87
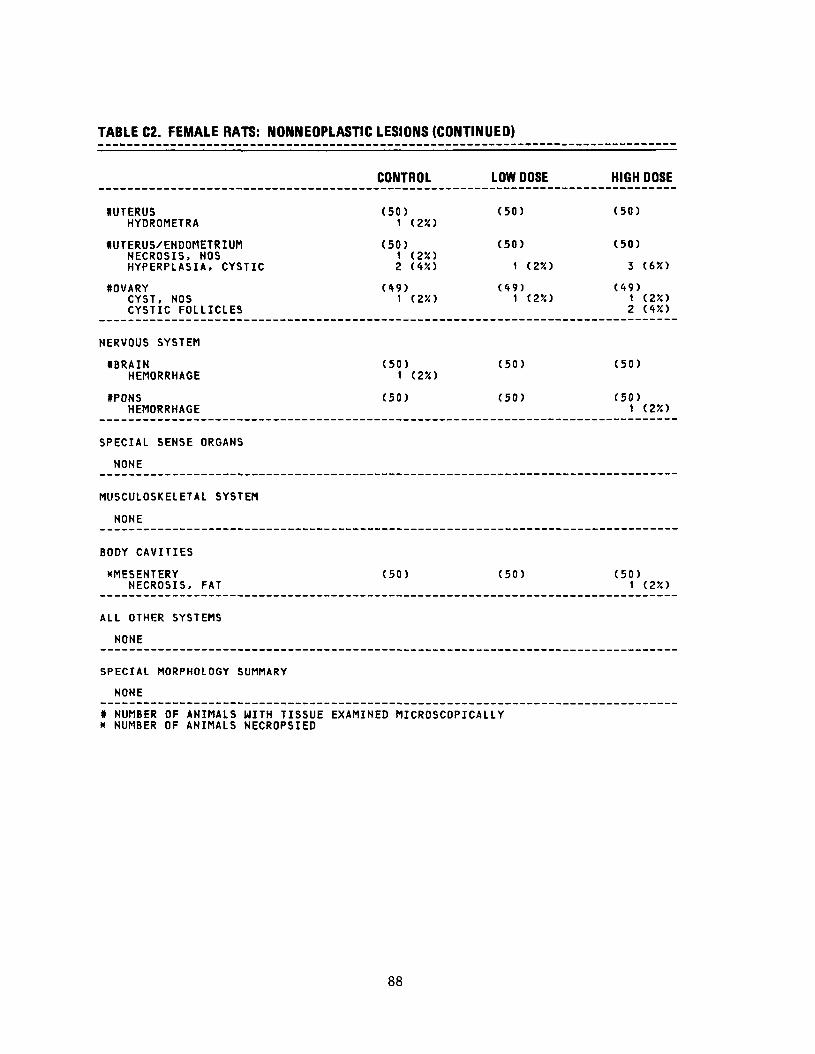
TABLE C2. FEMALE RATS: NONNEOPLASTIC LESIONS (CONTINUED)
SUTERUSHYDROMETRA
WERUS/ENDOMETRIUMNECROSIS, NOSHYPERPLASIA, CYSTIC
HOVARYCYST, NOSCYSTIC FOLLICLES
NERVOUS SYSTEM
#BRAINHEMORRHAGE
«PONSHEMORRHAGE
SPECIAL SENSE ORGANS
NONE
MUSCULOSKELETAL SYSTEM
NONE
BODY CAVITIES
XMESENTERYNECROSIS, FAT
ALL OTHER SYSTEMS
NONE
SPECIAL MORPHOLOGY SUMMARY
NONE
CONTROL LOW DOSE HIGH DOSE
( 50 ) (50) (50 ) 1 (2X)
(50) (50) (50) 1 (2X) 2 (4X) 1 (2%) 3 (6X)
(49) 1 (2X)
(49) 1 (2X)
(49) 1 (2X) 2 (4X)
(50) (50) (50) 1 (2%)
(50) (50) (50) 1 (2X)
(50) (50) (50) 1 (2X)
» NUMBER OF ANIMALS WITH TISSUE EXAMINED MICROSCOPICALLY x NUMBER OF ANIMALS NECROPSIED
88
APPENDIX D
SUMMARY OF THE INCIDENCE OF NONNEOPLASTIC LESIONS IN MICE FED DIETS CONTAINING Dl(2-ETHYLHEXYL)ADIPATE
89

06
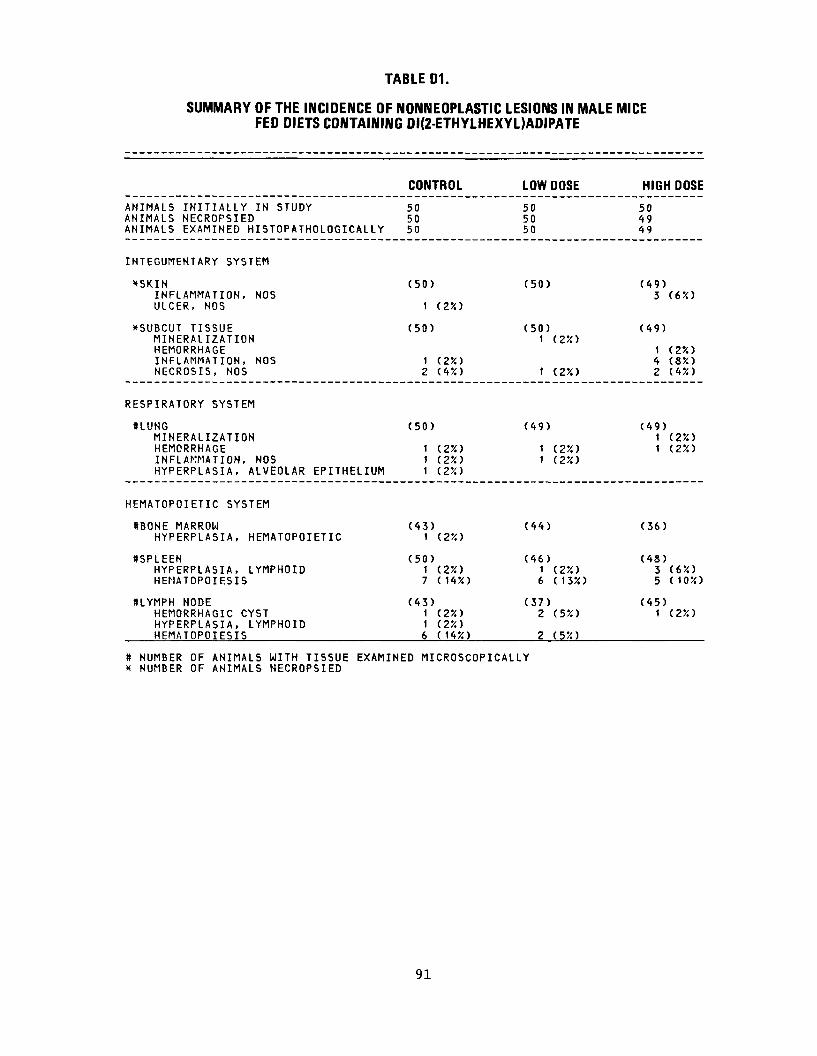
TABLE 01.
SUMMARY OF THE INCIDENCE OF NONNEOPLASTIC LESIONS IN MALE MICE FED DIETS CONTAINING DI(2-ETHYLHEXYL)ADIPATE
CONTROL LOW DOSE HIGH DOSE
ANIMALS INITIALLY IN STUDY 50 50 50 ANIMALS NECROPSIED 50 50 49 ANIMALS EXAMINED HISTOPATHOLOGICALLY 50 50 49
INTEGUMENTARY SYSTEM
XSKIN (50) (50) INFLAMMATION, NOS ULCER, NOS 1 (2%)
(49)3 (6%)
*SUBCUT TISSUE (50) (50) MINERALIZATION 1 (2X) HEMORRHAGE INFLAMMATION, NOS 1 (2X) NECROSIS, NOS 2 (4%) 1 (2%)
(49)
1 (2%) 4 (8%) 2 (4%)
RESPIRATORY SYSTEM
#LUNG (50) (49) MINERALIZATION HEMORRHAGE 1 (2%) 1 (2%) INFLAMMATION, NOS 1 (2%) 1 (2%) HYPERPLASIA, ALVEOLAR EPITHELIUM 1 (2%)
(49) 1 (2X) 1 (2%)
HEMATOPOIETIC SYSTEM
SBONE MARROW (43) (44) HYPERPLASIA, HEMATOPOIETIC 1 (2%)
(36)
#SPLEEN (50) (46) HYPERPLASIA, LYMPHOID 1 (2%) 1 (2%) HEMATOPOIESIS 7 (14%) 6 (13%)
(48) 3 (6%) 5 (10%)
8LYMPH NODE (43) (37) HEMORRHAGIC CYST 1 (2%) 2 (5%) HYPERPLASIA, LYMPHOID 1 (2%) HEMATOPOIESIS 6 (14%) 2 (5%)
(45) 1 (2%)
* NUMBER OF ANIMALS WITH TISSUE EXAMINED MICROSCOPICALLY * NUMBER OF ANIMALS NECROPSIED
91
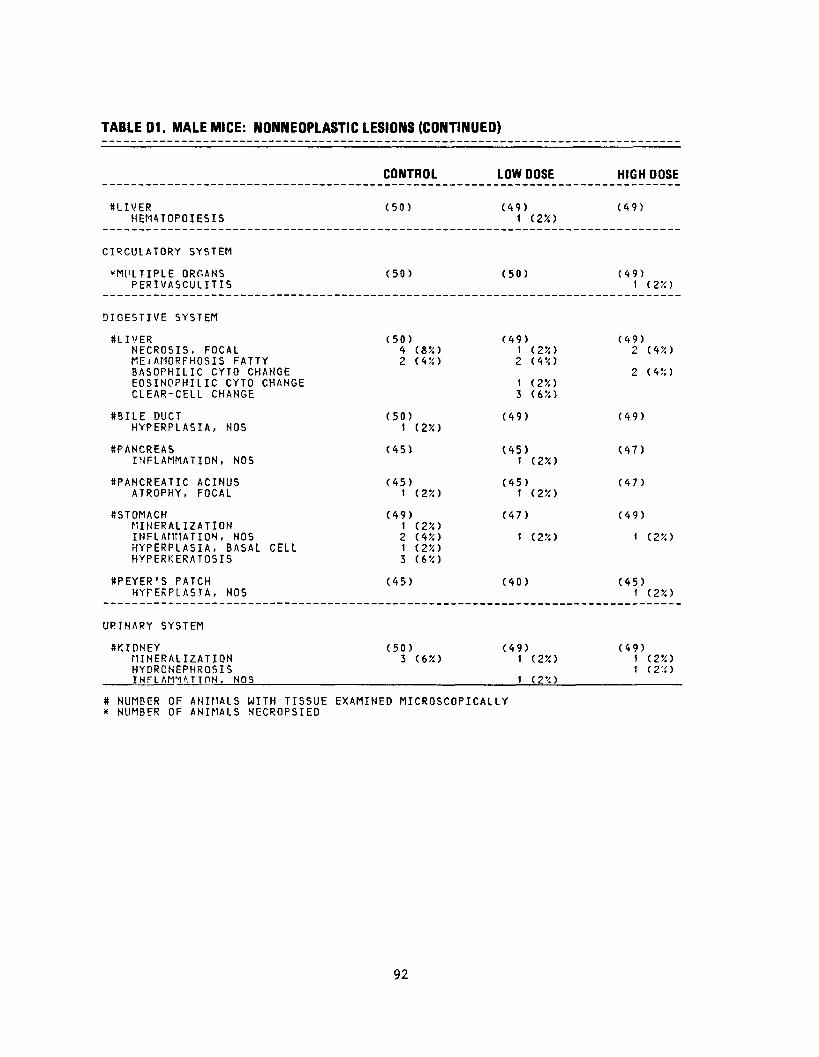
TABLE 01. MALE MICE: NONNEOPLASTIC LESIONS (CONTINUED)
CONTROL LOW DOSE
SLIVER (50) (49) HEMATOPOIESIS 1 (.2%)
CIRCULATORY SYSTEM
"MULTIPLE ORGANS (50) (50) PERIVASCULITIS
DIGESTIVE SYSTEM
SLIVER (50) (49) NECROSIS, FOCAL 4 (85O 1 (2*) KEiAMORFHOSIS FATTY 2 (4;o 2 (4*O BASOPHILIC CYTO CHANGE EOSINOPHILIC CYTO CHANGE 1 (25!) CLEAR-CELL CHANGE 3 (6X)
#BILE DUCT (50) (49) HYPERPLASIA, NOS 1 (2X)
8PANCREAS (45) (45)INFLAMMATION, NOS 1 (2X)
3PANCREATIC ACINUS (45) (45)ATROPHY, FOCAL 1 (2X) 1 (2X)
SSTOMACH (49) (47) MINERALIZATION 1 (2X) INFLAMMATION, NOS 2 (4%) 1 (2*) HYPERPLASIA, BASAL CELL 1 (2X) HYPERKERATOSIS 3 (6«)
ItPEYER'S PATCH (45) (40) HYPERPLAS.TA, NOS
URINARY SYSTEM
SKIDNEY (50) (49) MINERALIZATION 3 (6*) 1 (2X) HYDRONEPHROSIS INFLAMI'lTTON, NOS 1 (2*O
# NUMBER OF ANIMALS WITH TISSUE EXAMINED MICROSCOPICALLY »< NUMBER OF ANIMALS NECROPSIED
HIGH
(49)
(49)1
(49)"> C.
2
(49)
(47)
(47)
(49)
1
(45)1
(49)1 1
DOSE
(2X)
(4X)
(4*)
(2%)
(2%)
(2X) (2%)
92
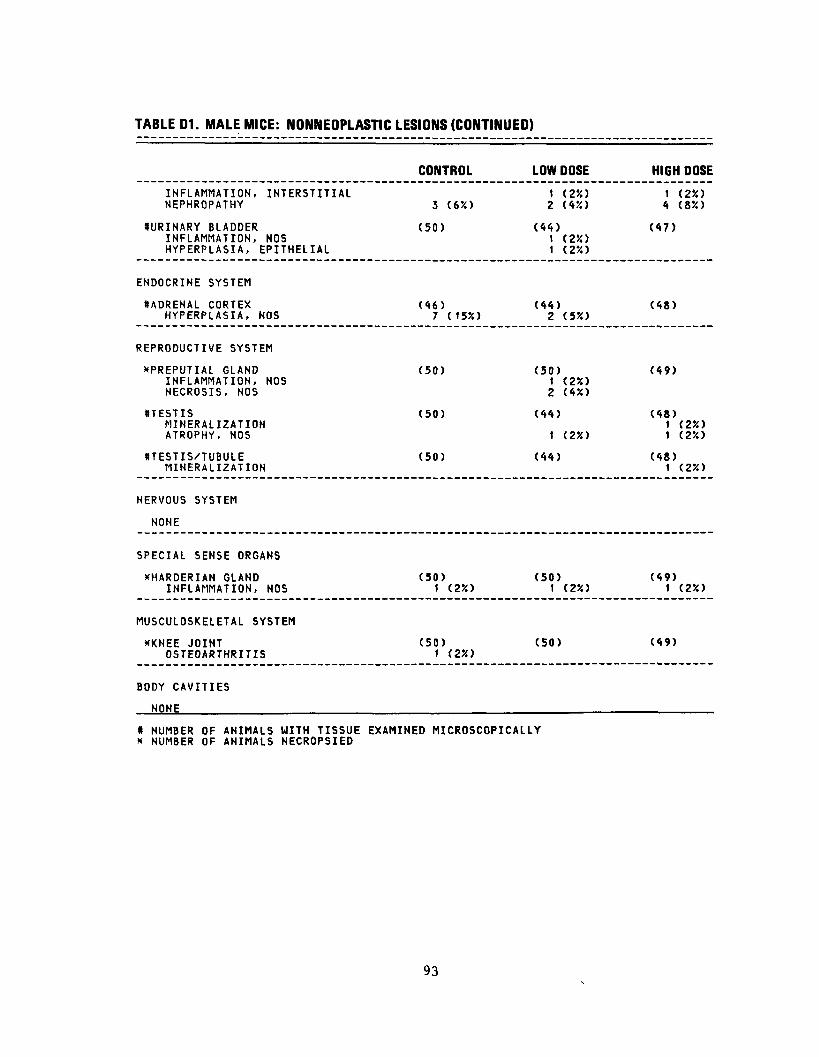
TABLE 01. MALE MICE: NONNEOPLASTIC LESIONS (CONTINUED)
CONTROL LOW DOSE HIGH DOSE
INFLAMMATION, INTERSTITIAL NEPHROPATHY 3 (6%)
1 (2X) 2 (450
1 (2*) 4 (85O
((URINARY BLADDER INFLAMMATION, NOS HYPERPLASIA, EPITHELIAL
(50) (44) t (250 1 (2%)
(47)
ENDOCRINE SYSTEM
KADRENAL CORTEX HYPERPLASIA, NOS
(46)7 (155O
(44)2 (555)
(48)
REPRODUCTIVE SYSTEM
XPREPUTIAL GLAND INFLAMMATION, NOS NECROSIS, NOS
(50) (50)1 (2%) 2 (45O
(49)
#TESTIS MINERALIZATION ATROPHY, NOS
(50) (44)
1 (2%)
(48)1 (2JO 1 (250
ttTESTIS/TUBULE MINERALIZATION
(50) (44) (48)1 (2X)
NERVOUS SYSTEM
NONE
SPECIAL SENSE ORGANS
XHARDERIAN GLAND INFLAMMATION, NOS
(50)1 (25O
(50)1 (2X)
(49)1 (2X)
MUSCULOSKELETAL SYSTEM
*KNEE JOINT OSTEOARTHRITIS
(50)1 (2%)
(50) (49)
BODY CAVITIES
NONE
* NUMBER OF ANIMALS WITH TISSUE EXAMINED MICROSCOPICALLY * NUMBER OF ANIMALS NECROPSIED
93
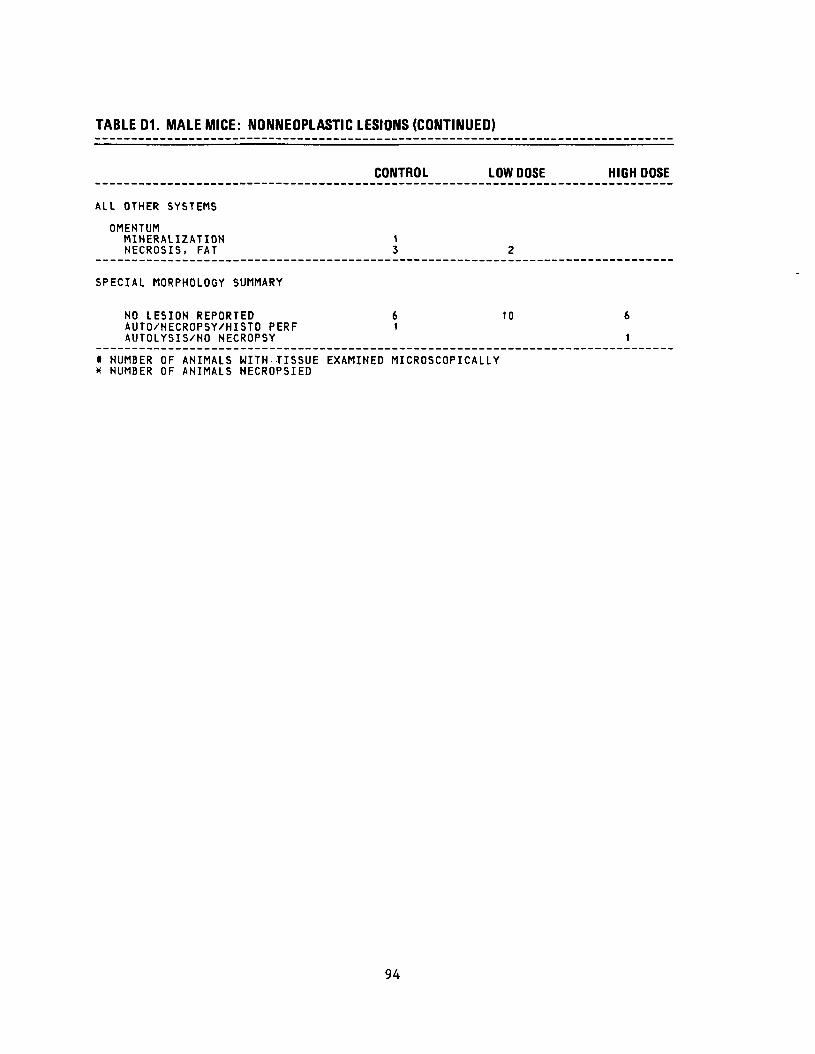
TABLE 01. MALE MICE: NONNEOPLASTIC LESIONS (CONTINUED)
CONTROL LOW DOSE HIGH DOSE
ALL OTHER SYSTEMS
OMENTUM MINERALIZATIONNECROSIS, FAT
1 3 2
SPECIAL MORPHOLOGY SUMMARY
#x
NO LESION REPORTEDAUTO/NECROPSY/HISTO PERFAUTOLYSIS/NO NECROPSY
NUMBER OF ANIMALS WITH TISSUE NUMBER OF ANIMALS NECROPSIED
EXAMINED
6 10 1
MICROSCOPICALLY
6
1
94

TABLE D2.
SUMMARY OF THE INCIDENCE OF NONNEOPLASTIC LESIONS IN FEMALE MICE FED DIETS CONTAINING DI(2-ETHYLHEXYL)ADIPATE
7
CONTROL LOW DOSE HIGH DOSE
ANIMALS INITIALLY IN STUDYANIMALS MISSING ANIMALS NECROPSIEDANIMALS EXAMINED HISTOPATHOLOGICALLY
50
50 50
50
50 50
50 1
49 49
INTEGUMENTARY SYSTEM
XSUBCUT TISSUENECROSIS, NOS
(50) (50)1 (250
(49)
RESPIRATORY SYSTEM
#LUNGHEMORRHAGE INFLAMMATION, NO.S
(49) (49) 1 (2%) 2 (4!O
(48)
HEMATOPOIETIC SYSTEM
ttSPLEENHYPERPLASIA, LYMPHOIDHEMATOPOIESIS
(50) 5 (10X)
5 (10X)
(50)
10 (2050
(48)1 (2X)
12 (25X)
#LYMPH NODEHEMORRHAGEHEMATOPOIESIS
(43) 1 (2X)
(45)
1 (2?O
(40)
1 (3X)
#LIVERHEMATOPOIESIS
(50) 2 (4X)
(50)2 (4%)
(49) 1 (2X)
•ADRENALHYPERPLASIA, HEMATOPOIETIC
(45) (48) (45)1 (2X)
#THYROIDHYPERPLASIA, HEMATOPOIETIC
(43) (46) (46) 1 (2%)
CIRCULATORY SYSTEM
ItHEARTENDOCARDITIS, BACTERIAL
(50) (49)1 (2X)
(47)
# NUMBER OF ANIMALS WITH TISSUE EXAMINED MICROSCOPICALLY x NUMBER OF ANIMALS NECROPSIED
95
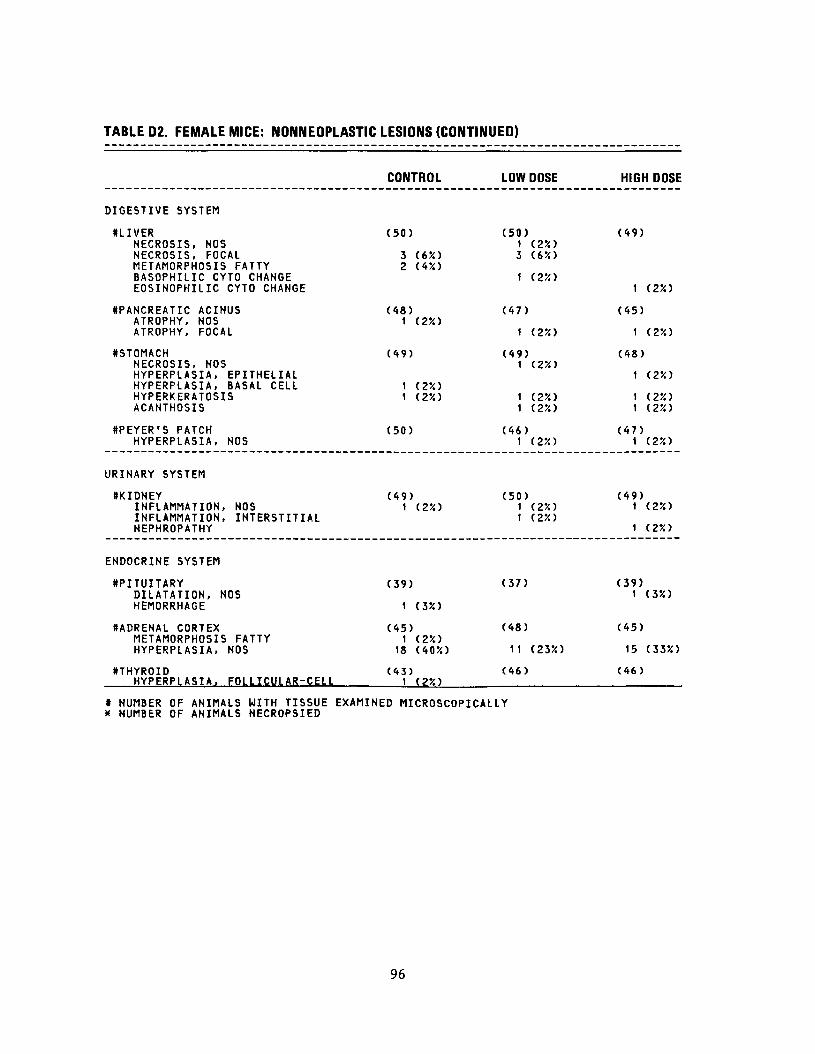
TABLE D2. FEMALE MICE: NONNEOPLASTIC LESIONS (CONTINUED)
HIGH DOSE
(49)
1 (2%)
(45)
1 (2X)
(48)
1 (2X)
1 (23O 1 (25O
(47) 1 (2X)
(49)1 (25O
1 (2X)
(39) 1 (350
(45)
15 (33%)
(46)
DIGESTIVE SYSTEM
((LIVER NECROSIS, NOS NECROSIS, FOCAL METAMORPHOSIS FATTY BASOPHILIC CYTO CHANGE EOSINOPHILIC CYTO CHANGE
((PANCREATIC ACINUS ATROPHY, NOS ATROPHY, FOCAL
((STOMACH NECROSIS, NOS HYPERPLASIA, EPITHELIAL HYPERPLASIA, BASAL CELL HYPERKERATOSIS ACANTHOSIS
((PEYER'S PATCH HYPERPLASIA, NOS
URINARY SYSTEM
SKIDNEY INFLAMMATION, NOS INFLAMMATION, INTERSTITIAL NEPHROPATHY
ENDOCRINE SYSTEM
((PITUITARY DILATATION, NOS HEMORRHAGE
((ADRENAL CORTEX METAMORPHOSIS FATTY HYPERPLASIA, NOS
•THYROID HYPERPLASIA, FOLLICULAR-CELL
CONTROL
(50)
3 (6X) 2 (45O
(48) 1 (2X)
(49)
1 (2X) 1 (250
(50)
(49)1 (2%)
(39)
1 (3X)
(45)1 (25O
18 (40X)
(43) 1 (2*)
LOW DOSE
(50) 1 (2*) 3 (6X)
1 (25O
(47)
1 (25O
(49)1 (2X)
1 (2%) 1 (2%)
(46) 1 (2%)
(50) 1 (2%) 1 (2%)
(37)
(48)
11 (2350
(46)
# NUMBER OF ANIMALS WITH TISSUE EXAMINED MICROSCOPICALLY * NUMBER OF ANIMALS NECROPSIED
96
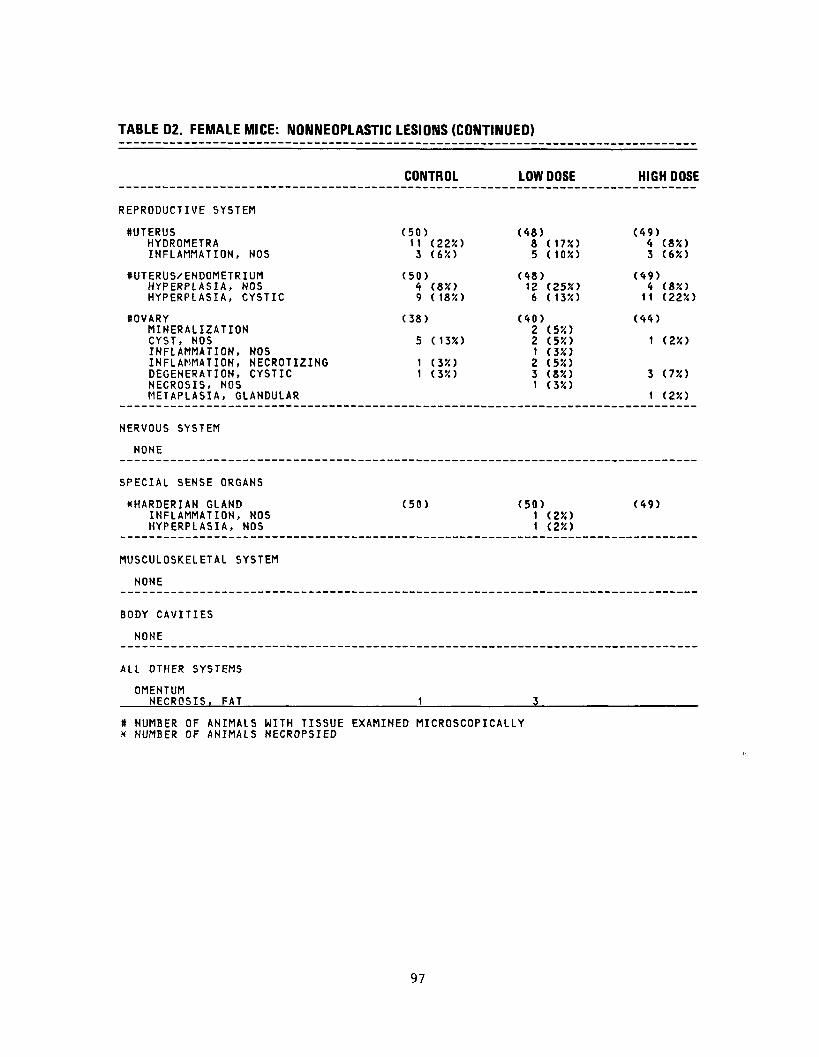
TABLE D2. FEMALE MICE: NONNEOPLASTIC LESIONS (CONTINUED)
REPRODUCTIVE SYSTEM
ttUTERUS HYDROMETRA INFLAMMATION, NOS
#UTERUS/ENDOMETRIUM HYPERPLASIA, NOS HYPERPLASIA, CYSTIC
tlOVARY MINERALIZATION CYST, NOS INFLAMMATION, NOS INFLAMMATION, NECROTIZING DEGENERATION, CYSTIC NECROSIS, NOS METAPLASIA, GLANDULAR
NERVOUS SYSTEM
NONE
SPECIAL SENSE ORGANS
*HARDERIAN GLAND INFLAMMATION, NOS HYPERPLASIA, NOS
MUSCULOSKELETAL SYSTEM
NONE
BODY CAVITIES
NONE
ALL OTHER SYSTEMS
OMENTUM NECROSIS, FAT
CONTROL LOW DOSE HIGH DOSE
(50) 11 (22X) 3 C65O
(48) 8 (17%) 5 (10%)
(49)4 (8X) 3 (6X)
(50) 4 (85O 9 (18X)
(48) 12 (25%) 6 (13%)
(49)4 (8X)
11 (22%)
(38)
5 (13X)
1 (350 1 (3X)
(40) 2 (5%) 2 (5%) 1 (3%) 2 3
(44)
1 (250
3 (7X) 1 (3%)
1 (25{)
(50) (50) 1 (25O
(49)
1 (2%)
# NUMBER OF ANIMALS WITH TISSUE EXAMINED MICROSCOPICALLY * NUMBER OF ANIMALS NECROPSIED
97
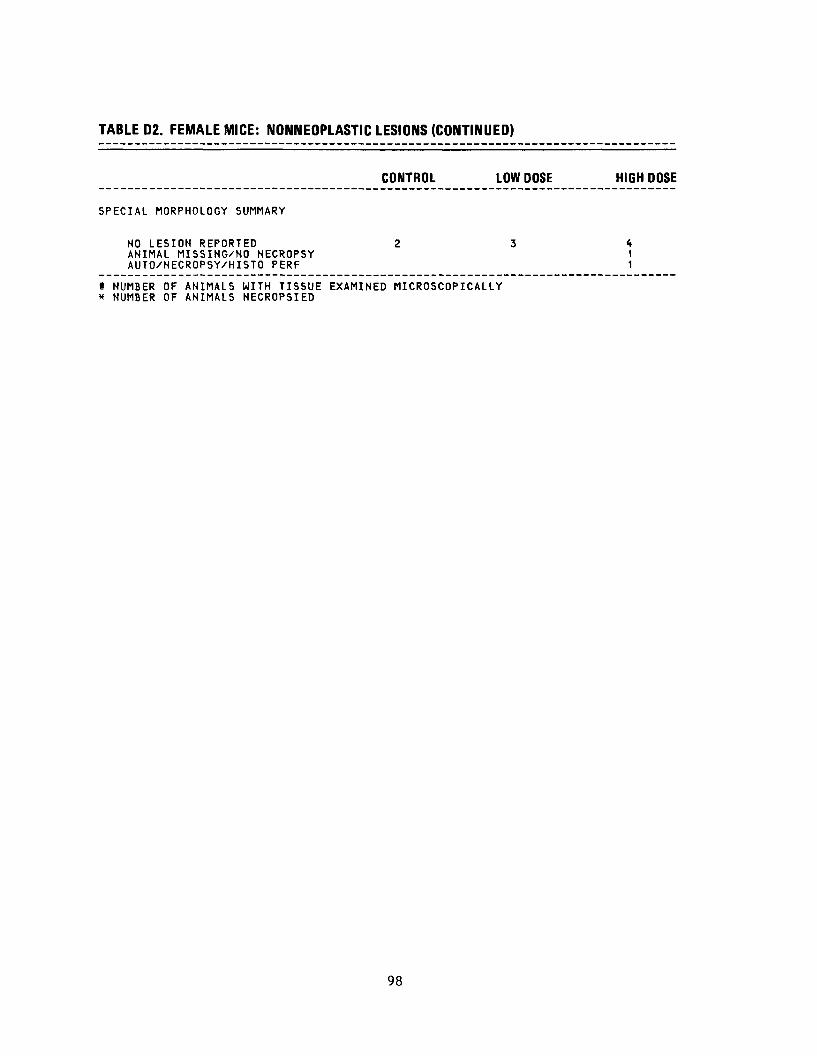
TABLE 02. FEMALE MICE: NONNEOPLASTIC LESIONS (CONTINUED)
CONTROL LOW DOSE HIGH DOSE
SPECIAL MORPHOLOGY SUMMARY
NO LESION REPORTED 2 ANIMAL MISSING/NO NECROPSY AUTO/NECROPSY/HISTO PERF
3
# NUMBER OF ANIMALS WITH TISSUE EXAMINED MICROSCOPICALLY * NUMBER OF ANIMALS NECROPSIED
<• 1 1
98
APPENDIX E
ANALYSIS OF Dl(2-ETHYLHEXYL)ADIPATE LOT NO. 0-62-494
MIDWEST RESEARCH INSTITUTE
99

100
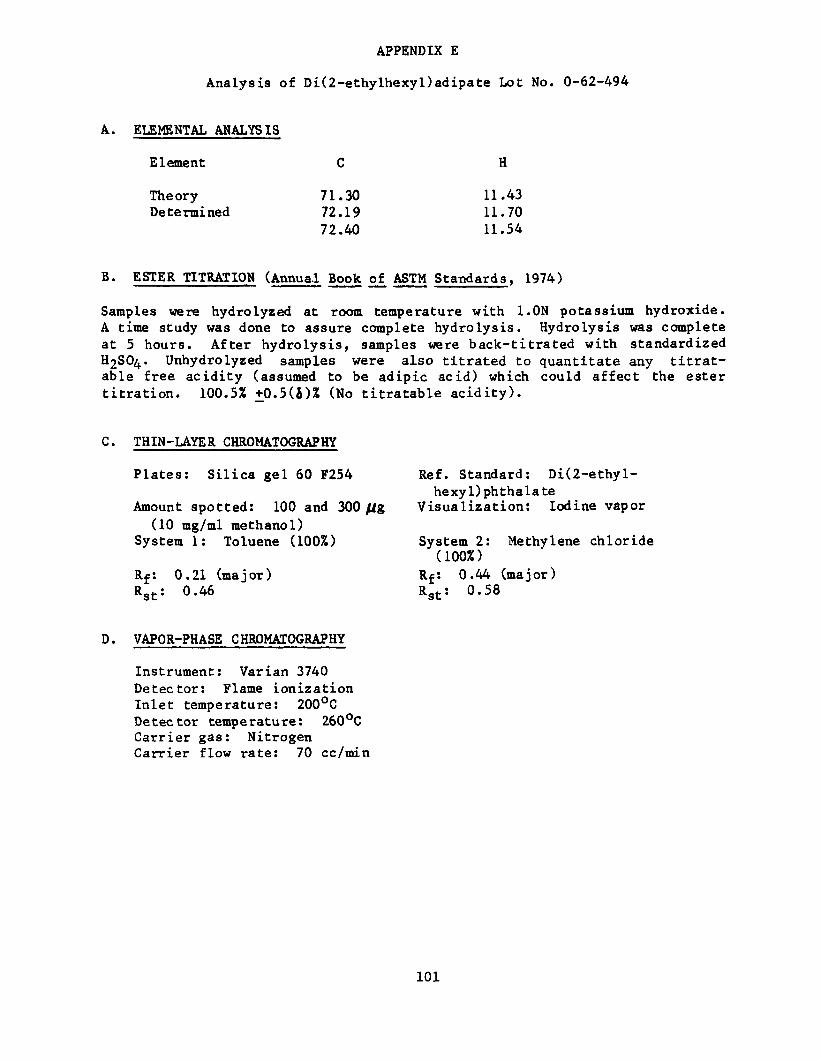
APPENDIX E
Analysis of Di(2-ethylhexyl)adipate Lot No. 0-62-494
A. ELEMENTAL ANALYSIS
Element H
Theory 71.30 11.43 Determined 72.19 11.70
72.40 11.54
B. ESTER TITRATION (Annual Book £f ASTM Standards, 1974)
Samples were hydrolyzed at room temperature with l.ON potassium hydroxide. A time study was done to assure complete hydrolysis. Hydrolysis was complete at 5 hours. After hydrolysis, samples were back-titrated with standardized H2S04- Unhydrolyzed samples were also titrated to quantitate any titratable free acidity (assumed to be adipic acid) which could affect the ester titration. 100.5% +0.5(i)% (No titratable acidity).
C. THIN-LAYER CHROMATOGRAPHY
Plates: Silica gel 60 F254 Ref. Standard: Di(2-ethylhexyDphthalate
Amount spotted: 100 and 300 //g Visualization: Iodine vapor (10 mg/ml methanol)
System 1: Toluene (100%) System 2: Methylene chloride (100%)
0.21 (major) R£: 0.44 (major) Rst 0.46 Rgt: 0.58
D. VAPOR-PHASE CHROMATOGRAPHY
Instrument: Varian 3740 Detector: Flame ionization Inlet temperature: 200°C Detector temperature: 260°C Carrier gas: Nitrogen Carrier flow rate: 70 cc/min
101
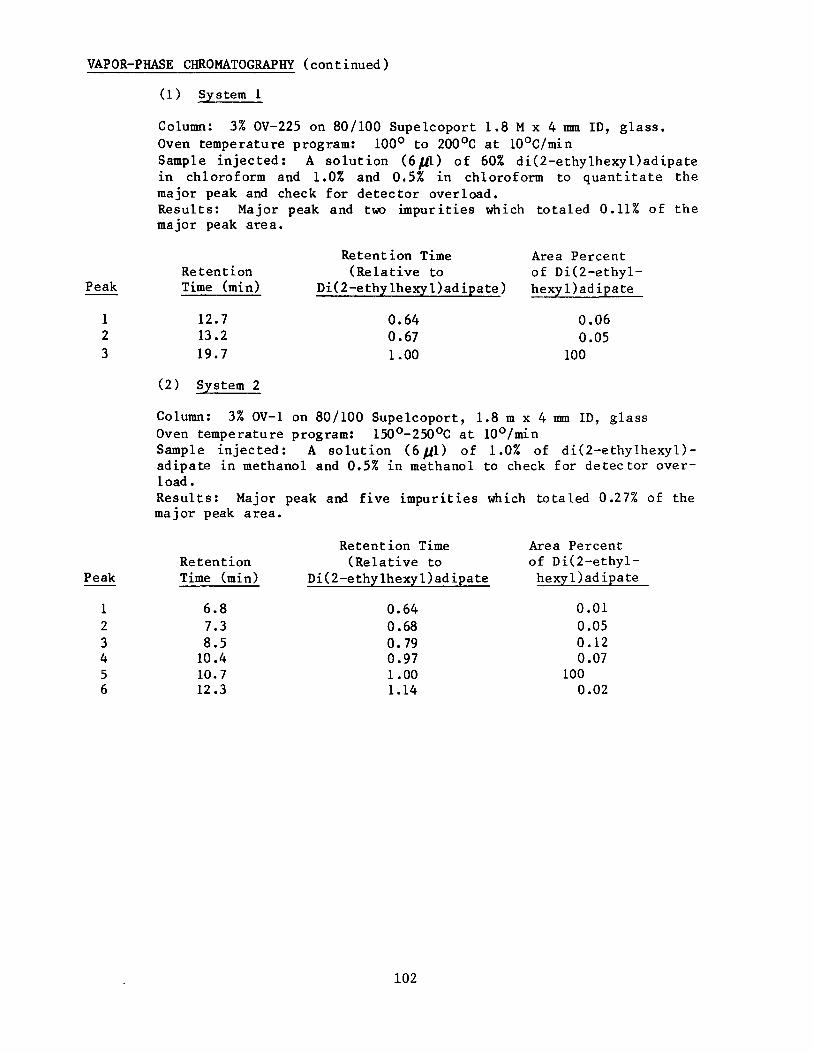
VAPOR-PHASE CHROMATOGRAPHY (continued)
(1) System 1
Column: 3% OV-225 on 80/100 Supelcoport 1.8 M x 4 mm ID, glass. Oven temperature program: 100° to 200°C at 10°C/min Sample injected: A solution (6/fL) of 60% di(2-ethylhexyl)adipate in chloroform and 1.0% and 0.5% in chloroform to quantitate the major peak and check for detector overload. Results: Major peak and two impurities which totaled 0.11% of the major peak area.
PeakRetention
Time (min)
Retention Time (Relative to
Di(2-ethylhexyl)adipate)
123
12.7 13.2 19.7
0.64 0.67 1.00
(2) System 2
Area Percent of Di(2-ethyl
hexypadipate
0.06 0.05 100
Column: 3% OV-1 on 80/100 Supelcoport, 1.8 m x 4 mm ID, glass Oven temperature program: 150°-250°C at 10°/min Sample injected: A solution (6/^1) of 1.0% of di(2-ethylhexyl)adipate in methanol and 0.5% in methanol to check for detector overload. Results: Major peak and five impurities which totaled 0.27% of the major peak area.
RetentionPeak Time (min)
1 6.82 7.33 8.54 10.45 10.76 12.3
Retention Time (Relative to
Di(2-ethylhexyl)adipate
0.64 0.68 0.79 0.97
1.00 1.14
Area Percent of Di(2-ethyl
hexyl)adipate
0.01 0.05 0.12 0.07
100 0.02
102
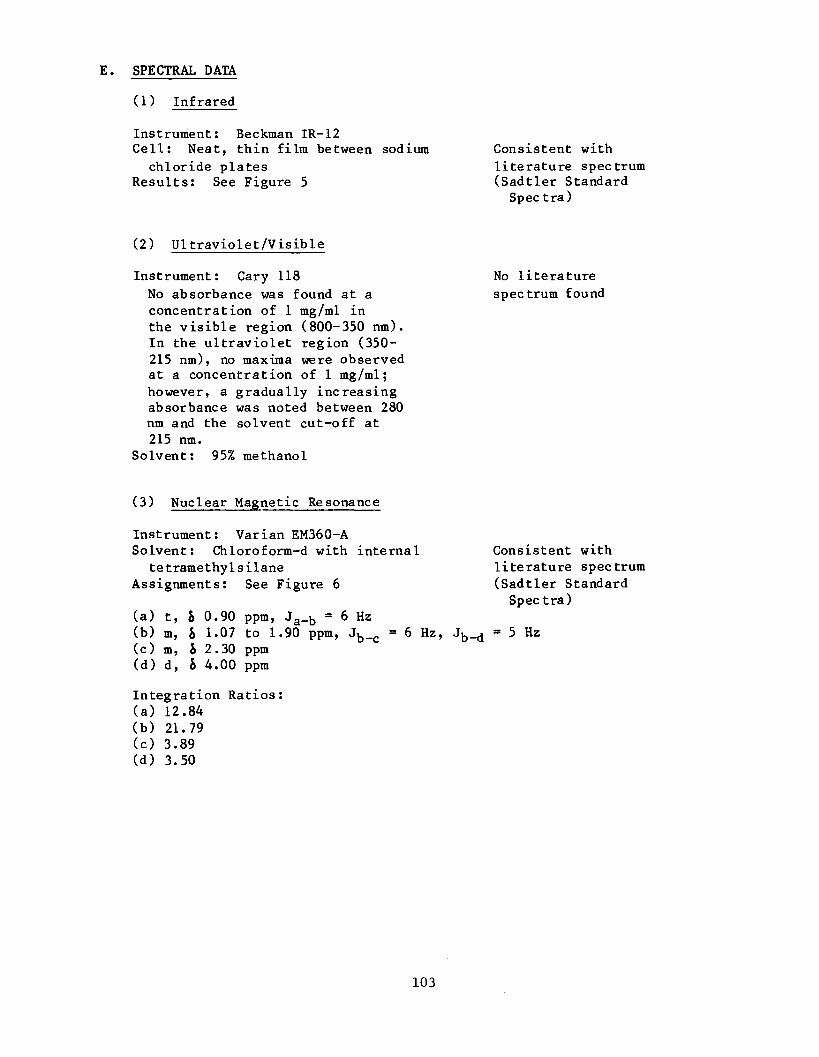
E. SPECTRAL DATA
(1) Infrared
Instrument: Beckman IR-12 Cell: Neat, thin film between sodium Consistent with
chloride plates literature spectrum Results: See Figure 5 (Sadtler Standard
Spectra)
(2) Ultraviolet/Visible
Instrument: Gary 118 No literature No absorbance was found at a spectrum found concentration of 1 mg/ml in the visible region (800-350 nm). In the ultraviolet region (350215 nm), no maxima were observed at a concentration of 1 mg/ml; however, a gradually increasing absorbance was noted between 280 nm and the solvent cut-off at 215 nm.
Solvent: 95% methanol
(3) Nuclear Magnetic Resonance
Instrument: Varian EM360-A Solvent: Chloroform-d with internal Consistent with
tetramethylsilane literature spectrum Assignments: See Figure 6 (Sadtler Standard
Spectra) (a) t, 0.90 ppm, Ja_b = 6 Hz (b) m, 1.07 to 1.90 ppm, Jb_c = 6 Hz, Jb_d = 5Hz (c) m, & 2.30 ppm (d) d, b 4.00 ppm
Integration Ratios: (a) 12.84 (b) 21.79 (c) 3.89 (d) 3.50
103

1400 UOO 3000 2200 2030 1900 UK 1700 WS
Figure 5. Infrared Absorption Spectrum Di(2-ethylhexyl)adipate Lot No. 0-62494
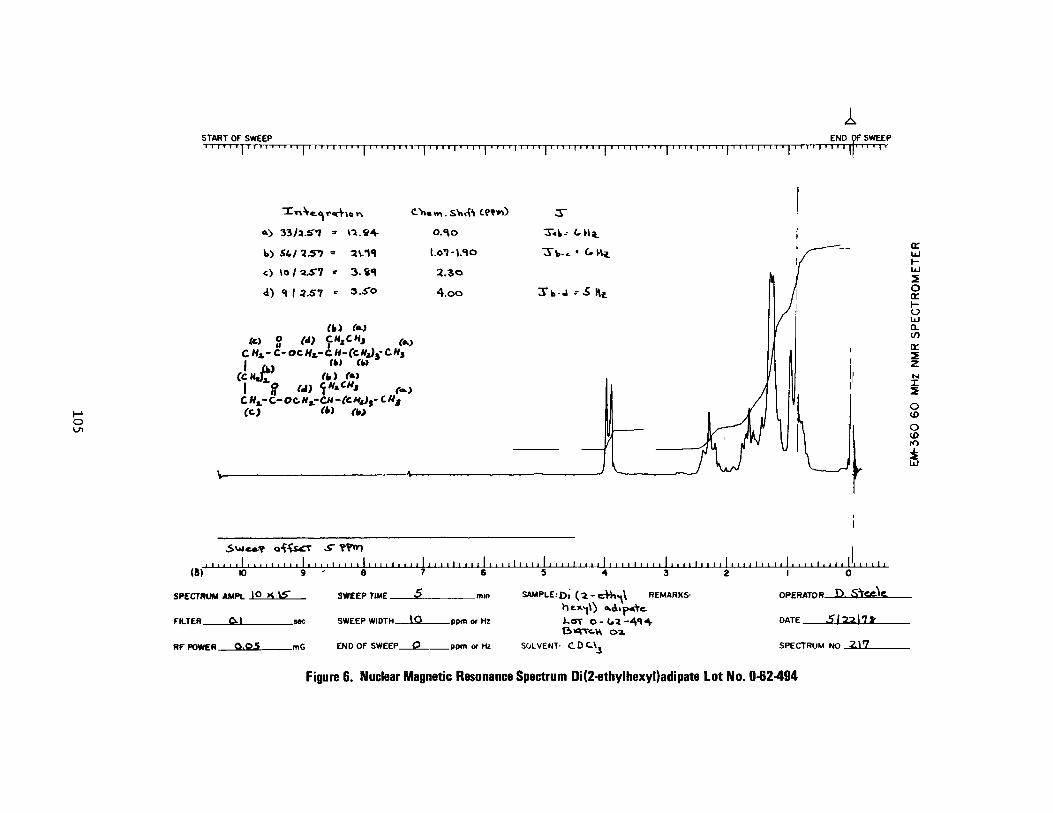
START OF SWEEP i I I ' i i I I i i i i i i i i i i i i i i i i i i i i i i i i i m~] P
END pF SWEEP M i l l
»O *<•/ 2.51) « 2V11
O 10/-S.5-7 ' 3.««t
ft) O CHa,-C-oe«a.-CH-fC«i)j-C.Hj
ft)
4.oo 3VJ -^ Ht O UJ a. en
2
N
O Ol
CO O (C
rO
i
... . . . I . . . . . . . . . I . . (8) 10 9
SPECTRUM AMPL \O *>&
FILTER O.1 sec
RF PTHKFB O.OS mG
i i i . i i l i i . i l
SWefPTIMP 5
6
mm
SVUFFPWIOTH IO
END OF SWEEP O ppm or Hi
5
SAMPLE .̂' (1
SOLVENT
4 3
REMARKS OPFRATOR D.
DATE ̂ _JzLt22jii_
SPECTRUM NO 2.\7
Figure 6. Nuclear Magnetic Resonance Spectrum Di(2-ethylhexyl)adipate Lot No. 0-62494

106

APPENDIX F
ANALYSIS OF DI(2-ETHYLHEXYL)ADIPATE LOT NO. GC-2-27-76
MIDWEST RESEARCH INSTITUTE
107

108
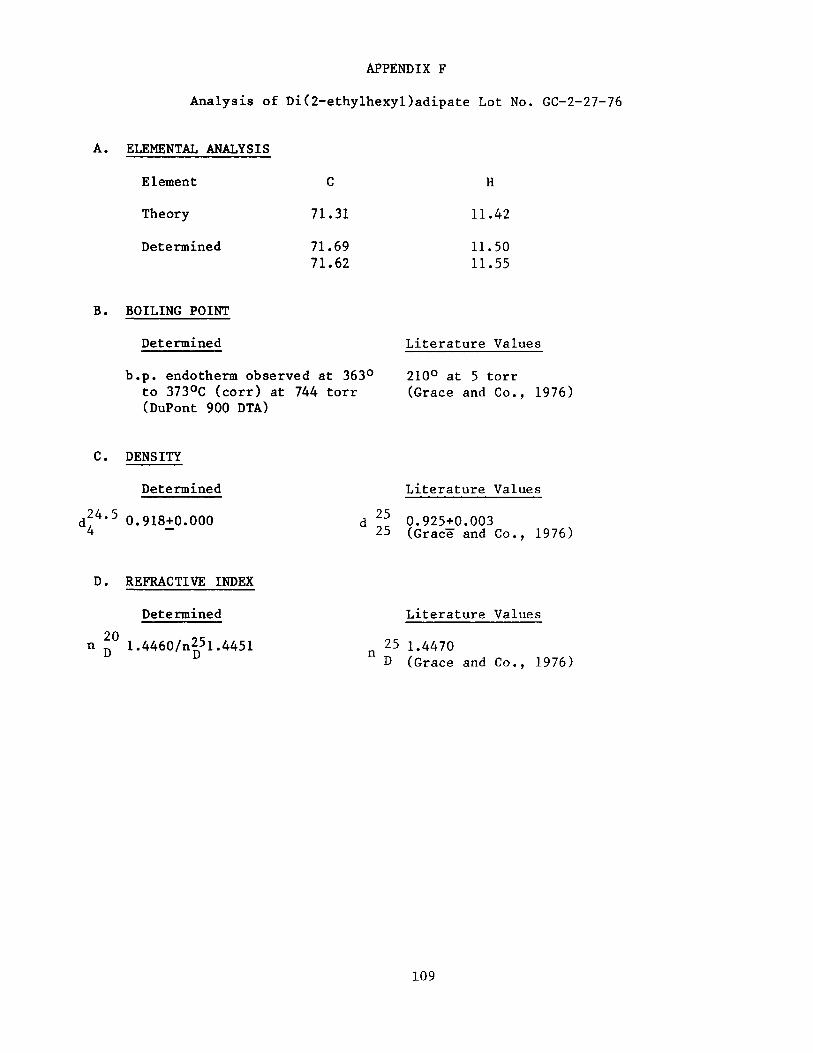
APPENDIX F
Analysis of Di(2-ethylhexyl)adipate Lot No. GC-2-27-76
A. ELEMENTAL ANALYSIS
Element C H
Theory 71.31 11.42
Determined 71.69 11.50 71.62 11.55
B. BOILING POINT
Determined Literature Values
b.p. endotherm observed at 363° 210° at 5 torr to 373°C (corr) at 744 torr (Grace and Co., 1976) (DuPont 900 DTA)
C. DENSITY
Determined Literature Values
25 d24'5 0.918+0.000 d -" 0.925+0.003 4 — 25 (Grace" and Co., 1976)
D. REFRACTIVE INDEX
Determined Literature Values
20 nD 1.4460/n25i.4451 25 1.4470
D (Grace and Co., 1976)
109
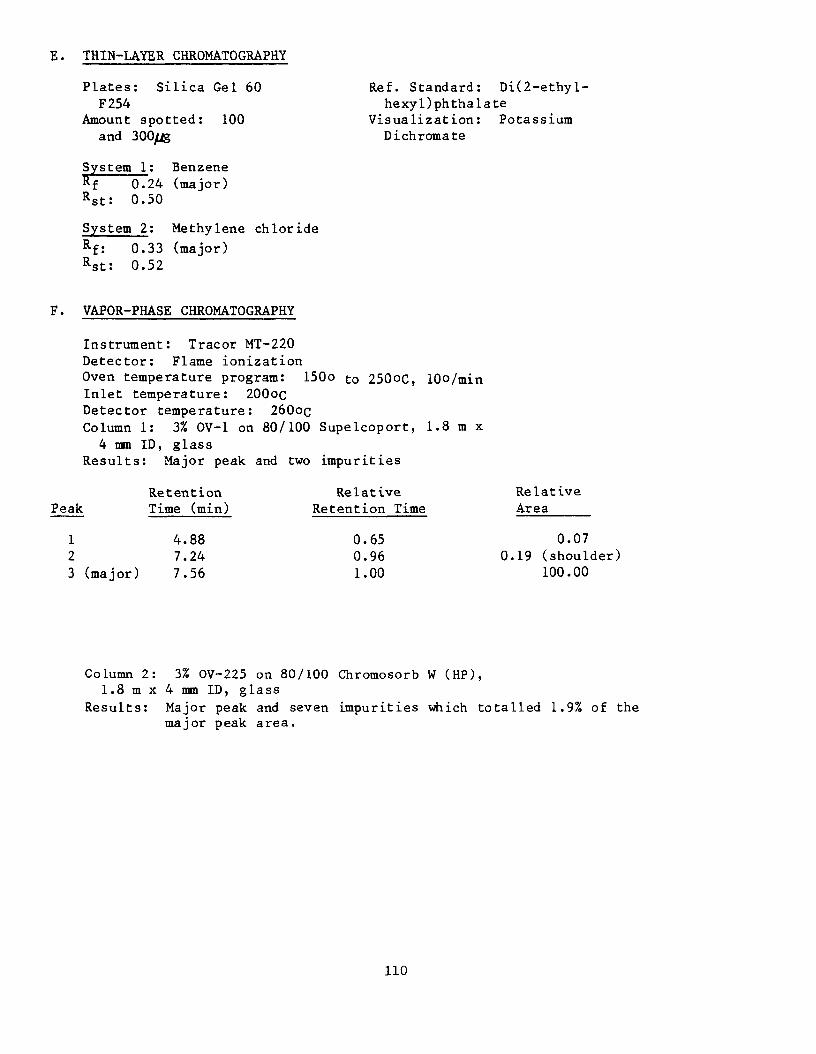
E. THIN-LAYER CHROMATOGRAPHY
Plates: Silica Gel 60 Ref. Standard: Di(2-ethylF254 hexyDphthalate
Amount spotted: 100 Visualization: Potassium and 3QQfjg Dichrornate
System 1; Benzene E f 0 . 2 4 (major) Rst: 0.50
System 2; Methylene chloride Rf: 0.33 (major) Rst: 0.52
F. VAPOR-PHASE CHROMATOGRAPHY
Instrument: Tracer MT-220 Detector: Flame ionization Oven temperature program: 150o to 250oc, 10o/min Inlet temperature: 200oc Detector temperature: 260oc Column 1: 3% OV-1 on 80/100 Supelcoport, 1.8 m x 4 mm ID, glass
Results: Major peak and two impurities
Retention Relative Relative Peak Time (min) Retention Time Area
1 4.88 0.65 0.07 2 7.24 0.96 0.19 (shoulder) 3 (major) 7.56 1.00 100.00
Column 2: 3% OV-225 on 80/100 Chromosorb W (HP), 1.8 m x 4 mm ID, glass
Results: Major peak and seven impurities which totalled 1.9% of the major peak area.
110
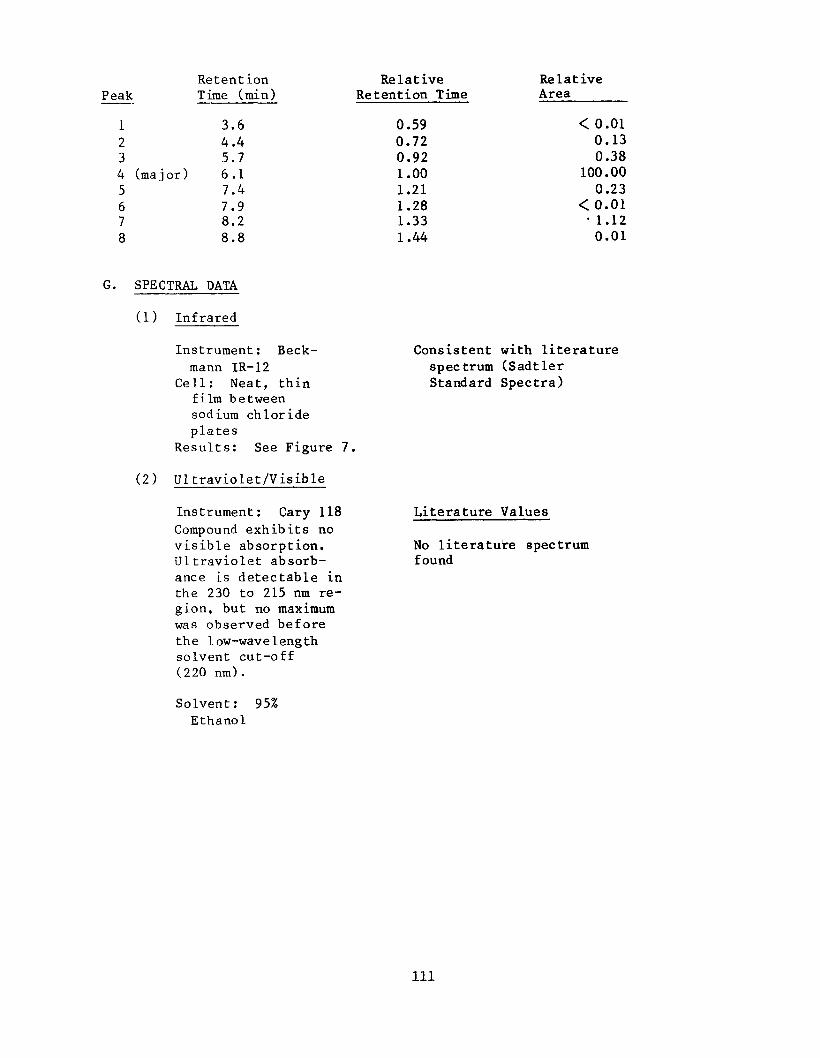
Retention Relative Relative Peak Time (min) Retention Time Area
1 3.6 0.59 < 0.01 2 4.4 0.72 0.13 3 5.7 0.92 0.38 4 (major) 6.1 1.00 100.00 5 7.4 1.21 0.23 6 7.9 1.28 <0.01 7 8.2 1.33 • 1.12 8 8.8 1.44 0.01
G. SPECTRAL DATA
(1) Infrared
Instrument: Beck Consistent with literature mann IR-12 spectrum (Sadtler
Cell: Neat, thin Standard Spectra) film between sodium chloride plates
Results: See Figure 7,
(2) Ultraviolet/Visible
Instrument: Gary 118 Literature Values Compound exhibits no visible absorption. No literature spectrum Ultraviolet absorb found ance is detectable in the 230 to 215 nm region, but no maximum was observed before the low-wavelength solvent cut-off (220 nm).
Solvent: 95% Ethanol
111
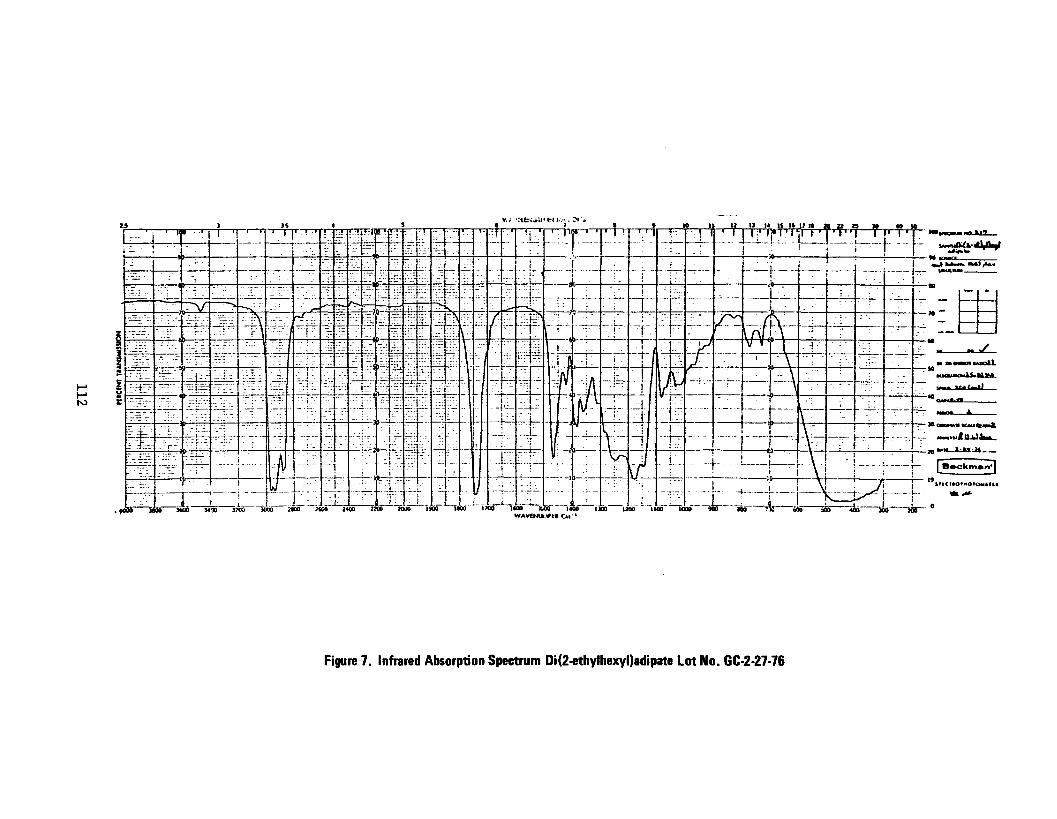
M»VKv>iaAl2_
• ., i ;
3?ob JOOO 2«00 2«0 2«C 2200 20UO 1900 i«» "Two imT^ too iwo ijoo i MO-'
Figure 7. Infrared Absorption Spectrum Di(2-ethylhexyl)adipate Lot No. GC-2-27-76

(3) Nuclear Magnetic Resonance
Instrument: Varian Consistent with literature HA- 100 spectrum (Sadtler Standard
Solvent: Chloroform-d Spectra) with internal tetramethylsilane
Assignments (See Figure 8). a - t, & 0.88 ppm
(Jab = 7 Hz) b = m, 1.15 to 1.90 ppm c = m, 5 2.31 ppm
d, i 4.00 ppmrr— 5 Hz)
Integration Ratios:
a = 11.54 b = 22.19 c = 3.85 d = 4.48
113
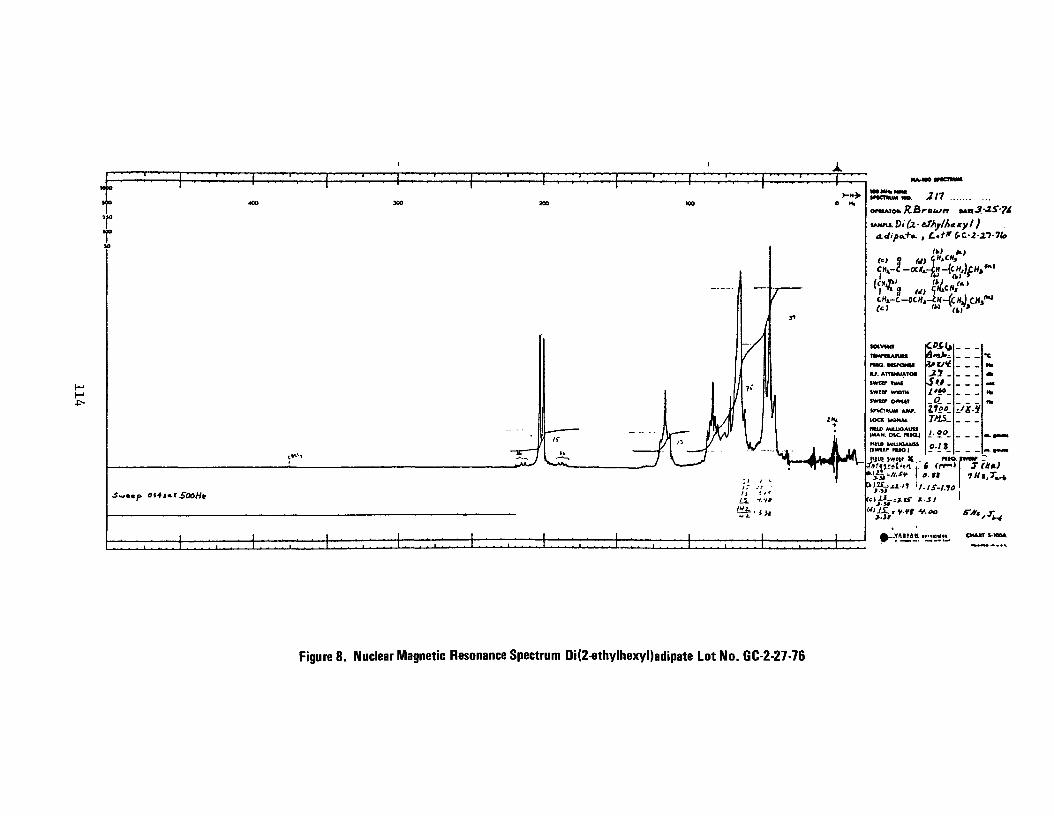
a.dipa.+».
'*> ^> ll'c'l<«» S «> e, »
CH^-i -OC^-fa -{CHjf «,
Lf. ATnMUATOt J.J . VHW TiMf Stf. SWMT WIDTH twur emir -.o_ '.
LOCX MOHA1
(MAR OtC KM.)
illio )w«r 1( mo. fwtif r
k!/i«//.^ f«.ft 7//l,r,.
o«Ajrr t-toM
Figure 8. Nuclear Magnetic Resonance Spectrum Di(2-ethylhexyl)adipate Lot No. GC-2-27-76
APPENDIX G
STABILITY ANALYSIS OF DI(2-ETHYLHEXYL)ADIPATE IN FORMULATED DIETS
MIDWEST RESEARCH INSTITUTE
115

116
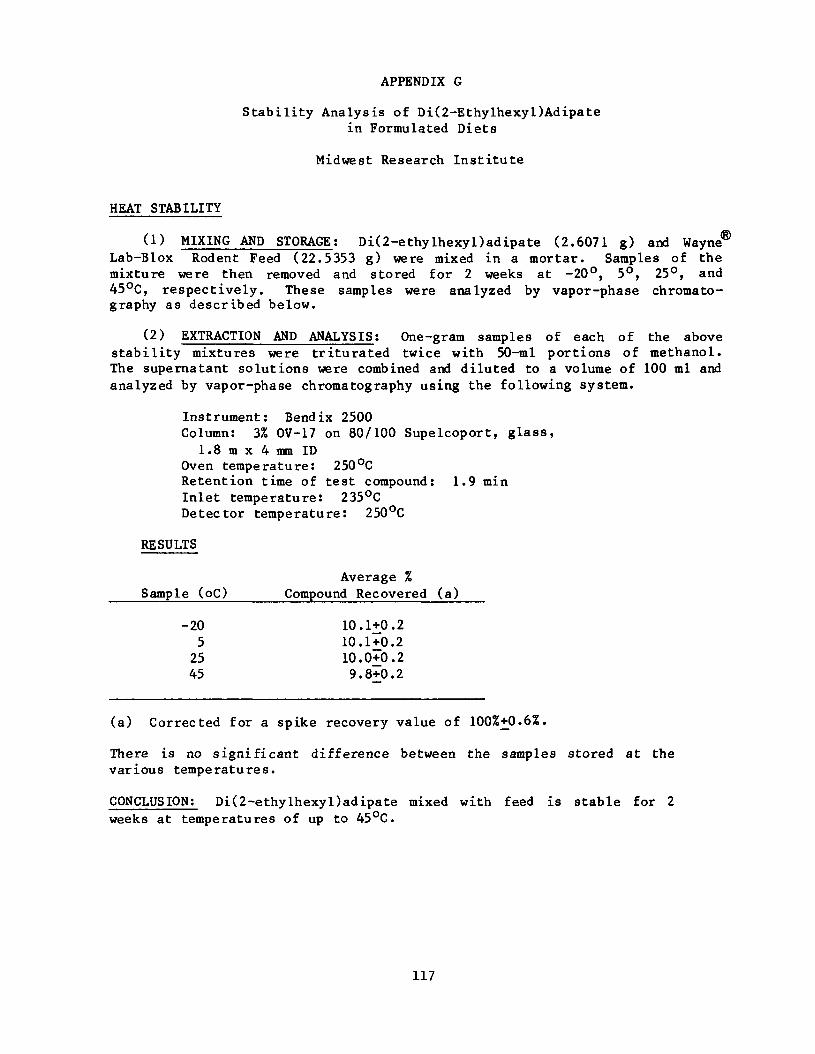
APPENDIX G
Stability Analysis of Di(2-Ethylhexyl)Adipate in Formulated Diets
Midwest Research Institute
HEAT STABILITY
(1) MIXING AND STORAGE! Di(2-ethylhexyl)adipate (2.6071 g) and Wayne*0
Lab-Blox Rodent Feed (22.5353 g) were mixed in a mortar. Samples of the mixture were then removed and stored for 2 weeks at -20°, 5°, 25°, and 45°C, respectively. These samples were analyzed by vapor-phase chromatography as described below.
(2) EXTRACTION AND ANALYSIS; One-gram samples of each of the above stability mixtures were triturated twice with 50-ml portions of methanol. The supernatant solutions were combined and diluted to a volume of 100 ml and analyzed by vapor-phase chromatography using the following system.
Instrument: Bendix 2500 Column: 3% OV-17 on 80/100 Supelcoport, glass,
1.8 m x 4 mm ID Oven temperature: 250°C Retention time of test compound: 1.9 min Inlet temperature: 235°C Detector temperature: 250°C
RESULTS
Average % Sample (oC) Compound Recovered (a)
-20 10.1+0.2 5 10.1+0.2
25 10.0+0.2 45 9.8+0.2
(a) Corrected for a spike recovery value of 100%+_0.6%.
There is no significant difference between the samples stored at the various temperatures.
CONCLUSION; Di(2-ethylhexyl)adipate mixed with feed is stable for 2 weeks at temperatures of up to 45°C.
117

118

APPENDIX H
ANALYSIS OF FORMULATED DIETS FOR CONCENTRATIONS OF DI(2-ETHYLHEXYL)ADIPATE
119

120
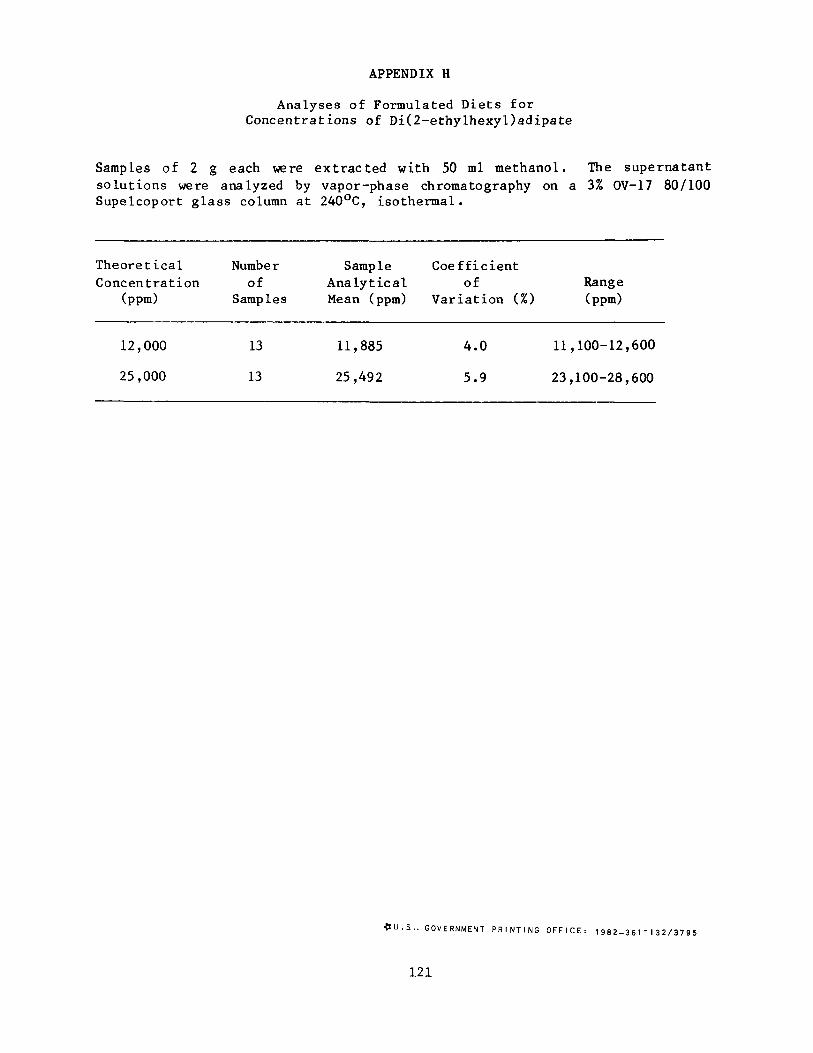
APPENDIX H
Analyses of Formulated Diets for Concentrations of Di(2-ethylhexyl)adipate
Samples of 2 g each were extracted with 50 ml methanol. The supernatant solutions were analyzed by vapor-phase chromatography on a 3% OV-17 80/100 Supelcoport glass column at 240°C, isothermal.
Theoretical Number Sample Coefficient Concentration of Analytical of Range
(ppm) Samples Mean (ppm) Variation (%) (ppm)
12,000 13 11,885 4.0 11,100-12,600
25,000 13 25,492 5.9 23,100-28,600
<SU.S.. GOVERNMENT P R I N T I N G OFFICE: 1982-361-132/3795
121

NIH Publication No. 81-1768 Revised March 1982