cardiac cycle ppt (2)
DESCRIPTION
TRANSCRIPT
Seminar
Definition
• Cardiac cycle is defined as the sequence of coordinated events which take place during heartbeat.
• Each heartbeat consists of two major periods called systole and diastole.
• During systole there is contraction of the cardiac muscle and pumping of blood from the heart through arteries.
• • During diastole, there is relaxation of cardiac muscle and filling of blood.
• Various changes occur in different chambers of heart during each heartbeat.
• These changes are repeated during every heartbeat in a cyclic manner.
Divisions of cardiac cycle
• The contraction and relaxation of atria are called atrial systole and atrial diastole respectively. The contraction and relaxation of ventricles are called ventricular systole and ventricular diastole respectively.
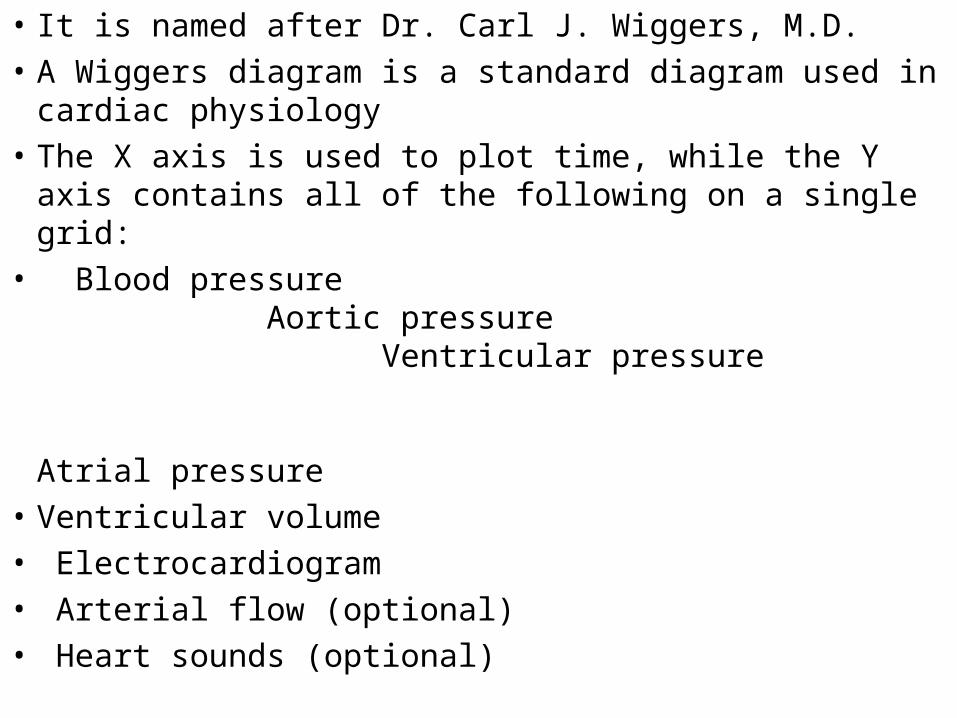
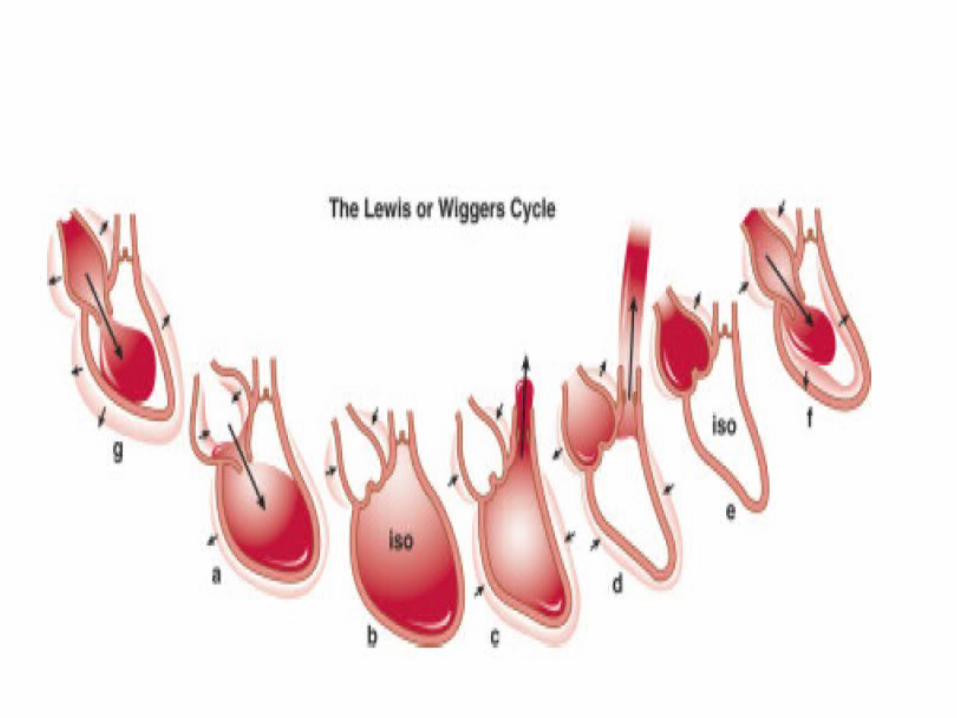
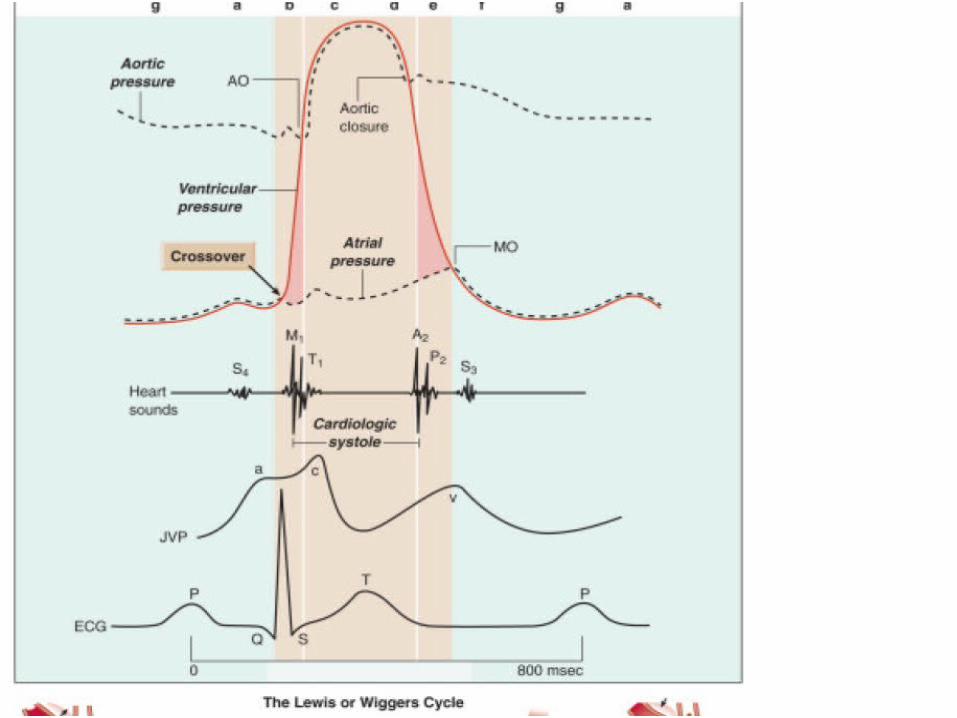
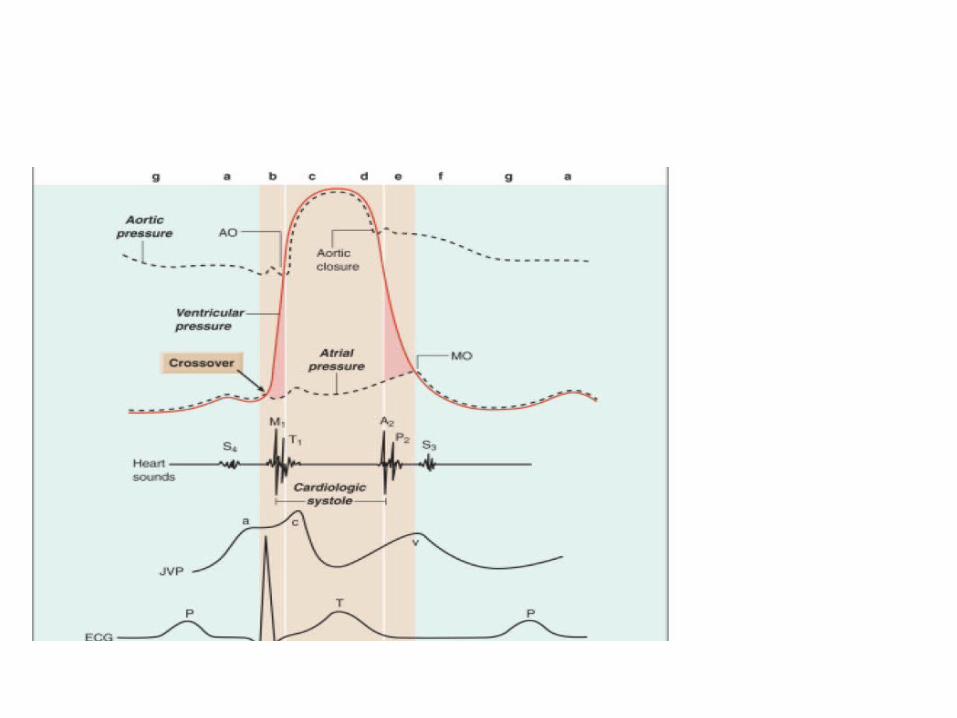
• It is named after Dr. Carl J. Wiggers, M.D. • A Wiggers diagram is a standard diagram used in cardiac
physiology • The X axis is used to plot time, while the Y axis contains
all of the following on a single grid: • Blood pressure Aortic pressure
Ventricular pressure Atrial pressure
• Ventricular volume• Electrocardiogram• Arterial flow (optional)• Heart sounds (optional)

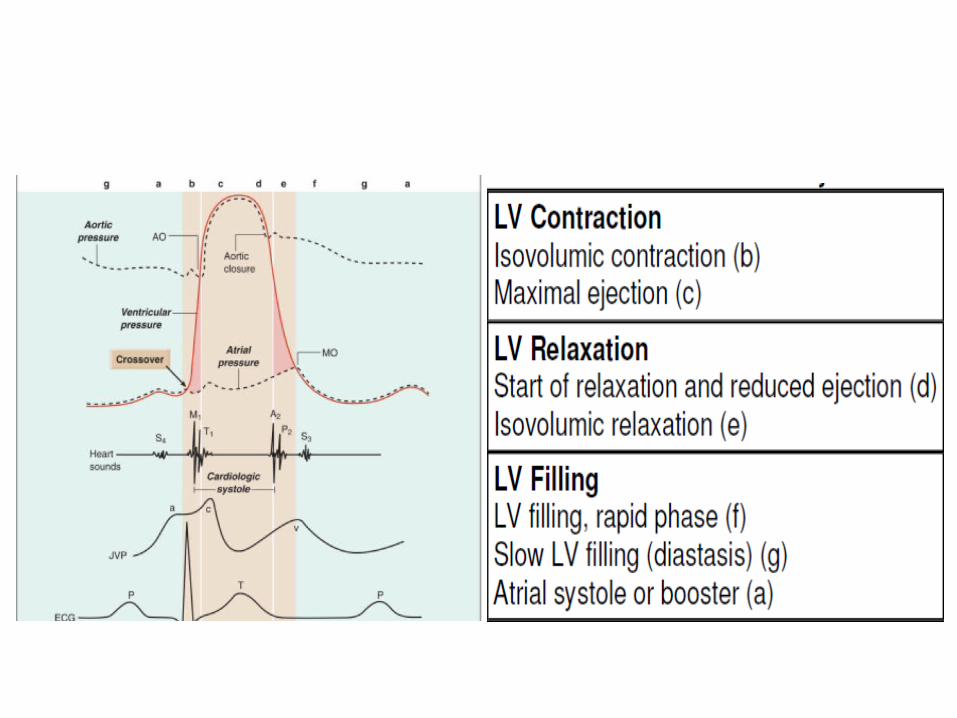
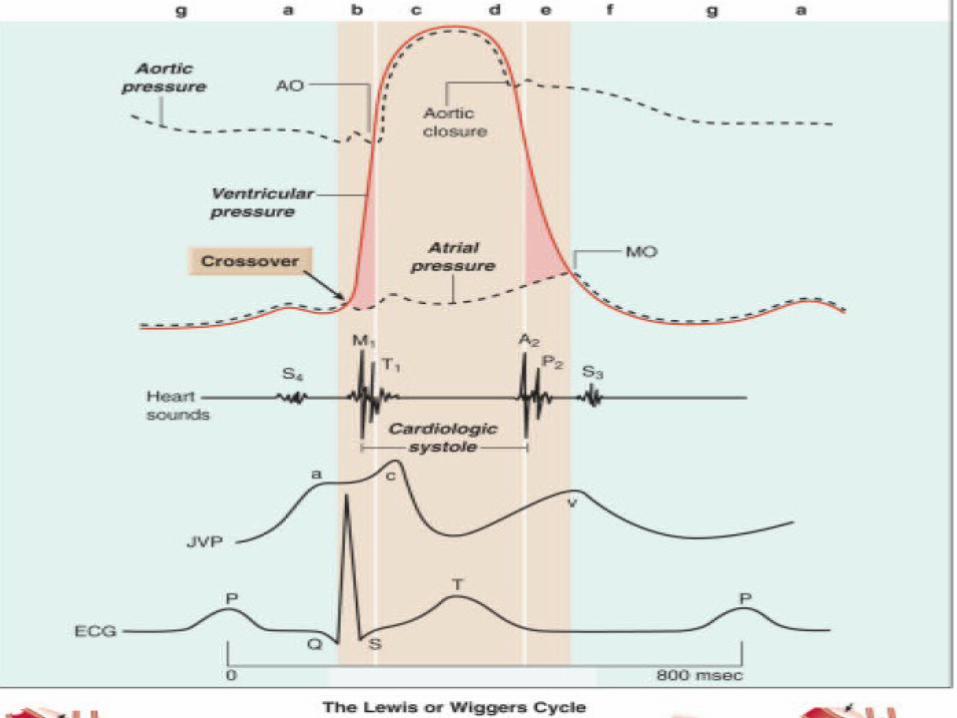
• The cardiac cycle, fully delineated by Lewis but first conceived by Wiggers.
• It yields important information on the temporal sequence of events in the cardiac cycle.
• The three basic events are (1)LV contraction (2) LV relaxation (3) LV filling
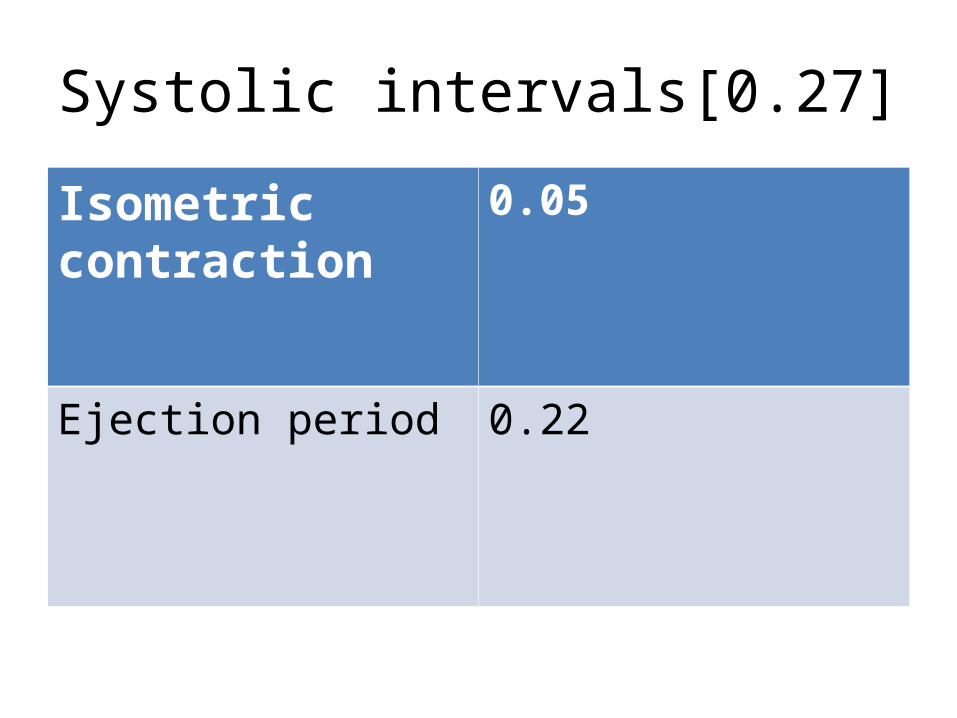
Systolic intervals[0.27]
Isometric contraction
0.05
Ejection period 0.22
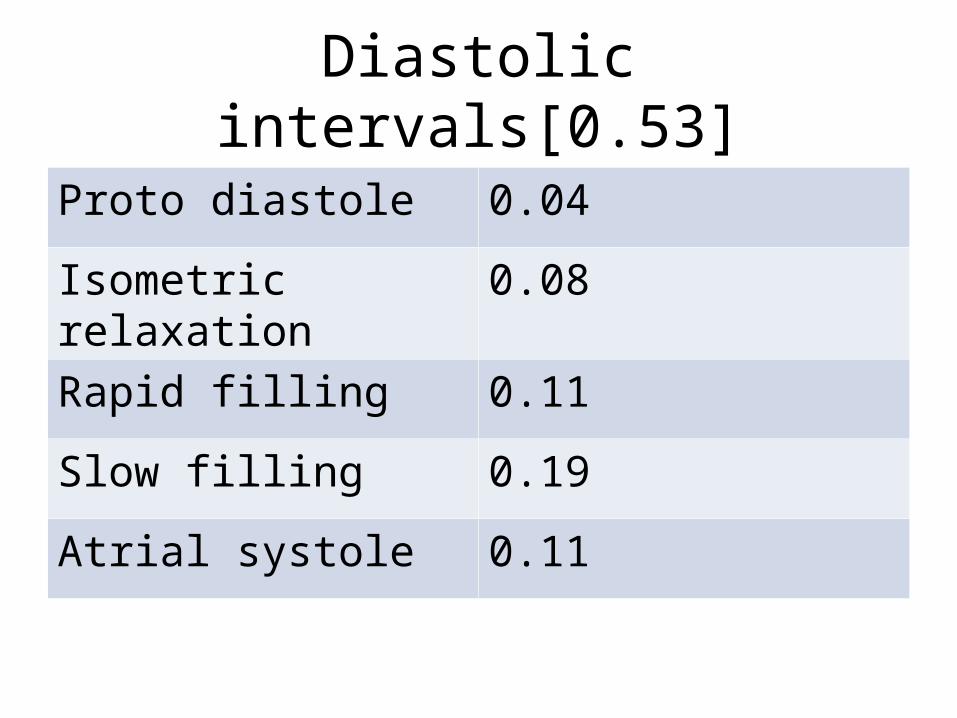
Diastolic intervals[0.53]
Proto diastole 0.04
Isometric relaxation 0.08
Rapid filling 0.11
Slow filling 0.19
Atrial systole 0.11
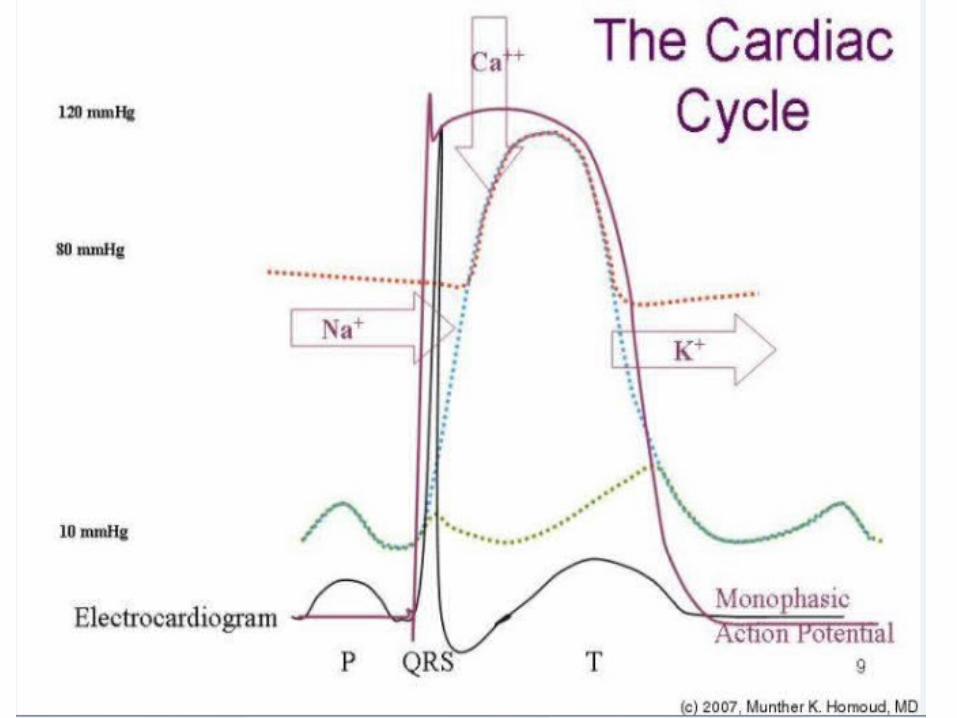

• LV pressure starts to build up when the arrival of calcium ions at the contractile proteins starts to trigger actin-myosin interaction.
• On the electrocardiogram (ECG), the advance of the wave of depolarization is indicated by the peak of the R wave .
• Soon after, LV pressure in the early contraction phase builds up and exceeds that in the left atrium . (normally, 10 to 15 mm Hg).
• followed about 20 milliseconds later by M1, the mitral component of the first heart sound.
L.v.contraction.

cardiac cycle• Mitral valve closure is often thought to coincide
with the crossover point at which the Lvpressure starts to exceed the left atrial pressure.
• In reality mitral valve closure is delayed because the valve is kept open by the inertia of the blood flow.
• Shortly thereafter, pressure changes in the right ventricle, similar in pattern but lesser in magnitude to those in the left ventricle, cause the tricuspid valve to close.there by creatingT1, the second component of the first heart sound.
• During this phase of contraction between mitralvalve and aortic valve opening, the LV volume is fixed (isovolumic contraction) because aortic and mitral valves are shut.
• As more and more myofibers enter the contracted state, pressure development in the left ventricle proceeds.
• The interaction of actin and myosin increases and cross-bridge cycling rises.
cardiac cycle
cardiac cycle• When the pressure in the left ventricle
exceeds that in the aorta, the aortic valve opens, usually a clinically silent event.
• Opening of the aortic valve is followed by the phase of rapid ejection.
• The rate of ejection is determined not only by the pressure gradient across the aortic valve, but also by the elastic properties of the aorta and the arterial tree, which undergoes systolic expansion.
• LV pressure rises to a peak and then starts to fall.
• In the 1960s, the duration of isovolumetric contraction (IVCT) and preejection period (PEP) were studied extensively as a measure of cardiac systolic function.
• LV ejection time (LVET) was used as a
measure of LV stroke volume.
• myocardial dysfunction prolongs PEP and shortens LVET.
• These intervals are also influenced by many hemodynamic and electrical variables.
• Weissler et al. derived an index (PEP/LVET) called "systolic time interval“.
• This is less heart rate dependent as a measure of LV systolic function.
IVCT and IVCTindex in mitral stenosis
• In severe pure or predomnnant mitral stenosis there is a prolongation in the first component
(C-Mi interval).
• a diminution in the second (Mi-E interval).
• the total IVCT remains practically unaltered.

In Aortic stenosis
• the Q-Mi interval was moderately prolonged (mean= 66-3 msec).• It seems possible that left ventricular
hypertrophy may be responsible for the delay of the intraventricular spread of the electric stimulus.
• Modification of the elastic properties of the myocardial fibres in left ventricular hypertrophy may lead to a delay in the transformation of the cardiac ovoid into a sphere.
• hence the preisometric phase of contraction (Q-Mi) will be prolonged (Warembourg and Dubar, I967).
LEFT VENTRICULAR RELAXATION.• As the cytosolic calcium ion concentration
starts to decline because of uptake of calcium into the SR under the influence of activated phospholamban, more and more myofibers enter the state of relaxation and the rate of ejection of blood from the left ventricle into the aorta falls. ( phase of reduced ejection)
• During this phase, blood flow from the left ventricle to the aorta rapidly diminishes but is maintained by aortic recoil—the Windkessel effect.
LEFT VENTRICULAR RELAXATION.• The pressure in the aorta exceeds the falling
pressure in the left ventricle. • The aortic valve closes, creating the first
component of the second sound, A2 (the second component, P2, results from closure of the pulmonary valve as the pulmonary artery pressure exceeds that in the right ventricle).
• Thereafter,the ventricle continues to relax. Because the mitral valve is closed during this phase, the LVvolume cannot change (isovolumic relaxation).
• isovolumic relaxation time (IVRT) is also affected by LV function.
• Mancini et incorporated IVRT into an index called the "isovolumic index" derived as (IVCT + IVRT)/LVET.
• The sum of IVCT and IVRT was measured by
subtracting the LVET from the peak of the R wave on the electrocardiogram to the onset of mitral valve opening.
• The isovolumic index was considered more sensitive for cardiac dysfunction than the systolic time interval because it contains IVRT as well as IVCT.
However, the interval from the R wave peak to the onset of mitral valve opening contains an interval of electromechanical delay, which can be pronounced in patients with left bundle branch block
• With the advent of Doppler echocardiography, it has become easier to determine cardiac time intervals more reliably. Tei et al.
proposed a "myocardial performance index" (or "Tei index") .
• Using Doppler echocardiography to identify the exact onset of isovolumic contraction.

• Another promising clinical area from measuring time intervals with TDI is to help identify patients who might benefit from
cardiac resynchronization therapy.• This is because TDI can assess the degree of LV
mechanical dyssynergy by precisely determining the time intervals between peak systolic contractions of different areas of the LV wall .
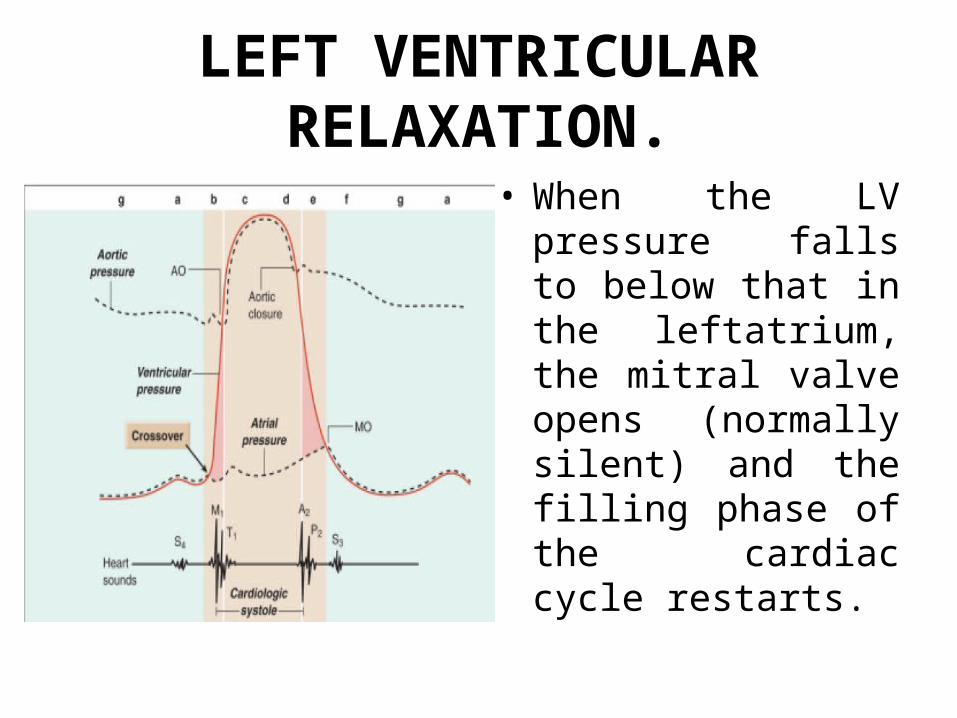
LEFT VENTRICULAR RELAXATION.
• When the LV pressure falls to below that in the leftatrium, the mitral valve opens (normally silent) and the filling phase of the cardiac cycle restarts.
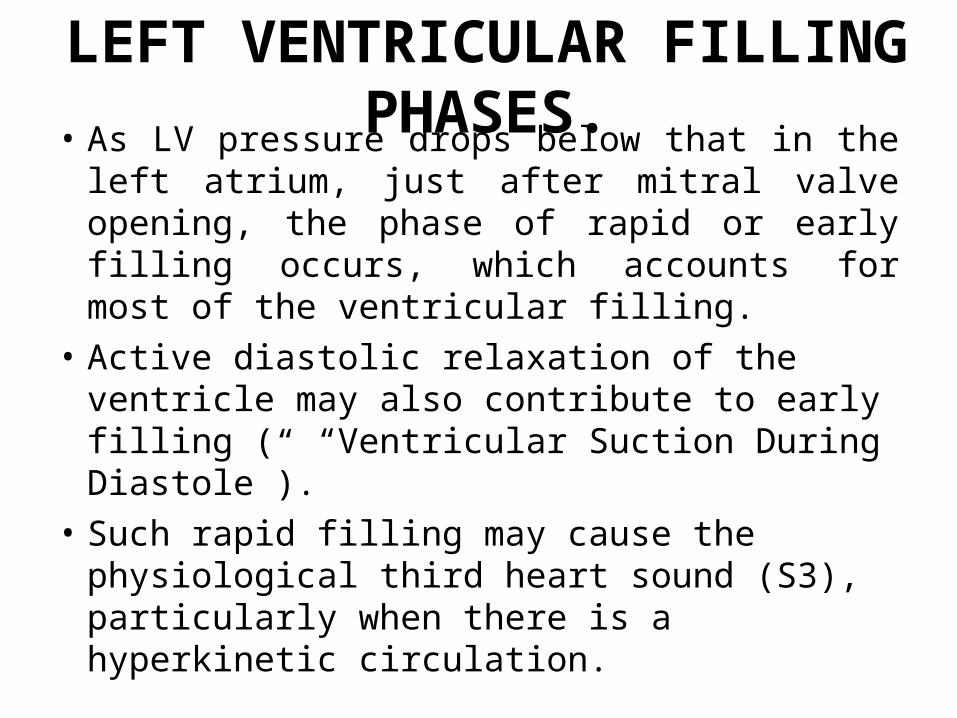
LEFT VENTRICULAR FILLING PHASES.• As LV pressure drops below that in the left
atrium, just after mitral valve opening, the phase of rapid or early filling occurs, which accounts for most of the ventricular filling.
• Active diastolic relaxation of the ventricle may also contribute to early filling ( “Ventricular Suction During Diastole”).
• Such rapid filling may cause the physiological third heart sound (S3), particularly when there is a hyperkinetic circulation.

L V FILLING PHASES.
• As pressures in the atrium and ventricle equalize, LV filling virtually stops (diastasis).
• This is achieved by atrial systole (or the left atrial booster), which is especially important when a high cardiac output is required, as during exercise, or when the LV fails to relax normally, as in left ventricular hypertrophy.
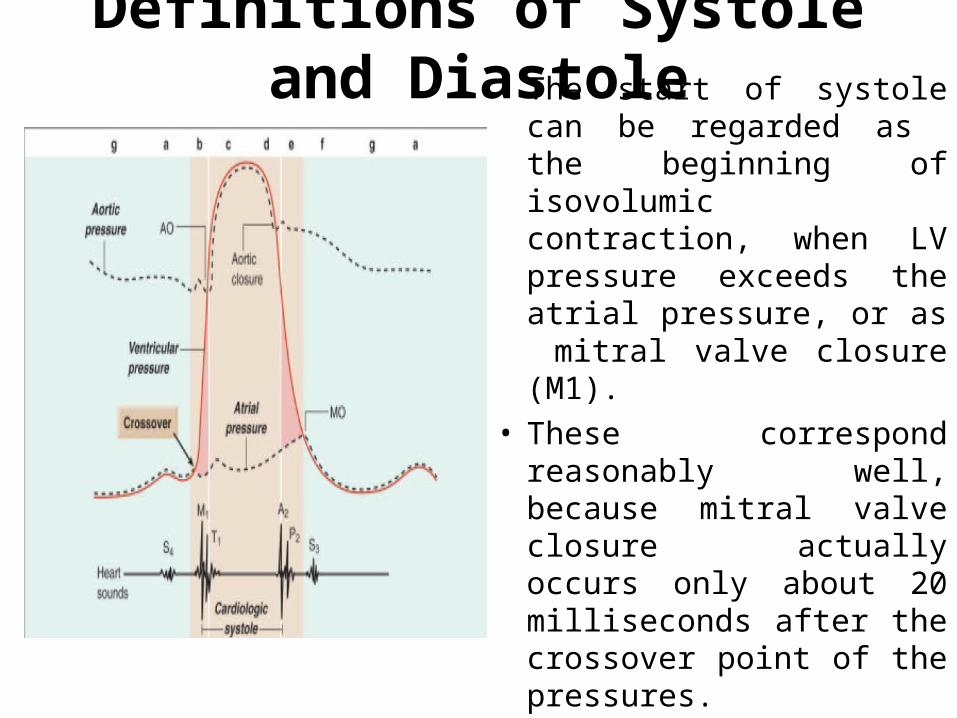
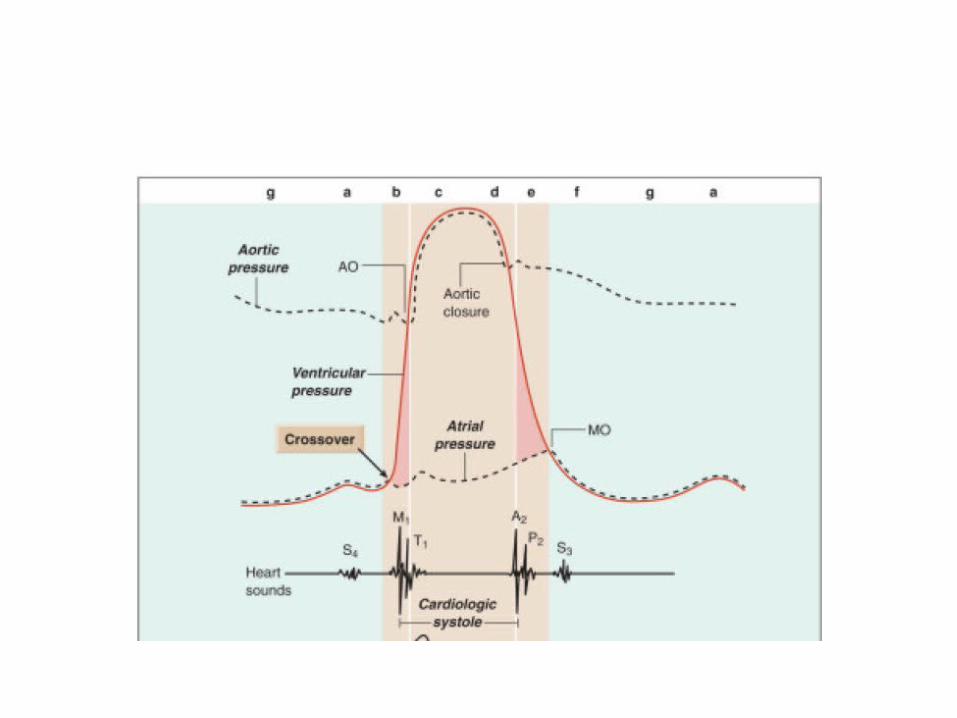
Definitions of Systole and Diastole• The start of systole can be
regarded as the beginning of isovolumic contraction, when LV pressure exceeds the atrial pressure, or as mitral valve closure (M1).
• These correspond reasonably well, because mitral valve closure actually occurs only about 20 milliseconds after the crossover point of the pressures.
Definitions of Systole and Diastole• Physiological systole lasts from the start of
isovolumic contraction (whenLV pressure crosses over atrial pressure ) to the peak of the ejection phase, so that physiological diastole commences as LV pressure starts to fall .
• Physiological diastole commences as calcium ions are taken up into the sarcoplasmic reticulum.
• In contrast, cardiological systole is demarcated by the interval between the first and second heart sounds, lasting from the first heart sound (M1) to the closure of the aortic valve(A2).
Definitions of Systole and Diastole• The remainder of the cardiac cycle automatically
becomes cardiological diastole. Thus,cardiological systole, demarcated by heart sounds rather than by physiological events.
• It starts fractionally later than physiological systole and ends significantly later.
• For the cardiologist,protodiastole is the early phase of rapid filling, when the third heart sound (S3) can be heard.
• This sound probably reflects ventricular wall vibrations during rapid filling.
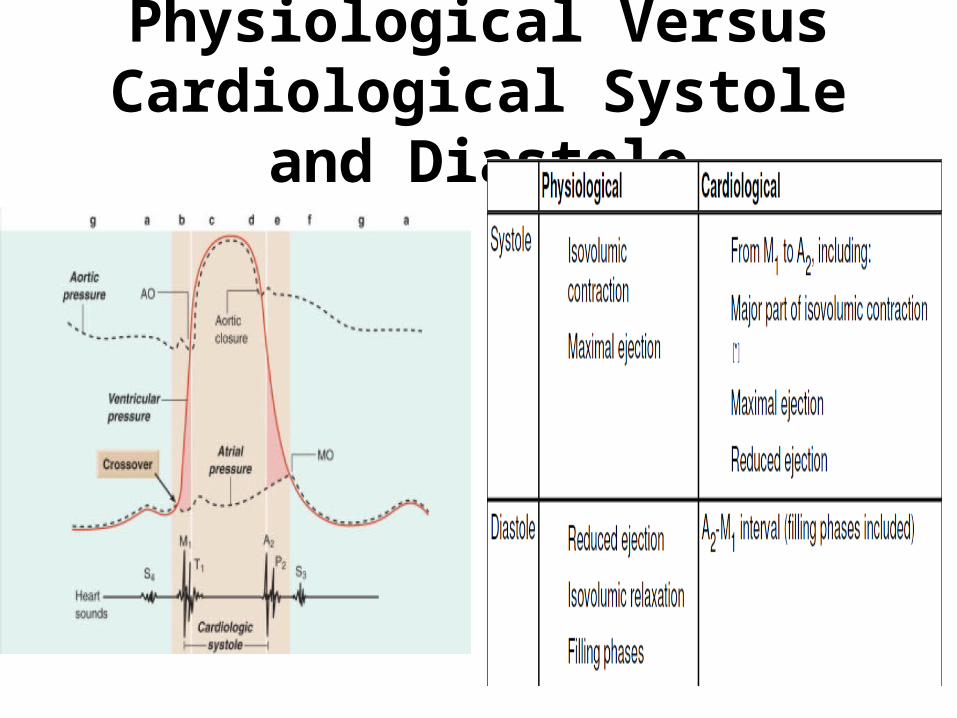
Physiological Versus Cardiological Systole and Diastole
Pressure volume loop in cardiac cycle
Left ventricular rotation: a neglected aspect of the cardiac cycle
• Rotation of the left ventricle around its longitudinal axis is an important but thus far neglected aspect of the cardiac cycle.
• LV rotation during systole maximizes intracavitary pressures, increases stroke volume, and minimizes myocardial oxygen demand.
• Shearing and restoring forces accumulated during systolic twisting are released during early diastole and result in diastolic LV untwisting or recoil promoting early LV filling.
• LV twist and untwist are disturbed in a number of cardiac diseases and can be influenced by several therapeutic interventions by altering preload, afterload, contractility, heart rate, and/or sympathetic tone,
L.V and R.v pressure waves
• Right and left ventricular waveforms are similar in morphology.
• They differ mainly with respect to their magnitudes.
• The durations of systole and isovolumic contraction and relaxation are longer and the ejection period shorter in the left than in the right ventricle.

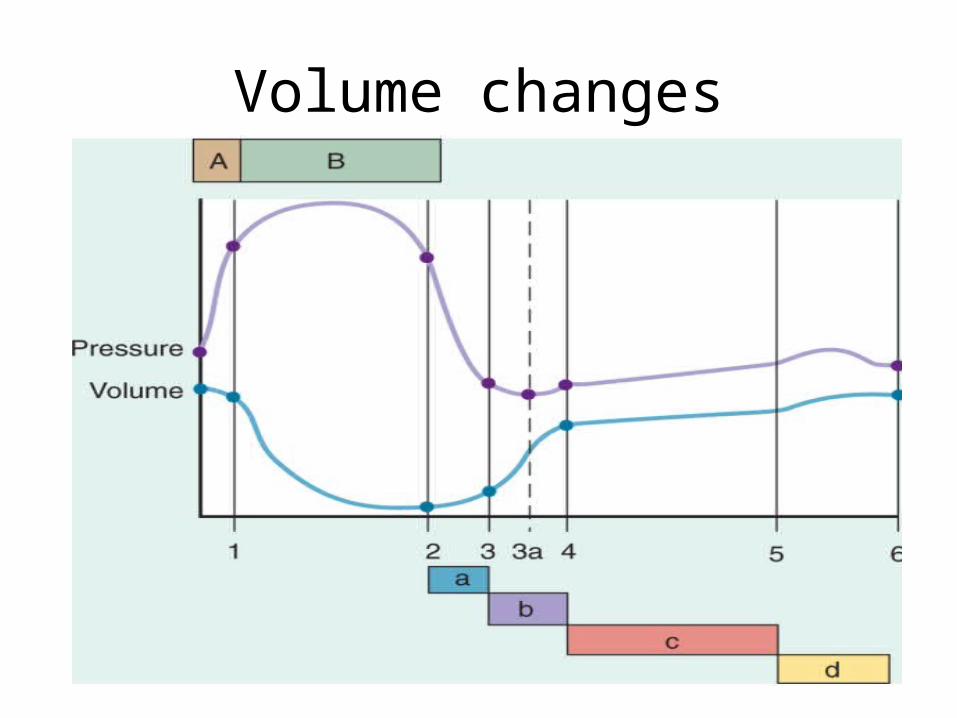
Volume changes
GREAT VESSEL PRESSURES.
• The contour of the central aortic and pulmonary artery pressure tracing consists of a systolic wave, the incisura (indicating closure of the semilunar valves), and a gradual decline in pressure until the following systole.
Heart sounds in relation to cardiac cycle
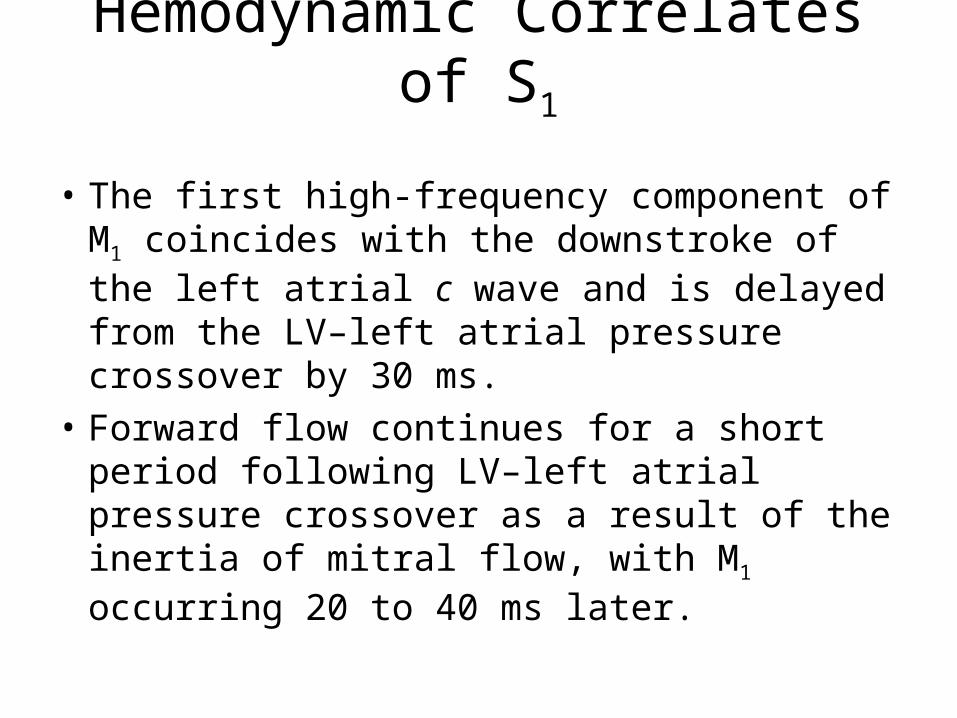
Hemodynamic Correlates of S1
• The first high-frequency component of M1 coincides with the downstroke of the left atrial c wave and is delayed from the LV–left atrial pressure crossover by 30 ms.
• Forward flow continues for a short period following LV–left atrial pressure crossover as a result of the inertia of mitral flow, with M1 occurring 20 to 40 ms later.
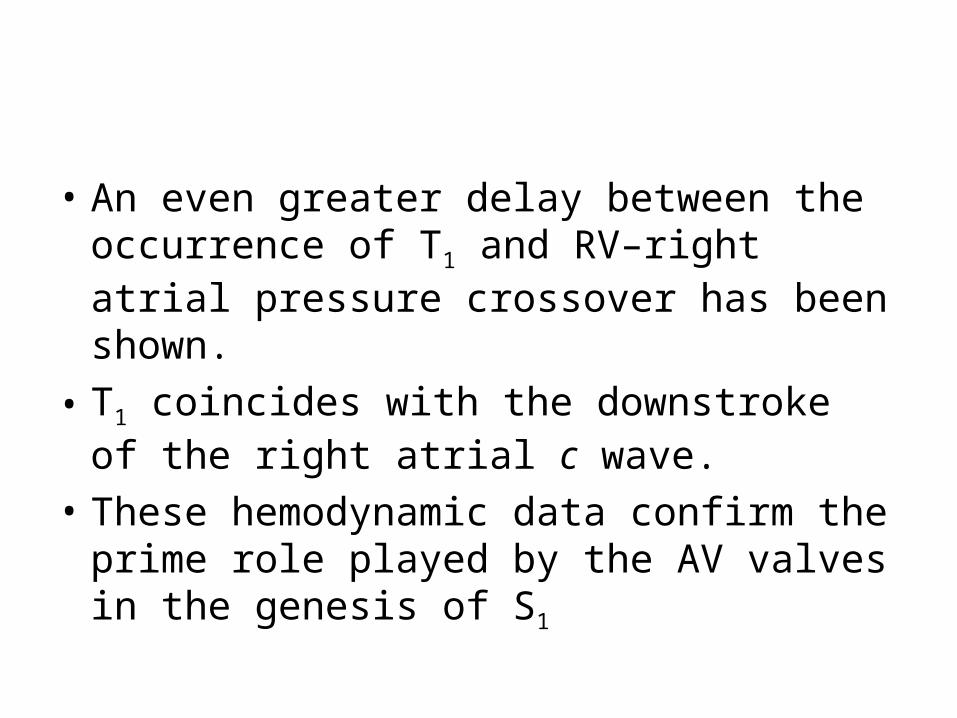
• An even greater delay between the occurrence of T1 and RV–right atrial pressure crossover has been shown.
• T1 coincides with the downstroke of the right atrial c wave.
• These hemodynamic data confirm the prime role played by the AV valves in the genesis of S1

Phono cardiogram
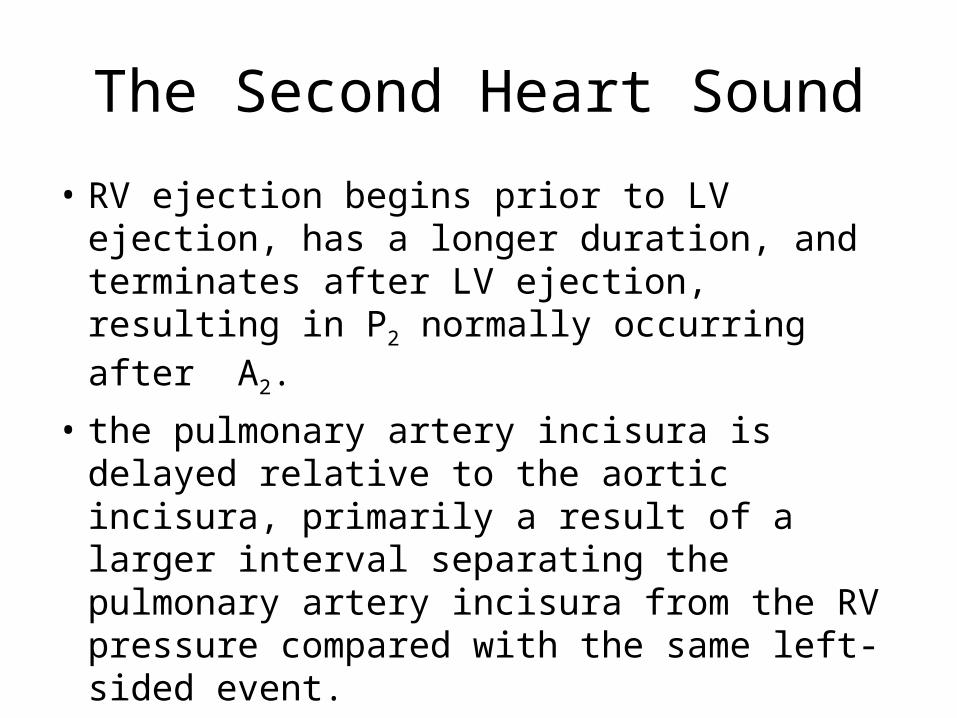
The Second Heart Sound
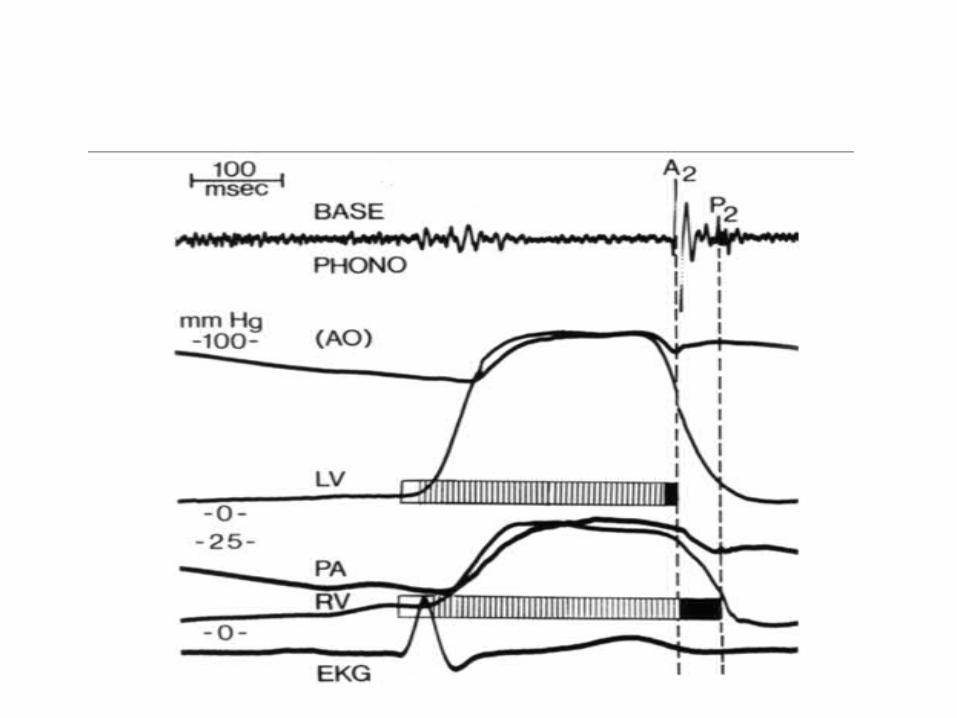
• RV ejection begins prior to LV ejection, has a longer duration, and terminates after LV ejection, resulting in P2 normally occurring after A2.
• the pulmonary artery incisura is delayed relative to the aortic incisura, primarily a result of a larger interval separating the pulmonary artery incisura from the RV pressure compared with the same left-sided event.
.
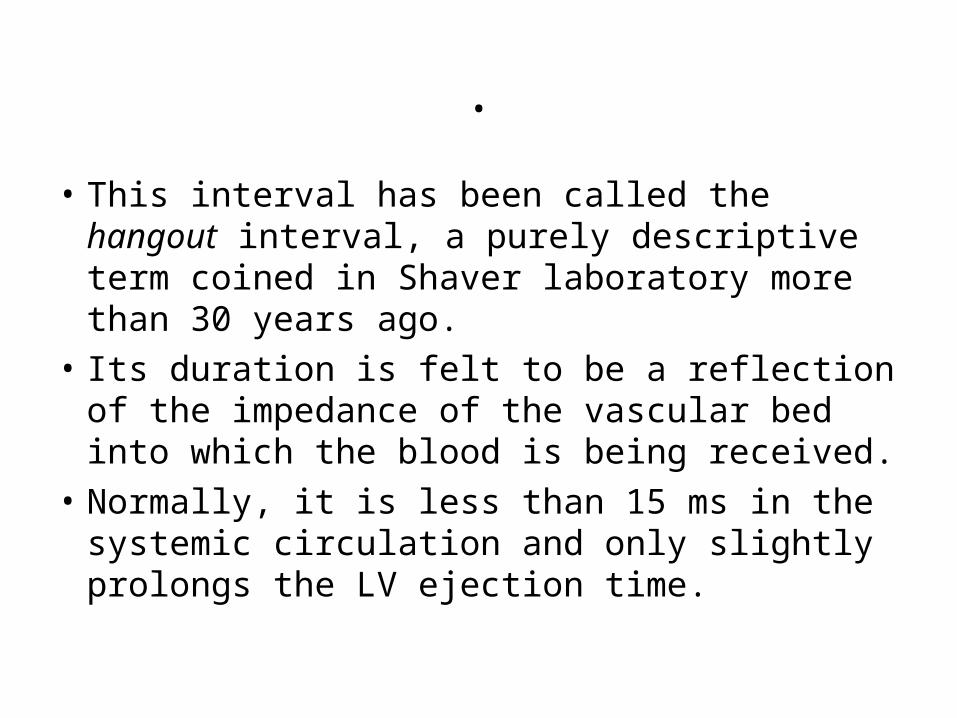
• This interval has been called the hangout interval, a purely descriptive term coined in Shaver laboratory more than 30 years ago.
• Its duration is felt to be a reflection of the impedance of the vascular bed into which the blood is being received.
• Normally, it is less than 15 ms in the systemic circulation and only slightly prolongs the LV ejection time.
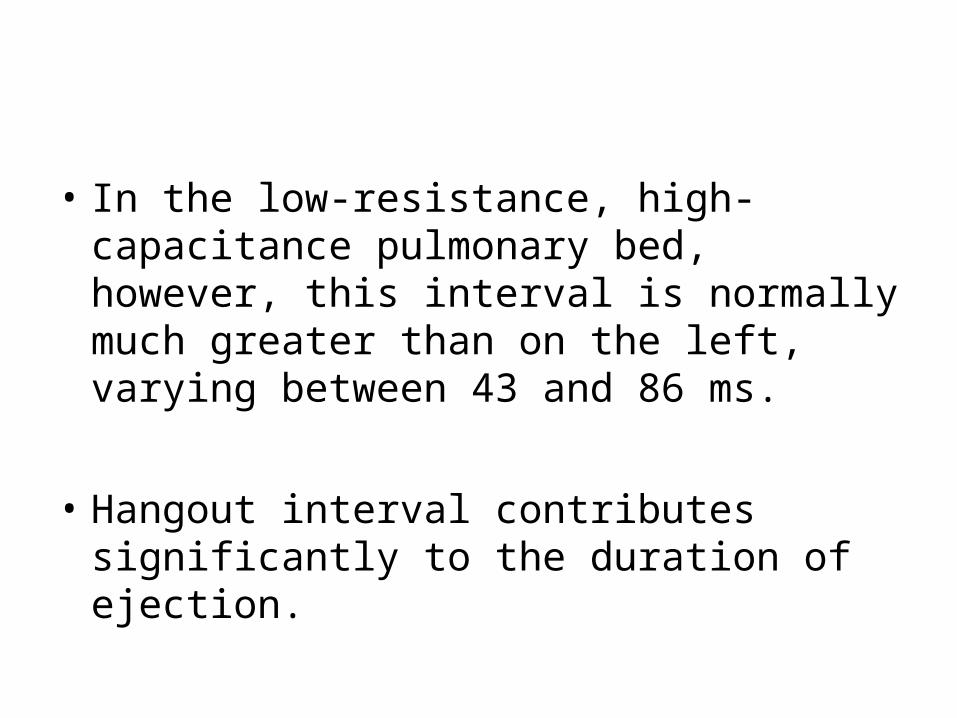
• In the low-resistance, high-capacitance pulmonary bed, however, this interval is normally much greater than on the left, varying between 43 and 86 ms.
• Hangout interval contributes significantly to the duration of ejection.
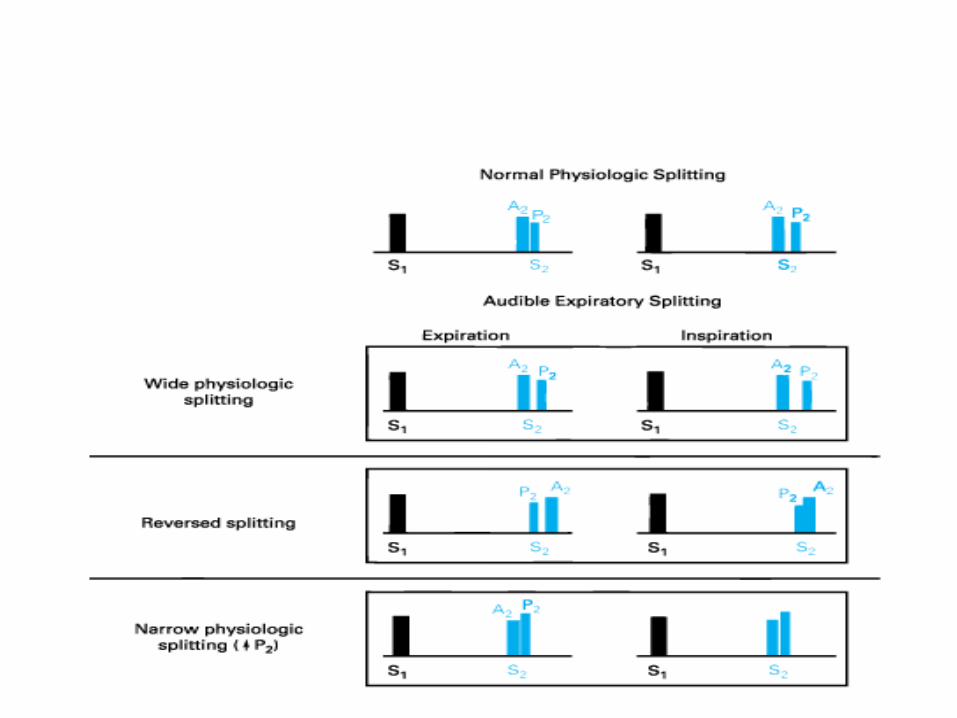
Normal Physiologic Splitting
• Normally during expiration, A2 and P2 are separated by an interval of less than 30 ms and are heard by the clinician as a single sound
• During inspiration, both components become distinctly audible as the splitting interval widens, primarily caused by a delayed P2, although an earlier A2 contributes to a lesser degree .
• The absolute value of inspiratory splitting varies with age and depth of respiration. In younger subjects, maximal splitting during inspiration averages 40 to 50 ms.
• with age, this value decreases such that a single S2 during both phases of respiration can be normal in subjects older than 40 years of age.

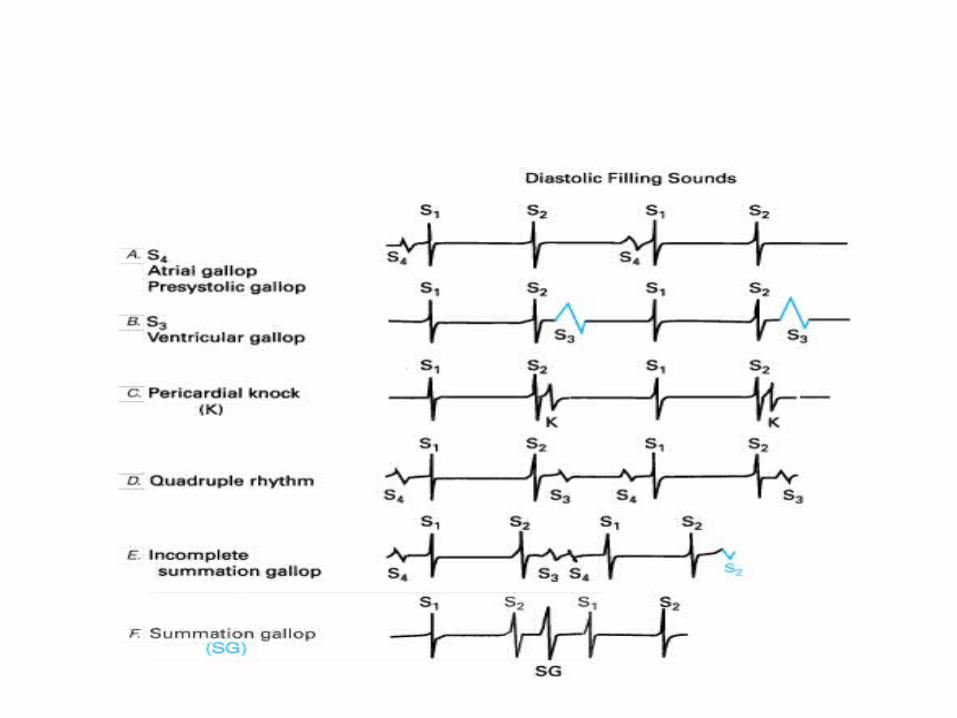
The Third and Fourth Heart Sounds
• S3 and S4 are low-frequency events related to early and late diastolic filling of the ventricles .
• When they are heard in disease states, they are called gallop sounds.
• Their presence gives valuable information to the clinician regarding the status of ventricular function and compliance.
• The physiologic S3 is a benign finding commonly heard in children, adolescents, and young adults.
• This is a low-frequency sound that follows A2 by 120 to 200 ms and occurs during rapid filling of the ventricle .
• There are two theories: an external and an internal production theory.
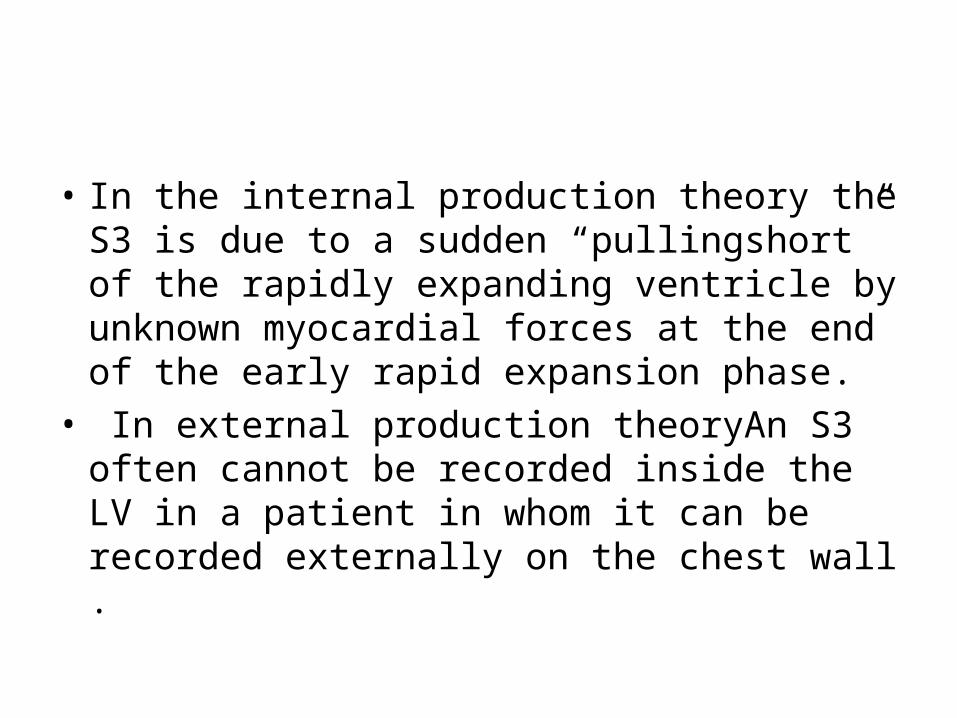
• In the internal production theory the S3 is due to a sudden “pullingshort” of the rapidly expanding ventricle by unknown myocardial forces at the end of the early rapid expansion phase.
• In external production theoryAn S3 often cannot be recorded inside the LV in a patient in whom it can be recorded externally on the chest wall .
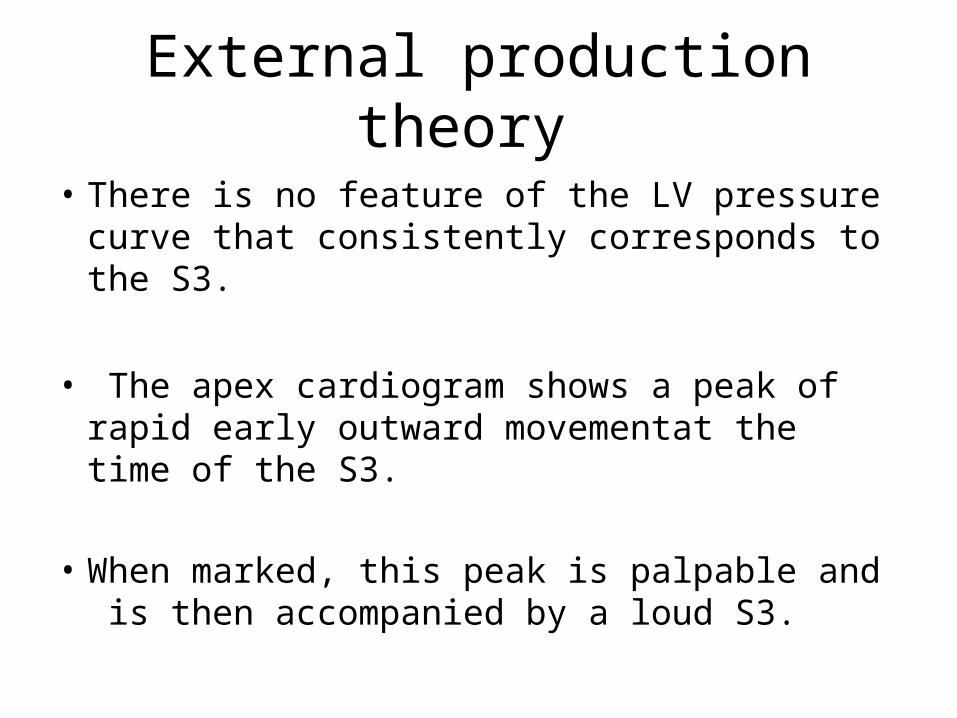
External production theory
• There is no feature of the LV pressure curve that consistently corresponds to the S3.
• The apex cardiogram shows a peak of rapid early outward movementat the time of the S3.
• When marked, this peak is palpable and is then accompanied by a loud S3.
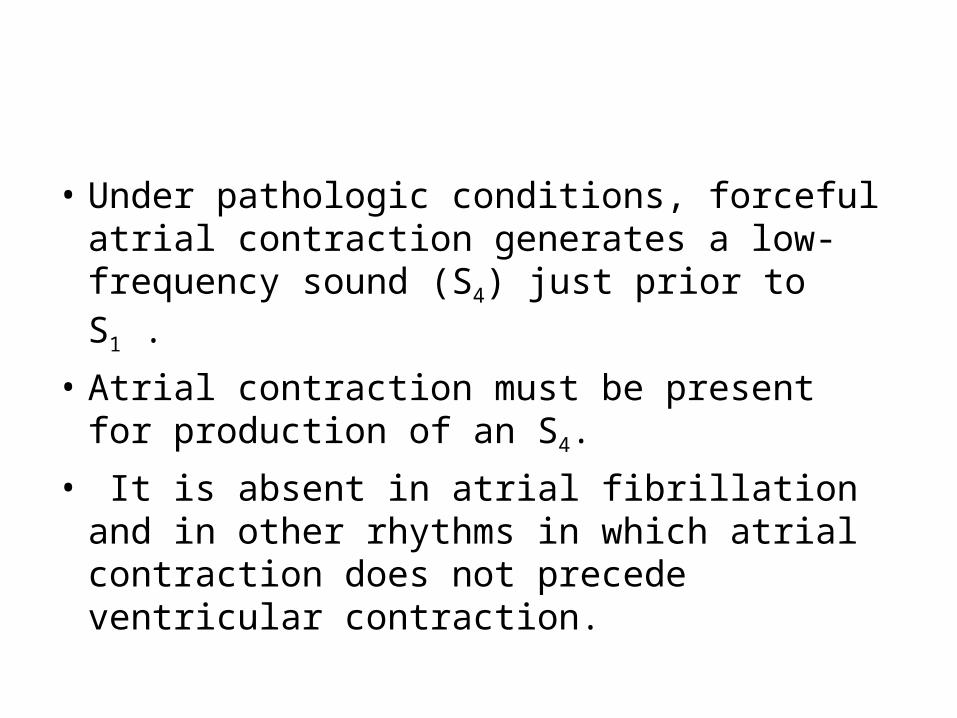
• Under pathologic conditions, forceful atrial contraction generates a low-frequency sound (S4) just prior to S1 .
• Atrial contraction must be present for production of an S4.
• It is absent in atrial fibrillation and in other rhythms in which atrial contraction does not precede ventricular contraction.
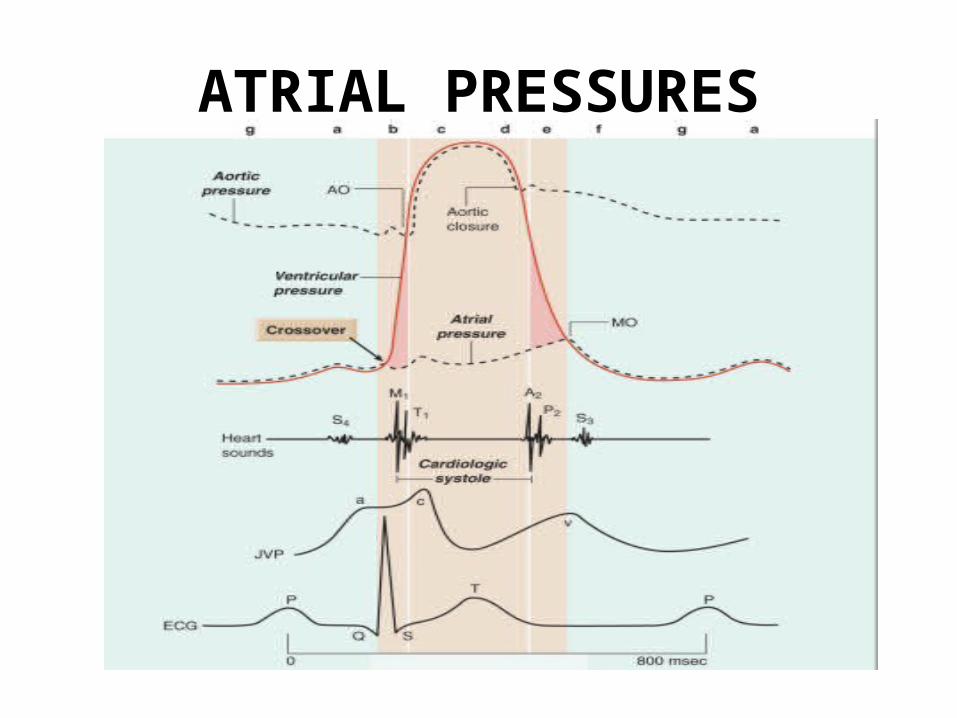
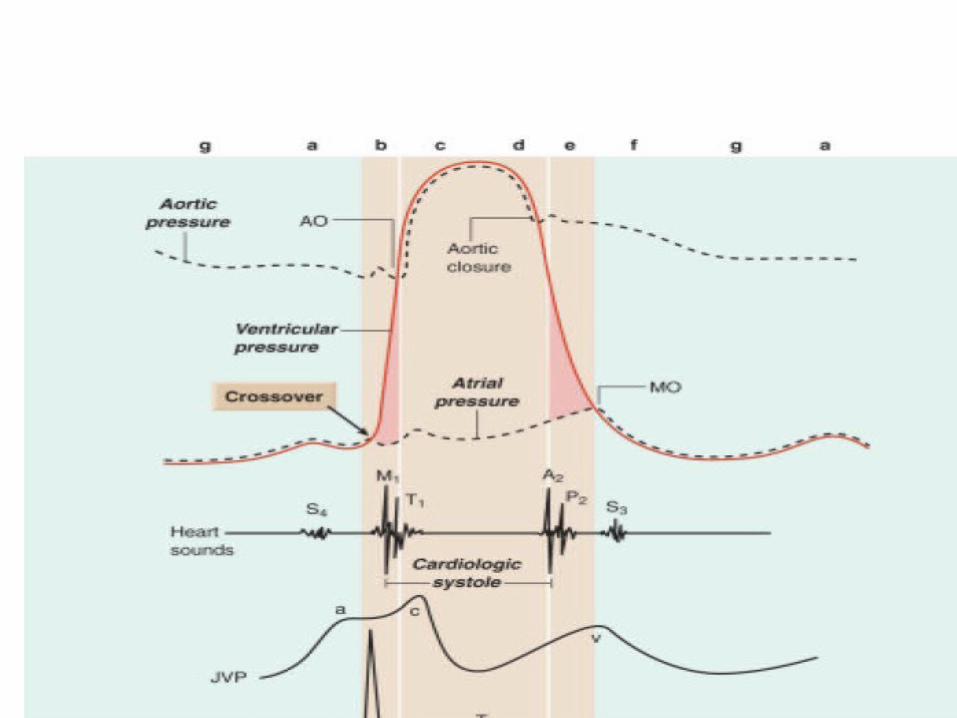
ATRIAL PRESSURES


Cardiac cycle


