cardiac scaffold for human mesenchymal stem cell facilitated autonomous ... · cardiac scaffold for...
TRANSCRIPT

1
Cardiac Scaffold for Human Mesenchymal
Stem Cell Facilitated Autonomous Pacing
A Major Qualifying Project submitted to the faculty of Worcester Polytechnic
Institute in partial fulfillment of the requirements for the Degree of Bachelor of
Science
Submitted by:
Helena Alfonzo ___________________
Syed Ali ___________________
Brian Almeida ___________________
Katie Flynn ___________________
Submitted to:
Professor Glenn Gaudette ___________________
April 30th
, 2009

2
Abstract
HCN gene modified Human Mesenchymal Stem Cells (hMSCs) have shown the ability to
restore pacemaker function in canine and murine models. However, stem cell migration from the
delivery site is a major concern. To address this problem, the team designed a device to prevent
migration but still allow communication between the stem cells and native cardiomyocytes.
Scaffold pore size, fiber diameter and biomaterial selection were necessary to determine. The
team conducted a pore size migration assay, cell deflection calculations, gap junction formation
assay and cell viability assays. The results from the tests led to the design of a two part
polyurethane scaffold that prevents migration of stem cells, allows gap junction formation
through pores and is packaged for minimally invasive delivery.

3
Table of Contents
Abstract ........................................................................................................................................... 2
Table of Figures .............................................................................................................................. 5
Table of Tables ............................................................................................................................... 6
Chapter 1: Introduction ................................................................................................................... 7
Significance................................................................................................................................. 7
Chapter 2: Literature Review .......................................................................................................... 9
The Heart .................................................................................................................................... 9
Structure .................................................................................................................................. 9
Mechanical Function ............................................................................................................. 12
Electrical Function ................................................................................................................ 14
Arrhythmia ............................................................................................................................ 19
Artificial Pacemakers ................................................................................................................ 20
Parts to a pacemaker ............................................................................................................. 21
Types of artificial pacemakers .............................................................................................. 22
Human Mesenchymal Stem Cell (hMSC) Driven Biological Pacemaker ................................ 23
Cell Delivery ............................................................................................................................. 25
Scaffolding ............................................................................................................................ 25
Chapter 3: Project Strategy ........................................................................................................... 30
Client Statement ........................................................................................................................ 30
Prioritization of Functions and Safety Measures ...................................................................... 33
Chapter 4: Design Criteria ............................................................................................................ 37
Porosity ..................................................................................................................................... 37
Strength ..................................................................................................................................... 37
Preliminary Designs .................................................................................................................. 39
Cross-linked Scaffold............................................................................................................ 39
Scaffold with Pores ............................................................................................................... 40
Material Analysis ...................................................................................................................... 41
Material Processing ................................................................................................................... 43
Chapter 5: Design Verification ..................................................................................................... 44
Culturing Mesenchymal Stem Cells ......................................................................................... 44
Experimental Design ................................................................................................................. 45
Preparing for Cell Assays ..................................................................................................... 46

4
Pore Size Migration Assay.................................................................................................... 47
Quantifying hMSC Migration ............................................................................................... 48
Scaffold Gap Junction Formation Assay .............................................................................. 50
Gap Junction and Live/Dead Immunohistochemistry ........................................................... 51
Chapter 6: Experimental Results and Discussion ......................................................................... 54
Pore Size Migration Assay – Trial 1 ..................................................................................... 54
Pore Size Migration Assay – Trial 2 ..................................................................................... 55
Cell Viability Assay .............................................................................................................. 58
Gap Junction Assay Results .................................................................................................. 58
Migration through Polyurethane ........................................................................................... 59
Mechanical Calculations ........................................................................................................... 61
Deflection of a hMSC ........................................................................................................... 61
Cell Quantity Threshold ............................................................................................................ 65
Economic, Environmental, and Ethical Impacts ....................................................................... 65
Chapter 7: Final Design ................................................................................................................ 67
Chapter 8: Conclusions & Future Recommendations ................................................................... 70
Appendix ....................................................................................................................................... 71
Appendix A: Completed Pairwise Chart................................................................................... 71
Appendix B: Conceptual Designs ............................................................................................. 72
Appendix C: Candidate Material Analysis ............................................................................... 73
Nitinol ................................................................................................................................... 73
Dacron ................................................................................................................................... 74
EPTFE ................................................................................................................................... 74
Polyurethane ......................................................................................................................... 75
Appendix D: hMSC Deflection Derivations ............................................................................. 78
Appendix E: hMSC Deflection MatLab Syntax ....................................................................... 80
Appendix F: Tables of all Deflection Calculations................................................................... 86
Bibliography ................................................................................................................................. 88
Note: all group members contributed equally on the writing of this paper.

5
Table of Figures Figure 1: Layers of the Heart Wall (Mayo Foundation) ................................................................. 9 Figure 2: Chambers and Valves of the Heart (Mayo Foundation)................................................ 10
Figure 3: Comparison of changes in LV pressure, wall thickness, and meridional stress
throughout the cardiac cycle ......................................................................................................... 13 Figure 4: Myocyte Action Potential (Klabunde, 2007) ................................................................ 14 Figure 5: Pacemaker Electric Potential (Klabunde, 2007) ............................................................ 16 Figure 6: Pathway of Electrical Propagation (Oregon Health & Science University, 2008) ....... 18
Figure 7: Normal vs. Abnormal ECG Tracings ............................................................................ 20 Figure 8: Parts of a Pacemaker (Heartonline, 2007) ..................................................................... 21 Figure 9: Top Panel - Action Potential Current is Initiated Purely by Adjacent Myocytes; Bottom
Panel - Adjacent Myocytes Initiating the Stem Cell’s Action Potential ....................................... 24
Figure 10: Scanning Electron Micrograph of a Scaffold (Leor et al., 2000) ................................ 26 Figure 11: Non-woven mesh of PGA fibers (METU) .................................................................. 27 Figure 12: Polyurethane Fibers Produced by Electrospinning ..................................................... 29
Figure 13: Microporous structure of polyurethane ....................................................................... 29 Figure 14: Function Means Tree ................................................................................................... 32
Figure 15: Human MSCs attached to a material surface (Plopper, 2008) .................................... 38 Figure 16: Cross-linked Scaffold ................................................................................................. 40 Figure 17: Scaffold with Pores ..................................................................................................... 40
Figure 18: Custom built wells which house the polyurethane scaffold and allow for the seeding
of cells on both the upper and lower side ..................................................................................... 47
Figure 19: Preliminary Design of Stem Cell Scaffold .................................................................. 47 Figure 20: Two layers of hMSCs across a microporous polyurethane membrane ....................... 50
Figure 21: Gaudette-Pins Dual Transwell Design ........................................................................ 51 Figure 22: Positive (left) and Negative (right) Tissue Control Slides 40x ................................... 52
Figure 23: Positive Cell Samples at 40x (left) and 20x (right) ..................................................... 52 Figure 24: Sample Staining of Dead (left) and Live (right) cells ................................................. 53 Figure 25: Bottom of 8 µm insert (left) and bottom of well (right) .............................................. 54
Figure 26: .4 micron wells prior to scraping (left) and post scraping (right) ................................ 57 Figure 27: 3 micron wells prior to scraping (left) and post scraping (right) ................................. 57 Figure 28: Live/Dead Results ....................................................................................................... 58
Figure 29: 3D Gap Junction Formation through Polyurethane ..................................................... 59 Figure 30: Human Mesenchymal Stem Cells on one side of the polyurethane sheet after 3 days of
incubation (left); Reverse side of the same polyurethane sheet, where no cells were able to
migrate to (right) ........................................................................................................................... 60
Figure 31: Free Body Diagram of a hMSC ................................................................................... 61 Figure 32: Moment of Inertia of a hMSC ..................................................................................... 62 Figure 33: MatLab Syntax ........................................................................................................... 63
Figure 34: Deflection vs. Pore Size and Young's Modulus ......................................................... 64 Figure 35: Final Design Representation ....................................................................................... 67 Figure 36: BioGlue® syringe (CryoLife, 2008) ........................................................................... 69

6
Table of Tables Table 1: Pairwise Comparison Charts........................................................................................... 35 Table 2: Averages and Percentages .............................................................................................. 36
Table 3: Summary of Candidate Material Properties ................................................................... 41 Table 4: Qualitative Material Description .................................................................................... 42 Table 5: Material Summary .......................................................................................................... 42 Table 6: Calculation Results ......................................................................................................... 64

7
Chapter 1: Introduction
Significance
Electronic pacemakers are readily available devices that are used to solve a variety of
heart problems, extending from simple heart rate and rhythm problems to complete heart failure
(Rosen et al. 2004). Even though these devices are proven to be effective, they still have a
variety of limitations. Among these limitations include the pacemaker’s battery life, sensitivity to
magnetic fields, and lead failure. These drawbacks require that a patient undergo repeated
operations to replace the battery; they also inhibit the patient’s ability to undergo other tests such
as MRIs and CT Scans. Furthermore, there are also complications related to the implantation of
the pacemaker. For instance, if the pacemaker leads are improperly placed, it can cause the
wrong parts of the heart to contract, resulting in inefficient pumping and in severe cases, death
(Rosen et al. 2004). Perhaps the greatest disadvantage associated with the electrical pacemaker is
that it lacks the ability to provide an appropriate cardiac response when the patient is exercising
or is experiencing a strong emotional reaction (Rosen et al. 2004).
Biological pacemakers are being developed as an alternative to these electrical
pacemakers with the hope of mimicking the natural pacemaker and overcoming some of the
electronic pacemaker’s limitations. By utilizing stem cells as a biological pacemaker, they will
be capable of providing an appropriate cardiac response to exercise and emotions since the cells
can react to the physiological changes in the body (Rosen et al. 2004). Also, these biological
pacemakers do not contain batteries or leads; therefore the device is not sensitive to magnetic
fields. This would provide the patient with a better alternative to cure their heart condition.
Although stem cells have good qualities that allow them to be ideal for engineering
biological pacemakers, there are some risks associated with them. One of the biggest risks is

8
stem cell migration. If these undifferentiated cells were to migrate to other areas of the heart,
they could cause problems like fibrillation, beating of non-cardiac muscle tissue, or cancer
(Rosen et al. 2004). To address this problem, the team researched a method of containing the
stem cells to prevent migration while still allowing communication between the stem cells and
the surrounding cardiomyocytes.

9
Chapter 2: Literature Review
The heart is one of the most vital organs in the human body. There are a variety of
cardiac diseases and conditions that result in over 700,000 deaths per year (29% of total), making
cardiac disease the leading cause of death in the United States (CDC Website, 2008).
The Heart
Structure
The heart is located just posterior of the ribcage, anatomically left of the sternum. The
heart wall has three layers (see Figure 1). The outermost layer is the epicardium, which serves as
a protective layer for the heart. Beneath the epicardium is the myocardium, where the bulk of the
heart’s mass is located; it is responsible for the majority of the contractile force when the heart
beats. Lastly, the endocardium is composed of endothelial muscle cells, which are held together
by connective tissue fibers called bundles (Marieb & Hoehn, 2007).
Figure 1: Layers of the Heart Wall (Mayo Foundation)

10
The heart is divided into four chambers and connected to several major blood vessels (see
Figure 3). As deoxygenated blood enters the heart, it follows a specific path through these
chambers and vessels prior to re-circulating through the body. The process begins when the vena
cava empties deoxygenated blood into the right atrium. The blood then goes through the
tricuspid valve into the right ventricle, where the heart contracts and pumps blood through the
pulmonary valve into the pulmonary artery. This blood is then oxygenated at the lungs and
brought back to the left atrium of the heart via the pulmonary veins. After a contraction, the
mitral valve opens and blood empties into the left ventricle. The heart contracts again and the left
ventricle pumps the newly oxygenated blood through the aortic valve into the aorta, where it
circulates to the rest of the body.
The responsibility of the valves that separate the different chambers of the heart is to
prevent back flow. When the heart contracts, the aortic and pulmonary valves open, while the
mitral and tricuspid valves close (see Figure 2). When the heart relaxes, the opposite occurs. The
cardiac cycle has two parts, which correspond to ventricular contraction and relaxation: the peak
systolic pressure occurs during the heart’s contraction, while diastolic pressure occurs during
relaxation. Normal human blood pressure is 120 systolic pressure over 80 diastolic pressure
(Fox, 2008).
Figure 2: Chambers and Valves of the Heart (Mayo Foundation)
11
The heart is composed of muscle fibers which are similar to those of skeletal and smooth
muscle, yet they are fundamentally different in a couple ways. Much like skeletal muscle,
cardiac muscle is striated and contracts by sliding filaments. The difference, however, exists in
their structure: cardiac muscle fibers are shorter, branched, and connected to each other.
On the cellular level, each cardiac muscle cell’s plasma membrane is connected to other
cells by an intercalated disk. Within this disk there are desmosomes, which act to hold the
muscle cell together as contraction occurs (Marieb & Hoehn, 2007). In order to ensure efficient
communication between adjacent cardiomyocites, gap junctions connect the cells. These gap
junctions serve as passageways for the flow of ions, which is how an electrical current gets
propagated throughout the entire heart. Gap junctions are essential in the proper pacing of the
heart. While various skeletal fibers have individual innervations, heart cells act together as a
single unit to efficiently pump blood.

12
Mechanical Function
The human heart beats approximately 72 times per minute (76 to 80 for adult females; 72
for males; and 50-65 for elderly), with an average of 100,000 times per day. An average adult
has about five liters circulating through their body at any moment, which equals approximately
2,000 gallons of blood being pumped by the heart every day. To put this into perspective, a
seventy year old human’s heart has beaten more than 2.5 billion times and has pumped more
than 1 million barrels of blood (Bronzino, 2006). However, this is dependent upon a person’s
blood pressure, which is the force exerted by circulating blood on the walls of blood vessels. An
average range of normal blood pressure is 110 to 150mmHg over 60 to 80mmHg; the higher
number (peak systolic pressure) is representative of the heart as it beats and the lower number
(end diastolic pressure) describes the heart as it relaxes.
An increase or decrease in blood pressure could significantly alter a person’s heart
condition. In a study performed by William Grossman et al., the left ventricular (LV) wall
stresses were measured throughout the cardiac cycle during cardiac catheterization of thirty
patients; six patients had LV pressure overload, eighteen had LV volume overload, and six
patients were used as a control group since they had no evidence of heart disease. The results of
this study are shown in Figure 3.

13
Figure 3: Comparison of changes in LV pressure, wall thickness, and meridional stress throughout the cardiac cycle
(Grossman et al., 1975)
The normal peak systolic and end diastolic pressure were 117±7/10±1mmHg; patients
with LV pressure overload had a great increase in pressure with readings of 220±6/23±3mmHg.
Although not as significant as patients with LV pressure overload, patients with LV volume
overload also showed an increase in pressure: 139±7/24±2mmHg. The meridional wall stress did
not change dramatically between patients with no cardiac abnormalities and patients with
pressure overload (151±14/17±2*103
dyn/cm2 compared to 161±24/23±3*10
3 dyn/cm
2,
respectively). This was due to the fact that the pressure overload was counterbalanced by an
increase in the wall thickness (1.5±0.1cm for pressure overload compared to 0.8±0.1cm for
normal heart conditions). For patients with volume overload, the peak systolic meridional wall
stress (175±7dym/cm2) was slightly higher than normal heart, but was not too significant. There
was a considerable increase in its end diastole wall stress, 41±3*103 dyn/cm
2 (Grossman,
William et al., 1975).
14
Electrical Function
The heart functions with the conduction of an electrical signal through the tissue to
generate a contraction. A majority of the heart’s cells work just like any other muscle or nerve
cell, they remain at a constant resting potential until stimulated by an outside source. These cells,
which make up roughly 99% of the heart, carry out the mechanical functions the heart
(Sherwood, 2004).
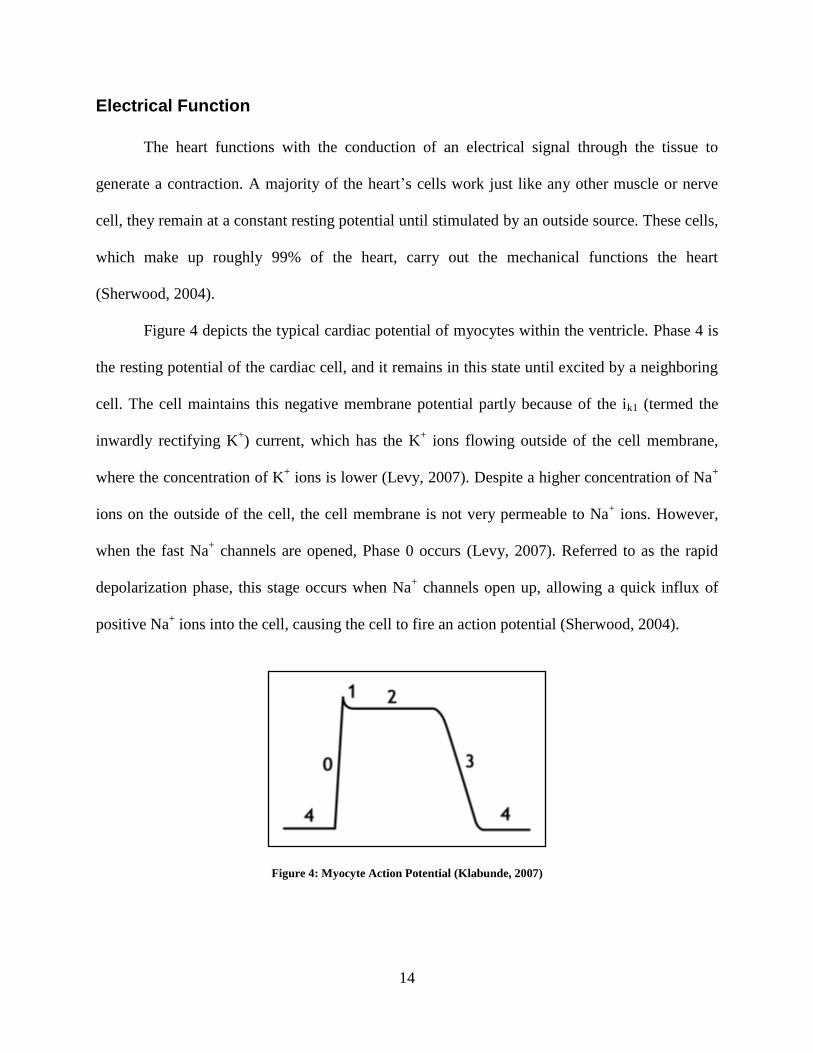
Figure 4 depicts the typical cardiac potential of myocytes within the ventricle. Phase 4 is
the resting potential of the cardiac cell, and it remains in this state until excited by a neighboring
cell. The cell maintains this negative membrane potential partly because of the ik1 (termed the
inwardly rectifying K+) current, which has the K
+ ions flowing outside of the cell membrane,
where the concentration of K+ ions is lower (Levy, 2007). Despite a higher concentration of Na
+
ions on the outside of the cell, the cell membrane is not very permeable to Na+ ions. However,
when the fast Na+ channels are opened, Phase 0 occurs (Levy, 2007). Referred to as the rapid
depolarization phase, this stage occurs when Na+ channels open up, allowing a quick influx of
positive Na+ ions into the cell, causing the cell to fire an action potential (Sherwood, 2004).
Figure 4: Myocyte Action Potential (Klabunde, 2007)

15
Phase 1 occurs when these Na+ channels are all closed, and K
+ ions begin to flow outside
of the cell, partially re-polarizing it (Levy, 2007). This small deflection is counteracted in Phase
2 when there is steady influx of Ca+2
ions, and the outflow of K+ ions continues (Levy, 2007).
Finally, the sharp decline of Phase 3 occurs when the Ca+2
channels close while the K+ channels
are still open (Levy, 2007). This outward current causes the cell to repolarize. The K+ channels
only close once the cell has reached its resting potential of around -80mV (Levy, 2007).
The other 1% of heart cells are unique in that they can generate and conduct their own
action potentials (Sherwood, 2004). These cells, termed autorhythmic cells, are what drive the
natural beating of the heart. Affected by the sympathetic and parasympathetic nervous system,
these cells generate action potentials based on the how quickly blood needs to be pumped
through the rest of the body (Sherwood, 2004). These autorhythmic cells also have extended
refractory periods to prevent summated action potentials, which allow ample time for the
chambers to empty and fill (Levy, 2007).
Autorhythmic cells do not have a resting potential like other cells; these cells slowly
depolarize after an action potential has occurred and do not fire again until the threshold
potential is reached (Sherwood, 2004). This behavior of repeated firing without an outside
stimulus generates the natural pacemaker activity of the heart.

16
Figure 5: Pacemaker Electric Potential (Klabunde, 2007)
This autorhythmic pacemaker activity is generated by a similar controlled flow of several
important ions (see Figure 5). First, the autorhythmic cells reduce the amount of K+ ions that
flow out, while constantly allowing Na+ in (Sherwood, 2004). These paired actions slowly
depolarize the cell, bringing it closer to its firing threshold (in Figure 5, this is shown by if). Once
these actions have begun and the cell is close to reaching the threshold, voltage gated Ca+2
channels open; this allows an influx of ions, which raises the cell potential to the threshold
(Sherwood, 2004). These Ca+2
channels (T-Type and L-Type) are voltage gated and only begin
working once the if has significantly raised the potential (Levy, 2007). Once the cell has reached
its threshold, the rising phase of the action potential begins (Phase 0), followed by a quick efflux
of K+ ions (Sherwood, 2004). This quick efflux of K
+ ions, which is the same inwardly rectifying
K+ current mentioned above, is shown in the above figure as ik. This marks the cell returning to
its resting potential (Phase 3).
This electrical activity happens in very specific parts of heart, which help create efficient
pumping of the heart. In healthy hearts, this pacemaker activity commences at the SA node. The
SA node, which is located in the right atrial wall near where the superior vena cava is connected

17
to the heart, is the primary pacemaker for heart function (Sherwood, 2004). The SA node is
composed of two different kinds of cells: small, round cells and slender, elongated cells which
initiate the current (Levy, 2007). The SA node fires an action potential roughly 70 to 80 times
per minute (Sherwood, 2004). This action potential is first relayed via the four interatrial
pathways at speeds of over 1 m/s to all of the contractile cells in both the right and left atrium
(Levy, 2007). That signal is then propagated through the internodal pathway until it reaches the
AV node, where it is delayed for roughly 100ms; this small delay allows for the blood in the atria
to empty into the ventricles (Sherwood, 2004).
The AV node, often referred to as a latent pacemaker or a secondary pacemaker, is
located at the base of the right atrium, alongside the dividing septum (Sherwood, 2004). The AV
node is dubbed the secondary pacemaker because it only generates action potentials at a rate of
40 to 60 times per minute (Sherwood, 2004). Because it is connected via gap junctions to the SA
node, which fires more quickly, the AV node must relay action potentials at the same rate to
ensure efficient pumping and filling. The AV node has three different areas: AN, N, and NH
zones (Levy, 2007). The AN and N regions are similar in that they both serve to help delay the
propagation of the electrical signal; this helps to ensure that the atria can completely empty prior
to the ventricles contracting (Levy, 2007). The NH region is the transitional area between the AV
into the Bundle of His; here the action potentials transfer back from slow response (which causes
the delay in the AN/N portions) to fast response (Levy, 2007).
From the AV node, the electrical signal is conducted down through the Bundle of His,
which starts at the AV node and travels through the septum. In the septum, the Bundle of His
breaks off into a left and right branch which travels around the base of the ventricles and up back
towards the atria (see Figure 6). From here, the electrical signal is passed through the Purkinje

18
Fibers which wrap around the ventricles, thus completing the relay of the electrical signal
(Sherwood, 2004). Much like the AV node, the Bundle of His and the Purkinje Fibers fire at a
much slower rate than the SA node (around 20-40 action potentials per minute) (Sherwood,
2004). However, since the SA node is firing at a more rapid rate, both the Bundle of His and
Purkinje Fibers assume the same rate as the SA node to help generate a smooth contraction.
During contraction, the first part of the ventricles to contract is the myocytes near the
intraventricular septum (Levy, 2007). After these cells have contracted, the signal has caused the
endocardial and epicardial cells to contract (Levy, 2007). This contractile flow helps to ensure
that all the blood is efficiently pushed out of the ventricles into the arteries.
Figure 6: Pathway of Electrical Propagation (Oregon Health & Science University, 2008)
One major health issue with hearts is that the SA node can malfunction, or the connection
between the SA node and AV node can become blocked. This leads to an interruption of the
normal pacemaker activity. Instead of the heart beating at the rate of the SA node (about 70 times
per minute), the heart is now firing at the rate of the AV node. Even though the heart is

19
functioning off the AV node, a slower beat results in the person feeling tired and unable to
perform physical activity, along with other limitations in their natural activity.
Another potential problem with the electrical activity of the heart is when a certain group
of cells becomes hyperactive. This group of cells, called an ectopic focus, fire action potentials
more rapidly than the SA node (Sherwood, 2004). This can lead to irregular and premature beats
of the heart, which can result in inefficient pumping of blood.
Arrhythmia
One specific form of cardiac disease is arrhythmia. Arrhythmia is clinically diagnosed
when there is a loss of contractile function of the heart, which can be caused by an
atrioventricular (AV) block in the Bundle of His. This results in electrical impulses traveling too
fast (bradycardia), too slow (tachycardia), or erratically (fibrillation) causing the blood pressure
to become altered. If the blood pressure becomes too low, the arterial blood flow does not
provide for the adequate perfusion to regions of the myocardium (Katz, 1977). Figure 7
represents ECG tracings for a single cardiac cycle from a normal heart (shown on the left) and an
abnormal heart (shown on the right). In a normal heart, the T wave is clearly distinct from the
other waves in the ECG; also, the repolarization of the QRS wave does not go below that of the
depolarization. However, in the ECG of an abnormal heart, there is no distinct T wave; instead
there is a prolonged QT interval (the time between initial depolarization and final repolarization
of the ventricles) and the repolarization of the ventricles goes below that of the depolarization.

20
Figure 7: Normal vs. Abnormal ECG Tracings
(Sanguinette and Tristani-Firouzi, 2006)
If cardiac diseases, such as arrhythmia, are not treated, they can become life-threatening
and result in cardiac arrest and sudden death. A current treatment for arrhythmia is the
implantation of an artificial electrical pacemaker. These pacemakers can restore the ventricular
rate when the AV block is not too severe in order to prevent death in case the AV conduction
was to suddenly fail.
Artificial Pacemakers
Pacemakers can either be permanent or temporary. Temporary pacemakers are mainly
used for severe cases of heart failure, such as a symptomatic bradycardia or tachycardia, or post
cardiac surgery. These are used temporarily until further action, such as a surgical procedure to
implant a permanent pacemaker, is taken. When the permanent pacemaker is used, it is
implanted in a patient’s chest. The artificial pacemaker contains one or two electrodes that come
into contact with the heart’s muscle fibers; the stimulating electrode is known as the cathode, and
the other electrode, the anode, is placed in some distant area of the body. Pacemakers with a
single electrode only stimulate the upper chambers of the heart; pacemakers with two electrodes
stimulate both the upper and lower chambers of the heart. The latter pacemaker is able to be
more precise in mimicking the heart rhythm (Elhendy, et al., 2008).

21
There are a couple of methods previously used in which the connecting wires could be
brought to the heart. One method used a needle that was inserted through the chest wall into the
heart, and then the electrodes were threaded through the needle. Another method used was
stitching the wires into the heart muscle. The most recent method is to have the electrodes pass
through the veins via a catheter and into the chambers of the heart so that there is contact with
the inner surface of the right ventricle (Elhendy, et al., 2008).
Parts to a pacemaker
There are three distinct parts to a pacemaker: a generator, leads, and electrodes (see
Figure 8).
Figure 8: Parts of a Pacemaker (Heartonline, 2007)
The generator, which is responsible for generating the electric impulses that correct the
irregular heartbeat, is a small box that is on average 2 inches wide and weighs approximately 3
ounces; however, they can be slightly larger or smaller. This part of the pacemaker is battery-
powered, and most use lithium batteries that last for 5 to 10 years. After the battery runs out, the
entire generator has to be replaced. Extruding from the generator are the leads that are typically
composed of platinum and have an insulating coating of silicone or polyurethane. The leads’
22
function is to carry the electrical impulses from the generator to the electrodes, which are located
at the tip of each lead. The purpose of the electrodes is to deliver the necessary electrical
impulses to the heart.
Types of artificial pacemakers
A major concern for using artificial pacemakers is that the heart’s normal impulse is
disturbed and offset by the artificial pacemaker, especially during the apex of the T wave. If this
ensues, ventricular fibrillation will most likely occur. As a consequence, the “synchronous
pacemaker” is most often used. This type of pacemaker is able to sense the atrial excitation
wave, have an appropriate delay (approximately equal to a normal PR interval), and then
stimulate the ventricles.
The “standby pacemaker” is also often used because it can turn itself off when the heart
does not need it. This pacemaker can sense the ventricular R wave when it occurs faster than the
built-in, fixed rate of the pacemaker or when the R wave signals the pacemaker to fire without
delay. In the former case, the pacemaker will block the next electrical stimulus; in the latter case,
the electrical stimulus follows the refractory period of the R wave.
The most recent artificial pacemakers are externally programmable, which allows the
cardiologist to be able to select specific pacing modes for individual patients. Some of these
pacemakers have multiple electrodes that stimulate different areas of the heart to maintain the
heart’s normal pulse. Another recent pacemaker used is the biventricular pacemaker: a triple-lead
pacemaker that simultaneously stimulates both ventricles of the heart in addition to pacing the
right atrium. Most of these recent pacemakers incorporate a built-in device that shocks the heart
back into a normal rhythm if it were to stop or if there was a serious rhythm abnormality. If a
pacemaker uses this feature, it was called an implantable cardioverter defibrillator.

23
Human Mesenchymal Stem Cell (hMSC) Driven Biological Pacemaker
In order to overcome the mentioned limitations of artificial pacemakers, the possibility of
using biological pacemakers is being explored. Within these biological pacemakers are
mesenchymal stem cells, which are multipotent stem cells that have the ability to differentiate
into multiple cell lines like muscle, bone, cartilage, and tendon cells. Although these cells are
available in different parts of the body, the most common place where these cells are obtained
from is bone marrow (Rosen et al., 2004). This cell’s ability to differentiate into multiple cell
lines makes it attractive for different kinds of cell therapies. Another advantage of mesenchymal
stem cells is that they can be extracted from the patient’s own bone marrow, so therapies
involving hMSCs will be autologous, reducing the risk of an immune response (Rosen et al.,
2004).
Researchers are studying adult mesenchymal stem cells as a possibility for providing an
off the shelf cell therapy because of the body’s low immune reaction to the stem cells. This is
referred to as allogeneic stem cell transplantation. Due to the cells’ ability to transfer dye and to
transmit current to other cells (not only within the same cell line, but also to other cell lines like
cardiomyocytes), scientists are also researching the possibility of using adult mesenchymal stem
cells as a vessel to deliver genes as well as small molecules (Rosen et al., 2004).
After acknowledging these potential uses for adult mesenchymal stem cells, Rosen and
his colleagues decided to explore the cells’ gene therapy possibilities and take it one step further.
Their idea was to create a biological pacemaker by using adult mesenchymal stem cells that had
been modified with the appropriate genes.
In a normal pacemaker cell, the cell’s own depolarization initiates an action potential in
the cell. This action potential is then transmitted to other cells via gap junctions, passing down

24
the current. For adult mesenchymal stem cells to mimic this natural depolarization, the cells
would have to be modified in order to express an HCN isoform (Rosen et al., 2004). The HCN
(Hyperpolarization-activated cyclic nucleotide gated) channels open in response to
depolarization after an action potential. The opening of these channels allows an influx of
sodium ions which is the cause of the spontaneous repolarization seen in Figure 5. The sodium
ions then flow to the adjacent myocytes through gap junctions as seen in Figure 9. This occurs
until threshold for the myocyte action potential is reached. The action potential is propagated to
other myocytes through the gap junction chain. This mechanism allows for the synchronization
of the depolarization current to the diastolic current, creating an on/off switch for the current to
fire (Rosen et al., 2004). In this case, both the stem cell and the adjacent cardiomyocyte would
work as a pacemaker. The advantage of this method is that this approach does not need the stem
cell to differentiate into a pacemaker cell in order to perform its function.
Figure 9: Top Panel - Action Potential Current is Initiated Purely by Adjacent Myocytes; Bottom Panel - Adjacent
Myocytes Initiating the Stem Cell’s Action Potential
Although adult mesenchymal stem cells offer a great advantage to the field of medicine
by providing the possibility of biological pacemakers, there are still some great concerns that
need to be addressed before this process becomes viable. Concerns include duration of function

25
of the biological pacemaker in comparison to the electronic pacemaker, immunological response
from the body leading to cell rejection, neoplasia, cancer, migration of the cells from the
implanted site to other areas of the heart or the rest of the body, and stem cell differentiation into
other types of cells (Rosen et al., 2004).
Cell Delivery
Discussions with Professor Glenn Gaudette (Worcester Polytechnic Institute) in 2008
yielded certain possibilities for delivering the modified hMSCs to the heart. One method
discussed was an intravenous vector. This vector had limited transfection efficiency and little to
no targeted delivery (Gaudette, 2008). Another method discussed was direct injection into the
heart wall. While direct, this method’s limitations include blowback of delivery serum and little
control over cell migration (Gaudette, 2008).
Scaffolding
If dissociated cells were to be injected into the body it would be nearly impossible to control
the shape, size, and location of the implanted cells (Shimizu et al., 2002). In order to help control
these factors, scientists use different types of scaffolds. These scaffolds work as a support frame
for cells to attach to and grow (see Figure 10). In order to keep the cells alive, the scaffold must
permit the diffusion of cell nutrients and other molecules important for proper cell function. In
the case of an implant, the scaffolds can be used to not only deliver cells, but biochemical factors
as well. Another advantage of scaffolds is their ability to manipulate cell behavior by applying a
series of mechanical and biological stresses. The biggest challenge posed by the use of scaffolds
is the lack of cell migration into the 3-D structure. This is a problem because in healthy

26
myocardial tissue, cells are considerably dense when compared to other tissue including cartilage
and vascular tissue (Shimizu et al., 2002).
Figure 10: Scanning Electron Micrograph of a Scaffold (Leor et al., 2000)
Different materials can be used to create these scaffolds depending on the mechanical
conditions having to be withstood. The main materials used for scaffolds containing cardiac cells
can be synthetic or biological. Among the synthetics it is possible to find woven nylon (PET –
also known as Dacron), polytetrafluoroethyline (ePTFE), poly(glycolic acid) (PGA), gelatin and
alginate (Shimizu et al., 2002). On the other hand, biological materials like gluteraldehyde-cross-
linked biological membranes, bovine tissue, and collagen scaffolds are also used (Robinson et
al., 2005).
There are several different ways of synthesizing tissue engineering scaffolds. One process
is nanofiber self-assembly. The main advantage of this method is that the biomaterials created
with this method develop properties similar to those of natural extracellular matrix (ECM). This
similarity allows the scaffold to be more biocompatible than other scaffolds, including those
derived from animal tissue. (Ma et al, 2005)
Another way that these scaffolds can be synthesized is by using textile technologies. This
process is used when non-woven meshes of different polymers are desired (see Figure 11). These
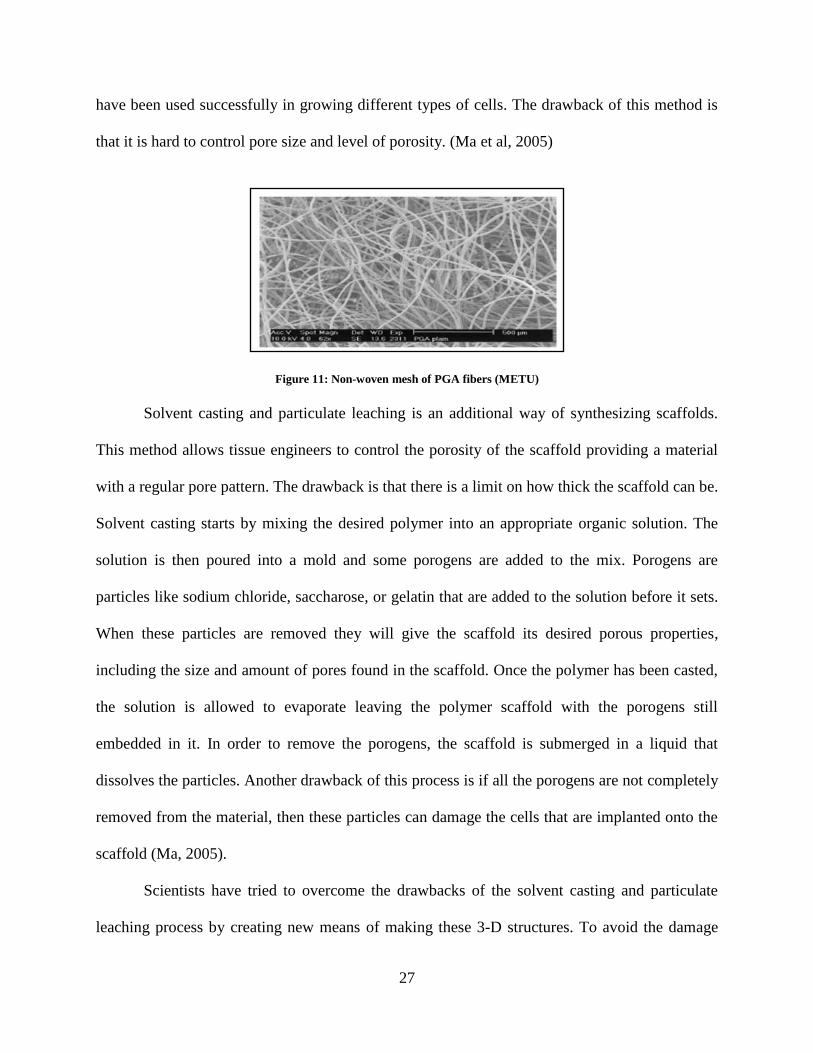
27
have been used successfully in growing different types of cells. The drawback of this method is
that it is hard to control pore size and level of porosity. (Ma et al, 2005)
Figure 11: Non-woven mesh of PGA fibers (METU)
Solvent casting and particulate leaching is an additional way of synthesizing scaffolds.
This method allows tissue engineers to control the porosity of the scaffold providing a material
with a regular pore pattern. The drawback is that there is a limit on how thick the scaffold can be.
Solvent casting starts by mixing the desired polymer into an appropriate organic solution. The
solution is then poured into a mold and some porogens are added to the mix. Porogens are
particles like sodium chloride, saccharose, or gelatin that are added to the solution before it sets.
When these particles are removed they will give the scaffold its desired porous properties,
including the size and amount of pores found in the scaffold. Once the polymer has been casted,
the solution is allowed to evaporate leaving the polymer scaffold with the porogens still
embedded in it. In order to remove the porogens, the scaffold is submerged in a liquid that
dissolves the particles. Another drawback of this process is if all the porogens are not completely
removed from the material, then these particles can damage the cells that are implanted onto the
scaffold (Ma, 2005).
Scientists have tried to overcome the drawbacks of the solvent casting and particulate
leaching process by creating new means of making these 3-D structures. To avoid the damage

28
caused by the porogens that were not properly dissolved, they have moved from solid porogens
to gas porogens. This process called gas foaming starts by creating a disc shaped mold out of the
preferred polymer by means of compression molding with heat. In order to make the material
porous, the disc is placed into a chamber where CO2 at high pressures is pumped in. The discs
remain inside for a couple of days and then the chamber is slowly decompressed back to
atmospheric pressure. During their time in the chamber, the discs are allowed to absorb the CO2
which create the desired porous 3-D matrix. Once all the CO2 is removed, the structure maintains
its shape. Although this process solves the problem caused by not fully dissolved porogens, it
still has some disadvantages. The main drawback of this process is that the heat used during the
compression molding part of the scaffold formation limits the materials that can be utilized (Ma,
2005).
Another method of creating scaffolds is electrospinning, which uses high voltages in
combination with distace from the material source to the base in order to produce a cross-linked
mesh. It can produce polymer fibers of nanometer to micrometer size in diameter; Figure 12
shows 1.0μm polyurethane fibers that were produced via electrospinning. In a study performed
by Angelo Pedicini et al., the authors electrospun the polyurethane solution from a 1mL glass
pipette with a capillary tip of approximately 1 mm inner diameter. A stainless steel electrode was
placed in the polymer solution. These were then spun onto a grounded aluminum foil sheet
(Angelo Pedicini et al., 2003).

29
Figure 12: Polyurethane Fibers Produced by Electrospinning
(Angelo Pedicini et al., 2003)
A possible method for producing a biomaterial with pores is one that was done by Ze
Zhang et al. in their study. The authors prepared a 7% (w/v) polyurethane solution by dissolving
polyurethane pellets in 1,4-dioxane. They used phase inversion and freeze-drying to prepare the
polyurethane tubes in an external cooling fashion. A glass capillary was inserted into a glass tube
to form a casting mold, and then the polyurethane solution was poured into the space between
the two glass tubes. Various cooling treatments were used for the polyurethane solution to
become a solid; pore size is dependent upon the cooling rate. To remove the solvent, the mold
was freeze-dried. Once the polyurethane was removed, it was sterilized in 70% alcohol (Zhang
et.al., 2003). Figure 13 shows the microporous structure of polyurethane by using this
methodology.
Figure 13: Microporous structure of polyurethane
(Zhang et al., 2003)

30
Chapter 3: Project Strategy
Client Statement
The goal of this project is to design a scaffold that will hold stem cells which are to be used
as a biological pacemaker for implantation into the heart. The scaffold, which will be implanted
within the ventricular septum via a minimally invasive approach, will immobilize the cells and
prevent them from spreading to other areas of the heart or body. The scaffold will contain pores
large enough to allow the stem cells to form gap junctions with neighboring myocytes, but small
enough that they keep the stem cells within the container. This design will not impede the
formation of these gap junctions, which are necessary to propagate an electrical current through
the heart. The scaffold should be permanent and durable enough to withstand the normal
contractile forces that are associated with heart function. The scaffold will be placed adjacent to
living cardiomyocytes, and therefore, should not impede the normal physiological functions of
these cells.
Functions
Immobilize cells – scaffold inhibits cells from migrating away from
designated target location (i.e. physical barrier, chemical treatment, etc.)
Allow/facilitate formation of gap junctions, which are essential for the
propagation of an electrical signal
Ability to be implanted into the ventricular septum
Interacts with the heart’s normal function – scaffold can withstand
contractile forces of the heart
Support malfunctioning or damaged areas of the heart by allowing cells to
pace the heart
Scaffold does not interfere with normal physiological functions
Scaffold should be permanent
Scaffold should be placed within close proximity of living myocytes
Scaffold does not impede electrical activity of the cells

31
Specifications
Cells cannot pass through the mesh (pore size will be less than 3
micrometers)
Cells must contact myocytes to allow gap junction formation
Gap junctions should be able to form within 48 hours
Constraints
Safety - scaffold should not degrade or break free
Scaffold should be biologically inert and biocompatible
Scar tissue formation should not impede gap junction formation
Size – should not drastically impede the normal mechanical function of
the heart, necessary length to seed 700k cells
Scaffold should be implanted by means of minimally invasive surgery
Time – the project needs to be completed by April 30, 2009
Cost – the total cost of the project should not exceed $624
After the functions of the device were identified, a functions means tree, shown in
Figure 14, was constructed. The functions means tree allowed the team to visualize the
scaffold’s functions and the possible approaches to attaining those functions.

32
Figure 14: Function Means Tree

33
Prioritization of Functions and Safety Measures
Pairwise comparison charts were used during the engineering design process in order to
identify which features of the design are most important (see Table 1). The two functions that the
pairwise comparison charts analyzed were safety and first degree functions (degradability,
biocompatibility, etc.) These two charts helped to prioritize what functions the group should be
more concerned with when designing the cardiac scaffold.
The first degree functions are defined as:
Degradability: the ability of the material to break down in a controlled manner and
be absorbed by the body
Biocompatibility: the material causes little to no immune response (this includes
minimizing the formation of scar tissue around the scaffold)
Immobilization: keeping the cells inside the scaffold rather than have them migrate
around the heart or other areas of the body
Allow gap junction formation: gap junctions form in order to communicate with
cardiomyocytes allowing it to pace the heart
Myocardium attachment: it will attach to the heart (either inside of the heart wall or
just placed on the wall surface)
Mechanically stable: the material will not break down or deform due to the
mechanical forces experienced when implanted in the heart.
The safety functions are defined as:
Inflammatory: seriousness of inflammatory response to the implant in the heart
Thrombogenesis: risk of formation of blood clots

34
Scar tissue: threat of scar tissue formation around the implanted material
Cell proliferation: stem cells dividing and growing inside of the scaffold
Migration: danger of stem cells migrating out of the scaffold
Toxicity: risks of having a toxic material in the heart
Implant complications: how important is it to keep in mind possible complications?
Would a fail-safe mechanism be important to have?
Compliance mismatch: risks of mechanical mismatch between the implanted
material and the heart (the material being either too soft or too hard)
Scaffold breaking free: dangers of scaffold breaking free, effects in the patient
Removability: importance of the scaffold’s ability to be removed after implantation
in the event of any complication
Ease of implantation: importance of the material-user (doctor) interface in the
moment of implanting the device
Integration: importance of the material being integrated by the body (cells
interacting with the implant)
pH Balance: since implants can affect the pH balance of the surrounding area,
evaluate the importance of controlling pH balance
The two pairwise comparison charts were sent to and filled out by Professor Glenn
Gaudette, Jacques Guyette, Joseph Dell'Orfano, MD, and Ira S. Cohen M.D., Ph.D. The chart is
filled by writing either “0” (for not important) or “1” (for important) in the white boxes
depending on the level of importance of the function being evaluated. The main function that is
being rated is located horizontally while the vertical functions are the ones used for comparison.

35
For example, if degradability was more important than biocompatibility then the corresponding
box would be filled in with a number “1”; but if immobilization was more important than
degradability then a “0” would be written for that box.
Table 2 shows the final percentages in order from highest to lowest with their
corresponding function. To calculate the percentage of importance for each function, the
Table 1: Pairwise Comparison Charts

36
averages were first taken for each row from each respondent. For example, if the four totals for
degradability were 2, 3, 2, and 0, the average would be:
2 + 3 + 2 + 0
4= 1.75
Biocompatibility should be the main priority and focus for first degree functions, followed by
gap junction formation, myocardium attachment, mechanically stable, immobilization, and lastly,
degradability. When designing the scaffold for safety, the concern with the scaffold breaking free
is of greatest importance, followed by integration, toxicity, thrombogenesis, implant
complications, scar tissue, migration, ease of implantation, inflammation, biomechanical
mismatch, pH balance, cell proliferation, and removability.
Table 2: Averages and Percentages

37
Chapter 4: Design Criteria
Porosity
In order to contain MSCs and allow the formation of gap junctions, the scaffold material
must be porous. Pore size is critical; it must be large enough to allow for the passage of electrical
signals yet not too large to permit leakage of stem cells (Rosen et al, 2004). Other factors beyond
the diameter of the pore must be considered as well. When a biomaterial is subjected to
compressive stress, the average size of the pores will decrease and thus the permeability of the
material will lessen (O'Brien et al 2007). A study by O’Brien et al. concerning the porosity of a
scaffold and its effects on stem cells showed that with increased pore size and permeability,
greater levels of metabolic diffusion occur and consequently induce stem cell proliferation
(O'Brien et al 2007).
Too much porosity yields a negative effect that must be avoided in the design of a
scaffold in the heart. Both of the studies verify the importance of selecting a critical pore size to
achieve the desired functions, and based on their experimental results and the known properties
of MSCs, an optimal pore size will likely be between 0.5-10μm.
Strength
The scaffold must be strong enough to withstand the contractile/relaxation motion of the
heart, yet flexible and adaptable to allow mesenchymal stem cells to proliferate. The strength of
heart contraction and relaxation is measured through blood pressure. The systolic measurement
is the force at which the heart contracts to pump blood into the arteries and to the rest of the
body. A healthy heart should not pump blood at a greater pressure than 120mmHg. The diastolic

38
pressure is the force at which the arteries relax. A healthy heart should yield a diastolic pressure
of approximately 80mmHg (American Heart Association, 2008). A scaffold material subjected to
the systolic and diastolic pressure must withstand forces higher than 120/80mmHg respectively,
to ensure that it will not break under repeated contractile and relaxation forces.
The scaffold material must also be flexible to allow mesenchymal stem cell proliferation
and ease implantation. The stem cells must be able to proliferate within the scaffold to ensure
that as old cells die, new ones are generated to facilitate the communication with cardiac
myocytes. Over-proliferation is not a concern in the design of the scaffold as MSCs are
attachment dependent: they will adhere to the inner wall of the scaffold and will not be
concentrated in the center. As a result, this cell distribution will not impose any mechanical
stress on the scaffold that could potentially cause it to burst. Figure 15 shows a distribution of
MSCs as they would appear adhered to a surface.
Figure 15: Human MSCs attached to a material surface (Plopper, 2008)
Lastly, the material must be simple to implant into the ventricular septum through the use
of a catheter. This minimally invasive approach will require a flexible and injectable material to
effectively be inserted.
39
Preliminary Designs
The design team drafted various conceptual designs which are located in Appendix B.
Based on those early ideas the team prepared two preliminary designs. One is a fibrous cross-
linked scaffold and the second a hollow scaffold with pores. Both will be in the shape of a
football, with the inside being hollow to allow cells to be held inside. Both designs look to
maximize the surface area with which the modified hMSCs could form gap junctions with
cardiac myocytes. The main difference between the designs depends on the manufacturing
technique: the cross-linked scaffold will need to be electrospun while the alternative design will
utilize solvent casting or particulate leaching.
Cross-linked Scaffold
One conceptual design is a cross-linked scaffold. For this design, the fibers of the
biomaterial will be interwoven via electrospinning (see Figure 16; note: the diagram is not scaled
to size). For this design the material would first be electrospun into the football shape; this shape
allows for a maximized surface area for the cells to attach to in order to form gap junctions. The
cells would then be injected through the ends of the scaffold. A concern with this design,
however, is closing off the ends once the cells have been injected. If the ends were to be left
open, an infection could occur. This would result in the patient needing to go through an
additional surgery to remove the infection from the heart before further complications resulted.

40
a) Side view b) Front View
Scaffold with Pores
The second conceptual design is a scaffold that contains a hollow interior with scattered
pores located on all sides of the exterior (see Figure 17; note: the diagram is not scaled to size).
The hMSCs will be placed on the inside of this scaffold, allowing for gap junction formation
through the pores. One advantage this design has over the electrospun design is that the pore size
can be more controlled and concise since it will be produced using solvent casting or particulate
leaching. A major disadvantage of this design, similar to that of the electrospun scaffold, is the
empty space where the cells will be located, allowing for the potential for bacteria to grow and
produce an infection. Another disadvantage of this design is that there will be fewer pores than
the electrospun scaffold for the cells to form gap junctions with.
a) Schematic Drawing
b) Front View
Figure 16: Cross-linked Scaffold
Figure 17: Scaffold with Pores

41
Material Analysis
In order to appropriately choose a material capable of withstanding the mechanical
stresses of the heart, preventing human mesenchymal stem cell migration and other
complications, common materials being employed in cardiovascular applications were evaluated.
The three most common materials utilized for the production of synthetic vascular grafts are
Polyethylene Terephthalate (PET) also known in the medical industry as Dacron,
Polytetrafluoroethylene (PTFE), and Polyurethane (InspiredMD Corporation, 2005). In addition,
Nitinol is a main component of the vascular stent business due to its particular properties. Table
3 summarizes the team’s findings regarding material properties. A sumary of the materials’
characterisitcs under each condition evaluated can be found in Table 4.
Table 3: Summary of Candidate Material Properties
Nitinol Dacron (PET) ePTFE Polyurethane (ChronoFlex® C)
Biocompatible Yes Yes Yes Yes
Citotoxic no no no no
Elastic Modulus 1160-1200 *10^4 psi 40-60*10^4 psi 5.8-8.01* 10^4 psi 0.775-1.9*10^4 psi
UTS 28.3-100 ksi 7.01-10.5 ksi 2.9-4.35 ksi 5.5-7.5 ksi
Yield Strength (Elastic limit)
129-276 ksi 8.19-9.04 ksi 2.18-3.63 ksi ---
Multiaxial fatigue --- 2.8-4.2 ksi (at 10^7 cycles)
0.834-1.02 ksi (at 10^7 cycles)
---
Shear Modulus 4.35-4.69*10^6 psi 0.144-0.216*10^6 psi 0.02-.0276*10^6 psi ---
After evaluating the possible biomaterials that were suitable for cardiovascular
applications, the team decided to use polyurethane as the material for the cardiac scaffold. This
decision was based on the material’s mechanical properties, biocompatibility, corrosion and wear
resistance, cost, availability, and manufacturability to the team’s specifications.

42
Table 4: Qualitative Material Description
Material Mechanical Properties
Bio/Hemo- compatibility
Corrosion & wear
resistance Availability
Ease of manufacturing
Dacron
may kink
Susceptible to fibrotic
encapsulation and infection
Can degrade × easy
Nitinol
Shape memory,
strong excellent
Oxide layer protects
surface from corrosion and degradation
fair
ePTFE
Change drastically over
time
Can ward off infections
Can degrade
fair
Polyurethane
Durable, resistant to
fatigue, elastic and compliant to surrounding cardiac tissue
Not cytotoxic to cells, no
thrombus formation observed,
resistant to bacteria
Does not degrade over time (durable)
easy
Table 5 shows the results stated above just as positive (+) and negative (-) signs to
represent the material’s performance under each category. The last column displays the total of
positive signs for each material. The total numbers were used to evaluate the most appropriate
material for the design of the scaffold. As seen in the chart results, polyurethane has the highest
number of positive aspects; therefore, polyurethane is the best-suited material for the cardiac
scaffold design.
Table 5: Material Summary
Material Mechanical Properties
Bio/Hemo- compatibility
Corrosion & wear resistance
Availability Ease of
manufacturing
Total
+
Dacron - - - - + 1
Nitinol + + + + - 4
ePTFE - + - + - 2
Polyurethane + + + + + 5

43
The polyurethane brand obtained for the purpose of our project was Chronoflex® C
developed by AdvanSource Biomaterials. Chronoflex® C is an aromatic thermoplastic
polyurethane especially designed for biodurability by preventing surface degradation caused by
stresses from the surrounding environment (ChronoFlex, 2008). If needed, this material could be
compounded for radiopacity (ChronoFlex, 2008), allowing the team to track the scaffold after
implantation through imaging technologies. The implementation of Chronoflex® C in
biomedical devices is not regulated under a specific FDA regulation (ChronoFlex, 2008) which
would require a specific FDA approval for the team’s application before human trials could
commence. The full material analysis and AdvanSource’s specification sheets on Chronoflex® C
can be seen in Appendix C.
Material Processing
Once the Chronoflex® C polyurethane was acquired from AdvanSource Biomaterials, the
group worked with Matt Phaneuf and Saif Pathan of Biosurfaces, Inc. (Ashland, MA). Matt and
Saif were able to successfully electrospin the polyurethane pellets into thin microporous sheets.
In order to provide the group with a sheet that was as close to the desired specifications as
possible, there were several settings that had to be considered. One such setting was the distance
from the needle to the collecting plate (a distance of 15cm was chosen for application). If this
distance was increased, the result would have been thinner fibers and thinner pores. While
electrospinning the material, a 10% weight to volume ratio of polyurethane was used. A 20kV
voltage was applied to the polyurethane which was sprayed out at a rate of 3mL/hr. Polyurethane
membranes were electrospun at three different time intervals: 30 minutes, 60 minutes, and 90
minutes (n=1 for each time). The average sheet thickness for a 60 minute electrospun sample was
approximately 50μm.

44
Chapter 5: Design Verification
Culturing Mesenchymal Stem Cells
The following material is taken from the advice of Jacques Guyette, a PhD grad student
in the Biomedical Engineering Department at Worcester Polytechnic Institute. Caring for the
human mesenchymal stem cells requires diligent attention to detail. The first care item is
preparation of media to sustain the cells. The media was prepared in the sterile hood and contains
500mL of DMEM as the base. To this 50mL of fetal bovine serum (FBS) and 5mL of PenStrep
was added to create a 10% FBS and 1% PenStrep solution. The media, which needs to be
replaced every 2-3 days, was placed in three 50mL conical tube aliquots and ten 15mL conical
tube aliquots. The rest was left in the original DMEM container. The cells were grown in a T75
size flask which only required 8mL of media.
Human mesenchymal stem cells are attachment dependent. In order to remove them from
their T75 flask and separate them into two flasks (or utilize for experiments) it was necessary to
break down the extracellular matrix which holds the cells to the surface of the container. This
was done by first removing the media in the flask and adding 7mL of trypsin to the cells; trypsin
is a protease which breaks down protein (Guyette, 2008). After 10 minutes the flask was checked
under the inverted microscope, and if, when agitated, cells were seen to shift and float, the
solution was ready to be spun. It is important not to leave the trypsin activated with the cells for
longer than 15 minutes. This is because the trypsin will begin to break down the cells
themselves. The cells + trypsin were added to a 15mL conical tube with 4mL of fresh media. The
fetal bovine serum in the media deactivates the trypsin. Putting this 11mL cell, deactivated
trypsin, and media into a centrifuge with a counter weight, it was spun at a low velocity for 5
minutes. Upon taking the conical tube out of the centrifuge, the dilatant media is on top and the

45
cell pellet at the bottom. The dilatant was removed and 1mL of fresh media was added to the cell
pellet. After the cells were re-suspended in the new media, the number of cells had to be counted.
This was done by taking 10μL of the cell suspension and adding it to a small tube of 40μL trypan
blue and 50μL of Phosphate-buffered saline (PBS). After mixing this mixture well, 10μL of the
solution was carefully added to each side of a hemocytometer. The cells were counted in the
hemocytometer using the inverted microscope.
Experimental Design
After the design criteria were identified and the materials had been selected, testing was
necessary to ensure that the device would meet all requirements. The testing of medical devices
must follow strict protocols established by the Food and Drug Administration (FDA), which
classifies all medical devices into one of three classes. Class I devices are those that pose
minimal harm, either to the patient or the user. Consequently, they require the least amount of
regulatory control. Examples of Class I devices include bandages and latex gloves (Device
Classes, 2002). Class II devices are those that pose potential harm, and thus require general and
special controls. Special controls may indicate specific labeling requirements or specific
performance criteria. Examples of Class II devices include powered wheel chairs and infusion
pumps (Device Classes, 2002). Lastly, Class III devices are those that pose the most danger and
thus require the strictest regulation. Premarket approval is required for most Class III devices
before testing can commence. In order to gain premarket approval, an application must be filed
and a review committee will then determine whether or not the device is safe and effective. Class
III devices include any life-sustaining implant such as pacemakers and endosseus devices
(Device Classes, 2002).
46
A cardiac scaffold implanted in the heart would be classified as a Class III medical
device as it poses great potential harm. The implantation procedure itself is dangerous, and if the
device malfunctions, the consequences of its failure could be fatal. Thus, in order to be approved
by the FDA, the effectiveness of the device must be shown. Additionally, the device should be
designed to be as safe as possible to diminish potential harm.
As with all Class III devices, the criteria the device must meet will be strict.
Organizations such as the American Society for Testing Materials (ASTM) write standard tests
that can be done to validate the properties of specific materials. The International Standards
Institute (ISO) is another organization that writes standards that researchers, scientists,
manufacturers and more must comply with in order to effectively bring a product to market
(Ratner, 2004). This section identifies some of the tests and standards that a cardiac scaffold
device must meet in order to obtain approval.
Preparing for Cell Assays
Prior to using the electrospun samples to carry out the Migration Assay, Cell Viability
Assay, and the Connexin Assay, the group needed to sterilize the polyurethane sheets. This was
done by first soaking them in 70% ethanol for approximately two hours. Afterwards, they were
soaked in distilled water for two hours and allowed to dry in a sterile air hood overnight.
Furthermore, the group needed to have special wells manufactured in order to perform
these assays. The group used a core design created by Professor George Pins (Worcester
Polytechnic Institute, MA) where a sheet of material is clamped between two caps. The group
altered the design slightly to increase the ease with which the wells could be manufactured, and
then had Giacomo Ferraro (Worcester Polytechnic Institute, MA) machine the wells out of a

47
Lexan plastic. These wells, as seen in Figure 18 and termed “Gaudette-Pins wells”, are
autoclavable and allowed for the group to carry out all the necessary assays.
Figure 18: Custom built wells which house the polyurethane scaffold and allow for the seeding of cells on both
the upper and lower side
Pore Size Migration Assay
Migration of non-terminally differentiated stem cells from target sites is a current concern
around stem cell based therapies. In this context, the migration of modified hMSCs migrating
away from the heart and differentiating could cause unpredictable effects on the body. A direct
effect could be multiple concentrations of modified hMSCs settling at different sections of the
heart. This could mean multiple action potentials initiating simultaneously at different locations
of the heart resulting in fibrillation. For these reasons limiting and ideally preventing migration
all together is a key function of the design.
Figure 19: Preliminary Design of Stem Cell Scaffold
To limit migration, the team proposed to create a porous mesh (See Figure 19). An
integral aspect of this design is the pore size of the mesh. Ritter et. al, investigated the migratory

48
effects of Basic Fibroblast Growth Factor (FGF-2) on human mesenchymal stem cells (2008). In
a Transwell migration assay (Boyden assay), they found hMSCs migrated through 8μm pores
when FGF was used as a chemoattractant in excess of 20ng/mL. Although Ritter et. al, found
that breast cancer derived FGF-2 and Vascular Endothelial Growth Factor (VEGF) both induced
attractive migration of human mesenchymal stem cells, in vitro concentrations were similar and
FGF-2 costs less to obtain (Invitrogen, Carlsbad, CA). In addition to 8μm pores, the team
utilized 3μm and 0.4μm pore Transwells (NUNC, Rochester, NY) to determine the pore size at
which hMSCs cannot migrate. See Figure 20 for test representation. A concentration of 30ng/mL
placed in the lower compartment with 400μL of DMEM media simulated double the
physiological concentration of FGF-2. 100,000 hMSCs were seeded on the upper part of the
microporous membrane and incubated for 3 days at 37oC and 5% CO2. Migration of cells was
quantified using Hoechst and Phalloidin staining for cell nuclei and cytoplasm, respectively.
Figure 20: Pore Size Test (Corning Transwell® Permeable Supports)
Quantifying hMSC Migration
In order to quantify the results from the pore size migration assay, Hoechst and Phalloidin
stains were used on both the wells and the well inserts to fluorescently label cells. The Hoechst
stain was used to label the nucleus of the hMSC, while the Phalloidin stain identified the cellular
cytoplasm. The following protocol was used to stain for stem cell migration:
1. Remove the well insert from the well and place into another sterile well. Rinse both in
PBS solution for 5 minutes.

49
2. Remove the PBS solution and re-rinse both the well and the insert in PBS for another 5
minutes.
3. Remove the PBS solution. Place 4% paraformaldehyde at the bottom of the well and
insert for a total of 10 minutes to fix the cells.
4. Remove the paraformaldehyde and rinse with PBS solution for 5 minutes.
5. Remove the PBS solution and re-rinse both the well and the insert in PBS for another 5
minutes.
6. Remove the PBS solution. Place .25% Triton-X (in PBS) onto the well and insert for a
total of 10 minutes.
7. Remove the Triton-X and rinse with PBS solution for 5 minutes.
8. Remove the PBS solution and rinse with 1% Bovine Serum Albumin (BSA) in PBS for
10 minutes.
9. Remove the PBS/BSA and place Alexa Fluor 488 Phalloidin stain (5L Phalloidin per
200L PBS) on the samples for 30 minutes.
10. Remove the stain and rinse with PBS/BSA for 10 minutes.
11. Remove the PBS/BSA and re-rinse with more PBS/BSA for 10 minutes.
12. Remove the PBS/BSA and re-rinse with more PBS/BSA for another 10 minutes.
13. Remove the PBS/BSA and place Hoechst 3342 Trihydrochloride Trihydrate stain
(10L/1mL Distilled Water) on the samples for 5 minutes.
14. Remove the stain and rinse with PBS/BSA for 5 minutes.
15. Remove the PBS/BSA and place pure PBS onto the samples.
16. Examine the samples under a fluorescent microscope.

50
Scaffold Gap Junction Formation Assay
Another important aspect of the team’s design is whether the hMSCs form gap junctions
through the porous polyurethane. In order to test this, the team proposed to do another Transwell
assay. The difference being that whereas the pore size was evaluated utilizing migration across
industrial standard polycarbonate transwells, this assay looked at gap junction formation across a
polyurethane microporous membrane. After the results of the pore size assay are complete, the
team will know the range of pore sizes with which to construct the polyurethane scaffold. Instead
of seeding a single cell layer on the upper portion of the porous membrane, it was necessary to
have one layer of cells on each side of the microporous polyurethane membrane. See Figure 21
for assay representation. The cells needed to be geared towards gap junction formation. It would
be ideal to place myocytes obtained from mice or dogs across from the hMSCs; however
obtaining cardiac myocytes is difficult and mantaining in culture is also very challenging.
Another option would be to obtain special connexin 43 expressing cells, but again these cells are
delicate and expensive. The cost effective solution was to seed hMSCs on both layers. Using
connexin 43 staining and confocal microscopy it was possible to determine gap junction
formation across the pores. After seeding and the appropriate tracking (quantum dot) the system
was incubated for 48 hours and stained for connexin 43. See Figure 21 for design specification of
custom built dual well for gap junction assay.
Figure 20: Two layers of hMSCs across a microporous polyurethane membrane

51
Figure 21: Gaudette-Pins Dual Transwell Design
Gap Junction and Live/Dead Immunohistochemistry
In order to determine whether gap junctions form between the polyurethane membrane,
connexin 43 (the primary protein in gap junctions) staining was conducted. The following was
the procedure for connexin 43 staining; Figures 22 and 23 are representative images of tissue
controls and cell samples.
1. Fix cells in cold acetone for 10 minutes at -200C
2. Rinse twice with PBS 5 minutes each wash
3. Rinse with Triton X for 10 minutes
4. Block with 1.5% Normal Rabbit Serum (NRS) at room temperature for 1 hour
5. Add primary anti-body (mouse anti-connexin) at 1:250 concentration in 1.5% NRS and
incubate overnight at -200C
6. Rinse 3 times with PBS for 5 minutes each
7. Add secondary anti-body (Alexa Flour 488 rabbit anti-mouse at 1:400 concentration in
1.5% NRS for one hour (Light Sensitive – Keep covered after this step)
8. Rinse with PBS 5 minutes
9. DAPI counterstain
10. Observe results

52
Figure 22: Positive (left) and Negative (right) Tissue Control Slides 40x
Figure 23: Positive Cell Samples at 40x (left) and 20x (right)
It was also necessary to determine cell viability on the polyurethane scaffold. To this end,
the team performed Live/Dead staining. Proper concentrations for the solutions were previously
determined by Jacques Guyette. For live hMSCs the fluorescent dye calcein was used at a
concentration of 1µMolar. For dead hMSCs, Ethidium Bromide was used at a concentration of 8
µMolar. Figure 24 shows representative images of Live/Dead staining results. The following
protocol for Live/Dead is very straightforward.
1. Create a combined solution of the two dyes in sterile PBS at the appropriate
concentrations.
2. Add the solution to the cells

53
3. Cover
4. Incubate for 20 minutes at 370C
5. Add fresh Live/Dead solution or PBS to wash cells.
6. Observe cells.
Figure 24: Sample Staining of Dead (left) and Live (right) cells

54
Chapter 6: Experimental Results and Discussion
Pore Size Migration Assay – Trial 1
For the first trial of the pore size migration assay, three separate items were stained: the
bottom of the wells after 3 days of incubation, the bottom of the wells after 11 days of
incubation, and the well inserts themselves after 11 days of incubation. Staining of the wells used
for the 8m pore inserts showed that only 3-4 hMSCs passed through after 3 days of incubation;
however, after 11 days, a significantly larger amount of cells had passed through. In some of the
wells, over 20 hMSCs had migrated through. With the 3m inserts, only 1-2 cells were seen in
the wells for both 3 and 11 days worth of incubation. Staining of the wells used in conjunction
with the 0.4m inserts showed no signs of cell migration. Figure 25 below shows some of the
images that were obtained from the first trial.
Figure 25: Bottom of 8 µm insert (left) and bottom of well (right)
This trial helped to provide some supporting evidence as to the proper pore size for the
scaffold. Based on the results, it appears that the proper pore size will be between 0.4m and
3m. While a minimal amount of cells passed through the 3m pores, no cells seemed to pass
through the 0.4m pores, which suggests that the pore size will probably be around 1m to 2m.

55
While this data was informative, there were a couple of limitations with this trial. The
first was that no controls were used. For the next trial, positive controls (wells with hMSCs
seeded at the bottom) and negative controls (wells and inserts with just media) will be used so
that the team can more subjectively determine cell migration.
Another limitation of this trial was that the bottom of the wells was used to quantify stem
cell migration. Although this provided some information, hMSCs are attachment dependent; it is
unlikely that a large amount of cells would detach and sink to the bottom of the well. The cells
would be more likely to migrate through the pores to the other side of the well. Although these
cells did not float away, they were still able to migrate through the pore size (meaning that a
smaller sized pore would be needed for the scaffold).
In order to obtain more valid results, the second trial will also look at the bottom side of
the well insert. The top part of the well insert will be scraped to remove any cells that did not
migrate through, and then the remaining cells will be stained to identify migration. This
methodology was effectively used by researchers who performed a similar transwell migration
assay (Forte et al, 2006).
Once a proper pore size range has been confirmed, a similar assay will be conducted
using a polyurethane scaffold instead of the polycarbonate well inserts. Scaffolds with various
pore sizes will be used to ultimately determine what the necessary pore size must be.
Pore Size Migration Assay – Trial 2
The second trial of this assay had a similar setup to the previous run, but with only 0.4
micron and 3 micron porous wells. Again, a FGF based chemoattractant was used to help induce

56
migration of the hMSCs (approximately 55ng/mL) and roughly 50,000 cells were allowed to
incubate within the wells for 3 days before the staining procedures were carried out.
The limitations associated with the initial trial of the Migration Assay were also
addressed in this run. In order to have some experimental control, both a positive and negative
control were used in order to more accurately identify the migration of a stem cell through a
pore. For the positive control, hMSCs were seeded on the reverse side of the well; for the
negative control, only media was put into the well.
The other major drawback with the initial trial was addressed in how the wells were
analyzed. The initial run looked at cells which had completely passed through the well and
seeded to the bottom of the plate. However, it is more likely for the stem cells to migrate from
the upper side of the well to the lower portion through the porous membrane. In order to identify
this style of migration, the wells were examined prior to and after scraping the upper portion of
well membrane.
After completing the staining, the 0.4 micron wells were analyzed with an inverted
fluorescent microscope. When examining the wells prior to scraping them, it was apparent that
there were still cells on the membrane, either on the upper or lower surface. After scraping the
upper surface with a q-tip, the wells were re-examined, which showed evidence of no cell
migration to the opposite side of the well. Figure 26 contains representative images of the 0.4
micron wells, both before and after scraping.

57
Figure 26: .4 micron wells prior to scraping (left) and post scraping (right)
Similar to the 0.4 micron wells, an initial look with the scope revealed a mass of cells on
the 3 micron wells. However, after scraping the wells with a q-tip, there was still a significant
amount of cells. This confirms the belief that the 3 micron pores are too large, which allow for
the cells to migrate through to the other side. Figure 27 below shows the representative images.
Figure 27: 3 micron wells prior to scraping (left) and post scraping (right)
.

58
Cell Viability Assay
The results from the cell viability assay showed a mixed bag of live and dead fluorescent
signal. For the most part there was live signal as shown in Figure 28. The controls had a much
brighter signal for both live and dead. Live signal is represented by green while dead cells show
up as red. The polyurethane isn’t completely transparent so it could have played a role in the
reduced signal. In addition, the formation of gap junctions among the cells demonstrated cell
viability on the polyurethane. The next section goes into detail about gap junction formation.
Figure 28: Live/Dead Results
Gap Junction Assay Results
Cells were seeded on both sides of the polyurethane scaffold suspended in the Gaudette-
Pins dual well and allowed to incubate for 48 hours. Staining with controls was conducted as
outlined in the methodology. Confocal microscopy was used to determine gap junction formation
through the polyurethane. Confocal microscopes allowed for visualization in the x-, y-, and z-
planes, Figure 30 shows a 3-D projection of the cell seeded polyurethane. The nuclei (blue
circles) on the far sides represent cells on opposite sides of the polyurethane. As seen in Figure
29 there is nuclei signal and gap junction (green) signal between the polyurethane scaffolds. The
results demonstrate that formation of gap junctions through the scaffold is possible.

59
Figure 29: 3D Gap Junction Formation through Polyurethane
Migration through Polyurethane
As stated, one of the potential limitations with the electrospun polyurethane is the lack of
a precisely controlled pore size. In order to ensure that the gap junctions seen in the previous
assay were formed through a barrier that limited migration, another migration assay was
conducted. All test parameters remained the same, except this time the specially manufactured
wells were used. Quantifying migration for this round of experiments was less complicated
because the polyurethane sheets were not transparent. Therefore, no scraping was necessary;
when being examined with the fluorescent scope, the group could just flip over the custom made
well to examine the other side.

60
Overall, results from the test showed that no cells were able to pass through the 30, 60, or
90 minute electrospun microporous sheets. This means that the settings with which Biosurfaces,
Inc. electrospun the polyurethane would prevent migration of the cells and allow for the
formation of gap junctions. Figure 30 shows the difference between the side of 60 minute sheet
on which cells were seeded, and the opposite side (where the hMSCs could not migrate to).
Figure 30: Human Mesenchymal Stem Cells on one side of the polyurethane sheet after 3 days of incubation (left);
Reverse side of the same polyurethane sheet, where no cells were able to migrate to (right)

61
Mechanical Calculations
Deflection of a hMSC
Based on the pore-size testing results, the pore size of the electrospun polyurethane
should be between 0.4-3.0μm. However, this is a wide range and doesn’t provide a specific
enough result; therefore, to obtain a better pore-size approximation, the deflection of an hMSC
was calculated mathematically at different pore-sizes.
The main importance of these calculations was that it allowed the design team to
determine what the fiber diameter should be of the electrospun polyurethane. In order for gap
junctions to occur, both the pore size and fiber diameter had to be balanced so that cells on
opposite ends of the fiber deflect and touch each other. If these two parameters are not
appropriately balanced, either the cells will not come into contact with each other or the cells
will migrate through to the opposing end of the fiber.
To begin the calculations, it was assumed that the cell was in the shape of a beam. From
literature, it was determined that a cell has a length of 10.0μm and a thickness of 2.0μm (Tastan,
et. al., 2009). It was also assumed that there was a uniform load distribution on the cell caused
by the beating heart (see Figure 31).
x
w
wL
2 wL
2
L
Figure 31: Free Body Diagram of a hMSC

62
As part of the derivation for deflection, the maximum deflection would occur at 𝑥 =𝐿
2;
based on this, the maximum deflection equation is:
𝐸𝑞. 1 ∆𝑚𝑎𝑥 =5𝑤𝐿4
384𝐸𝐼 ,
where E is the Young’s Modulus of a hMSC, I is the moment of inertia of the hMSC, L is the
length between fibers (the pore-size), and w is the force per unit length (see Appendix D for full
derivation). The constants obtained from literature were Young’s Modulus and the pressure
exerted by the intramyocardial wall. In a study conducted by Tan, et. al. (2008), it was
determined that at human body temperature (37°C), the Young’s Modulus of an hMSC is
126±81Pa. For the intramyocardial pressure constant, Heineman et. al. (1985) determined that
there was a range of 5±2mmHg. The mean value (5mmHg) was then used to determine the force
per unit length exerted onto the cell at various pore sizes.
To calculate the moment of inertia, it was assumed that the shape of the cell was
elliptical. For a quarter of an ellipse, the moment of inertia equation is:
𝐸𝑞. 2 𝐼 =𝜋𝑎𝑏3
16 ,
where a and b are defined in Figure 32.
.
Figure 32: Moment of Inertia of a hMSC
a
b
1.0 μm
5.0 μm

63
This equation was modified in order to calculate the moment of inertia of a full ellipse.
To do this, the quarter ellipse equation was multiplied by four, which resulted in the following
equation:
𝐸𝑞. 3 𝐼 =𝜋𝑎𝑏3
4 .
After the variables a and b were plugged into the former equation, the resulting moment
of inertia of a hMSC is 3.93μm4.
The last variable included in the maximum deflection equation, L, varied from 0.4 to
3.0μm. For the calculation, increments of 0.5 were used from 1.0 to 3.0μm; no increments were
used between 0.4 and 1.0μm.
The calculations for the maximum deflection were completed using MatLab. An
example of the syntax used in MatLab is shown in Figure 33. For all MatLab coding, see
Appendix E.
Figure 33: MatLab Syntax
Upon completing all the calculations, the team decided the most desirable pore-size
would be between 2.0 and 2.5μm (see Table 6; for all results, see Appendix F) because it would
result in a more manageable fiber thickness. The average deflection length between 2.0 and
2.5μm is 15-30μm. Therefore, the fiber diameter would need to be double the deflection length
in order to account for cells deflecting on opposite sides of the fiber and forming gap junctions.
As a result, the fiber diameter should be approximately 30-60μm.
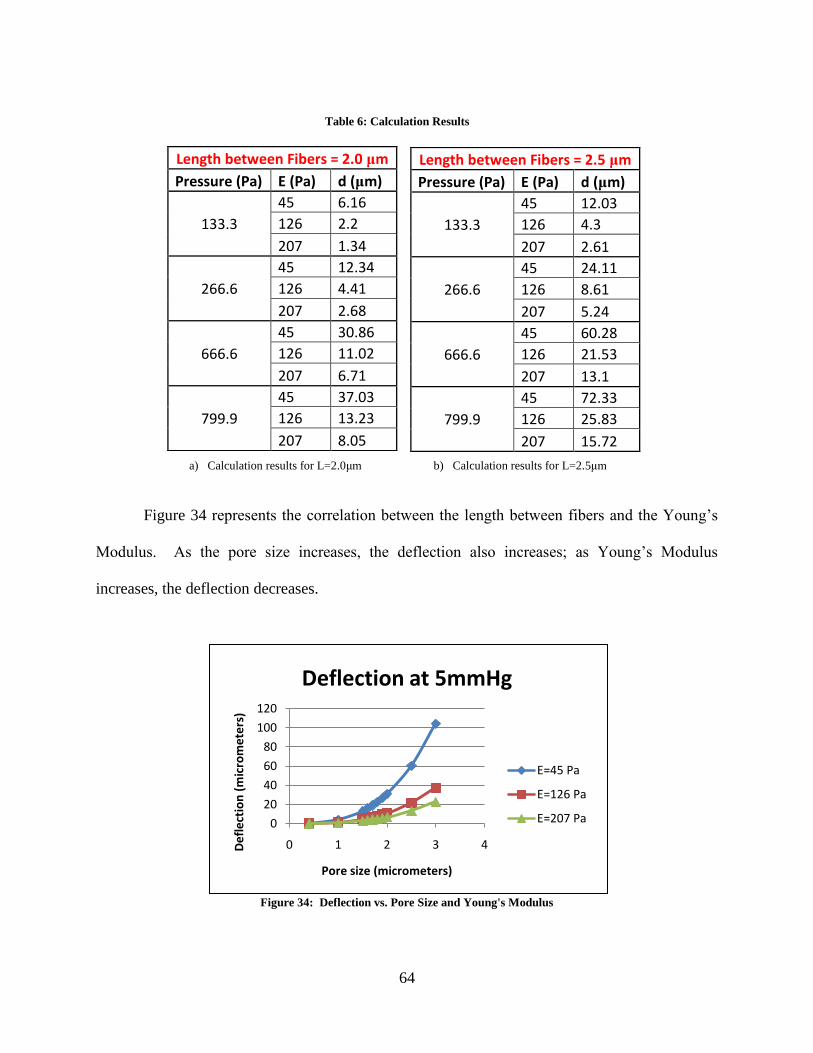
64
Figure 34 represents the correlation between the length between fibers and the Young’s
Modulus. As the pore size increases, the deflection also increases; as Young’s Modulus
increases, the deflection decreases.
Figure 34: Deflection vs. Pore Size and Young's Modulus
0
20
40
60
80
100
120
0 1 2 3 4De
fle
ctio
n (
mic
rom
ete
rs)
Pore size (micrometers)
Deflection at 5mmHg
E=45 Pa
E=126 Pa
E=207 Pa
Length between Fibers = 2.0 μm
Pressure (Pa) E (Pa) d (μm)
133.3
45 6.16
126 2.2
207 1.34
266.6
45 12.34
126 4.41
207 2.68
666.6
45 30.86
126 11.02
207 6.71
799.9
45 37.03
126 13.23
207 8.05
Length between Fibers = 2.5 μm
Pressure (Pa) E (Pa) d (μm)
133.3
45 12.03
126 4.3
207 2.61
266.6
45 24.11
126 8.61
207 5.24
666.6
45 60.28
126 21.53
207 13.1
799.9
45 72.33
126 25.83
207 15.72
a) Calculation results for L=2.0μm b) Calculation results for L=2.5μm
Table 6: Calculation Results

65
Cell Quantity Threshold
The design team contacted Dr. Ira Cohen of SUNY Stony Brook University via e-mail to
inquire about the number of modified hMSCs required to replace the function of the sinoatrial
node. He responded that his team estimates 350,000 cells fully restore function, but with only
50% transfection efficiency they inject 700,000. In order to have a safety factor of two, the team
decided to seed 700,000 onto the scaffold. Therefore, the area of the collected cells and the
surface area of the scaffold both needed to be calculated to determine appropriate dimensions for
the scaffold.
To calculate the area of a cell, the diameter of a cell used was 10μm, as used in the
deflection calculations. The following formula was used to determine the surface area needed for
700,000 cells:
𝐸𝑞. 4 𝐴𝑐𝑒𝑙𝑙 = 𝜋𝑟2 ∗ 700,000 .
The calculated surface area was 55.0 mm2 for 700,000 cells.
Economic, Environmental, and Ethical Impacts
While this project solely focused on the concept of limiting migration of stem cells, if the
overall technology and research of a biological pacemaker reaches the point where it can be used
effectively to pace the heart, it would allow for patients to undergo one surgery to fix any
arrhythmia problems. This reduces the overall impact on the health care and economic system,
since the cost of repeated surgeries to replace pacemakers would be decreased.
Overall, the cost of producing a biological pacemaker is less than that of the artificial
pacemaker; therefore, the benefits of this product can reach people who may not normally have

66
been able to afford it. This would positively impact people not only in this country, but around
the world as well.
As for environmental concerns, there are no major environmental impacts that result from
this product. The overall cost of production and the cost of material is minimal when producing
this product. Also, the biological pacemaker works with the body, so once the scaffold is
produced and implanted; it does not need to be replaced. That way, there are no pacemakers or
batteries to discard.
Lastly, the ethical considerations revolving around human mesenchymal stem cells are
minimal since they are taken from each individual pacemaker. If the system revolved around
embryonic stem cells, the ethical debates would be more significant.

67
Chapter 7: Final Design
Based on initial migration assays, the mechanical calculations, considerations for
minimally invasive delivery through a catheter, and development of the team’s preliminary
designs; the team proposes the final design seen in Figure 35. The design consists of a two part
cylindrical scaffold. The cylindrical shape was chosen because it resembled the shape of stents,
which are widely used in the cardiac industry. The blue section is a solid cylinder composed of
ChronoFlex® C. The purpose of this solid cylinder is to provide mechanical support to the
scaffold. The red section represents a porous electrospun ChronoFlex® C film on which the
modified hMSCs are seeded. This membrane is thin enough to allow for cellular communication
across the scaffold and the pores are sized to prevent cells from migrating through to the other
side. The team worked with Biosurfaces, Inc., who made the electrospun ChronoFlex® C
membrane for this project. After cellular adhesion, the porous film is wrapped around the solid
polyurethane cylinder. To finalize the scaffold, sealing bands and caps in conjunction with
BioGlue® are added to prevent hMSC migration out of the scaffold from the sides of the
cylinder. Another function of the sealing bands and caps is to protect the porous membrane from
the shear stresses the scaffold might experience during delivery.
Figure 35: Final Design Representation

68
Following the recommendation of Professor Glenn Gaudette and using current cardiac
catheter sizes as a guide to develop the scaffold, the team chose an outer diameter of 1.0mm for
the solid polyurethane component of the design. The minimum length of the scaffold was then
calculated taking into consideration the amount of surface area needed to seed 700, 000 cells
(amount of cells seeded to induce pacemaker function in the heart) onto the surface of the porous
membrane. Because the electrospun polyurethane is in the shape of a cylinder; the following
surface area equation was used:
𝐸𝑞. 5 𝑆𝐴𝑐𝑦𝑙𝑖𝑛𝑑𝑒𝑟 = 2𝜋𝑟2 + 2𝜋𝑟𝑙 ,
where r is the radius of the solid polyurethane scaffold, SA is the surface area of the 700,000
cells and l is the minimum length of polyurethane needed. After the variables were plugged into
this equation, it was determined that the length needed was 17.0 mm.
The deflection calculations determined that the desired electrospun membrane thickness
was between 30 and 60μm, and from both the deflection calculations and the pore size migration
assay it was determined that the appropriate pore size was between 2.0 and 2.5μm.
Fibrin Glue
In order to seal the scaffold, the team plans to use sealing bands and caps in conjunction
with BioGlue®. BioGlue is a surgical adhesive developed by CryoLife that has been specially
designed for the use in cardiovascular surgery. It is composed of purified bovine serum albumin
(BSA) and gluteraldehyde that are packaged in two separate chambers of a syringe as shown in
Figure 36 (CryoLife, 2008).
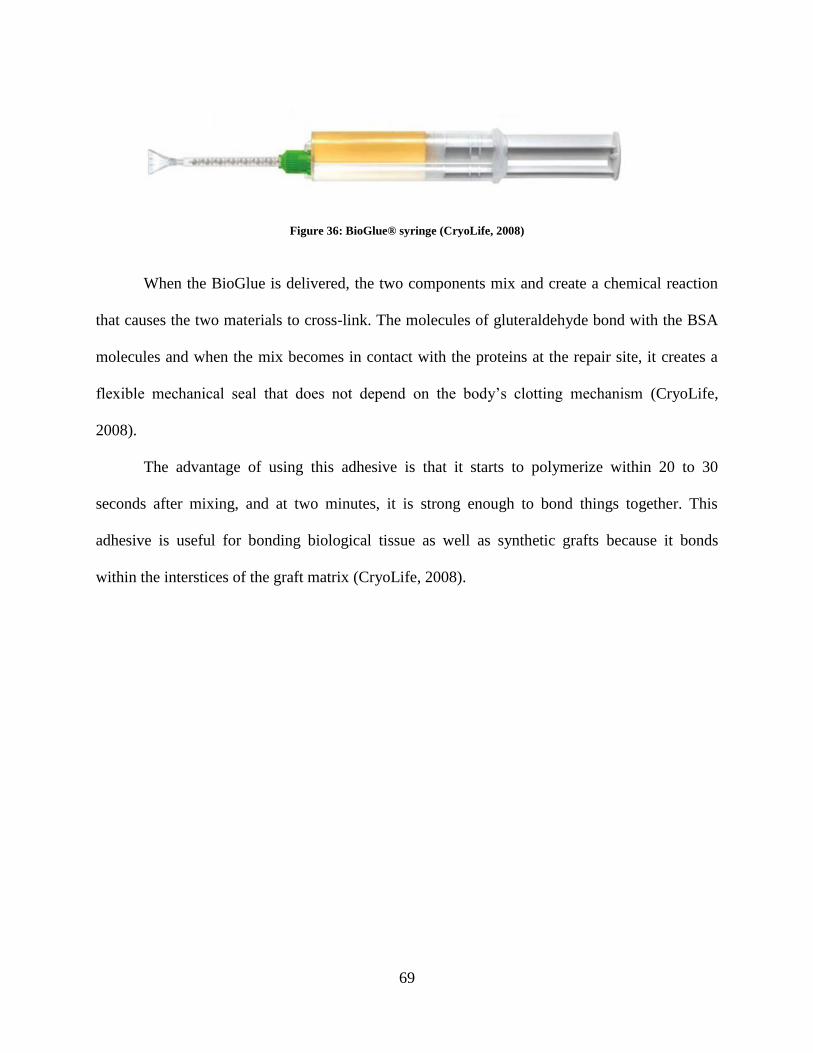
69
Figure 36: BioGlue® syringe (CryoLife, 2008)
When the BioGlue is delivered, the two components mix and create a chemical reaction
that causes the two materials to cross-link. The molecules of gluteraldehyde bond with the BSA
molecules and when the mix becomes in contact with the proteins at the repair site, it creates a
flexible mechanical seal that does not depend on the body’s clotting mechanism (CryoLife,
2008).
The advantage of using this adhesive is that it starts to polymerize within 20 to 30
seconds after mixing, and at two minutes, it is strong enough to bond things together. This
adhesive is useful for bonding biological tissue as well as synthetic grafts because it bonds
within the interstices of the graft matrix (CryoLife, 2008).

70
Chapter 8: Conclusions & Future Recommendations
The results of this study showed that the electrospun polyurethane can serve as an
effective scaffold to keep the hMSCs of a biological pacemaker in one centralized location. Not
only did the polyurethane scaffold successfully inhibit stem cell migration, it proved to be an
adequate environment for cell viability and gap junction formation.
For future work, the team recommends further research regarding the sealing of the
scaffold around the solid cylinder. Once this problem has been addressed, the team believes that
the scaffolds can be assembled and used in in vivo studies. Another area of future work also
includes development of a catheter delivery system.
Another potential area of research could be regarding casting of polyurethane with micro-
particles in order to create a controlled pore size. Although the electrospun scaffold was
successful in preventing migration of the stem cells, there is a lack of a definitive pore size.
Mechanical testing regarding the strength of the scaffold needs to be performed in order
to ensure it can withstand the contractile forces within the heart. Also, in terms of catheter
implantation, it is necessary to determine if the scaffold can withstand the shear stresses it will be
subjected to.

71
Appendix
Appendix A: Completed Pairwise Chart
The two pairwise comparison charts were sent to and filled out by Professor Glenn Gaudette,
Jacques Guyette, Joseph Dell'Orfano, MD, and Ira S. Cohen M.D., Ph.D. Once returned, the
design team filled in the corresponding gray boxes; if a white box (located horizontally) had a
“0”, then the corresponding gray box (located vertically) would receive a “1”. The totals were
then calculated for each row (see Table 2 for example).
Completed Pair wise Comparison Chart
PWCC 1st degree functions D
egra
dab
ilit
y
Bio
com
pat
ibil
ity
Imm
obil
izat
ion
A
llow
Gap
Junct
ion
form
atio
n
Myoca
rdiu
m
atta
chm
ent
Mec
han
ical
ly
stab
le
Tota
l
Degradability 0 0 0 0 0 0
Biocompatibility 1 1 1 1 1 5
Immobilization 1 0 0 0 0 1
Allow gap junction formation 1 0 1 1 1 4
Myocardium attachment 1 0 1 0 1 3
Mechanically stable 1 0 1 0 0 2
Total 5 0 4 1 2 3 15
To calculate the percentage of importance for each function, the averages were first taken for
each row from each respondent. For example, if the four totals for degradability were 2, 3, 2, and
0, the average would be: 2 + 3 + 2 + 0
4= 1.75

72
Appendix B: Conceptual Designs
Bag – There is a material (mesh, porous polymer, porous metal, porous ceramic) that contains
the hMSCs in a spherical shape
Pancake Discs
Four layers of disc attached to the ventricular wall. (Anticoagulant Coating facing ventricle,
scaffold, cell layer, mesh inhibiting cell migration)
Anti-coagulant orange)
(Scaffold(grey)
Cells (red)
Mesh (green)
Three-Layered mesh bag attached to the ventricular wall (blood compatible mesh encompasses
both cells and attachment scaffold)
Bi-Layer Pancake Cap
Flat Mesh Container
Open sided patch – attachment dependent hMSCs stay on scaffold, free side to interact with
myocytes

73
Appendix C: Candidate Material Analysis
Nitinol
The first material that is being considered is nitinol. Nitinol was originally developed by
the space program Nickel Titanium Naval Ordinance Laboratories (Whittaker et al, 2006).
Nitinol is a passive shape memory alloy made from 55% Nickel and 45% Titanium (Trepanier et
al, 2000) that is commonly used in the Biomedical Engineering industry. Some of the most
frequent applications of nitinol involve vascular stents, orthopedic and orthodontic applications
(Trepanier et al, 2000) such as arch wires and osteosynthesis plates (Pelton et al, 2000), and it is
also used devices used in minimally invasive surgery like tissue ablation devices, vena cava
filters and retrieval baskets (Pelton et al, 2000).
Nitinol can withstand a maximum strain of up to 8% without permanent deformation
(Pelton et al, 2000); this attribute is usually referred to as super-elasticity. The material’s super-
elasticity and shape memory properties allow engineers to easily anneal the alloy to a certain
shape that is then retained. The material can easily be cooled down and deformed in order to
comply with the engineers’ needs and when later reheated or simply brought back to room
temperature, the alloy goes back to its annealed shape. This can be very useful when designing
for implantation or for tool versatility.
A great attribute exhibited by nitinol that makes it appropriate for blood contacting
devices, more specifically vascular applications, is the material’s anti-thrombogenic properties
and corrosion resistance. Extensive research done on the material has demonstrated its
biocompatibility and leading to its approval by the FDA. The corrosion resistance of nitinol is
attributed to a stable surface oxide layer that protects the material from its surrounding
environment and increases biocompatibility. This is achieved by changing nitinol’s chemical
pathway of oxidation (Trepanier et al, 2000). As part of the design, scratching of the oxide layer
must be kept at a minimum; especially when considering delivery of the device possibly through
a catheter. If the oxide layer is disrupted this can affect nitinol’s corrosion resistance properties.
(Trepanier et al, 2000)
When testing for biocompatibility, the experiments were designed under the ISO 10993
standards. The properties of the material that are usually evaluated to asses biocompatibility
include foreign body reaction, inflammatory response, thrombosis, carcinogenesis, sterilization
and infection, (InspiredMD Corporation, 2005) as well as mechanical properties like fatigue
testing. One risk of using biomaterials that contain nickel is the possibility of nickel ions being
released into the body. It is known that nickel is a potent inflammatory agent in biological tissue
(Whittaker et al, 2006), and excess release of nickel from the implant can cause harmful
allergenic, toxic and carcinogenic reactions (Trepanier et al, 2000). Recent studies show that the
maximum concentration of Ni released by nitinol is 4.1 ppb; and this takes place within the first
24 hours after implantation. For Ni to reach cytotoxic levels in the human body, it needs to reach
a concentration of 30ppm (Jia et al, 1999).
Other experiments have been conducted to further evaluate the biocompatibility of
nitinol. One concern for our project is fibrotic encapsulation of the biomaterial. If fibrotic
encapsulation of our scaffold were to occur, then the cells seeded inside of the scaffold will not
be able to form gap junctions with the cardiomyocytes located at the other side of the membrane.
A study performed to understand the tissue reactions when nitinol is implanted subcutaneously
showed that the inflammatory response of the body to the nitinol started 3 days after
implantation and was minimal. The healing process, which consisted of fibrous encapsulation of

74
the biomaterial, started 1-2 weeks after implantation. (Trepanier et al, 2000) During the initial
stages of wound healing, the fibrotic encapsulation thickness of nitinol is higher than stainless
steel. As time goes on, the fibrotic encapsulation thickness of stainless steel increases and
nitinol’s remains the same. This results in both materials having the same fibrotic encapsulation
thickness which makes nitinol biocompatible (Ryhanen et al, 1998). Although nitinol is
considered a biocompatible material and very suitable for biomedical applications there is
concern of how the fibrotic encapsulation of the material during the healing process will affect
the outcome of the project. The group needs a material that will limit or completely resist fibrotic
encapsulation in order to allow gap junction formation between the mesenchymal stem cells and
the cardiomyocites. Nitinol has great potential due to its mechanical properties, corrosion
resistance and biocompatibility. Another great characteristic of nitinol is that it is radio opaque.
This brings the opportunity of tracking the device due to its imaging possibilities (Whittaker et
al, 2006).
Due to the material’s hardness and the abrasive nature of its surface, machining parts out
of nitinol causes a great amount of tool wear. This in turn makes processing nitinol more
expensive and more time consuming than other materials. A disadvantage of nitinol is that its
mechanical properties are decreased when welded onto itself or another metal. More detail on
specific mechanical properties of nitinol can be found on the table at the end of this section.
Dacron
The second material that is being evaluated is Dacron, also known as Polyethylene
terephthalate (PET). Dacron is tough, strong and is fairly easy to shape. It is also easy to join and
sterilize. This material is composed of tiny woven or knitted fibers that have very high tensile
strength (Sarkar et al, 2006) and is mainly used in the Biomedical Engineering industry as
vascular grafts.
Dacron is usually manufactured into a woven corrugated graft, this is needed in order to
prevent the material from kinking (Sarkar et al, 2006). This material design allows it to withstand
the pressures exhibited by high flow blood vessels like the aorta (Sarkar et al, 2006). Since this
material is used as a vascular graft it means that it is both biocompatible and hemocompatible.
Dacron is chemically stable and resistant degradation and to toxic or even inflammatory
byproducts that it might encounter in the blood. The individual fibers are susceptible to slow
hydrolytic degradation, but the structures that are formed when the fibers are bundled prevent
this process (Sarkar et al, 2006). Studies suggest that one disadvantage of Dacron is that it is
prone to infection (Kajiwara et al, 2004). It can be woven or knitted to produce a porous fabric
(InspiredMD Corporation, 2005), which might be advantageous for the team. Dacron, if
manufactured with velour construction is believed to facilitate tissue incorporation which may
work for the team’s advantage when designing for gap junction formations. More detail on the
material’s mechanical properties can be found on the table below.
EPTFE
The next material studied is ePTFE or expanded PTFE. Expanded PTFE was developed
in 1972. Preferred over Dacron for vascular applications (InspiredMD Corporation, 2005),
EPTFE is considered the most reliable synthetic material available for vascular grafts (Doble et
al, 2008). EPTFE was first introduced in the market as a vascular graft in 1975, early studies
done on the material led to the addition of reinforcing fibers for stability of the graft (Isaka et al,

75
2006). ePTFE grafts currently available in the market are resistant to compression and kinking
(InspiredMD Corporation, 2005).
A study that followed young patients (7-8 years old) showed that the mechanical
properties of the ePTFE grafts changed between 10 and 52 weeks after implantation. The study
revealed that the strength of the material was decreased by 50%, the material elongation changed
by 61% and its crystallinity changed by 3% (Doble et al, 2008). The ultimate tensile strength of
normal a normal ePTFE vascular graft was 14.57 MPa, after being implanted into the body for a
few years the ultimate tensile strength of the material decreased to 7.25 MPa (Doble et al, 2008).
The loss of mechanical strength of ePTFE was also demonstrated by Vanmaele et al., in this
experiment the results showed to be as drastic as the loss of mechanical strength a week after
implantation (Isaka et al, 2006). Some researchers attribute the loss of mechanical properties to
the deposition of lipids and proteins on the graft wall (Doble et al, 2008). In an experiment
carried out by Geiger, the structure of the ePTFE graft appeared to be inhomogeneous with
micropores, and compressed and ruptured fibrils. (Geiger,1991)
So far there are no reported failures due to degradation of the material (Giudiceandrea et
al, 1998), but this drastic change of ePTFE’s mechanical properties could lead to further
complications especially if implemented for long term implants.
One of the chemical characteristics of this graft is that it is hydrophobic. This quality of
the material protects the ePTFE graft against bacterial adhesion, resulting in the ability to ward
off more infections than other synthetic grafts like Dacron (Kajiwara et al,2004). Studies show
that as blood proteins accumulate in the wall of the graft, this hydrophobicity fades away (Doble
et al, 2008), and with this, the material’s ability to fight infections. This makes the ePTFE grafts
more susceptible to infections (Kajiwara et al, 2004). Other problems identified with these types
of grafts are serum leakage, thrombosis, inflammation mineralization and changes in the
physiochemical characteristics of the material (Doble et al, 2008).
The manufacturing process of ePTFE grafts can be used to control the physical
dimensions of the material (Isaka et al, 2006). When the graft is not woven or knitted, it can be
produced into sheets by an extrusion process. This extrusion process results in a porous
membrane in which the pores can be controlled and produced to a desired size (InspiredMD
Corporation, 2005) (Isaka et al, 2006). Expanded PTFE membranes have been previously
manufactured with pores as small as .05 microns (Sarkar et al, 2006). This material is
advantageous to the team because the pore sizes we are investigating range from 3 -.4 microns. It
might be possible to produce an ePTFE membrane with the required pore size for our design,
although the material’s decrease of mechanical strength and biocompatibility after implantation
are a concern.
Polyurethane
The last material investigated was Polyurethane. From the biomaterials that are available
in the market today, polyurethane is considered the most biocompatible and hemocompatible
materials. (Zdrahala et al, 1999). The most common brands available in the market for medical
purposes are PellethaneTM
, EstaneTM
, VialonTM
, TecoflexTM
, CorethaneTM
, BionateTM
, BiospanTM
and ChronoflexTM
. (Zdrahala et al, 1999) These materials dominate the field of cardiovascular
devices (Zdrahala et al, 1999)and are generally used in the biomedical engineering industry to
make catheters, general purpose tubing, blood bags, heart valves, pacemaker lead wire
insulation, wound dressings, total artificial hearts and small caliber vascular grafts. (Zdrahala et
al, 1999)(Boretos et al, 1967) (Alliance for the Polyurethanes Industry, 2001)

76
Polyurethane’s popularity comes from its great mechanical properties. By modifying
polyurethane, scientists were able to obtain a material that is durable, resistant to fatigue in
tensile, compression and shear stresses; a material that is elastic, compliant to surrounding tissue
and due to attachment of certain proteins even able to encourage healing. (Zdrahala et al, 1999)
Unlike ePTFE, tests performed on polyurethane’s tensile properties after implantation showed
that there was no significant reduction of the material’s ultimate tensile stress (Boretos et al,
1967). The table below shows more detail on the material’s mechanical properties.
When evaluating polyurethane’s biocompatibility, tests showed that the material is not
cytotoxic to cells. (Vinoy et al, 2008). This is very important for the purpose of our project
because our intension is develop a scaffold in which we can seed cells. Observations made on
polyurethane vascular grafts after 1 week implantation time showed no thrombus or emboli
formation. (Boretos et al, 1967) this makes the material appropriate for blood contacting
applications. MacKay et al showed in 1996 that how modifying polyurethane can give it
excellent blood compatibility. By adding proteins on the surface of the biomaterial, it is possible
to give it anticoagulant, infection controlling and tissue suppressant characteristics. Some of
these modifications also gave polyurethane enhanced wound healing characteristics. (Zdrahala et
al, 1999). A study conducted by Martinez-Martinez, demonstrated that polyurethane had the
lowest adhesion and colonization of bacteria when compared to Teflon and silicone latex.
(Zdrahala et al, 1999)
There are many processes that can be used to fabricate medical devices from
polyurethanes. Among those processes we can find extrusion, molding, casting electrostatic and
wet spinning of monofilaments, dip coatings and spraying of mandrels. The advantages of these
manufacturing processes are that they can fabricate membranes with micropores that feel and
behave like natural tissue. (Zdrahala et al, 1999)
ChronoFlex Technical Data Sheet
Properties ASTM Procedure Typical Values
Hardness (Shore Durometer) ASTM D-2240 80A 55D 75D
Appearance Visual Clear to slightly cloudy
Clear to slightly cloudy
Clear to slightly cloudy
Ultimate Tensile Strength (psi) ASTM D-638* 5500-6500 6000-7500 7000-8000
Ultimate Tensile Strain (%) ASTM D-638* 400-490 365-440 255-320
100% Secant Modulus (psi) ASTM D-638* 770-1250 1850-2200 5300-5700
300% Secant Modulus (psi) ASTM D-638* 700-1400 1700-2000 2700-3200
Flexural Strength (psi) ASTM D-790 350 550 10,000
Flexural Modulus (psi) ASTM D-790 5500 9300 300,000
Melt Index (g/10 min) 210°C; 2.17 Kg
ASTM D-1238 8 5 3
Vicat Softening Point (°F/°C) ASTM D-1525 160/70 180/80 ------
Water Absorption ASTM D-5170 1.2 1.0 0.8

77
Dielectric Strength (volts/Mil) ASTM D-149 360 520 420
Specific Gravity ASTM D-792 1.2 1.2 1.2
Coefficient of Friction (Kinetic) ASTM D- 1894 1.5 0.8 0.64
Abrasion Resistance (% loss at 1000 cycles)
ASTM D-1044 0.008 0.035 0.053
Melt Processing Temp. (0°F/0°C)
375-430 / 190-220
Recommended Sterilization Method
Gamma; E-Beam; ethylene oxide
Class VI Biocompatibility Test U.S.P. XXII Pass Pass Pass
* Specimens conditioned for 7 days at room temperature and 50% R.H.
Physical Properties
Shore Hardness 80A 55D 65D
Appearance Slightly cloudy Slightly cloudy Slightly cloudy
Modulus at 100% 775 1900 5500
Modulus at 300% 600 ---- ----
Tensile Strength (psi) 6600 7500 9000
Elongation (%) 475 325 250
Information from (http://www.advbiomaterials.com/chronoflex_c_factsheet.html)

78
Appendix D: hMSC Deflection Derivations
Bending Moment
The differential equation of the deflection curve of the bent beam is:
𝑀 = 𝐸𝐼𝑑2𝑦
𝑑𝑥2
From the diagram above, the bending moment is:
𝑀 =𝑤𝐿
2𝑥 −
𝑤
2𝑥2
Setting these two equations equal to each other:
𝐸𝐼𝑑2𝑦
𝑑𝑥2 = 𝑤𝐿
2𝑥 −
𝑤
2𝑥2
Integrate:
𝐸𝐼𝑑𝑦
𝑑𝑥=
𝑤𝐿
4𝑥2 −
𝑤
6𝑥3 + 𝐶1
Boundary condition 1:
𝑑𝑦
𝑑𝑥= 0 @ 𝑥 =
𝐿
2 (The slope of the deflection is horizontal at =
𝐿
2 )
Solve for C1:
0 =𝑤𝐿
2∗
𝐿2
8 −
𝑤
2∗
𝐿3
24 + 𝐶1
𝐶1 = −𝑤𝐿3
24
Plug in C1:
𝐸𝐼𝑑𝑦
𝑑𝑥=
𝑤𝐿
4𝑥2 −
𝑤
6𝑥3 −
𝑤𝐿3
24
Integrate:
𝐸𝐼𝑦 =𝑤𝐿
12𝑥3 −
𝑤
24𝑥4 −
𝑤𝐿3
24𝑥 + 𝐶2
Boundary Condition 2:
y = 0 @ x = 0
Solve for C2
0 = C2
L
wL
2 wL
2
E= Young’s Modulus
I = Moment of Inertia
w = Force on cell per unit
length
L = Length of cell

79
y
The maximum deflection occurs at:
𝑥 =𝐿
2
Therefore,
𝐸𝐼𝑦𝑚𝑎𝑥 =𝑤𝐿
12𝑥3 −
𝑤
24𝑥4 −
𝑤𝐿3
24𝑥
𝐸𝐼𝑦𝑚𝑎𝑥 = −5𝑤𝐿4
384
Without regard to the algebraic sign, the maximum deflection at 𝐿
2 is:
∆𝑚𝑎𝑥 =5𝑤𝐿4
384𝐸𝐼
CALCULATION FOR THE DEFLECTION OF a hMSC
r = 5μm
Calculation for force on a hMSC (“w”)
𝑤 =𝑃𝐴
𝐿
where A=cross-sectional area of a hMSC
𝐴 = 𝜋𝑟2
𝑤 = 𝑃𝐴𝜋𝑟2
𝐿
Calculation for a hMSC’s Moment of Inertia (“I”)
Since a hMSC has an elliptical shape, the moment of inertia for an ellipse will be used.
Moment of Inertia for a quarter ellipse:
𝐼 =𝜋𝑎𝑏3
16
Since a hMCS will have the shape of a full ellipse, the equation would be:
𝐼 =𝜋𝑎𝑏3
4
𝐼 =𝜋∗5∗13
4 𝜇𝑚4
𝐼 = 3.93 𝜇𝑚4
Maximum deflection of a hMSC
∆𝑚𝑎𝑥 =5𝑤𝐿4
384𝐸𝐼
E = 126±81 Pa
P = 5 mmHg = 266.6 Pa
b
a
x
Cross-Section of a hMSC:
r
5.0 μm
1.0 μm

80
Appendix E: hMSC Deflection MatLab Syntax
For L=3.0 micrometers %E=45Pa E=45*(1/((1*10^6)^2)); %N/micrometer^2 L=3; %micrometer a=5; %micrometer b=1; %micrometer w=(266.6*(1/((1*10^6)^2))*25*pi)/3; %N/micrometer
I=(pi*a*(b^3))/4 %I=3.927 micrometers^4
d=(5/384)*((w*(L^4))/(E*I)) %d = 41.6563 micrometers
%E=126Pa E=126*(1/((1*10^6)^2)); %N/micrometer^2 L=3; %micrometer a=5; %micrometer b=1; %micrometer w=(266.6*(1/((1*10^6)^2))*25*pi)/3; %N/micrometer
I=(pi*a*(b^3))/4; %I=3.927 micrometers^4
d=(5/384)*((w*(L^4))/(E*I)) %d = 14.88 micrometers
%E=207Pa E=207*(1/((1*10^6)^2)); %N/micrometer^2 L=3; %micrometer a=5; %micrometer b=1; %micrometer w=(266.6*(1/((1*10^6)^2))*25*pi)/3; %N/micrometer
I=(pi*a*(b^3))/4; %I=3.927 micrometers^4
d=(5/384)*((w*(L^4))/(E*I)) %d = 9.0557 micrometers

81
For L=2.5 micrometers %E=45Pa E=45*(1/((1*10^6)^2)); %N/micrometer^2 L=2.5; %micrometer a=5; %micrometer b=1; %micrometer w=(266.6*(1/((1*10^6)^2))*25*pi)/2.5; %N/micrometer
I=(pi*a*(b^3))/4 %I=3.927 micrometers^4
d=(5/384)*((w*(L^4))/(E*I)) %d = 24.11 micrometers
%E=126Pa E=126*(1/((1*10^6)^2)); %N/micrometer^2 L=2.5; %micrometer a=5; %micrometer b=1; %micrometer w=(266.6*(1/((1*10^6)^2))*25*pi)/2.5; %N/micrometer
I=(pi*a*(b^3))/4; %I=3.927 micrometers^4
d=(5/384)*((w*(L^4))/(E*I)) %d = 8.61 micrometers
%E=207Pa E=207*(1/((1*10^6)^2)); %N/micrometer^2 L=2.5; %micrometer a=5; %micrometer b=1; %micrometer w=(266.6*(1/((1*10^6)^2))*25*pi)/2.5; %N/micrometer
I=(pi*a*(b^3))/4; %I=3.927 micrometers^4
d=(5/384)*((w*(L^4))/(E*I)) %d = 5.24 micrometers
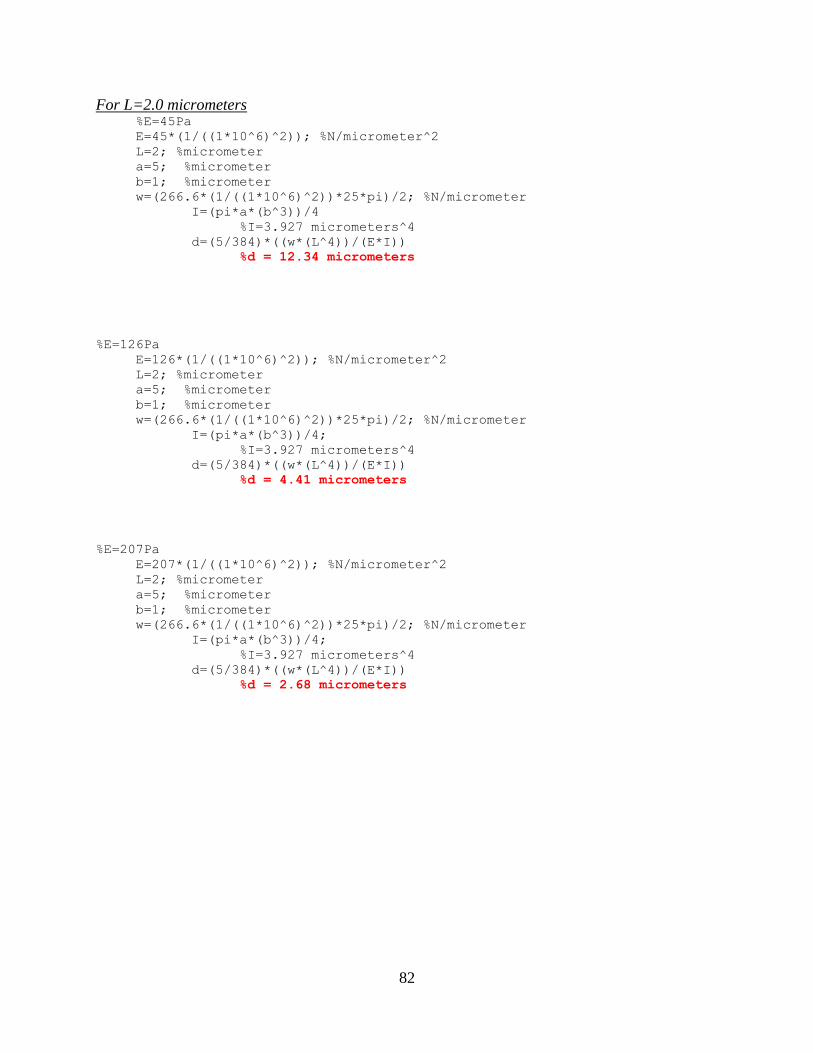
82
For L=2.0 micrometers %E=45Pa E=45*(1/((1*10^6)^2)); %N/micrometer^2 L=2; %micrometer a=5; %micrometer b=1; %micrometer w=(266.6*(1/((1*10^6)^2))*25*pi)/2; %N/micrometer
I=(pi*a*(b^3))/4 %I=3.927 micrometers^4
d=(5/384)*((w*(L^4))/(E*I)) %d = 12.34 micrometers
%E=126Pa E=126*(1/((1*10^6)^2)); %N/micrometer^2 L=2; %micrometer a=5; %micrometer b=1; %micrometer w=(266.6*(1/((1*10^6)^2))*25*pi)/2; %N/micrometer
I=(pi*a*(b^3))/4; %I=3.927 micrometers^4
d=(5/384)*((w*(L^4))/(E*I)) %d = 4.41 micrometers
%E=207Pa E=207*(1/((1*10^6)^2)); %N/micrometer^2 L=2; %micrometer a=5; %micrometer b=1; %micrometer w=(266.6*(1/((1*10^6)^2))*25*pi)/2; %N/micrometer
I=(pi*a*(b^3))/4; %I=3.927 micrometers^4
d=(5/384)*((w*(L^4))/(E*I)) %d = 2.68 micrometers

83
For L=1.5 micrometers %E=45Pa E=45*(1/((1*10^6)^2)); %N/micrometer^2 L=1.5; %micrometer a=5; %micrometer b=1; %micrometer w=(266.6*(1/((1*10^6)^2))*25*pi)/1.5; %N/micrometer
I=(pi*a*(b^3))/4 %I=3.927 micrometers^4
d=(5/384)*((w*(L^4))/(E*I)) %d = 5.21 micrometers
%E=126Pa E=126*(1/((1*10^6)^2)); %N/micrometer^2 L=1.5; %micrometer a=5; %micrometer b=1; %micrometer w=(266.6*(1/((1*10^6)^2))*25*pi)/1.5; %N/micrometer
I=(pi*a*(b^3))/4; %I=3.927 micrometers^4
d=(5/384)*((w*(L^4))/(E*I)) %d = 1.86 micrometers
%E=207Pa E=207*(1/((1*10^6)^2)); %N/micrometer^2 L=1.5; %micrometer a=5; %micrometer b=1; %micrometer w=(266.6*(1/((1*10^6)^2))*25*pi)/1.5; %N/micrometer
I=(pi*a*(b^3))/4; %I=3.927 micrometers^4
d=(5/384)*((w*(L^4))/(E*I)) %d = 1.13 micrometers

84
For L=1.0 micrometers %E=45Pa E=45*(1/((1*10^6)^2)); %N/micrometer^2 L=1; %micrometer a=5; %micrometer b=1; %micrometer w=(266.6*(1/((1*10^6)^2))*25*pi)/1; %N/micrometer
I=(pi*a*(b^3))/4 %I=3.927 micrometers^4
d=(5/384)*((w*(L^4))/(E*I)) %d = 1.54 micrometers
%E=126Pa E=126*(1/((1*10^6)^2)); %N/micrometer^2 L=1; %micrometer a=5; %micrometer b=1; %micrometer w=(266.6*(1/((1*10^6)^2))*25*pi)/1; %N/micrometer
I=(pi*a*(b^3))/4; %I=3.927 micrometers^4
d=(5/384)*((w*(L^4))/(E*I)) %d = 0.55 micrometers
%E=207Pa E=207*(1/((1*10^6)^2)); %N/micrometer^2 L=1; %micrometer a=5; %micrometer b=1; %micrometer w=(266.6*(1/((1*10^6)^2))*25*pi)/1; %N/micrometer
I=(pi*a*(b^3))/4; %I=3.927 micrometers^4
d=(5/384)*((w*(L^4))/(E*I)) %d = 0.33 micrometers

85
For L=0.4 micrometers %E=45Pa E=45*(1/((1*10^6)^2)); %N/micrometer^2 L=0.4; %micrometer a=5; %micrometer b=1; %micrometer w=(266.6*(1/((1*10^6)^2))*25*pi)/0.4; %N/micrometer
I=(pi*a*(b^3))/4 %I=3.927 micrometers^4
d=(5/384)*((w*(L^4))/(E*I)) %d = 0.0987 micrometers
%E=126Pa E=126*(1/((1*10^6)^2)); %N/micrometer^2 L=0.4; %micrometer a=5; %micrometer b=1; %micrometer w=(266.6*(1/((1*10^6)^2))*25*pi)/0.4; %N/micrometer
I=(pi*a*(b^3))/4; %I=3.927 micrometers^4
d=(5/384)*((w*(L^4))/(E*I)) %d = 0.0353 micrometers
%E=207Pa E=207*(1/((1*10^6)^2)); %N/micrometer^2 L=0.4; %micrometer a=5; %micrometer b=1; %micrometer w=(266.6*(1/((1*10^6)^2))*25*pi)/0.4; %N/micrometer
I=(pi*a*(b^3))/4; %I=3.927 micrometers^4
d=(5/384)*((w*(L^4))/(E*I)) %d = 0.0215 micrometers
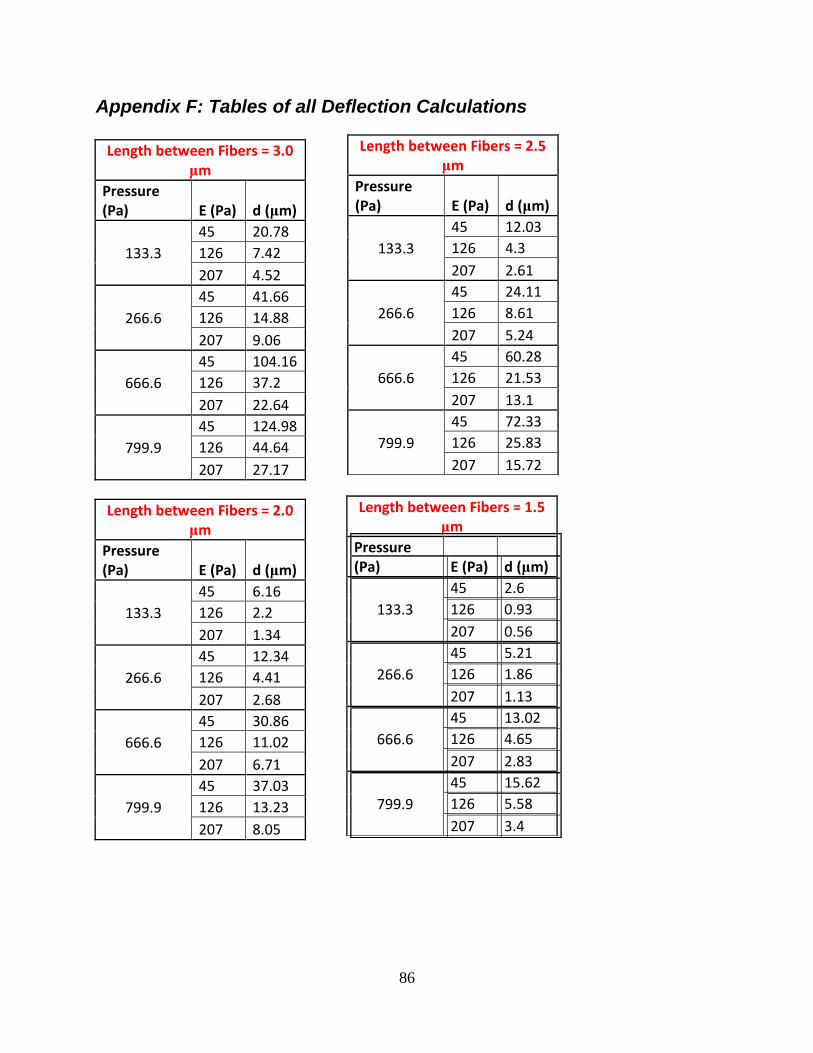
86
Appendix F: Tables of all Deflection Calculations
Length between Fibers = 3.0 μm
Pressure (Pa) E (Pa) d (μm)
133.3
45 20.78
126 7.42
207 4.52
266.6
45 41.66
126 14.88
207 9.06
666.6
45 104.16
126 37.2
207 22.64
799.9
45 124.98
126 44.64
207 27.17
Length between Fibers = 2.0 μm
Pressure (Pa) E (Pa) d (μm)
133.3
45 6.16
126 2.2
207 1.34
266.6
45 12.34
126 4.41
207 2.68
666.6
45 30.86
126 11.02
207 6.71
799.9
45 37.03
126 13.23
207 8.05
Length between Fibers = 2.5 μm
Pressure (Pa) E (Pa) d (μm)
133.3
45 12.03
126 4.3
207 2.61
266.6
45 24.11
126 8.61
207 5.24
666.6
45 60.28
126 21.53
207 13.1
799.9
45 72.33
126 25.83
207 15.72
Length between Fibers = 1.5 μm
Pressure (Pa) E (Pa) d (μm)
133.3
45 2.6
126 0.93
207 0.56
266.6
45 5.21
126 1.86
207 1.13
666.6
45 13.02
126 4.65
207 2.83
799.9
45 15.62
126 5.58
207 3.4

87
Length between Fibers = 1.0 μm
Pressure (Pa) E (Pa) d (μm)
133.3
45 0.77
126 0.27
207 0.17
266.6
45 1.54
126 0.55
207 0.33
666.6
45 3.86
126 1.38
207 0.84
799.9
45 4.63
126 1.65
207 1.01
Length between Fibers = 0.4 μm
Pressure (Pa) E (Pa) d (μm)
133.3
45 0.0493
126 0.0176
207 0.0107
266.6
45 0.0987
126 0.0353
207 0.0215
666.6
45 0.2469
126 0.0882
207 0.0537
799.9
45 0.2963
126 0.1058
207 0.0644

88
Bibliography
AdvanSource Biomaterials. (2008). ChronoFlex® C: Biodurable medical grade polyurethane.
Retrieved 6 Mar., 2009, from http://www.advbiomaterials.com/chronoflex_c_factsheet.html
Alliance for the Polyurethanes Industry. (2001). The use of polyurethanes in medical device
applications. Technical Report,
American Heart Association, I. (2008). Atrial fibriliation. Retrieved October 16, 2008, from
http://www.americanheart.org/presenter.jhtml?identifier=4451
Boretos, Tohn W., and William S. Pierce. (1967). Segmented polyurethane: A new elastomer for
biomedical applications Sience, New Serices, 158, 1481-1482.
Bronzino, J. D. (2006). The biomedical engineering handbook, third edition
Center for disease control website. http://www.cdc.gov/heartdisease/
Doble, Mukesh, Nilesh Makadia, Sreejs Pavithran, and R Suresh Kumar. (2008). Analysis of
explanted ePTFE cardiovascular grafts (modified BT shunt). Biomadical Materials, 3, 9.
Elhendy, Abdou , MD, PhD, FACC, FAHA, Stein, Kenneth M. , M.D., FACC & Mittal, Suneet ,
M.D., FACC. (2008). Pacemaker. Retrieved September 10, 2008
http://yourtotalhealth.ivillage.com/pacemaker.html?pageNum=12
Forte, G., Minieri, M., Cossa, P., Antenucci, D., Sala, M., Gnocchi, V., et al. (2005). Hepatocyte
growth factor effects on mesenchymal stem cells: Proliferation, migration, and
differentiation. Stem Cells Express, 24, 23-23-33.

89
Fox, S. I. (2008). Human physiology (10th ed.). New York: McGraw-Hill.
Geddes, L. A., & Tacker, J., W.A. (1980). Electrical defibrillation CRC Press, Inc.
Geiger G. (1991). Deterioration of PTFE-prosthesis wall. ASEM study. Journal of
Cardiovascular Surgery, 32, 660-663.
Ghista, D. N., Mirsky, I., & Sandler, H. (1974). Cardiac mechanics: Physiological, clinical, and
mathematical considerations John Wiley & Sons, Inc.
Ghista, D. N., & Yin-Kwee Ng, E. (2007). Cardiac perfusion and pumping engineering World
Scientific Publishing Co. Pte. Ltd.
Giudiceandrea A, Seifalian AM, Krijgsman B, Hamilton G. (1998). Effect of prolonged pulsatile
shear stress in vitro on endothelial cell seeded PTFE and compliant polyurethane vascular
grafts. Eur J Vasc Endovasc Surg, 15, 147-154.
Grossman, W., Jones, D., & McLaurin, L. P. (1975). Wall stress and patterns of hypertrophy in
the human left ventricle. The Journal of Clinical Investigation, 56, 56-64.
Heineman, F. W., & Grayson, J. (1985). Transmural distribution of intramyocardial pressure
measured by micropipette technique. American Journal of Physiology of Heart and
Circulatory Physiology, 249(6), 1216-1223.
Homan Van Der Heide, J.N., M.D., Nieveen, J., M.D., Thalen, H. J. T., M.D., & Van Den Berg,
JW., D.S.C. (1970). The artificial cardiac pacemaker Royal VanGorcum Ltd.
Ilana Cohen. (2005). Biomaterials in cardiology. InspiredMD Corporation,

90
Isaka, Mitsuhiro, Toshiya Nishibe, Yasuhiro Okuda, Masaru Saito, Takahiro Seno, Kazuto
Yamashita, Yasuharu Izumisawa, Tadao Kotani, and Keishu Yasuda. (2006). Experimental
study on stability of a high-porosity expanded polytetrafluoroethylene graft in dogs. Annals
of Thoracic Cardiovascular Surgery, 12, 37-41.
Jia, Wenji, Mark W. Beatty, Richard A. Reinhardt, Thomas M. Petro, Donald M. Cohen,
Constance R. Maze, E. A. Strom, and Melvin Hoffman. (1999). Nickel release from
orthodontic arch wires and cellular immune response to various nickel concentrations.
Journal of Applied Biomaterials, 48, 488-495.
KacKay, T. G., Wheatley, D. J., Bernacca, G. M., Fisher, A. C. and Hindle, C. S. (1996). New
polyurethane heart valve prosthesis: Design, manufacture and evalauation. Biomaterials, 17,
1857.
Kajiwara, Hirokazu, Toshiyuki Hamada, Yukio Ichikawa, Masanori Ishi, and Ichiya Yamazaki.
(2004). Experience with expanded polytetrafluoroethylene (ePTFE gore-tex) surgical
membrane for coronary artery grafting: Does ePTFE surgical membrane predispose to
postoperative mediastinitis? Artificial Organs, 28, 840-845.
Katz, A. M., M.D. (1977). Physiology of the heart Raven Press Books, Ltd.
Klabunde, Richard E. , Ph.D. (2008). Cardiovascular physiology concepts. Retrieved September
14, 2008 http://www.cvphysiology.com/Arrhythmias/A004.htm
Levy, M. N., & Pappano, A. (2007). Cardiovascular physiology Mosby, Inc.

91
M Radisic, H Park, H Shing, T Consi, FJ Schoen, R. (2004). Functional assembly of engineered
myocardium by electrical stimulation of cardiac myocytes cultured on scaffolds.
Proceedings of the National Academy of Sciences of the United States of America, 101(52),
18129-18134.
Ma, Peter X., and Jennifer Elisseeff. (2005). Scaffolding in tissue engineering. New York: C R C
P LLC.
Mackay, T. G., Wheatley, D. J., Bernacca, G. M., Fisher, A. C., & Hindle, C. S. (1996). New
polyurethane heart valve prosthesis: Design, manufacture and evaluation. Biomaterials,
17(19), 1857-1863. doi:DOI: 10.1016/0142-9612(95)00242-1
Martinez-Martinez L., Pascual A. and Perez, E. J. (1990). Effect of three plastic catheters on
survival and growth of pseudomonas aeruginosa J. Hospital Infec, 16, 311.
Myers, G. H., & Parsonnet, V. (1969). Engineering in the heart and blood vessels John Wiley &
Sons, Inc.
Pedicini, A., & Farris, R. J. (2003). Mechanical behavior of electrospun polyurethane. Polymer,
44, 6857-6862.
Pelton, A. R., D. Stockel, and T. W. Duerig. (2000). Medical uses of nitinol. Materials Science
Forums, 327, 63-70.
Peter X, M., & Elisseeff, J. (2005). Scaffolding in tissue engineering

92
Potapova, I., Plotnikov, A., Lu, Z., Danilo, P.,Jr, Valiunas, V., Qu, J., et al. (2004). Human
mesenchymal stem cells as a gene delivery system to create cardiac pacemakers. Circulation
Research, 94(7), 952-959. doi:10.1161/01.RES.0000123827.60210.72
Ritter, E., MD, Perry, A., MD, Yu, Jack, MD, DDS., Wang, Thomas, MD, PhD, Tang, L., MD,
& Bieberich, E., PhD. (2008). Breast cancer cell-derived fibroblast growth factor 2 and
vascular endothelial growth factor are chemoattractants for bone marrow stromal stem cells.
Annals of Surgery, 247(2), 310.
Rosen, M., R., Brink, P., R., Cohen, I., S., & Robinson, R., B. (2007). Biological
Pacemakers based on I f. Medical and Biological Engineering and Computing, 24(2), 157-
166.
Rosen, M. R., Brink, P. R., Cohen, I. S., & Robinson, R. B. (2004). Genes, stem cells and
biological pacemakers. Cardiovascular Research, 64(1), 12-23.
doi:10.1016/j.cardiores.2004.05.012
Ryhanen, J., M. Kallioinen, J. Tuukkanen, J. Junila, E. Niemela, P. Sandvik, and W. Serlo.
(1998). In vivo biocompatibility evaluation of nickel-titanium shape memory metal alloy:
Muscle and perineural tissue responses and encapsule membrane thickness. Journal of
Biomedical Materials Research, 41, 481-488.
Sarkar, S., Salacinski, H. J., Hamilton, G., & Seifalian, A. M. (2006). The mechanical properties
of infrainguinal vascular bypass grafts: Their role in influencing patency. European Journal
of Vascular and Endovascular Surgery, 31(6), 627-636. doi:DOI:
10.1016/j.ejvs.2006.01.006

93
Sherwood, L. (2003). Human physiology: From cells to systems Brooks Cole.
Sherwood, L. (2004). Human physiology: From cells to systems (Fifth ed.) Brookscole.
Tan, S., Pan, W., Ma, G., Cai, N., Leong, K., & Liao, K. (2008). Viscoelastic behaviour of
human mesenchymal stem cells. BME Cell Biology, 9, 1-7.
Tastan, I., Schreckenberg, R., Mufti, S., Abdallah, Y., Piper, H. M., & Schluter, K. (2009).
Parathyroid hormone improves contractile performance of adult rat ventricular
cardiomyocytes at low concentrations in a non-acute way. Cardiovascular Research, , 1-24.
Trepanier, C., R. Venugopalan, and A. Pelton. (2000). Corrosion resistance and biocompatibility
of passivated nitinol. Shape Memory Implants, , 35-45.
Vinoy, Thomas, and Muthu Jayabalan. (2008). A new generation of high flex life polyurethane
urea for polymer heart valve - studies on in vivo biocompatibility and biodurability. Journal
of Biomedical Materials Research, 89A, 192-205.
Whittaker, David R., and Mark F. Fillinger. (2006). The engineering of endovascular stent
technology: A review. Vascular and Endovascular Surgery, 40, 85.
Xiang, Z., Liao, R., Kelly, M. S., Spector, M., Xiang, Z., Liao, R., et al. (2006).
Collagena(euro)"GAG scaffolds grafted onto myocardial infarcts in a rat model: A delivery
vehicle for mesenchymal stem cells. Tissue Engineering; Tissue Engineering, 12(9), 2467-
2478.