cardiorespiratory fitness as a predictor of intestinal ......research open access cardiorespiratory...
TRANSCRIPT

RESEARCH Open Access
Cardiorespiratory fitness as a predictor ofintestinal microbial diversity and distinctmetagenomic functionsMehrbod Estaki1, Jason Pither1, Peter Baumeister2, Jonathan P. Little2, Sandeep K. Gill1, Sanjoy Ghosh1,Zahra Ahmadi-Vand1, Katelyn R. Marsden2 and Deanna L. Gibson1*
Abstract
Background: Reduced microbial diversity in human intestines has been implicated in various conditions such asdiabetes, colorectal cancer, and inflammatory bowel disease. The role of physical fitness in the context of humanintestinal microbiota is currently not known. We used high-throughput sequencing to analyze fecal microbiota of39 healthy participants with similar age, BMI, and diets but with varying cardiorespiratory fitness levels. Fecal short-chain fatty acids were analyzed using gas chromatography.
Results: We showed that peak oxygen uptake (VO2peak), the gold standard measure of cardiorespiratory fitness,can account for more than 20 % of the variation in taxonomic richness, after accounting for all other factors,including diet. While VO2peak did not explain variation in beta diversity, it did play a significant role in explainingvariation in the microbiomes’ predicted metagenomic functions, aligning positively with genes related to bacterialchemotaxis, motility, and fatty acid biosynthesis. These predicted functions were supported by measured increasesin production of fecal butyrate, a short-chain fatty acid associated with improved gut health, amongst physically fitparticipants. We also identified increased abundances of key butyrate-producing taxa (Clostridiales, Roseburia,Lachnospiraceae, and Erysipelotrichaceae) amongst these individuals, which likely contributed to the observedincreases in butyrate levels.
Conclusions: Results from this study show that cardiorespiratory fitness is correlated with increased microbialdiversity in healthy humans and that the associated changes are anchored around a set of functional cores ratherthan specific taxa. The microbial profiles of fit individuals favor the production of butyrate. As increased microbiotadiversity and butyrate production is associated with overall host health, our findings warrant the use of exerciseprescription as an adjuvant therapy in combating dysbiosis-associated diseases.
Keywords: Intestinal microbiota, Microbial ecology, Physical activity, Exercise, Butyrate, Community diversity,Metagenome, Dysbiosis
BackgroundThe interactions between humans, their environment,and intestinal microbiota form a tripartite relationshipthat is fundamental to the physiological homeostasis andoverall health of the host [1]. The human intestinalmicrobiota aids their host in several important biologicalfunctions such as digestion, absorption, stimulating
immune responses, and protection against enteropatho-gens. The bacteria break down partially digestedcomplex carbohydrates via fermentation and produceshort-chain fatty acids (SCFAs) such as butyrate, acetate,and propionate as by-products. These SCFAs act as theprimary food source of the colonocytes which consumeup to 10 % of the dietary energy expenditure in humans.In particular, butyrate has been shown to play a criticalrole in overall gut homeostasis and health [2]. Lastingdisturbances in the microbial community composition,termed dysbiosis, can have deleterious health effects in
* Correspondence: [email protected] of Biology, The Irving K. Barber School of Arts and Sciences,University of British Columbia, Room ASC 386, 3187 University Way,Okanagan campus, Kelowna, British Columbia V1V 1V7, CanadaFull list of author information is available at the end of the article
© 2016 The Author(s). Open Access This article is distributed under the terms of the Creative Commons Attribution 4.0International License (http://creativecommons.org/licenses/by/4.0/), which permits unrestricted use, distribution, andreproduction in any medium, provided you give appropriate credit to the original author(s) and the source, provide a link tothe Creative Commons license, and indicate if changes were made. The Creative Commons Public Domain Dedication waiver(http://creativecommons.org/publicdomain/zero/1.0/) applies to the data made available in this article, unless otherwise stated.
Estaki et al. Microbiome (2016) 4:42 DOI 10.1186/s40168-016-0189-7
the host (reviewed in [3]). Gut microbiome diversity hasemerged as a candidate indicator of overall host health.Low community richness has been correlated with meta-bolic markers such as adiposity, insulin resistance, andoverall inflammatory phenotypes [4], as well as gastro-intestinal (GI) conditions such as inflammatory bowel dis-ease [5], Clostridium difficile infection [6], colorectalcancer [7], and irritable bowel syndrome [8]. As a result,considerable research in recent years has focused on un-derstanding and developing strategies to promote overallGI health via community manipulation in attempt to re-solve dysbiosis-associated diseases.Various extrinsic variables such as stress, probiotic and
antibiotic use, alcohol consumption, and diet have beenidentified as factors that can instigate changes in themicrobiome [1, 9]. The link between physical activity andgut microbiota however is currently not well understood.Matsumoto et al. (2008) first identified increases in butyr-ate levels in cecum of physically active rats which theysuggested was a result of compositional changes inbutyrate-producing bacteria [10]. Evans et al. explored theeffects of voluntary wheel running in mice fed with low-or high-fat diets and found that microbial communitiesclustered based on both diet and physical activity [11].Allen et al. further showed that the mode of physical activ-ity, for example, forced treadmill running versus volunteerwheel running, differently altered the microbiota [12]. Re-cently, Clarke et al. also found clustering of bacterial com-munities between professional rugby players and high/lowbody mass index (BMI) controls [13]. They further identi-fied increases in bacterial community richness in theseelite athletes compared to both control groups. In theirstudy, however, extreme dietary differences, especiallyhigh protein intakes amongst the athletes, confounded in-terpretations regarding the specific role of physical activityand microbial changes.To better isolate how physical fitness may moderate mi-
crobial diversity, we analyzed the fecal microbiota of indi-viduals with varied fitness levels with comparable diets.We used peak oxygen uptake (VO2peak), the gold stand-ard of cardiorespiratory fitness (CRF), as an indicator ofphysical fitness. We asked the questions (a) does taxo-nomical richness vary with CRF alone, (b) do abundancesof particular taxa vary systematically in relation to vari-ation in CRF, and (c) is this variation associated with func-tional pathways of the microbiome. We show thatVO2peak, independent of diet, correlates with increasedmicrobial diversity and production of fecal butyrateamongst physically fit participants.
MethodsStudy designHealthy young adults between 18 and 35 years old wererecruited. Exclusion criteria included antibiotic treatment
within the previous 6 months, current prescribed pharma-ceutical drug utilization, or active acute or chronic dis-eases. All participants were verbally interviewed on theirdietary habits and CRF was determined using a VO2peakcycle test. Participants were then provided a stool collec-tion kit with instructions and were asked to provide asample within a week following their lab visit.
Nutritional data collectionOn the day of VO2peak testing, nutritional data, includ-ing supplements, was collected by means of a 24-hdietary recall interview and assessed by a research nutri-tionist using FoodWorks nutrient analysis software(version 16.0). Food items described by participants thatwere not available in the software were manually addedas needed. A sample copy of a completed questionnaireis available in Additional file 1. On average, over 100food categories per participant were produced by theFoodWorks software. A manual screening was appliedto select categories of interest based on a priori interestand existing literature showing a significant interactionbetween those categories and intestinal microbiota. Theselected 24 food category data are available in theuploaded metadata mapping file.
Cardiorespiratory fitness testingParticipants initially completed a physical activity readi-ness questionnaire (PAR-Q) to rule out any contraindi-cations to vigorous exercise. A continuous incrementalramp maximal exercise test on an electronically brakedcycle ergometer (Lode Excalibur, the Netherlands) wasused to determine VO2peak and peak power output(Wpeak). Expired gas was collected continuously by ametabolic cart (Parvomedics TrueOne 2400, Salt LakeCity, Utah, USA) calibrated with gases of known concen-tration. The test started at 50 W and increased by30 W/min. The test was terminated upon volitional ex-haustion or when revolutions per minute fell below 50.VO2peak was defined as the highest 30-s average forVO2 (in ml/kg/min). Criteria for achieving VO2peakwere the following: (i) respiratory exchange ratio >1.15;(ii) plateau in VO2; (iii) reaching age-predicted HRpeak(220-age); and/or (iv) volitional exhaustion. FollowingVO2peak assessment, participants were categorized toeither low (LOW), average (AVG), or high (HI) fitnessbased on their sex and age according to a modified Hey-ward normal VO2max reference chart (Additional file 2).
Stool collection and storageParticipants were provided with a home stool collectionkit including a sterile 120 ml polypropylene container(Starplex, Etobicoke, Ontario), sterile tongue depressorand gloves, and an ice box. Participants were instructedto avoid alcohol for 3 days prior to stool collection. Stool
Estaki et al. Microbiome (2016) 4:42 Page 2 of 13
samples were immediately stored in the participant’sfreezer overnight and transported on ice to the laband stored in −80 °C until further analysis. Frozenportions from the inner area of the samples werescrapped using sterile razor blades for DNA extrac-tion and SCFA analysis.
SCFA analysisSCFAs (acetic, propionic, heptanoic, valeric, caproic, andbutyric acid) were analyzed from the feces by gas chro-matography (GC) as described previously [14]. In brief,~50 mg of stool was homogenized with isopropyl alco-hol, containing 2-ethylbutyric acid at 0.01 % v/v as in-ternal standard, at 30 Hz for 13 min using metal beads.Homogenates were centrifuged twice, and the clearedsupernatant was injected to Trace 1300 Gas Chromato-graph, equipped with Flame-ionization detector, withAI1310 auto sampler (Thermo Fisher Scientific) insplitless mode. Data was processed using Chromeleon7 software. An aliquot of 50 mg of stool was freezedried to measure the dry weight, and measurementsare expressed as mass % (g of SCFA per g of dryweight stool).
High-throughput sequencingDNA was extracted from feces using QIAmp DNA StoolMini Kit (Qiagen) according to the manufacturer’sinstructions following 3 × 30 s of homogenization usingmetal beads on a Retsch MixerMill MM 400 homogenizer.Sequencing libraries were prepared according to the Illu-mina MiSeq system instructions. In brief, the V3 and V4region of the 16S bacterial rRNA gene was amplified usingrecommended primers [15] (IDT, Vancouver, Canada):Forward 5′ TCGTCGGCAGCGTCAGATGTGTATAAGAGACAGCCTACGGGNGGCWGCAG, and Reverse 5′GTCTCGTGGGCTCGGAGATGTGTATAAGAGACAG-GACTACHVGGGTATCTAATCC, which create ampli-cons of ~460 bp. Amplicons were cleaned using AMPureXP bead step, and then, adapters and dual-index barcodes(Nextera XT) were attached to the amplicons to facilitatemultiplex sequencing. After another clean-up step, librar-ies were validated on an agarose gel, quantified, normal-ized, and sent to The Applied Genomic Core (TAGC)facility at the University of Alberta (Edmonton, Canada)for sequencing using the Illumina MiSeq platform. Theresulting ~16,000,000 paired-end reads were merged usingPEAR software [16] and screened to exclude sequencescontaining one or more base calls with a Phred score <20.The average read per sample was ~350,000 with a min/max of ~165,000/452,000 reads. Rarefaction curves dem-onstrated that sufficient sampling depth had been reachedamongst all samples (Additional file 3).
BioinformaticsBioinformatics analyses on the demultiplexed pairedreads were conducted using QIIME 1.8.0 software suites[17]. Reads were clustered at 97 % identity using theuclust method into operational taxonomic units (OTUs)then aligned to the most recent available version (2013/08) of Greengenes bacterial database [18]. Singleton anddoubletons were removed, and the produced OTU tablewas normalized using phylogenetic investigation of com-munities by reconstruction of unobserved states(PICRUSt) [19] to adjust for different 16S rRNA genecopy numbers. Instead of rarefying our OTU table to thelowest sample depth [20], uneven variance as a result ofdifferential sample sequencing depth was stabilized usingthe cumulative sum scaling (CSS) method [21] of “meta-genomeSeq” package in R. Alpha diversity indexes, rar-efaction curves, OTU tables, and distance metrics werealso generated using QIIME.
Statistical analysisAll statistical analyses were performed using R [22] ver-sion 3.2.0 unless stated otherwise.The groups’ age and VO2peak data were tested for
normality using Shapiro-Wilk test, and a one-wayanalysis of variance (ANOVA) with Tukey’s multiple-comparison test was used to compare mean differencesamongst groups. Kruskal-Wallis non-parametric test wasused for comparing BMI as this dataset failed normalitytests even after several transformation attempts. Forcomparison of dietary intake amongst groups, a permu-tational multivariate ANOVA (PERMANOVA) with 999random permutations was used. Due to the inherenthigh variability of dietary data, we further searched fordietary patterns amongst groups by looking at a princi-pal component analysis (PCA) plot of participants’ diet-ary scores using the ggbiplot package [23]. To facilitatecomparisons with previous work, we first comparedaverage alpha diversity amongst the three fitness cat-egories using a one-way ANOVA, followed by a Tukey’smultiple comparison. To simultaneously evaluate therole of CRF alongside other potential predictors of alphadiversity (sex, age, BMI, and dietary components), weperformed a multiple regression analysis. Given ourcomparatively low sample size (n = 39), and the generalrule that multiple regressions should include at least 10observations per predictor variable [24], we firstscreened potential predictors using a Spearman correl-ation matrix. Those that showed a significant correlationwith alpha diversity were retained for entry in the mul-tiple regression model. Multicolinearity was checkedusing the variable inflation factor (VIF) index with amaximum cutoff score of 10.Microbial communities in fecal samples were ordinated
using the Bray-Curtis and weighted and unweighted
Estaki et al. Microbiome (2016) 4:42 Page 3 of 13
UniFrac distance metrics. Principal coordinate analysis(PCoA) based on the Bray-Curtis dissimilarity metric wasconducted using the cmdscale function in the base “stats”package in R, while PCoA based on the weighted and un-weighted unifrac distances was made using EMPeror tool[25]. Microbial communities were analyzed using twocomplementary multivariate approaches: (1) constrainedordination and (2) generalized linear models (GLM). Forthe constrained ordination approach, redundancy analysis(RDA) was used, which focuses on assemblage compos-ition differences in relation to predictors of interest(VO2peak, sex, age, BMI, and dietary components). Thiswas implemented using the “vegan” package [26] version2.2-1 in R. Abundance data at each taxonomical resolution(phyla, class, order, family, and genus) were firstHellinger-transformed [27] to accommodate counts datawith large occurrences of low and zero abundance. Vari-able selection in RDA was implemented using the ordistepfunction of vegan using both forward and backward step-wise inclusion. Predictors selected by this method at eachclassification level are presented in Additional file 4. Toidentify genera that significantly contributed to total vari-ance, we evaluated Spearman correlations between genusabundance and the first two RDA axes. OTUs with a sig-nificant correlation coefficient (evaluated at Bonferroniadjusted alpha level) were displayed on the RDA plotswith type II scaling. To evaluate the association of genusabundance with explanatory variables, we implementedmultiple negative binomial GLMs using the “mvabund”package [28]. This multiple GLM method utilizes a seriesof univariate F tests of the effects of predictor variables onthe abundance of each taxon. Regression assumptionswere assessed using residual diagnostics. Taxa that madeup less than 0.1 % of the total count and occurring in lessthan 75 % of samples were first removed (cf. [29]). Fiftytaxa met the inclusion criteria and were included in themodel. The default implementation of the multi-GLMmethod adjusts P values to account for multiple tests.Classification of relative abundance data according to thepreviously described enterotypes [30] was carried outusing the Calinski-Harabasz (CH) index as described on-line (http://enterotype.embl.de/enterotypes.html).Bacterial phylogeny is sufficiently linked to their func-
tional capabilities and can be used to computationallypredict the functional composition of the communitymetagenome [19]. The normalized genus abundanceOTU table was used to predict the microbiome’s meta-genomic functions using PICRUSt’s extended ancestral-state reconstruction approach. A new abundance matrixof predicted functional categories based on the KyotoEncyclopedia of Genes and Genomes (KEGG) databasewas created. We constructed a biplot from the output ofa PCA of functional category data and visually assessedclustering patterns based on CRF groupings. Next, to
isolate the influence of specific predictor variables, anRDA was also performed using these functional categor-ies as response variables and the same variables and se-lection methods described above.Similarly, to determine the role of our exploratory var-
iables in explaining variance in fecal SCFAs, an RDAwas conducted using SCFA abundance data as the re-sponse variables (cf. [31]).
ResultsDiet was not a confounding factor across fitness groupsTwenty-two males and 19 females participated in thestudy. Two female participants were removed from se-quencing analysis due to technical errors. Table 1 repre-sents a summary of the 39 participants’ characteristicsand dietary intake. Only one participant followed a vege-tarian diet, and all 39 participants reported consumingdairy products (data not shown). Age distribution wassimilar across all groups. The LOW group had a margin-ally higher BMI (25.5, SD 3.9) compared to the AVG(23.5, SD .5) and HI (22.8, SD 1.5) groups; however, thedifference was not statistically significant. BMI of AVGand HI groups falls within the “normal weight” range(18.5–24.9) as defined by Health Canada, while the LOWgroup is marginally above the “overweight” threshold of25. The results of the PERMANOVA (Additional file 5)showed no main differences (permutation P = 0.56) acrossany nutritional classes based on fitness groups. PCAplot (Fig. 1) of dietary patterns amongst the differentfitness groups also showed no discrete clusters, fur-ther supporting a lack of distinct dietary patternsamongst fitness groups.
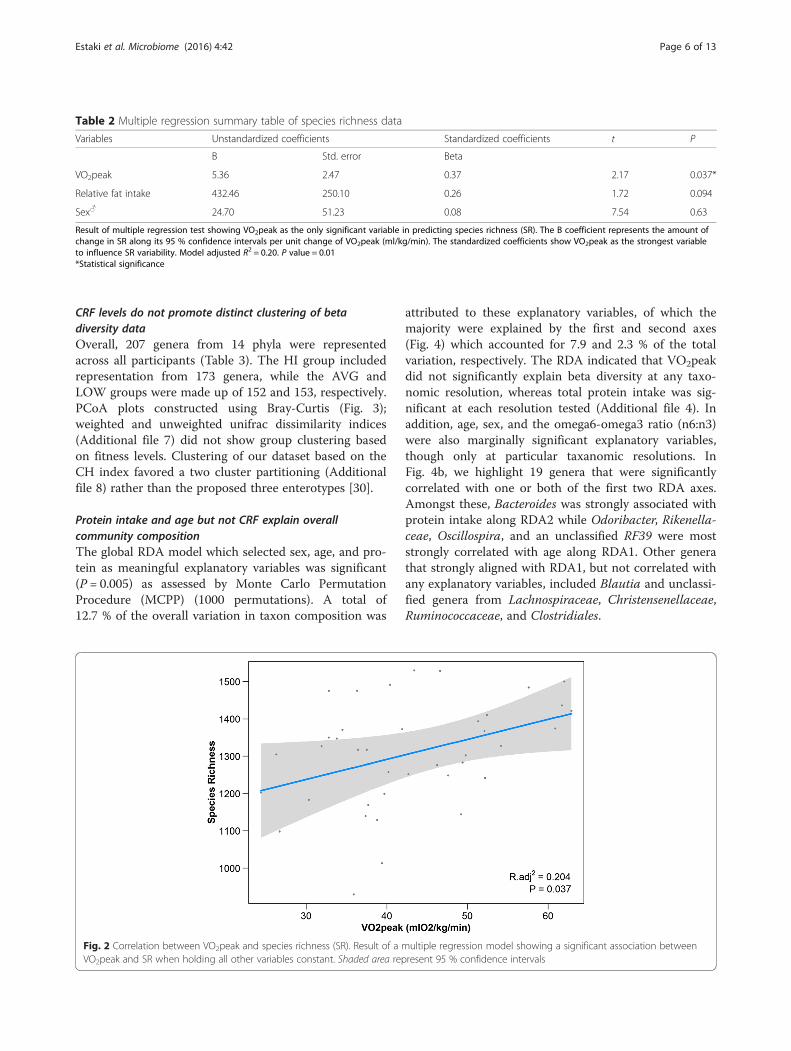
CRF is correlated with increased microbial diversitySpecies diversity of each participant (alpha diversity) wasdetermined using several indexes: species richness (SR),chao1, Shannon, Simpson, and Faith’s phylogenetic di-versity (PD). As all the alpha diversity indexes werehighly correlated (Additional file 6), SR was chosen as aproxy in the regression model. After screening of poten-tial predictors via Spearman correlation analysis, threevariables were included in the multiple regression model:VO2peak, sex, and relative fat intake. Of these, onlyVO2peak was a significant predictor of alpha diversity(Table 2), with SR significantly (P = 0.011) associatedwith increasing VO2peak (Radj
2 = 0.204, coefficient esti-mate = 5.36, t = 2.17) (Fig. 2). Replacing SR with chao1,Shannon, and Simpson index in the regression modelproduced identical results in that VO2peak was the onlysignificant predictor of these indices. Faith’s PD indexshowed a similar relationship with VO2peak (Pearson’sR = 0.30, P = 0.062); however, it did not reach statisticalsignificance within the regression model (Radj
2 = 0.07,coefficient estimate = 0.14, t = 1.12).
Estaki et al. Microbiome (2016) 4:42 Page 4 of 13
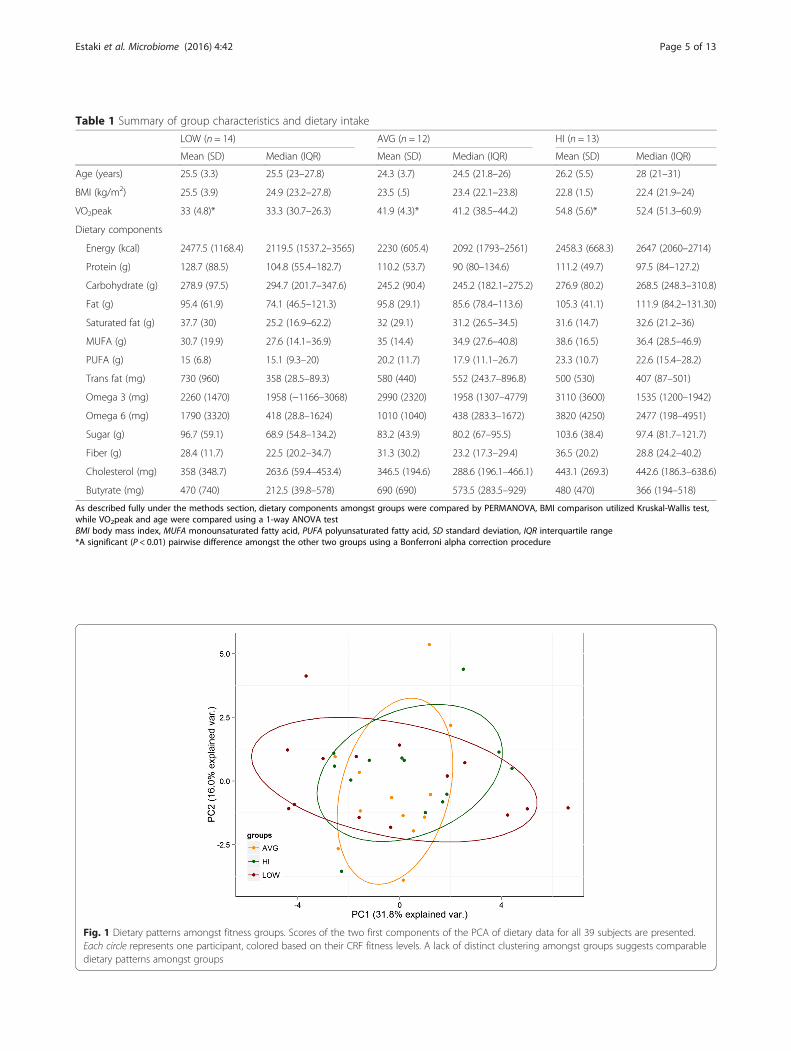
Table 1 Summary of group characteristics and dietary intake
LOW (n = 14) AVG (n = 12) HI (n = 13)
Mean (SD) Median (IQR) Mean (SD) Median (IQR) Mean (SD) Median (IQR)
Age (years) 25.5 (3.3) 25.5 (23–27.8) 24.3 (3.7) 24.5 (21.8–26) 26.2 (5.5) 28 (21–31)
BMI (kg/m2) 25.5 (3.9) 24.9 (23.2–27.8) 23.5 (.5) 23.4 (22.1–23.8) 22.8 (1.5) 22.4 (21.9–24)
VO2peak 33 (4.8)* 33.3 (30.7–26.3) 41.9 (4.3)* 41.2 (38.5–44.2) 54.8 (5.6)* 52.4 (51.3–60.9)
Dietary components
Energy (kcal) 2477.5 (1168.4) 2119.5 (1537.2–3565) 2230 (605.4) 2092 (1793–2561) 2458.3 (668.3) 2647 (2060–2714)
Protein (g) 128.7 (88.5) 104.8 (55.4–182.7) 110.2 (53.7) 90 (80–134.6) 111.2 (49.7) 97.5 (84–127.2)
Carbohydrate (g) 278.9 (97.5) 294.7 (201.7–347.6) 245.2 (90.4) 245.2 (182.1–275.2) 276.9 (80.2) 268.5 (248.3–310.8)
Fat (g) 95.4 (61.9) 74.1 (46.5–121.3) 95.8 (29.1) 85.6 (78.4–113.6) 105.3 (41.1) 111.9 (84.2–131.30)
Saturated fat (g) 37.7 (30) 25.2 (16.9–62.2) 32 (29.1) 31.2 (26.5–34.5) 31.6 (14.7) 32.6 (21.2–36)
MUFA (g) 30.7 (19.9) 27.6 (14.1–36.9) 35 (14.4) 34.9 (27.6–40.8) 38.6 (16.5) 36.4 (28.5–46.9)
PUFA (g) 15 (6.8) 15.1 (9.3–20) 20.2 (11.7) 17.9 (11.1–26.7) 23.3 (10.7) 22.6 (15.4–28.2)
Trans fat (mg) 730 (960) 358 (28.5–89.3) 580 (440) 552 (243.7–896.8) 500 (530) 407 (87–501)
Omega 3 (mg) 2260 (1470) 1958 (−1166–3068) 2990 (2320) 1958 (1307–4779) 3110 (3600) 1535 (1200–1942)
Omega 6 (mg) 1790 (3320) 418 (28.8–1624) 1010 (1040) 438 (283.3–1672) 3820 (4250) 2477 (198–4951)
Sugar (g) 96.7 (59.1) 68.9 (54.8–134.2) 83.2 (43.9) 80.2 (67–95.5) 103.6 (38.4) 97.4 (81.7–121.7)
Fiber (g) 28.4 (11.7) 22.5 (20.2–34.7) 31.3 (30.2) 23.2 (17.3–29.4) 36.5 (20.2) 28.8 (24.2–40.2)
Cholesterol (mg) 358 (348.7) 263.6 (59.4–453.4) 346.5 (194.6) 288.6 (196.1–466.1) 443.1 (269.3) 442.6 (186.3–638.6)
Butyrate (mg) 470 (740) 212.5 (39.8–578) 690 (690) 573.5 (283.5–929) 480 (470) 366 (194–518)
As described fully under the methods section, dietary components amongst groups were compared by PERMANOVA, BMI comparison utilized Kruskal-Wallis test,while VO2peak and age were compared using a 1-way ANOVA testBMI body mass index, MUFA monounsaturated fatty acid, PUFA polyunsaturated fatty acid, SD standard deviation, IQR interquartile range*A significant (P < 0.01) pairwise difference amongst the other two groups using a Bonferroni alpha correction procedure
Fig. 1 Dietary patterns amongst fitness groups. Scores of the two first components of the PCA of dietary data for all 39 subjects are presented.Each circle represents one participant, colored based on their CRF fitness levels. A lack of distinct clustering amongst groups suggests comparabledietary patterns amongst groups
Estaki et al. Microbiome (2016) 4:42 Page 5 of 13
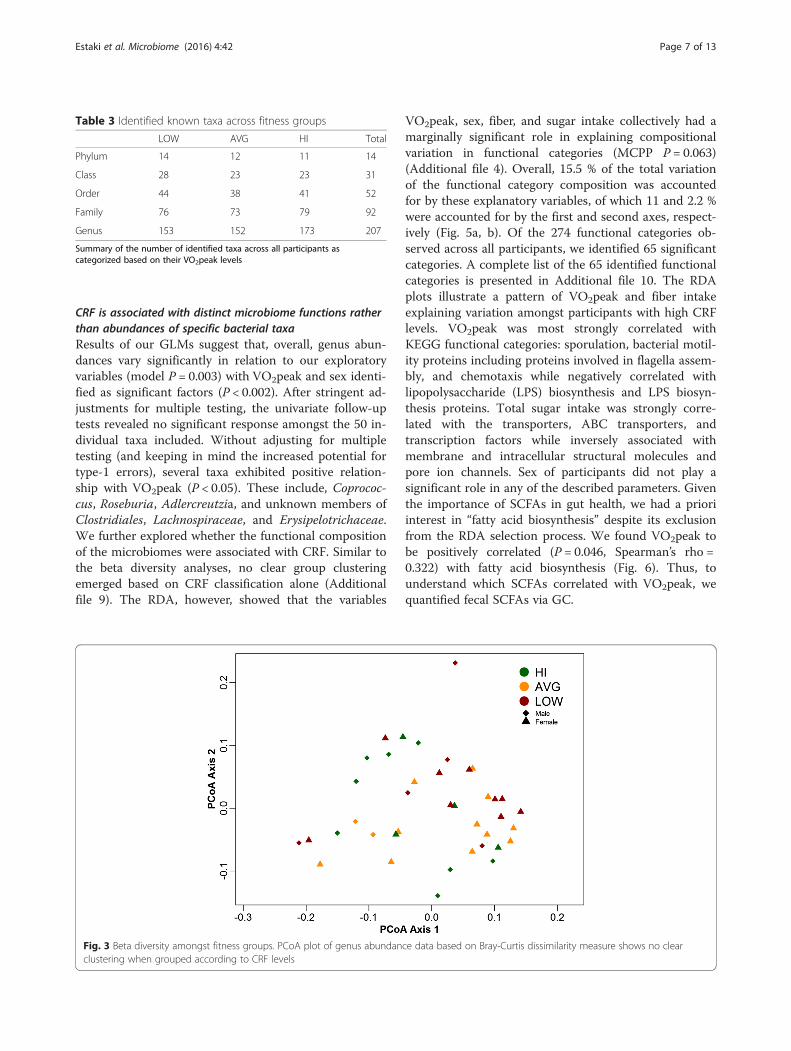
CRF levels do not promote distinct clustering of betadiversity dataOverall, 207 genera from 14 phyla were representedacross all participants (Table 3). The HI group includedrepresentation from 173 genera, while the AVG andLOW groups were made up of 152 and 153, respectively.PCoA plots constructed using Bray-Curtis (Fig. 3);weighted and unweighted unifrac dissimilarity indices(Additional file 7) did not show group clustering basedon fitness levels. Clustering of our dataset based on theCH index favored a two cluster partitioning (Additionalfile 8) rather than the proposed three enterotypes [30].
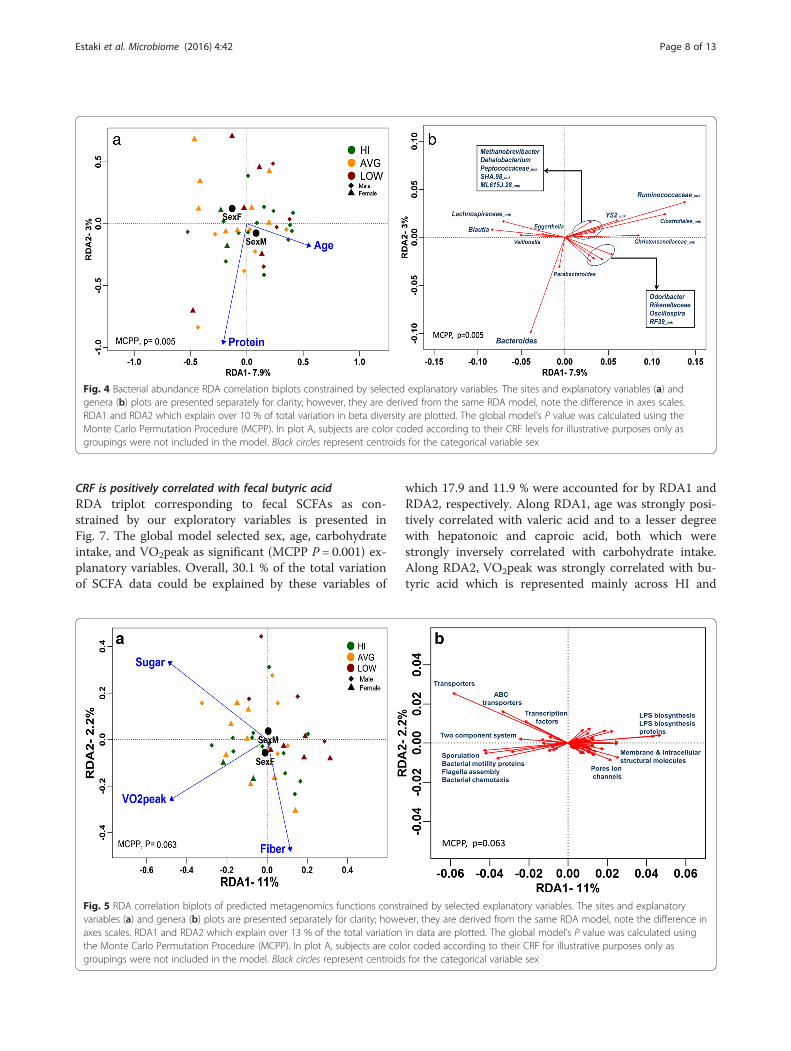
Protein intake and age but not CRF explain overallcommunity compositionThe global RDA model which selected sex, age, and pro-tein as meaningful explanatory variables was significant(P = 0.005) as assessed by Monte Carlo PermutationProcedure (MCPP) (1000 permutations). A total of12.7 % of the overall variation in taxon composition was
attributed to these explanatory variables, of which themajority were explained by the first and second axes(Fig. 4) which accounted for 7.9 and 2.3 % of the totalvariation, respectively. The RDA indicated that VO2peakdid not significantly explain beta diversity at any taxo-nomic resolution, whereas total protein intake was sig-nificant at each resolution tested (Additional file 4). Inaddition, age, sex, and the omega6-omega3 ratio (n6:n3)were also marginally significant explanatory variables,though only at particular taxanomic resolutions. InFig. 4b, we highlight 19 genera that were significantlycorrelated with one or both of the first two RDA axes.Amongst these, Bacteroides was strongly associated withprotein intake along RDA2 while Odoribacter, Rikenella-ceae, Oscillospira, and an unclassified RF39 were moststrongly correlated with age along RDA1. Other generathat strongly aligned with RDA1, but not correlated withany explanatory variables, included Blautia and unclassi-fied genera from Lachnospiraceae, Christensenellaceae,Ruminococcaceae, and Clostridiales.
Table 2 Multiple regression summary table of species richness data
Variables Unstandardized coefficients Standardized coefficients t P
B Std. error Beta
VO2peak 5.36 2.47 0.37 2.17 0.037*
Relative fat intake 432.46 250.10 0.26 1.72 0.094
Sex♂ 24.70 51.23 0.08 7.54 0.63
Result of multiple regression test showing VO2peak as the only significant variable in predicting species richness (SR). The B coefficient represents the amount ofchange in SR along its 95 % confidence intervals per unit change of VO2peak (ml/kg/min). The standardized coefficients show VO2peak as the strongest variableto influence SR variability. Model adjusted R2 = 0.20. P value = 0.01*Statistical significance
Fig. 2 Correlation between VO2peak and species richness (SR). Result of a multiple regression model showing a significant association betweenVO2peak and SR when holding all other variables constant. Shaded area represent 95 % confidence intervals
Estaki et al. Microbiome (2016) 4:42 Page 6 of 13
CRF is associated with distinct microbiome functions ratherthan abundances of specific bacterial taxaResults of our GLMs suggest that, overall, genus abun-dances vary significantly in relation to our exploratoryvariables (model P = 0.003) with VO2peak and sex identi-fied as significant factors (P < 0.002). After stringent ad-justments for multiple testing, the univariate follow-uptests revealed no significant response amongst the 50 in-dividual taxa included. Without adjusting for multipletesting (and keeping in mind the increased potential fortype-1 errors), several taxa exhibited positive relation-ship with VO2peak (P < 0.05). These include, Coprococ-cus, Roseburia, Adlercreutzia, and unknown members ofClostridiales, Lachnospiraceae, and Erysipelotrichaceae.We further explored whether the functional compositionof the microbiomes were associated with CRF. Similar tothe beta diversity analyses, no clear group clusteringemerged based on CRF classification alone (Additionalfile 9). The RDA, however, showed that the variables
VO2peak, sex, fiber, and sugar intake collectively had amarginally significant role in explaining compositionalvariation in functional categories (MCPP P = 0.063)(Additional file 4). Overall, 15.5 % of the total variationof the functional category composition was accountedfor by these explanatory variables, of which 11 and 2.2 %were accounted for by the first and second axes, respect-ively (Fig. 5a, b). Of the 274 functional categories ob-served across all participants, we identified 65 significantcategories. A complete list of the 65 identified functionalcategories is presented in Additional file 10. The RDAplots illustrate a pattern of VO2peak and fiber intakeexplaining variation amongst participants with high CRFlevels. VO2peak was most strongly correlated withKEGG functional categories: sporulation, bacterial motil-ity proteins including proteins involved in flagella assem-bly, and chemotaxis while negatively correlated withlipopolysaccharide (LPS) biosynthesis and LPS biosyn-thesis proteins. Total sugar intake was strongly corre-lated with the transporters, ABC transporters, andtranscription factors while inversely associated withmembrane and intracellular structural molecules andpore ion channels. Sex of participants did not play asignificant role in any of the described parameters. Giventhe importance of SCFAs in gut health, we had a prioriinterest in “fatty acid biosynthesis” despite its exclusionfrom the RDA selection process. We found VO2peak tobe positively correlated (P = 0.046, Spearman’s rho =0.322) with fatty acid biosynthesis (Fig. 6). Thus, tounderstand which SCFAs correlated with VO2peak, wequantified fecal SCFAs via GC.
Fig. 3 Beta diversity amongst fitness groups. PCoA plot of genus abundance data based on Bray-Curtis dissimilarity measure shows no clearclustering when grouped according to CRF levels
Table 3 Identified known taxa across fitness groups
LOW AVG HI Total
Phylum 14 12 11 14
Class 28 23 23 31
Order 44 38 41 52
Family 76 73 79 92
Genus 153 152 173 207
Summary of the number of identified taxa across all participants ascategorized based on their VO2peak levels
Estaki et al. Microbiome (2016) 4:42 Page 7 of 13
CRF is positively correlated with fecal butyric acidRDA triplot corresponding to fecal SCFAs as con-strained by our exploratory variables is presented inFig. 7. The global model selected sex, age, carbohydrateintake, and VO2peak as significant (MCPP P = 0.001) ex-planatory variables. Overall, 30.1 % of the total variationof SCFA data could be explained by these variables of
which 17.9 and 11.9 % were accounted for by RDA1 andRDA2, respectively. Along RDA1, age was strongly posi-tively correlated with valeric acid and to a lesser degreewith hepatonoic and caproic acid, both which werestrongly inversely correlated with carbohydrate intake.Along RDA2, VO2peak was strongly correlated with bu-tyric acid which is represented mainly across HI and
Fig. 5 RDA correlation biplots of predicted metagenomics functions constrained by selected explanatory variables. The sites and explanatoryvariables (a) and genera (b) plots are presented separately for clarity; however, they are derived from the same RDA model, note the difference inaxes scales. RDA1 and RDA2 which explain over 13 % of the total variation in data are plotted. The global model’s P value was calculated usingthe Monte Carlo Permutation Procedure (MCPP). In plot A, subjects are color coded according to their CRF for illustrative purposes only asgroupings were not included in the model. Black circles represent centroids for the categorical variable sex
Fig. 4 Bacterial abundance RDA correlation biplots constrained by selected explanatory variables. The sites and explanatory variables (a) andgenera (b) plots are presented separately for clarity; however, they are derived from the same RDA model, note the difference in axes scales.RDA1 and RDA2 which explain over 10 % of total variation in beta diversity are plotted. The global model’s P value was calculated using theMonte Carlo Permutation Procedure (MCPP). In plot A, subjects are color coded according to their CRF levels for illustrative purposes only asgroupings were not included in the model. Black circles represent centroids for the categorical variable sex
Estaki et al. Microbiome (2016) 4:42 Page 8 of 13
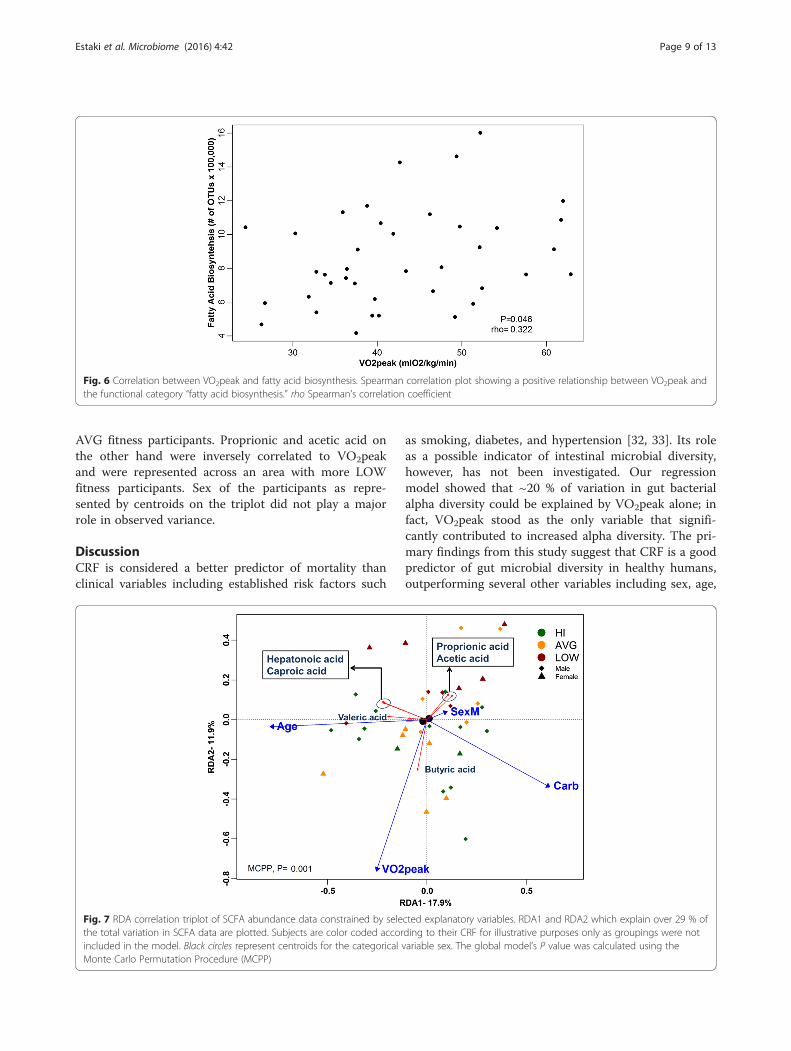
AVG fitness participants. Proprionic and acetic acid onthe other hand were inversely correlated to VO2peakand were represented across an area with more LOWfitness participants. Sex of the participants as repre-sented by centroids on the triplot did not play a majorrole in observed variance.
DiscussionCRF is considered a better predictor of mortality thanclinical variables including established risk factors such
as smoking, diabetes, and hypertension [32, 33]. Its roleas a possible indicator of intestinal microbial diversity,however, has not been investigated. Our regressionmodel showed that ~20 % of variation in gut bacterialalpha diversity could be explained by VO2peak alone; infact, VO2peak stood as the only variable that signifi-cantly contributed to increased alpha diversity. The pri-mary findings from this study suggest that CRF is a goodpredictor of gut microbial diversity in healthy humans,outperforming several other variables including sex, age,
Fig. 6 Correlation between VO2peak and fatty acid biosynthesis. Spearman correlation plot showing a positive relationship between VO2peak andthe functional category “fatty acid biosynthesis.” rho Spearman’s correlation coefficient
Fig. 7 RDA correlation triplot of SCFA abundance data constrained by selected explanatory variables. RDA1 and RDA2 which explain over 29 % ofthe total variation in SCFA data are plotted. Subjects are color coded according to their CRF for illustrative purposes only as groupings were notincluded in the model. Black circles represent centroids for the categorical variable sex. The global model’s P value was calculated using theMonte Carlo Permutation Procedure (MCPP)
Estaki et al. Microbiome (2016) 4:42 Page 9 of 13

BMI, and dietary components. Although no single bac-terial taxon or group of taxa showed significant variationin abundance in relation to CRF levels, the overall func-tion of the microbiome in high CRF individuals seems tofavor an increase in chemotaxis-related genes and de-creased LPS biosynthetic pathways. In addition, a strongpositive correlation was observed between VO2peak andfecal butyric acid, a SCFA associated with gut health [2].In support of this, when results from the multivariateGLMs were explored without adjustment for multipletesting, abundances of key butyrate-producing membersfrom Clostridiales, Roseburia, Lachnospiraceae, andErysipelotrichaceae genera were found to be significantlyassociated with VO2peak (P < 0.05). These results suggestan important role of these taxa in relation to increasedbutyrate production amongst more aerobically fit indi-viduals; however, future studies should test these ideasunder controlled settings.A recent study by Clarke et al. showed increased gut
community richness amongst professional rugby playerscompared to sedentary BMI-matched and non-matchedpopulations [13]. Due to extreme dietary differencesamongst their groups, however, the contribution ofphysical fitness could not be isolated from possible diet-driven influences. For example, it has been shown thatincreased species richness as a result of voluntary wheelrunning in mice is only robust under high-fat but notlow-fat feeding conditions [11], highlighting the import-ance of the background diet. In our study, we minimizedthe potential influence of diet as a confounding factor byexamining LOW, AVG, and HI fitness participants withno significant differences in a comprehensive number ofdietary variables. In addition, we quantify fitness usingVO2peak, a measure of capacity for aerobic work andthe gold standard of CRF. In their study, Clarke et al.highlighted the importance of protein intake by showingits positive correlation with alpha diversity. Interestingly,the magnitude of this correlation was comparable to ourcorrelation coefficient between VO2peak and alpha di-versity in the absence of a correlation between proteinintake and alpha diversity. This may suggest that the re-ported correlation between protein intake and alpha di-versity may have been a secondary product of increasedCRF amongst the elite athletes. The mechanisms bywhich physical activity may promote a rich bacterialcommunity are not known but likely involve a combin-ation of intrinsic and extrinsic factors. For example,physically active individuals are more likely to be ex-posed to their environmental biosphere and follow anoverall healthy lifestyle and as so harbor a richer micro-biota. Simultaneously, intrinsic adaptations to endurancetraining can lead to changes in the GI tract, for example,decreased blood flow, tissue hypoxia, and increased tran-sit and absorptive capacity [34, 35]. These and other
potential adaptation mechanisms such as change in gutpH may create an environmental setting allowing forricher community diversity.Beta diversity analysis of our cohort did not show dis-
tinct clustering of bacterial communities based on fit-ness categories. This contrasts with previous reports[11], which showed distinct clustering resulting fromwheel running in mice, as well as those by Clarke et al.who showed clustering of rugby players’ microbiota [13].In addition to extreme dietary differences, several mech-anisms may explain these discrepancies. Communityclustering amongst cohabited animals or the “cage-ef-fect” is known to show high community structureconcordance [36, 37]; it is therefore plausible that thisphenomena extends to humans. As team members arelikely to spend extended periods of time together on andoff the field, there is an increased likelihood of microbialexchange leading to distinct similar bacterial profiles.Participants in the current study on the other hand didnot belong to a common organization and did not showany detectable dietary differences. Other components offitness not accounted for in the current study such asanaerobic capacity and resistance muscle training mayalso influence community composition, though to date,no existing work has examined these parameters in rela-tion to gut microbiota.Total protein intake was consistently seen as a signifi-
cant contributor to beta diversity at each taxonomicrank tested, while sex and age were only influential be-yond the phyla level. Unlike dietary carbohydrates andfats, which are commonly studied, the role of protein inthe context of intestinal microbiota is considerably lessunderstood. Protein-rich diets have been associated withprevalence of Bacteroides genus [38]. Echoing this, re-sults from our RDA analysis showed a strong correlationbetween protein intake and Bacteroides without bias to-wards any specific fitness groups. Excessive fermentationof dietary protein in the GI tract is generally considereddetrimental due to the production of toxic by-productssuch as amines, phenols, indoles, thiols, and ammonia[39, 40]. Further research however is needed to deter-mine the synthesis kinetics and clinical consequence ofthese by-products during increased nutritional statusand metabolic demands such as during prolonged exer-cise training. The RDA results further showed significantcontribution of members of the Ruminococcaceae andLachnospiraceae, two of the most abundant families ingut environments [41], in explaining community diver-sity. These plant degraders persist in fibrolytic gut com-munities and are considered an important component ofa healthy gut, while their depletion has been observed inIBD patients [42, 43]. Ruminococcaceae and Bacteroideswere anticorrelated, likely reflecting the persistence ofthese groups in plant carbohydrate- versus protein-rich
Estaki et al. Microbiome (2016) 4:42 Page 10 of 13
gut environments, respectively. Interestingly, an unclas-sified member of the Christensenellaceae family was seensignificantly correlated with age; this was true despitethe limited range of our participants’ age (18–35 years).Though there is limited published work regarding its role,a recent study identified Christensenellaceae as the mostheritable member of the gut microbiota and highlightedtheir role in promoting a lean phenotyope [44].An increase in CRF demands various phenotypic and
metabolic adaptations by the host which subsequentlymay require adaptation by the commensal bacteria. Theresults of our RDA showed that although VO2peak wasnot significantly associated with variation in communitycomposition, it was associated with changes in the meta-genomic functions of the microbiome. Functionalcategories most strongly correlated with VO2peak wererelated to bacterial motility (categories: bacterial motilityproteins, flagella assembly, and bacterial chemotaxis),sporulation, and to a lesser extend the two-componentsystem which enables bacterial communities to senseand respond to environmental factors. One possiblemechanism behind these associations may derive fromthe observation that butyrate, which was more abundantamongst fit participants, can modulate neutrophilchemotaxis [45, 46]. VO2peak was inversely correlatedwith LPS biosynthesis and LPS biosynthesis proteinswhich were more aligned amongst less fit participants.LPS is a major component of the cell wall of gram-negative bacteria and is considered an endotoxin whenpresent in the blood. By binding to extracellular toll-likereceptor 4 (TLR4) found on many cell types, LPS elicitsstrong inflammatory responses that may be detrimentalto the host. Continuous low-level translocation of LPSinto circulation can induce chronic low-level inflamma-tory states that are associated with development ofobesity and other metabolic syndromes [47]. These in-flammatory states are thought to derive to some extentfrom inflammatory responses to blood LPS which is ele-vated in sedentary humans [48]. Exercise training atten-uates inflammation in part by reducing elevated bloodLPS [48]. The inverse relationship between VO2peak andLPS biosynthesis pathways observed in the current studytherefore extends previous research, suggesting a benefi-cial consequence of increased physical activity to derivefrom decreased LPS biosynthesis. The findings here sug-gest that the gut microbiota adapt to metabolic demandsof a physically active lifestyle, anchored around a set ofphysiological functions.Production of SCFAs is the primary result of carbohy-
drate fermentation under anaerobic conditions in thegut. Butyric acid or butyrate is the most commonly stud-ied of these SCFAs in regard to intestinal health. As theprimary food source of colonocytes, butyrate plays animportant role in gut homeostasis and health. It has
been shown to possess anticancer and anti-inflammatoryproperties [49] and be involved in gut motility [50, 51],energy expenditure [52], intestinal permeability [53], andappetite control [54], while a decrease in butyrate levelshas been suggested in etiology of ulcerative colitis [55].We observed a strong positive correlation betweenVO2peak and fecal butyrate levels, which could not beaccounted for by ingested dietary butyrate or its sub-strate, fiber. This suggests that the microbial profilesof physically fit individuals favor butyrate producingtaxa leading to increased fecal butyrate. This is in ac-cordance with Matsumoto et al. who observed in-creases in butyrate levels in cecum of rats exposed to5 weeks of wheel running [10].
ConclusionsThe primary findings from this correlative study suggestthat gut microbial diversity in healthy humans is associ-ated with aerobic fitness and that dietary protein moder-ates microbial community composition. They furthersuggest that adaptation of the microbiota to demands ofincreasing physical fitness is anchored around a set offunctional cores rather than specific bacterial groups. Inparticular, the microbiome profile of fit individuals ap-pears to favor butyrate production, a common indicatorof gut health, potentially through increases in Clostri-diales, Roseburia, Lachnospiraceae, and Erysipelotricha-ceae genera. Overall, our findings are consistent with arole for physical activity in promoting gut intestinalhealth via associated changes in the microbial commu-nity composition. Based on these findings, we encouragefurther research on the use of aerobic exercise prescrip-tion as an adjuvant therapy in prevention and treatmentof dysbiosis-associated diseases.
Additional files
Additional file 1: Sample food survey. A detailed description of allfoods and supplemented consumed by the subjects was written duringthe interview and later analyzed using FoodWorks nutrient analysissoftware (Version16.0) by a research nutritionist. (PDF 162 kb)
Additional file 2: Heyward’s 2006 normal VO2max reference chart.Subjects characterized as “Superior” or “Excellent” according to theHeyward classification were grouped under the “HI” group, “Fair” and“Good” subjects were placed into the “AVG” group, and “Poor” wasrenamed to “LO.” (TIF 2121 kb)
Additional file 3: Sampling depth rarefaction curves. Rarefaction curvesof all subjects at 97 % similarity levels shown as a function of Shannondiversity index and number of sequence tags sampled. (TIF 823 kb)
Additional file 4: Predictor variables included in the RDA models. Amanual pre-screening of dietary variables based on existing literature andcategories of interest was initially carried. Next, a combination of “both”forward and backward stepwise inclusion selection method using vegan’sordistep function was used on the remaining 23 variables plus VO2peak,Sex, BMI, and Age. (TIF 240 kb)
Additional file 5: Table summary of PERMANOVA for dietary intakeamongst different fitness groups. df degrees of freedom, SS sum of
Estaki et al. Microbiome (2016) 4:42 Page 11 of 13

squares, MS mean of squares, Pr P value as computed by 999permutations. (TIF 101 kb)
Additional file 6: Correlation matrix of various alpha diversity matrices.A correlation matrix using Spearman’s r showing strong correlationbetween all alpha diversity matrices used. Species richness (S) was thusused as a proxy for the response variable in the multiple regressionmodel. (TIFF 11074 kb)
Additional file 7: Beta diversity amongst fitness groups. Threedimensional PCoA plots of genus abundance data transformed withweighted (A) and unweighted (B) unifrac dissimilarity matrices show noclear clustering based on CRF levels. (TIF 256 kb)
Additional file 8: Optimal clustering selection of bacterial data. Thenumber of optimal clustering of all data was determined using theCalinski-Harabasz (CH) index. Optimal number of clusters did notidentify the classical three enterotypes but rather favored a twocluster partitioning. (TIFF 11074 kb)
Additional file 9: Ordination of predicted metagenomic functions data.PCA plot of centered functional category abundance data showing no clearclustering of groups based on their CRF levels. Plots were created usingStatistical Analysis of Metagenomic Profiles (STAMP) tool. (TIF 398 kb)
Additional file 10: Significant functional categories included in RDAmodel. A complete list of predicted functional categories and theircorresponding RDA 1–4 coordinates determined to be significant in ourRDA model. Using a series of Spearman correlations between eachcategory abundance data and RDA1 then RDA2 (alpha adjusted usingBonferroni correction), we identified 65 significant categories out of atotal of 274. (DOCX 22 kb)
AbbreviationsBMI, body mass index; CRF, cardiorespiratory fitness; LPS, lipopolysaccharide; OTU,operational taxa unit; PCA, principal component analysis; RDA, redundancyanalysis; SCFAs, short-chain fatty acids; VO2peak, peak oxygen uptake
AcknowledgementsWe thank Wade Klaver (UBCO) for the computer technical support and JuanJovel (U of A) for the data analysis support.
FundingME was supported by a PGS-D through the Natural Science and EngineeringResearch Council (NSERC). SKG was supported by a USRA from NSERC. JP issupported financially by an NSERC Discovery Grant. JPL is a Canadian Institutesof Health Research (CIHR) New Investigator and is supported by an NSERCDiscovery Grant. SG is a current MSFHR scholar and supported through grantsfrom Dairy Farmers of Canada and the Canadian Diabetes Association. This workwas supported by grants funded through NSERC to D.L.G.
Availability of data and materialsAll sequence reads and associated metadata files are available from theSequence Read Archive (accession number#: SRP068480, http://www.ncbi.nlm.nih.gov/sra/SRP068480). R scripts are available from the correspondingauthor on reasonable request.
Authors’ contributionsME was involved in all aspects of the design, experimentation, data collection,analysis, and manuscript writing, editing, and submission; JP is the primaryadvisor for community analysis, statistical analyses, and critical edits and reviewof manuscript; PB and KRM performed all exercise lab testing, participantsinterviews, and human data collection; SKG performed GC analysis; SGsupervised and funded GC analysis; JPL supervised all aspects of exercise labincluding participant recruitment, training, ethical approval acquisition, andcritical review of manuscript; ZAV performed the food data analysis; DLGsupervised all aspects of the study including design, experimentation, datacollection, critical review, and editing of manuscript and funded the project.All authors read and approved the final manuscript.
Competing interestsThe authors declare that they have no competing interests.
Consent for publicationNot applicable.
Ethics approval and consent to participateThis study was conducted according to the Declaration of Helsinkiguidelines, and all procedures were approved by University of BritishColumbia Clinical Research Ethics Board (Reference ID: H14-00482).
Author details1Department of Biology, The Irving K. Barber School of Arts and Sciences,University of British Columbia, Room ASC 386, 3187 University Way,Okanagan campus, Kelowna, British Columbia V1V 1V7, Canada. 2School ofHealth and Exercise Sciences, University of British Columbia, Okanagancampus, Kelowna, British Columbia V1V 1V7, Canada.
Received: 30 December 2015 Accepted: 27 July 2016
References1. Sekirov I, Russell SL, Antunes LCM, Finlay BB. Gut microbiota in health and
disease. Physiol Rev. 2010;90:859–904.2. Leonel AJ, Alvarez-Leite JI. Butyrate: implications for intestinal function. Curr
Opin Clin Nutr Metab Care. 2012;15:474–9.3. Chan YK, Estaki M, Gibson DL. Clinical consequences of diet-induced
dysbiosis. Ann Nutr Metab. 2013;63 Suppl 2:28–40.4. Le Chatelier E, Nielsen T, Qin J, Prifti E, Hildebrand F, Falony G, Almeida M,
Arumugam M, Batto JM, Kennedy S, et al. Richness of human gutmicrobiome correlates with metabolic markers. Nature. 2013;500:541–6.
5. Ott SJ, Musfeldt M, Wenderoth DF, Hampe J, Brant O, Folsch UR, Timmis KN,Schreiber S. Reduction in diversity of the colonic mucosa associatedbacterial microflora in patients with active inflammatory bowel disease. Gut.2004;53:685–93.
6. Chang JY, Antonopoulos DA, Kalra A, Tonelli A, Khalife WT, Schmidt TM,Young VB. Decreased diversity of the fecal microbiome in recurrentClostridium difficile-associated diarrhea. J Infect Dis. 2008;197:435–8.
7. Ahn J, Sinha R, Pei Z, Dominianni C, Wu J, Shi J, Goedert JJ, Hayes RB, YangL. Human gut microbiome and risk for colorectal cancer. J Natl Cancer Inst.2013;105:1907–11.
8. Giamarellos-Bourboulis E, Tang J, Pyleris E, Pistiki A, Barbatzas C, Brown J,Lee CC, Harkins TT, Kim G, Weitsman S, et al. Molecular assessment ofdifferences in the duodenal microbiome in subjects with irritable bowelsyndrome. Scand J Gastroenterol. 2015;50:1–12.
9. Sommer F, Backhed F. The gut microbiota—masters of host developmentand physiology. Nat Rev Microbiol. 2013;11:227–38.
10. Matsumoto M, Inoue R, Tsukahara T, Ushida K, Chiji H, Matsubara N,Hara H. Voluntary running exercise alters microbiota composition andincreases n-butyrate concentration in the rat cecum. Biosci BiotechnolBiochem. 2008;72:572–6.
11. Evans CC, LePard KJ, Kwak JW, Stancukas MC, Laskowski S, Dougherty J,Moulton L, Glawe A, Wang Y, Leone V, et al. Exercise prevents weight gainand alters the gut microbiota in a mouse model of high fat diet-inducedobesity. PLoS One. 2014;9:e92193.
12. Allen JM, Berg Miller ME, Pence BD, Whitlock K, Nehra V, Gaskins HR, White BA,Fryer JD, Woods JA. Voluntary and forced exercise differentially alters the gutmicrobiome in C57BL/6J mice. J Appl Physiol. 2015;118(1985):1059–66.
13. Clarke SF, Murphy EF, O'Sullivan O, Lucey AJ, Humphreys M, Hogan A, HayesP, O'Reilly M, Jeffery IB, Wood-Martin R, et al. Exercise and associated dietaryextremes impact on gut microbial diversity. Gut. 2014;63:1913–20.
14. Brown K, Godovannyi A, Ma C, Zhang Y, Ahmadi-Vand Z, Dai C, GorzelakMA, Chan Y, Chan JM, Lochner A, et al. Prolonged antibiotic treatmentinduces a diabetogenic intestinal microbiome that accelerates diabetes inNOD mice. ISME J. 2015.
15. Klindworth A, Pruesse E, Schweer T, Peplies J, Quast C, Horn M,Glockner FO. Evaluation of general 16S ribosomal RNA gene PCRprimers for classical and next-generation sequencing-based diversitystudies. Nucleic Acids Res. 2013;41:e1.
16. Zhang J, Kobert K, Flouri T, Stamatakis A. PEAR: a fast and accurate Illuminapaired-end reAd mergeR. Bioinformatics. 2014;30:614–20.
17. Caporaso JG, Kuczynski J, Stombaugh J, Bittinger K, Bushman FD, CostelloEK, Fierer N, Pena AG, Goodrich JK, Gordon JI, et al. QIIME allows analysis ofhigh-throughput community sequencing data. Nat Methods. 2010;7:335–6.
Estaki et al. Microbiome (2016) 4:42 Page 12 of 13

18. McDonald D, Price MN, Goodrich J, Nawrocki EP, DeSantis TZ, Probst A,Andersen GL, Knight R, Hugenholtz P. An improved Greengenes taxonomywith explicit ranks for ecological and evolutionary analyses of bacteria andarchaea. ISME J. 2012;6:610–8.
19. Langille MG, Zaneveld J, Caporaso JG, McDonald D, Knights D, Reyes JA,Clemente JC, Burkepile DE, Vega Thurber RL, Knight R, et al. Predictivefunctional profiling of microbial communities using 16S rRNA marker genesequences. Nat Biotechnol. 2013;31:814–21.
20. McMurdie PJ, Holmes S. Waste not, want not: why rarefying microbiomedata is inadmissible. PLoS Comput Biol. 2014;10:e1003531.
21. Paulson JN, Stine OC, Bravo HC, Pop M. Differential abundance analysis formicrobial marker-gene surveys. Nat Methods. 2013;10:1200–2.
22. R Core Team. R: a language and environment for statistical computing.Vienna: R Foundation for Statistical Computing; 2016. https://www.R-project.org/.
23. Wickham H. ggplot2: elegant graphics for data analysis. New York:Springer; 2009.
24. McNamee R. Regression modelling and other methods to controlconfounding. Occup Environ Med. 2005;62:500–6. 472.
25. Vazquez-Baeza Y, Pirrung M, Gonzalez A, Knight R. EMPeror: a tool forvisualizing high-throughput microbial community data. Gigascience. 2013;2:16.
26. Oksanen J, Blanchet FG, Kindt R, Legendre P, Minchin PR, O'Hara RB,Simpson GL, Solymos P, Stevens MHH, Wagner H. Vegan: Communityecology package. R package version 2.3-5. 2016. [https://CRAN.R-project.org/package=vegan].
27. Legendre P, Gallagher ED. Ecologically meaningful transformations forordination of species data. Oecologia. 2001;129:271–80.
28. Wang Y, Naumann U, Wright S, Eddelbuettel D, Warton D. mvabund:Statistical methods for analysing multivariate abundance data. R packageversion 3.11.9. 2016. [https://CRAN.R-project.org/package=mvabund].
29. Nielsen S, Needham B, Leach ST, Day AS, Jaffe A, Thomas T, Ooi CY.Disrupted progression of the intestinal microbiota with age in children withcystic fibrosis. Sci Rep. 2016;6:24857.
30. Arumugam M, Raes J, Pelletier E, Le Paslier D, Yamada T, Mende DR,Fernandes GR, Tap J, Bruls T, Batto JM, et al. Enterotypes of the human gutmicrobiome. Nature. 2011;473:174–80.
31. You YM, Wang J, Huang XM, Tang ZX, Liu SR, Sun OJ. Relating microbialcommunity structure to functioning in forest soil organic carbontransformation and turnover. Ecol Evol. 2014;4:633–47.
32. Myers J, Prakash M, Froelicher V, Do D, Partington S, Atwood JE. Exercisecapacity and mortality among men referred for exercise testing. N Engl J Med.2002;346:793–801.
33. Kodama S, Saito K, Tanaka S, Maki M, Yachi Y, Asumi M, Sugawara A,Totsuka K, Shimano H, Ohashi Y, et al. Cardiorespiratory fitness as aquantitative predictor of all-cause mortality and cardiovascular events inhealthy men and women: a meta-analysis. JAMA. 2009;301:2024–35.
34. Rosa EF, Silva AC, Ihara SS, Mora OA, Aboulafia J, Nouailhetas VL. Habitualexercise program protects murine intestinal, skeletal, and cardiac musclesagainst aging. J Appl Physiol. 2005;99(1985):1569–75.
35. Gisolfi CV. Is the GI system built for exercise? News Physiol Sci. 2000;15:114–9.36. Lees H, Swann J, Poucher SM, Nicholson JK, Holmes E, Wilson ID, Marchesi
JR. Age and microenvironment outweigh genetic influence on the Zuckerrat microbiome. PLoS One. 2014;9:e100916.
37. McCafferty J, Muhlbauer M, Gharaibeh RZ, Arthur JC, Perez-Chanona E, ShaW, Jobin C, Fodor AA. Stochastic changes over time and not founder effectsdrive cage effects in microbial community assembly in a mouse model.ISME J. 2013;7:2116–25.
38. Wu GD, Chen J, Hoffmann C, Bittinger K, Chen YY, Keilbaugh SA, Bewtra M,Knights D, Walters WA, Knight R, et al. Linking long-term dietary patternswith gut microbial enterotypes. Science. 2011;334:105–8.
39. Macfarlane GT, Macfarlane S. Bacteria, colonic fermentation, andgastrointestinal health. J AOAC Int. 2012;95:50–60.
40. Rist VT, Weiss E, Eklund M, Mosenthin R. Impact of dietary protein onmicrobiota composition and activity in the gastrointestinal tract of piglets inrelation to gut health: a review. Animal. 2013;7:1067–78.
41. Jalanka-Tuovinen J, Salonen A, Nikkila J, Immonen O, Kekkonen R, Lahti L,Palva A, de Vos WM. Intestinal microbiota in healthy adults: temporalanalysis reveals individual and common core and relation to intestinalsymptoms. PLoS One. 2011;6:e23035.
42. Fujimoto T, Imaeda H, Takahashi K, Kasumi E, Bamba S, Fujiyama Y, AndohA. Decreased abundance of Faecalibacterium prausnitzii in the gutmicrobiota of Crohn’s disease. J Gastroenterol Hepatol. 2013;28:613–9.
43. Frank DN, St Amand AL, Feldman RA, Boedeker EC, Harpaz N, Pace NR.Molecular-phylogenetic characterization of microbial communityimbalances in human inflammatory bowel diseases. Proc Natl Acad Sci U SA. 2007;104:13780–5.
44. Goodrich JK, Waters JL, Poole AC, Sutter JL, Koren O, Blekhman R, BeaumontM, Van Treuren W, Knight R, Bell JT, et al. Human genetics shape the gutmicrobiome. Cell. 2014;159:789–99.
45. Vinolo MA, Ferguson GJ, Kulkarni S, Damoulakis G, Anderson K, Bohlooly YM,Stephens L, Hawkins PT, Curi R. SCFAs induce mouse neutrophil chemotaxisthrough the GPR43 receptor. PLoS One. 2011;6:e21205.
46. Bocker U, Nebe T, Herweck F, Holt L, Panja A, Jobin C, Rossol S, BS R, SingerMV. Butyrate modulates intestinal epithelial cell-mediated neutrophilmigration. Clin Exp Immunol. 2003;131:53–60.
47. Monteiro R, Azevedo I. Chronic inflammation in obesity and the metabolicsyndrome. Mediators Inflamm 2010, 2010. doi:10.1155/2010/289645.
48. Lira FS, Rosa JC, Pimentel GD, Souza HA, Caperuto EC, Carnevali LC,Seelaender M, Damaso AR, Oyama LM, de Mello MT, Santos RV. Endotoxinlevels correlate positively with a sedentary lifestyle and negatively withhighly trained subjects. Lipids Health Dis. 2010;9:82.
49. Hamer HM, Jonkers D, Venema K, Vanhoutvin S, Troost FJ, Brummer RJ.Review article: the role of butyrate on colonic function. Aliment PharmacolTher. 2008;27:104–19.
50. Scheppach W. Effects of short chain fatty acids on gut morphology andfunction. Gut. 1994;35:S35–38.
51. Hurst NR, Kendig DM, Murthy KS, Grider JR. The short chain fatty acids,butyrate and propionate, have differential effects on the motility of theguinea pig colon. Neurogastroenterol Motil. 2014;26:1586–96.
52. Gao Z, Yin J, Zhang J, Ward RE, Martin RJ, Lefevre M, Cefalu WT, Ye J.Butyrate improves insulin sensitivity and increases energy expenditure inmice. Diabetes. 2009;58:1509–17.
53. Kanauchi O, Iwanaga T, Mitsuyama K, Saiki T, Tsuruta O, Noguchi K,Toyonaga A. Butyrate from bacterial fermentation of germinated barleyfoodstuff preserves intestinal barrier function in experimental colitis in therat model. J Gastroenterol Hepatol. 1999;14:880–8.
54. Sleeth ML, Thompson EL, Ford HE, Zac-Varghese SE, Frost G. Free fatty acidreceptor 2 and nutrient sensing: a proposed role for fibre, fermentablecarbohydrates and short-chain fatty acids in appetite regulation. Nutr ResRev. 2010;23:135–45.
55. Kumari R, Ahuja V, Paul J. Fluctuations in butyrate-producing bacteria inulcerative colitis patients of North India. World J Gastroenterol. 2013;19:3404–14.
• We accept pre-submission inquiries
• Our selector tool helps you to find the most relevant journal
• We provide round the clock customer support
• Convenient online submission
• Thorough peer review
• Inclusion in PubMed and all major indexing services
• Maximum visibility for your research
Submit your manuscript atwww.biomedcentral.com/submit
Submit your next manuscript to BioMed Central and we will help you at every step:
Estaki et al. Microbiome (2016) 4:42 Page 13 of 13