cardiovascular disease: primary care intelligence packs
TRANSCRIPT

Cardiovascular Disease: Primary Care
Intelligence Packs
NHS Harrow CCG 26 Feb 2019
Contents
2 CVD: Primary Care Intelligence Pack for NHS Harrow CCG
Introduction 3
CVD prevention 10
• The data 12
Hypertension 16
• The data 18
Stroke 29
• The data 31
Diabetes 47
• The data 49
Kidney 61
• The data 63
Heart 70
• The data 72
Cardiovascular disease outcomes 89
Appendix - INLIQ Data 95
Appendix - Data Sources 96
This document is valid only when viewed via the internet. If it is printed into hard copy or saved to another location, you must first check that the version number
on your copy matches that of the one online. Printed copies are uncontrolled copies.
26 Feb 2019

Introduction
3 CVD: Primary Care Intelligence Pack for NHS Harrow CCG 26 Feb 2019Return to contents

This intelligence pack has been compiled by GPs and
nurses and pharmacists in the Primary Care CVD
Leadership Forum in collaboration with the National
Cardiovascular Intelligence Network
Matt Kearney
George Kassianos
Chris Harris
Ivan Benett
Mike Kirby
Helen Williams
Nigel Rowell
Sally Christie
Bruce Taylor
Richard Mendelsohn
Sarit Ghosh
Jo Whitmore
Jan Procter-King
Ruth Chambers
Peter Green
Quincy Chuhka
Ali Morgan
Clare Hawley
Mike Knapton
Chris Arden
Kathryn Griffith
Mathew Fay
Yassir Javaid
Ahmet Fuat
Kamlesh Khunti
Sheila McCorkindale
Stephen Kirk
Paul Wright
John Robson
David Fitzmaurice
4 CVD: Primary Care Intelligence Pack for NHS Harrow CCG 26 Feb 2019Return to contents

Data and methods
This slide pack compares the clinical commissioning group (CCG) NHS Harrow with CCGs in its sustainability and
transformation partnership (STP) and the England average. The slide pack also compares the CCG to its 10 most
similar CCGs in terms of demography, ethnicity and deprivation, and shows variation between practices within the
CCG. Information on the methodology used to calculate the 10 most similar CCGs is here:
https://www.england.nhs.uk/publication/similar-10-ccg-explorer-tool
The 10 most similar CCGs to NHS Harrow CCG are:
NHS Hillingdon CCG
NHS Merton CCG
NHS Kingston CCG
NHS Redbridge CCG
NHS Sutton CCG
NHS Barnet CCG
NHS East Berkshire CCG
NHS Bexley CCG
NHS Hounslow CCG
NHS Crawley CCG
The majority of data used in the packs is taken from the 2017/18 Quality and Outcomes Framework (QOF). Where
this is not the case, this is indicated in the slide. For the first time CCG level data from the indicators no longer in
QOF (INLIQ) are included in this pack. These data are experimental statistics. Full source data and further details
on the INLIQ are shown in the appendix.
5 CVD: Primary Care Intelligence Pack for NHS Harrow CCG 26 Feb 2019Return to contents

NHS RightCare CVD practice packs
NHS RightCare is a national NHS England supported programme committed to delivering the best care to patients,
making the NHS's money go as far as possible and improving patient outcomes. The RightCare approach uses
robust data and the best available clinical evidence to identify unwarranted variation across the country. It then
provides practical resources and support to local health economies to help them work through how money can be
spent most effectively to deliver the best care for their populations.
These CVD Intelligence packs produced by Public Health England are publicly available and highlight the
levels of variation and opportunities that exist across health economies in terms of patient detection/management.
Health economies with significant variation and opportunities may want to explore the NHS RightCare practice
packs which look at variation and opportunities at individual general practice level across whole pathways.
The NHS RightCare CVD practice packs look at indicators from across Coronary Heart Disease, Stroke and
Diabetes pathways including data on disease prevalence, detection, patient management, primary care
prescribing, inpatient admissions and outcomes. Practice variation and opportunities are presented by comparing
each practice to a national cluster of demographically similar practices. These packs are available for every CCG
and can be obtained by contacting your local NHS RightCare Delivery Partner.
For further information on NHS RightCare practice packs please contact: [email protected]
6 CVD: Primary Care Intelligence Pack for NHS Harrow CCG 26 Feb 2019Return to contents

Local intelligence as a tool for clinicians and
commissioners to improve outcomes for our
patients
Why should we use this CVD Intelligence pack?
High risk conditions for cardiovascular disease (CVD) - such as hypertension, high cholesterol, atrial fibrillation
(AF), diabetes, non-diabetic hyperglycaemia and chronic kidney disease - are the easier targets for prevention in
the NHS because late diagnosis, suboptimal treatment, and variation in treatment received is common.
High quality primary care is central to improving CVD outcomes as a large proportion of prevention, diagnosis and
treatment is delivered in a primary care setting. This pack is a powerful resource for stimulating local conversations
about quality improvement in primary care across a number of vascular conditions, looking at prevention,
diagnosis, care and outcomes. The data allows comparison between clinical commissioning groups (CCGs) and
between general practices.
This is not about performance management because variation can have more than one
interpretation. But patients have a right to expect that challenging questions will be asked about how the best
practices are achieving the best, what average or below average performers could do differently, and how they
could be supported to perform as well as the best.
7 CVD: Primary Care Intelligence Pack for NHS Harrow CCG 26 Feb 2019Return to contents

Local intelligence as a tool for clinicians and
commissioners to improve outcomes for our
patients
How to use this CVD Intelligence pack
The intelligence pack has several sections - CVD prevention, hypertension, stroke and atrial fibrillation (AF),
diabetes, kidney disease, heart disease and heart failure. Each section has one slide of narrative that makes the
case and asks some questions. This is followed by data for a number of indicators, each with benchmarked
comparisons between CCGs and between practices.
Use the pack to identify where there is variation that needs exploring and to start asking challenging questions
about where and how quality could be improved. We suggest you then develop a local action plan for quality
improvement - this might include establishing communities of practice to build clinical leadership, systematic local
audit to get a better understanding of the gaps in care and outcomes, and developing new models of care that
mobilise the wider primary care team to reduce burden on general practice.
8 CVD: Primary Care Intelligence Pack for NHS Harrow CCG 26 Feb 2019Return to contents

Why does variation matter?
The variation that exists between
demographically similar CCGs and
between practices illustrates the local
potential to improve care and
outcomes for our patients
Benchmarking does not tell us why there is variation. Some of the
variation may be explained by population or case mix and some
may be unwarranted. Its strength lies not in the answers it provides
but in the questions it generates for CCGs and practices. For
example:
1. How much variation is there in detection, management and
outcomes?
2. How many people would benefit if average performers improved to
the level of the best performers?
3. How many people would benefit if the lowest performers matched
the achievement of the average?
4. What are better performers doing differently in the way they
provide services in order to achieve better outcomes?
5. How can the CCG support low and average performers to help
them match the achievement of the best?
6. How can we build clinical leadership to drive quality improvement?
Benchmarking is helpful because it highlights variation.
It has long been acknowledged that some variation is
inevitable in the healthcare and outcomes experienced by
patients. But John Wennberg, who has championed
research into clinical variation over four decades and who
founded the pioneering Dartmouth Atlas of Health Care,
concluded that much variation is unwarranted - i.e. it cannot
be explained on the basis of illness, medical evidence, or
patient preference, but is accounted for by the willingness
and ability of doctors to offer treatment.
There are legitimate reasons for exception reporting. But...
Excepting patients from indicators puts them at risk of not receiving optimal care and of having worse outcomes. It is also likely to increase
health inequalities. The substantial variation seen in exception reporting for some indicators suggests that some practices are more
effective than others at reaching their whole population. Benchmarking exception reporting allows us to identify the practices that need
support to implement the strategies adopted by low excepting practices.
9 CVD: Primary Care Intelligence Pack for NHS Harrow CCG 26 Feb 2019Return to contents

CVD Prevention
10 CVD: Primary Care Intelligence Pack for NHS Harrow CCG 26 Feb 2019Return to contents

CVD Prevention
"The NHS needs a radical upgrade in
prevention if it is to be sustainable"
Five Year Forward View 2014
The size of the prevention problem:
- over 60% of adults are obese or overweight
- 22% of adults are physically inactive
- average smoking prevalence is around 17% but is much higher in
some communities
- in high risk conditions like atrial fibrillation, high blood pressure,
diabetes and high ten year CVD risk score, up to half of all people
do not receive preventive treatments that are known to be highly
effective at preventing heart attacks and strokes
- around 90% of people with familial hypercholesterolaemia are
undiagnosed and untreated despite their average 10 year reduction
in life expectancy
What might help?
-Social prescribing and wellbeing hubs offer models for supporting
behaviour change while reducing burden on general practice.
-The NHS Health Check is a systematic approach to identifying local
people at high risk of CVD, offering behaviour change support and
early detection of the high risk but often undiagnosed conditions
such as hypertension, atrial fibrillation, chronic kidney disease
(CKD), diabetes and prediabetes.
Question: What proportion of our local eligible population is receiving
the NHS Health Check and how effective is the follow-up
management of their clinical risk factors in primary care?
This is because England faces an epidemic of largely
preventable non-communicable diseases, such as heart
disease and stroke, cancer, type 2 diabetes and liver
disease.
The Global Burden of Disease Study (slide 12) shows us
that the leading causes of premature mortality include diet,
tobacco, obesity, raised blood pressure, physical inactivity
and raised cholesterol. The radical upgrade in prevention
needs population-level approaches. But it also needs
interventions in primary care for individuals with
behavioural and clinical risk factors.
11 CVD: Primary Care Intelligence Pack for NHS Harrow CCG 26 Feb 2019Return to contents

Global Burden of Disease Study 2016:
Risk factors attributed to premature CVD mortality and disability in
England, expressed as disability-adjusted life-years (DALYs)
Source: Global Burden of Disease Study 2016.
12 CVD: Primary Care Intelligence Pack for NHS Harrow CCG 26 Feb 2019Return to contents

Estimated smoking prevalence, by CCGs in the STP
Smoking prevalence in NHS Harrow CCG
was 13.2% in 2017/18
Note: It has been found that the proportion of
patients recorded as smokers correlates well with
smoking prevalence reported in the Annual Population
Survey and is a good estimate of the actual smoking
prevalence in local areas,
http://bmjopen.bmj.com/content/4/7/e005217
Indicator definition: denominator of QOF clinical
indicator SMOK004 (number of patients 15 years and
over who are recorded as current smokers) divided
by general practice's estimated number of patients
15 years and over.
13 CVD: Primary Care Intelligence Pack for NHS Harrow CCG 26 Feb 2019Return to contents
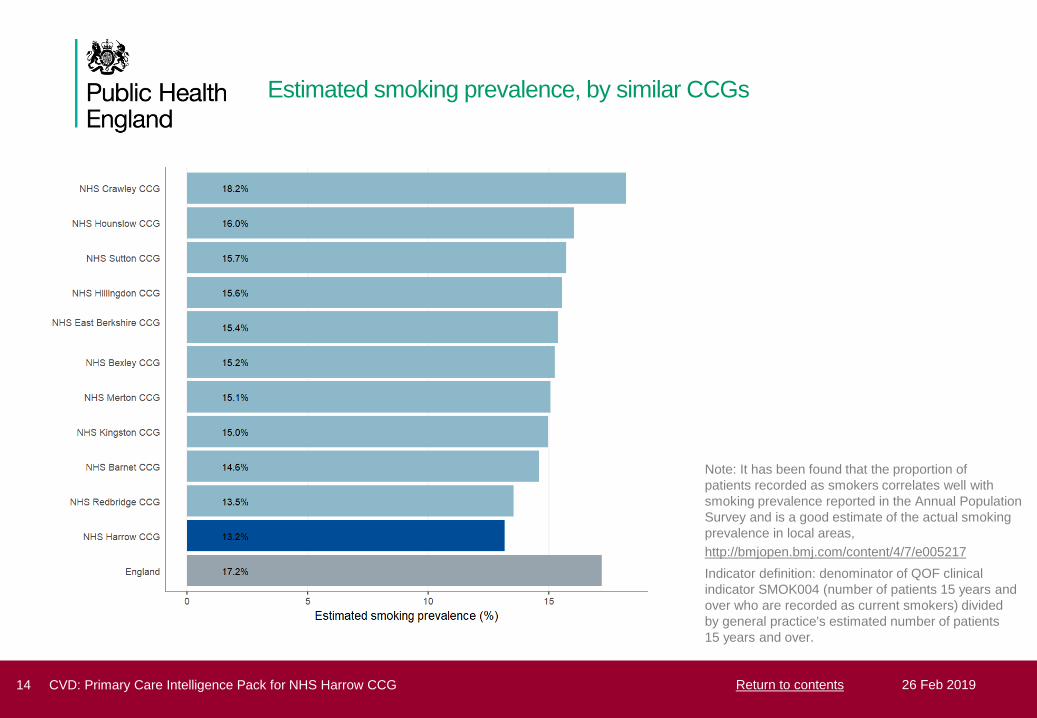
Estimated smoking prevalence, by similar CCGs
Note: It has been found that the proportion of
patients recorded as smokers correlates well with
smoking prevalence reported in the Annual Population
Survey and is a good estimate of the actual smoking
prevalence in local areas,
http://bmjopen.bmj.com/content/4/7/e005217
Indicator definition: denominator of QOF clinical
indicator SMOK004 (number of patients 15 years and
over who are recorded as current smokers) divided
by general practice's estimated number of patients
15 years and over.
14 CVD: Primary Care Intelligence Pack for NHS Harrow CCG 26 Feb 2019Return to contents

Estimated smoking prevalence, by general practice
28,631 people are recorded as smokers in
NHS Harrow CCG
The range of smoking prevalence across GPs
in NHS Harrow CCG is 8.7% to 20.6%
Note: For the majority of general practices the method
of measuring smoking prevalence is reasonably
robust. However, caution is advised for extreme
estimates of smoking prevalence and those with high
numbers of smoking status not recorded and
exceptions.
15 CVD: Primary Care Intelligence Pack for NHS Harrow CCG 26 Feb 2019Return to contents

Hypertension
16 CVD: Primary Care Intelligence Pack for NHS Harrow CCG 26 Feb 2019Return to contents

Hypertension
The Global Burden of Disease Study
confirmed high blood pressure as a
leading cause of premature death
and disability
The Missing Millions
On average, each CCG in England has 26,000 residents with
undiagnosed hypertension - these individuals are unaware of
their increased cardiovascular risk and are untreated.
What questions can we ask in our CCG?
1. For each indicator how wide is the variation in achievement and
exception reporting?
2. How many people would benefit if all practices performed as well
as the best?
3. How can we support practices who are average and below
average to perform as well as the best in:
- detection of hypertension
- management of hypertension
What might help?
1. Support practices to share audit data and systematically identify
gaps and opportunities for improved detection and management of
hypertension
2. Work with practices and local authorities to maximise uptake and
follow up in the NHS Health Check programme
3. Support access to self-test blood pressure stations in waiting
rooms and to ambulatory blood pressure monitoring
4. Commission community pharmacists to offer blood pressure
measurement, diagnosis and management support, including
support for adherence to medication
High blood pressure is common and costly
- it affects around a quarter of all adults
- the NHS costs of hypertension are around GBP 2bn
- social costs are probably considerably higher
What do we know?
- at least half of all heart attacks and strokes are caused by
high blood pressure and it is a major risk factor for chronic
kidney disease and cognitive decline
- treatment is very effective - every 10mmHg reduction in
systolic blood pressure lowers risk of heart attack and
stroke by 20%
- despite this 4 out of 10 adults with hypertension, over 5
and a half million people in England, remain undiagnosed
- even when the condition is identified, treatment is often
suboptimal, with blood pressure poorly controlled in about
1 out of 3 individuals
17 CVD: Primary Care Intelligence Pack for NHS Harrow CCG 26 Feb 2019Return to contents
Hypertension observed prevalence compared with expected
prevalence, by CCGs in the STP
This page has intentionally been left blank.
Please note: The hypertension prevalence model will be updated in 2019/20. The observed compared to expected graphs have therefore
been removed from this version of the CVD Intelligence packs and will be updated as soon as the model becomes available.
For more details please contact the National Cardiovascular Intelligence Network Team [email protected]
18 CVD: Primary Care Intelligence Pack for NHS Harrow CCG 26 Feb 2019Return to contents

Hypertension observed prevalence compared with expected
prevalence, by similar CCGs
This page has intentionally been left blank.
Please note: The hypertension prevalence model will be updated in 2019/20. The observed compared to expected graphs have therefore
been removed from this version of the CVD Intelligence packs and will be updated as soon as the model becomes available.
For more details please contact the National Cardiovascular Intelligence Network Team [email protected]
19 CVD: Primary Care Intelligence Pack for NHS Harrow CCG 26 Feb 2019Return to contents

Hypertension observed prevalence compared with expected
prevalence, by general practice
This page has intentionally been left blank.
Please note: The hypertension prevalence model will be updated in 2019/20. The observed compared to expected graphs have therefore
been removed from this version of the CVD Intelligence packs and will be updated as soon as the model becomes available.
For more details please contact the National Cardiovascular Intelligence Network Team [email protected]
20 CVD: Primary Care Intelligence Pack for NHS Harrow CCG 26 Feb 2019Return to contents

Percentage of patients with hypertension whose last blood pressure
reading (measured in the preceding 12 months) is 150/90 mmHg or
less, by CCGs in the STP
There are 35,192 people with diagnosed
hypertension in NHS Harrow CCG
Of these, 28,523 (81.0%) people have blood
pressure which is <= 150/90
6,669 (19.0%) people (including excepted
cases) have blood pressure that is NOT <=
150/90
Note: Using QOF clinical indicator HYP006
denominator plus exceptions
21 CVD: Primary Care Intelligence Pack for NHS Harrow CCG 26 Feb 2019Return to contents

Percentage of patients with hypertension whose last blood pressure
reading (measured in the preceding 12 months) is 150/90 mmHg or
less, by similar CCGs
Note: Using QOF clinical indicator HYP006
denominator plus exceptions
22 CVD: Primary Care Intelligence Pack for NHS Harrow CCG 26 Feb 2019Return to contents

Percentage of patients with hypertension whose last blood pressure
reading (measured in the preceding 12 months) is NOT 150/90 mmHg
or less, by general practice
In total, including excepted cases, there are
6,669 people whose blood pressure is NOT
<= 150/90
The range of percentage of patients with
hypertension whose last blood pressure
reading is NOT <= 150/90 across GPs in
NHS Harrow CCG is 10.1% to 38.7%
The data labels on the chart refer to the total
count of people whose blood pressure is not <=
150/90, including excepted cases, by general
practice
Note: Using QOF clinical indicator HYP006
denominator plus exceptions
23 CVD: Primary Care Intelligence Pack for NHS Harrow CCG 26 Feb 2019Return to contents

Percentage of patients aged 79 or under with hypertension in whom
the last blood pressure reading (measured in the preceding 9 months)
is 140/90 mmHg or less, by CCGs in the STP including only practices
returning INLIQ* data
The population coverage of INLIQ in NHS
Harrow CCG is 98.5%
Of those practices participating in INLIQ, the
percentage of patients aged 79 or under with
hypertension in whom the last blood pressure
reading (measured in the preceding 9
months) is <= 140/90 mmHg is 59.5%
*Note: This information comes from the NHS
Digital Indicators No Longer In QOF (INLIQ)
Clinical Indicator HYP003.
Treatment data for CCGs where the population
coverage is less than 60% are not displayed.
Treatment figures are calculated using the
exceptions in the denominator. For more
information about this data please see appendix
24 CVD: Primary Care Intelligence Pack for NHS Harrow CCG 26 Feb 2019Return to contents

Percentage of patients aged 79 or under with hypertension in whom
the last blood pressure reading (measured in the preceding 9 months)
is 140/90 mmHg or less, by similar CCGs including only practices
returning INLIQ* data
The population coverage of INLIQ in NHS
Harrow CCG is 98.5%
Of those practices participating in INLIQ, the
percentage of patients aged 79 or under with
hypertension in whom the last blood pressure
reading (measured in the preceding 9
months) is <= 140/90 mmHg is 59.5%
*Note: This information comes from the NHS
Digital Indicators No Longer In QOF (INLIQ)
Clinical Indicator HYP003.
Treatment data for CCGs where the population
coverage is less than 60% are not displayed.
Treatment figures are calculated using the
exceptions in the denominator. For more
information about this data please see appendix
25 CVD: Primary Care Intelligence Pack for NHS Harrow CCG 26 Feb 2019Return to contents

New diagnosis of hypertension who have been given a CVD risk
assessment which exceeds 20% and have been treated with statins,
by CCGs in the STP
There are 134 people with a new diagnosis of
hypertension with a CVD risk of 20% or
higher in NHS Harrow CCG
Of these, there are 98 (73.1%) people who
are currently treated with statins
There are 36 (26.9%) people (including
excepted cases) who are NOT currently
treated with statins
Note: Using QOF clinical indicator CVD-PP001
denominator plus exceptions
26 CVD: Primary Care Intelligence Pack for NHS Harrow CCG 26 Feb 2019Return to contents
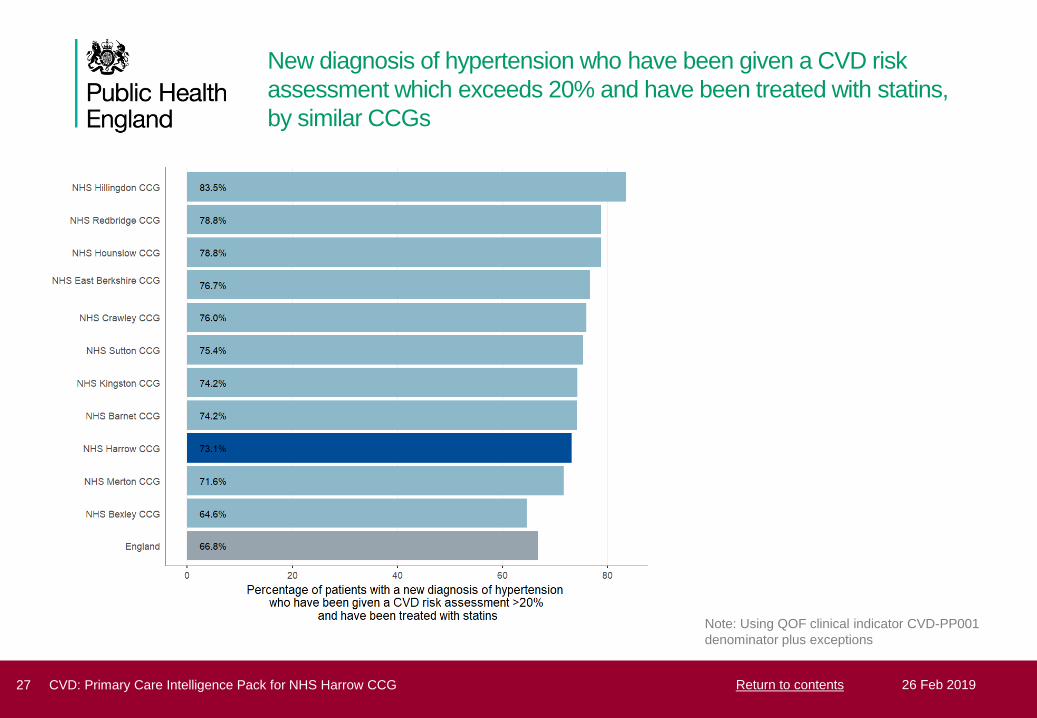
New diagnosis of hypertension who have been given a CVD risk
assessment which exceeds 20% and have been treated with statins,
by similar CCGs
Note: Using QOF clinical indicator CVD-PP001
denominator plus exceptions
27 CVD: Primary Care Intelligence Pack for NHS Harrow CCG 26 Feb 2019Return to contents

New diagnosis of hypertension who have been given a CVD risk
assessment which exceeds 20% and are NOT treated with statins, by
general practice
In total, including excepted cases, there are
36 people who are NOT treated with statins
The range of those newly diagnosed with
hypertension who have been given a CVD
risk assessment that exceeds 20 per cent
and are NOT treated with statins across GPs
in NHS Harrow CCG is 0.0% to 75.0%
The data labels on the chart refer to the total
count of people who are not treated with statins,
including excepted cases, by general practice
Note: Using QOF clinical indicator CVD-PP001
denominator plus exceptions
28 CVD: Primary Care Intelligence Pack for NHS Harrow CCG 26 Feb 2019Return to contents

Stroke
29 CVD: Primary Care Intelligence Pack for NHS Harrow CCG 26 Feb 2019Return to contents

Stroke prevention
Only half of people with known atrial
fibrillation (AF) who then suffer a
stroke have been anticoagulated
before their stroke - Source: Sentinel
Stroke National Audit Programme
What questions should we ask in our CCG?
1. For each indicator how wide is the variation in detection and
treatment?
2. How many people would benefit if all practices performed as well
as the best?
3. How can we support practices who are average and below
average to perform as well as the best in detection of atrial
fibrillation and stroke prevention with anticoagulation?
What might help?
1. Increase opportunistic pulse checking especially in over 65s
2. Support practices to share audit data and systematically identify
gaps and opportunities for improved detection and management of
AF - eg GRASP-AF
3. Promote systematic use of CHADS-VASC and HASBLED to
ensure those at high risk are offered stroke prevention
4. Promote systematic use of Warfarin Patient Safety Audit Tool to
ensure optimal time in therapeutic range for people on warfarin
5. Develop local consensus statement on risk-benefit balance for
anticoagulants
6. Work with practices and local authorities to maximise uptake and
clinical follow up in the NHS Health Check programme
7. Commission community pharmacists to offer pulse checks,
anticoagulant monitoring, and support for adherence to
medication
Stroke is one of the leading causes of premature death and
disability. Stroke is devastating for individuals and families,
and accounts for a substantial proportion of health and
social care expenditure.
Atrial fibrillation increases the risk of stroke by a factor of 5,
and strokes caused by AF are often more severe, with
higher mortality and greater disability.
Anticoagulation reduces the risk of stroke in people with AF
by two thirds. Despite this, AF is underdiagnosed and
under-treated: around a quarter of people with AF are
unaware they have the condition and even when
diagnosed inadequate treatment is common - large
numbers do not receive anticoagulants or have poor
anticoagulant control. Indeed only half of all individuals with
known AF who suffer a stroke have been anticoagulated.
30 CVD: Primary Care Intelligence Pack for NHS Harrow CCG 26 Feb 2019Return to contents

Atrial fibrillation observed prevalence compared with expected
prevalence, by CCGs in the STP
The ratio of those diagnosed with atrial
fibrillation versus those expected to have
atrial fibrillation in NHS Harrow CCG is 0.64.
This compares to 0.78 for England
This suggests that 64% of people with atrial
fibrillation in NHS Harrow CCG have been
diagnosed
Note: This slide compares the prevalence of atrial
fibrillation recorded in QOF in 2017/18 to the estimated
prevalence of atrial fibrillation, taken from National
Cardiovascular Intelligence Network estimates
produced in 2017. The estimates were developed by
applying age-sex specific prevalence rates as reported
by Norberg et al (2013) to GP population estimates
from NHS Digital. Estimates reported are adjusted for
age and sex of the local population.
31 CVD: Primary Care Intelligence Pack for NHS Harrow CCG 26 Feb 2019Return to contents

Atrial fibrillation observed prevalence compared with expected
prevalence, by similar CCGs
Note: This slide compares the prevalence of atrial
fibrillation recorded in QOF in 2017/18 to the estimated
prevalence of atrial fibrillation, taken from National
Cardiovascular Intelligence Network estimates
produced in 2017. The estimates were developed by
applying age-sex specific prevalence rates as reported
by Norberg et al (2013) to GP population estimates
from NHS Digital. Estimates reported are adjusted for
age and sex of the local population.
32 CVD: Primary Care Intelligence Pack for NHS Harrow CCG 26 Feb 2019Return to contents

Atrial fibrillation observed prevalence compared with expected
prevalence, by general practice
There are 3,613 people with diagnosed atrial
fibrillation in NHS Harrow CCG
It is estimated that there are 1,993 people
with undiagnosed atrial fibrillation in NHS
Harrow CCG
The range of observed to expected atrial
fibrillation prevalence across GPs in NHS
Harrow CCG is 0.16 to 0.90
Note: This slide compares the prevalence of atrial
fibrillation recorded in QOF in 2017/18 to the estimated
prevalence of atrial fibrillation, taken from National
Cardiovascular Intelligence Network estimates
produced in 2017. The estimates were developed by
applying age-sex specific prevalence rates as reported
by Norberg et al (2013) to GP population estimates
from NHS Digital. Estimates reported are adjusted for
age and sex of the local population.
33 CVD: Primary Care Intelligence Pack for NHS Harrow CCG 26 Feb 2019Return to contents

In patients with AF with a CHA2DS2-VASc score of 2 or more, the
percentage treated with anti-coagulation therapy, by CCGs in the STP
There are 3,090 people with atrial fibrillation
with a CHA2DS2-VASc score >= 2 in NHS
Harrow CCG
There are 2,361 (76.4%) people who are
currently treated with anti-coagulation therapy
There are 729 (23.6%) people (including
excepted cases) with a recorded CHA2DS2-
VASc score >= 2 who are NOT treated with
anti-coagulation therapy
Note: Using QOF clinical indicator AF007
denominator plus exceptions
34 CVD: Primary Care Intelligence Pack for NHS Harrow CCG 26 Feb 2019Return to contents

In patients with AF with a CHA2DS2-VASc score of 2 or more, the
percentage treated with anti-coagulation therapy, by similar CCGs
Note: Using QOF clinical indicator AF007
denominator plus exceptions
35 CVD: Primary Care Intelligence Pack for NHS Harrow CCG 26 Feb 2019Return to contents

In patients with AF with a CHA2DS2-VASc score of 2 or more, the
percentage NOT treated with anti-coagulation therapy, by general
practice
In total, including excepted cases, there are
729 people with a recorded CHA2DS2-VASc
score >= 2 who are NOT treated with anti-
coagulation therapy in NHS Harrow CCG
The range of the percentage of AF patients
with a recorded CHA2DS2-VASc score >= 2
who are NOT treated with anti-coagulation
therapy across GPs in NHS Harrow CCG is
0.0% to 39.0%
The data labels on the chart refer to the total
count of people who are not treated with anti-
coagulation therapy, including excepted cases, by
general practice
Note: Using QOF clinical indicator AF007
denominator plus exceptions
36 CVD: Primary Care Intelligence Pack for NHS Harrow CCG 26 Feb 2019Return to contents

Percentage of patients with a history of stroke whose last blood
pressure reading (measured in the preceding 12 months) is 150/90
mmHg or less, by CCGs in the STP
There are 3,532 people with a history of
stroke or transient ischemic attack (TIA) in
NHS Harrow CCG
There are 3,046 (86.2%) people with a history
of stroke or TIA, whose blood pressure is
<=150/90
There are 486 (13.8%) people (including
excepted cases) whose blood pressure is
NOT <= 150/90
Note: Using QOF clinical indicator STIA003
denominator plus exceptions
37 CVD: Primary Care Intelligence Pack for NHS Harrow CCG 26 Feb 2019Return to contents
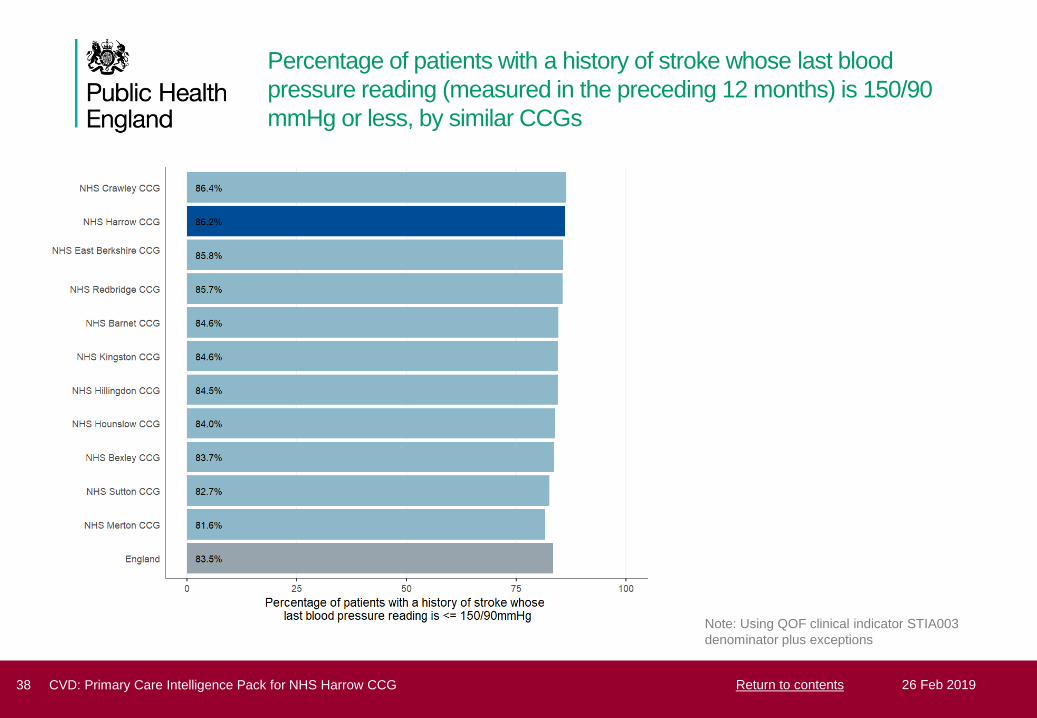
Percentage of patients with a history of stroke whose last blood
pressure reading (measured in the preceding 12 months) is 150/90
mmHg or less, by similar CCGs
Note: Using QOF clinical indicator STIA003
denominator plus exceptions
38 CVD: Primary Care Intelligence Pack for NHS Harrow CCG 26 Feb 2019Return to contents

Percentage of patients with a history of stroke whose last blood
pressure reading (measured in the preceding 12 months) is NOT
150/90 mmHg or less, by general practice
In total, including excepted cases, there are
486 people whose blood pressure is NOT
<=150/90
The range of the percentage of patients with
a history of stroke whose blood pressure is
NOT <= 150/90 across GPs in NHS Harrow
CCG is 0.0% to 42.3%
The data labels on the chart refer to the total
count of people whose blood pressure is not
<=150/90, including excepted cases, by general
practice
Note: Using QOF clinical indicator STIA003
denominator plus exceptions
39 CVD: Primary Care Intelligence Pack for NHS Harrow CCG 26 Feb 2019Return to contents

Percentage of patients with a stroke shown to be non-haemorrhagic, or
a history of TIA, who have a record in the preceding 12 months that an
anti-platelet agent, or an anti-coagulant is being taken, by CCGs in the
STP
There are 2,108 people with a stroke shown
to be non-haemorrhagic or history of TIA in
NHS Harrow CCG
There are 1,870 (88.7%) people who are
taking an anti-platelet agent or anti-coagulant
medication
There are 238 (11.3%) people (including
excepted cases) who have no record of
receiving treatment
Note: Using QOF clinical indicator STIA007
denominator plus exceptions
40 CVD: Primary Care Intelligence Pack for NHS Harrow CCG 26 Feb 2019Return to contents

Percentage of patients with a stroke shown to be non-haemorrhagic, or
a history of TIA, who have a record in the preceding 12 months that an
anti-platelet agent, or an anti-coagulant is being taken, by similar CCGs
Note: Using QOF clinical indicator STIA007
denominator plus exceptions
41 CVD: Primary Care Intelligence Pack for NHS Harrow CCG 26 Feb 2019Return to contents

Percentage of patients with a stroke shown to be non-haemorrhagic, or
a history of TIA, who do NOT have a record in the preceding 12
months that an anti-platelet agent, or an anti-coagulant is being taken,
by general practice
In total, including excepted cases, there are
238 people who are NOT taking an anti-
platelet agent or anti-coagulant in NHS
Harrow CCG
The range of the percentage of patients with
a stroke shown to be non-haemorrhagic, or a
history of TIA, who are NOT taking an anti-
platelet or anti-coagulant medication across
GPs in NHS Harrow CCG is 0.0% to 28.6%
The data labels on the chart refer to the total
count of people who are not taking an anti-platelet
agent or anti-coagulant, including excepted
cases, by general practice
Note: Using QOF clinical indicator STIA007
denominator plus exceptions
42 CVD: Primary Care Intelligence Pack for NHS Harrow CCG 26 Feb 2019Return to contents

Percentage of patients with stroke or TIA who have a record of total
cholesterol in the preceding 12 months, by CCGs in the STP including
only practices returning INLIQ* data
The population coverage of INLIQ in NHS
Harrow CCG is 98.5%
Of those practices participating in INLIQ, the
percentage of patients with stroke or TIA who
have a record of total cholesterol in the
preceding 12 months is 68.1%
*Note: This information comes from the NHS
Digital Indicators No Longer In QOF (INLIQ)
Clinical Indicator STIA004.
Treatment data for CCGs where the population
coverage is less than 60% are not displayed.
Treatment figures are calculated using the
exceptions in the denominator. For more
information about this data please see appendix
43 CVD: Primary Care Intelligence Pack for NHS Harrow CCG 26 Feb 2019Return to contents

Percentage of patients with stroke or TIA who have a record of total
cholesterol in the preceding 12 months, by similar CCGs including only
practices returning INLIQ* data
The population coverage of INLIQ in NHS
Harrow CCG is 98.5%
Of those practices participating in INLIQ, the
percentage of patients with stroke or TIA who
have a record of total cholesterol in the
preceding 12 months is 68.1%
*Note: This information comes from the NHS
Digital Indicators No Longer In QOF (INLIQ)
Clinical Indicator STIA004.
Treatment data for CCGs where the population
coverage is less than 60% are not displayed.
Treatment figures are calculated using the
exceptions in the denominator. For more
information about this data please see appendix
44 CVD: Primary Care Intelligence Pack for NHS Harrow CCG 26 Feb 2019Return to contents
Percentage of patients with stroke shown to be non-haemorrhagic, or a
history of TIA, whose last measured total cholesterol (measured in the
preceding 12 months) is 5 mmol/l or less, by CCGs in the STP
including only practices returning INLIQ* data
The population coverage of INLIQ in NHS
Harrow CCG is 98.5%
Of those practices participating in INLIQ, the
percentage of patients with stroke shown to
be non-haemorrhagic, or a history of TIA,
whose last measured total cholesterol
(measured in the preceding 12 months) is <=
5 mmol/l is 57.4%
*Note: This information comes from the NHS
Digital Indicators No Longer In QOF (INLIQ)
Clinical Indicator STIA005.
Treatment data for CCGs where the population
coverage is less than 60% are not displayed.
Treatment figures are calculated using the
exceptions in the denominator. For more
information about this data please see appendix
45 CVD: Primary Care Intelligence Pack for NHS Harrow CCG 26 Feb 2019Return to contents

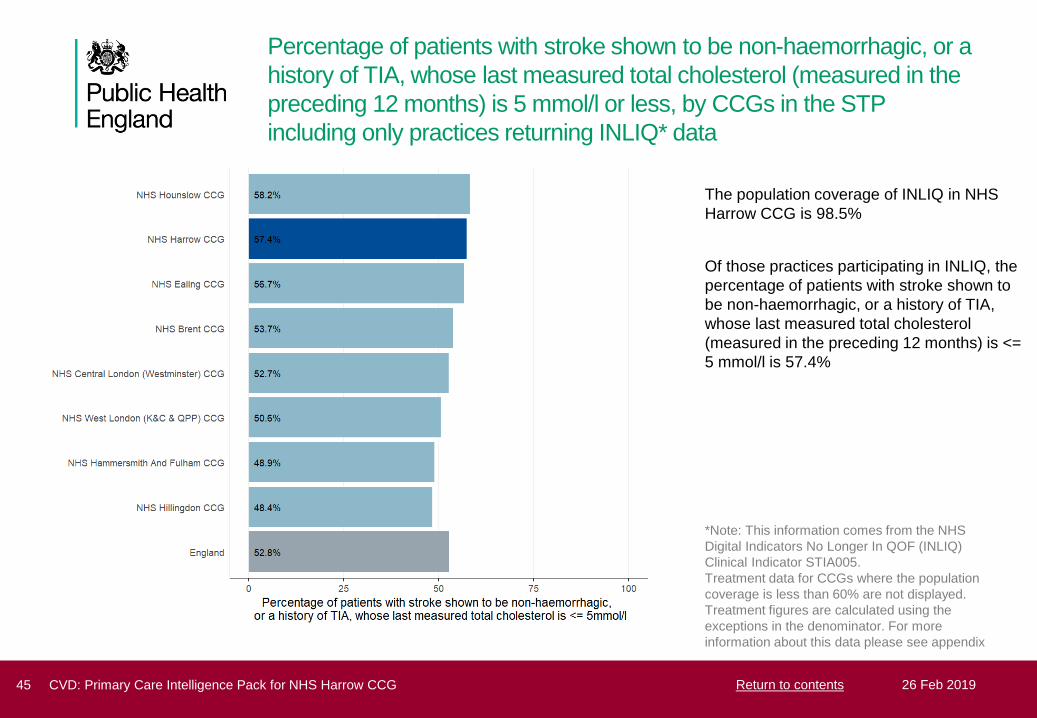
Percentage of patients with stroke shown to be non-haemorrhagic, or a
history of TIA, whose last measured total cholesterol (measured in the
preceding 12 months) is 5 mmol/l or less, by similar CCGs including
only practices returning INLIQ* data
The population coverage of INLIQ in NHS
Harrow CCG is 98.5%
Of those practices participating in INLIQ, the
percentage of patients with stroke shown to
be non-haemorrhagic, or a history of TIA,
whose last measured total cholesterol
(measured in the preceding 12 months) is <=
5 mmol/l is 57.4%
*Note: This information comes from the NHS
Digital Indicators No Longer In QOF (INLIQ)
Clinical Indicator STIA005.
Treatment data for CCGs where the population
coverage is less than 60% are not displayed.
Treatment figures are calculated using the
exceptions in the denominator. For more
information about this data please see appendix
46 CVD: Primary Care Intelligence Pack for NHS Harrow CCG 26 Feb 2019Return to contents

Diabetes
47 CVD: Primary Care Intelligence Pack for NHS Harrow CCG 26 Feb 2019Return to contents

Diabetes prevention and
management
Diabetes costs the NHS GBP 9.8
billion per year and the prevalence is
rising - Source: Hex et al, 2012
Diabetes (type 1 and 2) in numbers:
1. Diagnosed prevalence (type 1 and 2) - 3.1 million
2. Undiagnosed type 2 diabetes - 0.9 million
3. Non-diabetic hyperglycaemia (high risk of type 2 diabetes) -
5 million
What questions can we ask in our CCG?
1. For each indicator how wide is the variation in achievement?
2. How many people would benefit if all practices performed as well
as the best?
3. How can we support practices who are average and below
average to perform as well as the best in:
- detection of diabetes
- delivery of the 8 care processes and achievement of the 3
treatment targets
- identification and management of non-diabetic hyperglycaemia
What might help?
1. Benchmark practice level data from the National Diabetes Audit
(NDA)- and support practices to explore variation
2. Increase support for patient education and shared management
3. Maximise uptake of the NHS Health Check to aid detection of
diabetes and non-diabetic hyperglycaemia
4. Maximise uptake of the NHS Diabetes Prevention Programme.
Type 2 diabetes is often preventable. People at high risk of
developing Type 2 diabetes can be identified through the
NHS Health Check Programme and the disease can be
prevented or delayed in many through intensive behaviour
change support, such as that provided by the NHS
Diabetes Prevention Programme.
Complications of diabetes are preventable. Diabetes is a
major cause of premature death and greatly increases the
risk of heart disease, stroke, kidney failure, amputations
and blindness. Eighty percent of NHS spending on diabetes
goes on managing these complications, most of which could
be prevented. There are 8 essential care processes, in
addition to retinal screening, that together substantially
reduce complication rates. Despite this, around half of
people with diabetes do not receive all 8 care processes,
and there is widespread variation between CCGs and
practices in levels of achievement.
48 CVD: Primary Care Intelligence Pack for NHS Harrow CCG 26 Feb 2019Return to contents

Diabetes (type 1 and type 2) observed prevalence compared with
expected prevalence, by CCGs in the STP
The ratio of those diagnosed with diabetes
(type 1 and type 2) versus those expected to
have diabetes (type 1 and type 2) in NHS
Harrow CCG is 0.91. This compares to 0.79
for England
This suggests that 91% of people with
diabetes (type 1 and type 2) in NHS Harrow
CCG have been diagnosed
There are an estimated 1,923 people with
undiagnosed diabetes (type 1 or type 2) over
16 years old in NHS Harrow CCG
Note: This slide compares the prevalence of diabetes
recorded in QOF in 2017/18 to the expected
prevalence of diabetes in 2017 taken from the NCVIN
diabetes prevalence model produced in 2015 using the
registered population. The estimated number of
undiagnosed people with diabetes has been calculated
by multiplying the estimated prevalence rate to the
2017/18 QOF list size and subtracting the number of
people on the diabetes register.
49 CVD: Primary Care Intelligence Pack for NHS Harrow CCG 26 Feb 2019Return to contents

Diabetes (type 1 and type 2) observed prevalence compared with
expected prevalence, by similar CCGs
Note: This slide compares the prevalence of diabetes
recorded in QOF in 2017/18 to the expected
prevalence of diabetes in 2017 taken from the NCVIN
diabetes prevalence model produced in 2015 using the
registered population. The estimated number of
undiagnosed people with diabetes has been calculated
by multiplying the estimated prevalence rate to the
2017/18 QOF list size and subtracting the number of
people on the diabetes register.
50 CVD: Primary Care Intelligence Pack for NHS Harrow CCG 26 Feb 2019Return to contents

Diabetes (type 1 and type 2) prevalence, by general practice
There are 20,296 people with diagnosed
diabetes (type 1 or type 2) over 16 years old
in NHS Harrow CCG
The range of observed diabetes (type 1 and
type 2) across GPs in NHS Harrow CCG is
5.6% to 15.7%
Note: Using QOF clinical indicator DM017
51 CVD: Primary Care Intelligence Pack for NHS Harrow CCG 26 Feb 2019Return to contents

Expected total prevalence of diabetes (type 1 and type 2) and non-
diabetic hyperglycaemia, by CCGs in the STP
The estimated total prevalence of diabetes in
NHS Harrow CCG is 10.3% (diagnosed and
undiagnosed, combined percentage may
appear different from graph due to rounding)
In addition, there are an estimated 14.0% of
people in NHS Harrow CCG who are at
increased risk of developing diabetes (i.e.
non-diabetic hyperglycaemia)
This means that 24.3% of the population in
NHS Harrow CCG are estimated to have
diabetes, or are at high risk of developing
diabetes
Note: Prevalence estimates of non-diabetic
hyperglycaemia were developed using Health Survey
for England (HSE) data. Five years of HSE data were
combined, 2009 - 2013. The estimates take into
account the age, ethnic group and estimated body
mass index of the population. These estimates were
produced using the GP registered population.
52 CVD: Primary Care Intelligence Pack for NHS Harrow CCG 26 Feb 2019Return to contents

People with type 1 diabetes who received all eight care processes, by
CCGs in the STP
In NHS Harrow CCG, 33 out of 33 practices
(100.0%) participated in the National
Diabetes Audit
In the practices who participated in the audit,
41.6% of people with type 1 diabetes
received the eight recommended care
processes in NHS Harrow CCG, compared
with 42.9% in England
Note: Data shown here are from the National Diabetes
Audit (NDA)
53 CVD: Primary Care Intelligence Pack for NHS Harrow CCG 26 Feb 2019Return to contents

People with type 2 diabetes who received all eight care processes, by
CCGs in the STP
In NHS Harrow CCG, 33 out of 33 practices
(100.0%) participated in the National
Diabetes Audit
In the practices who participated in the audit,
41.1% of people with type 2 diabetes
received the eight recommended care
processes in NHS Harrow CCG, compared
with 58.8% in England
Note: Data shown here are from the National Diabetes
Audit (NDA)
54 CVD: Primary Care Intelligence Pack for NHS Harrow CCG 26 Feb 2019Return to contents

People with type 1 diabetes who received all eight care processes, by
general practice
In the practices that participated in the
National Diabetes Audit (NDA) in NHS
Harrow CCG, 435 people with type 1
diabetes received all eight care processes
The range of the percentage of patients with
type 1 diabetes who received all eight care
processes in practices that provided data via
the NDA in NHS Harrow CCG is 0.0% to
100.0%
Note: Data shown here are from the National Diabetes
Audit (NDA)
55 CVD: Primary Care Intelligence Pack for NHS Harrow CCG 26 Feb 2019Return to contents

People with type 2 diabetes who received all eight care processes, by
general practice
In the practices that participated in the
National Diabetes Audit (NDA) in NHS
Harrow CCG, 11,460 people with type 2
diabetes received all eight care processes
The range of the percentage of patients with
type 2 diabetes who received all eight care
processes in practices that provided data via
the NDA in NHS Harrow CCG is 7.1% to
91.0%
Note: Data shown here are from the National Diabetes
Audit (NDA)
56 CVD: Primary Care Intelligence Pack for NHS Harrow CCG 26 Feb 2019Return to contents
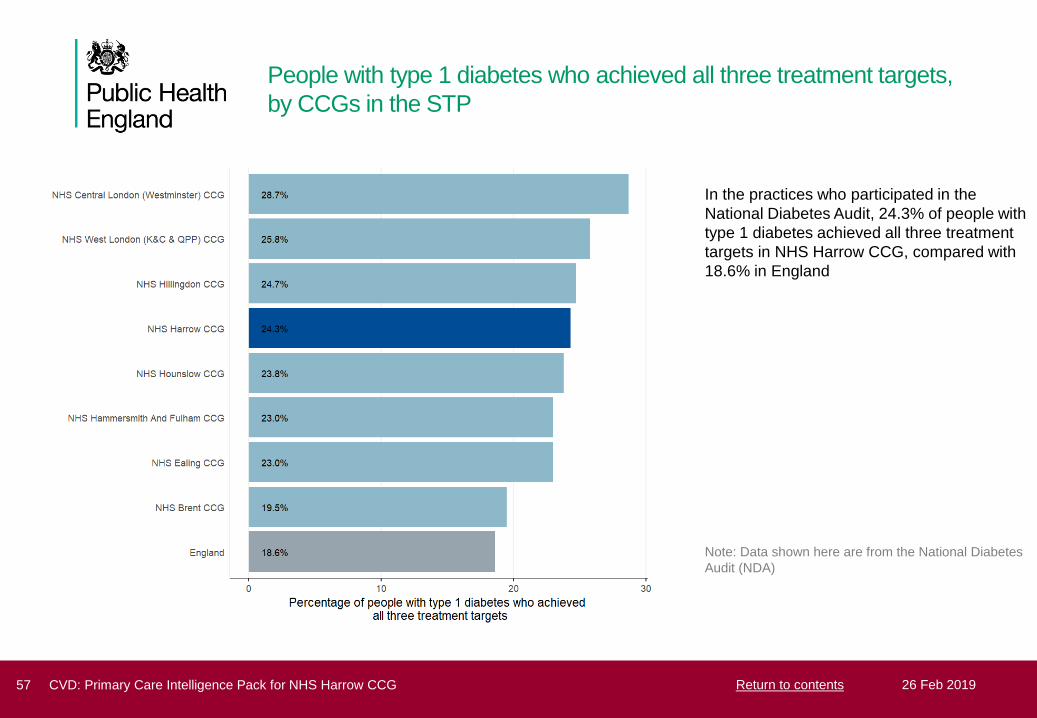
People with type 1 diabetes who achieved all three treatment targets,
by CCGs in the STP
In the practices who participated in the
National Diabetes Audit, 24.3% of people with
type 1 diabetes achieved all three treatment
targets in NHS Harrow CCG, compared with
18.6% in England
Note: Data shown here are from the National Diabetes
Audit (NDA)
57 CVD: Primary Care Intelligence Pack for NHS Harrow CCG 26 Feb 2019Return to contents

People with type 2 diabetes who achieved all three treatment targets,
by CCGs in the STP
In the practices who participated in the
National Diabetes Audit, 43.3% of people with
type 2 diabetes achieved all three treatment
targets in NHS Harrow CCG, compared with
40.1% in England
Note: Data shown here are from the National Diabetes
Audit (NDA)
58 CVD: Primary Care Intelligence Pack for NHS Harrow CCG 26 Feb 2019Return to contents
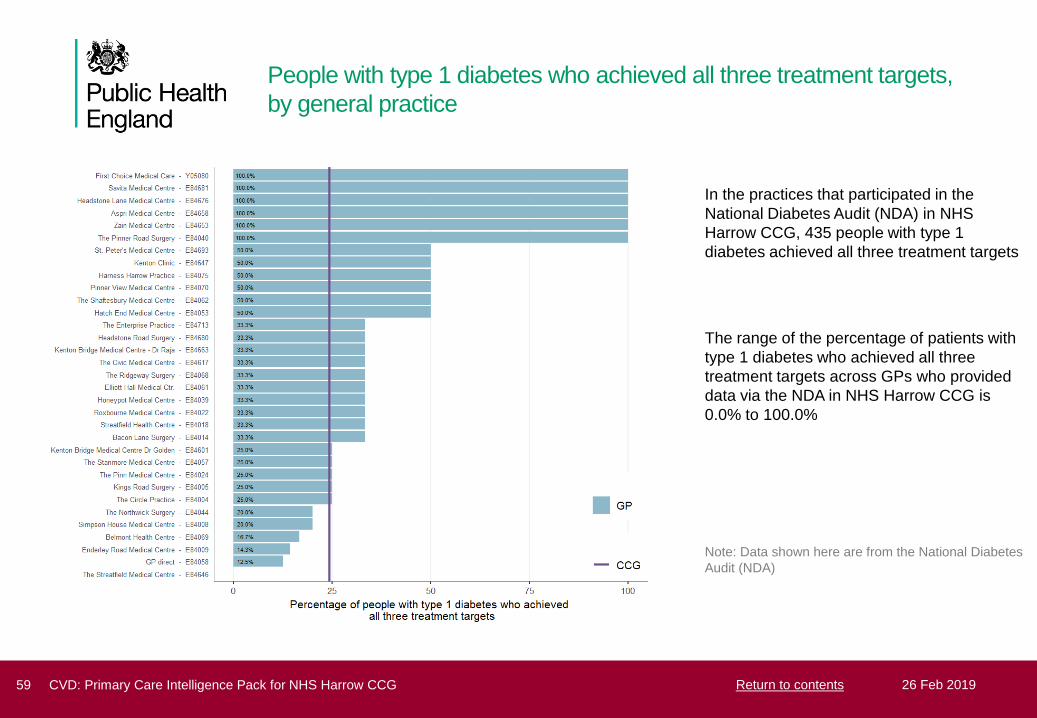
People with type 1 diabetes who achieved all three treatment targets,
by general practice
In the practices that participated in the
National Diabetes Audit (NDA) in NHS
Harrow CCG, 435 people with type 1
diabetes achieved all three treatment targets
The range of the percentage of patients with
type 1 diabetes who achieved all three
treatment targets across GPs who provided
data via the NDA in NHS Harrow CCG is
0.0% to 100.0%
Note: Data shown here are from the National Diabetes
Audit (NDA)
59 CVD: Primary Care Intelligence Pack for NHS Harrow CCG 26 Feb 2019Return to contents

People with type 2 diabetes who achieved all three treatment targets,
by general practice
In the practices that participated in the
National Diabetes Audit (NDA) in NHS
Harrow CCG, 10,035 people with type 2
diabetes achieved all three treatment targets
The range of the percentage of patients with
type 2 diabetes who achieved all three
treatment targets across GPs who provided
data via the NDA in NHS Harrow CCG is
31.4% to 56.7%
Note: Data shown here are from the National Diabetes
Audit (NDA)
60 CVD: Primary Care Intelligence Pack for NHS Harrow CCG 26 Feb 2019Return to contents

Chronic Kidney Disease
61 CVD: Primary Care Intelligence Pack for NHS Harrow CCG 26 Feb 2019Return to contents

Management of Chronic Kidney
Disease
Chronic Kidney Disease can
progress to kidney failure and it
substantially increases the risk
of heart attack and stroke.
Late diagnosis of CKD is common.
Around a third of people with CKD are undiagnosed. More
opportunistic testing and improved uptake of the NHS Health Check
will increase detection rates.
What questions can we ask in our CCG?
1. For each indicator how wide is the variation in achievement?
2. How many people would benefit if all practices performed
as well as the best?
3. How can we support practices who are average and below
average to perform as well as the best in:
- detection of CKD
- more systematic delivery of evidenced based care
What might help?
1. Support practices to share audit data and systematically identify
gaps and opportunities for improved detection and management of
CKD
2. Promote uptake of and follow up from the NHS Health Check to
aid detection and management of CKD
3. Offer local training and education in the detection and
management of CKD
Chronic Kidney Disease (CKD) is common.
It is one of the commonest co-morbidities and affects a third
of people over 75. In 2010 it was estimated to cost the
NHS around GBP 1.5 bn. Average length of stay in hospital
tends to be longer and outcomes are considerably worse:
approximately 7,000 excess strokes and 12,000 excess
heart attacks occur each year in people with CKD
compared to those without.
Individuals with CKD are also at much higher risk of
developing acute kidney injury when they have an
intercurrent illness such as pneumonia.
Evidence based guidance from NICE highlights CVD risk
reduction, good blood pressure control and management of
proteinuria as essential steps to reduce the risk of
cardiovascular events and progression to kidney failure.
62 CVD: Primary Care Intelligence Pack for NHS Harrow CCG 26 Feb 2019Return to contents

Chronic kidney disease (CKD) observed prevalence compared with
expected prevalence (2011), by CCGs in the STP
The ratio of those diagnosed with chronic
kidney disease versus those expected to
have chronic kidney disease in NHS Harrow
CCG is 0.44. This compares to 0.67 for
England
This suggests that 44% of people with
chronic kidney disease in NHS Harrow CCG
have been diagnosed
Note: This slide compares the prevalence of CKD
recorded in QOF in 2017/18 to the expected
prevalence of CKD produced by the University of
Southampton in 2011. The 2011 estimates are the
most recent available and are currently under review A
small number of CCGs have a ratio greater than 1. It is
unlikely that all people with CKD will be diagnosed in
any CCG and therefore a ratio greater than 1 suggests
that the figures are underestimating the true CKD
prevalence in the area. These ratios should be taken
as an indication of the comparative scale of
undiagnosed CKD rather than absolute figures.
63 CVD: Primary Care Intelligence Pack for NHS Harrow CCG 26 Feb 2019Return to contents

Chronic kidney disease (CKD) observed prevalence compared with
expected prevalence (2011), by similar CCGs
Note: This slide compares the prevalence of CKD
recorded in QOF in 2017/18 to the expected
prevalence of CKD produced by the University of
Southampton in 2011. The 2011 estimates are the
most recent available and are currently under review A
small number of CCGs have a ratio greater than 1. It is
unlikely that all people with CKD will be diagnosed in
any CCG and therefore a ratio greater than 1 suggests
that the figures are underestimating the true CKD
prevalence in the area. These ratios should be taken
as an indication of the comparative scale of
undiagnosed CKD rather than absolute figures.
64 CVD: Primary Care Intelligence Pack for NHS Harrow CCG 26 Feb 2019Return to contents

Chronic kidney disease (CKD) observed prevalence, by general
practice
The range of observed CKD prevalence
across GPs in NHS Harrow CCG is 0.4% to
4.6%
Note: The observed prevalence represents the
proportion of patients aged 18 years and over, who
have a diagnosis of CKD recorded on the practice
CKD register.
65 CVD: Primary Care Intelligence Pack for NHS Harrow CCG 26 Feb 2019Return to contents

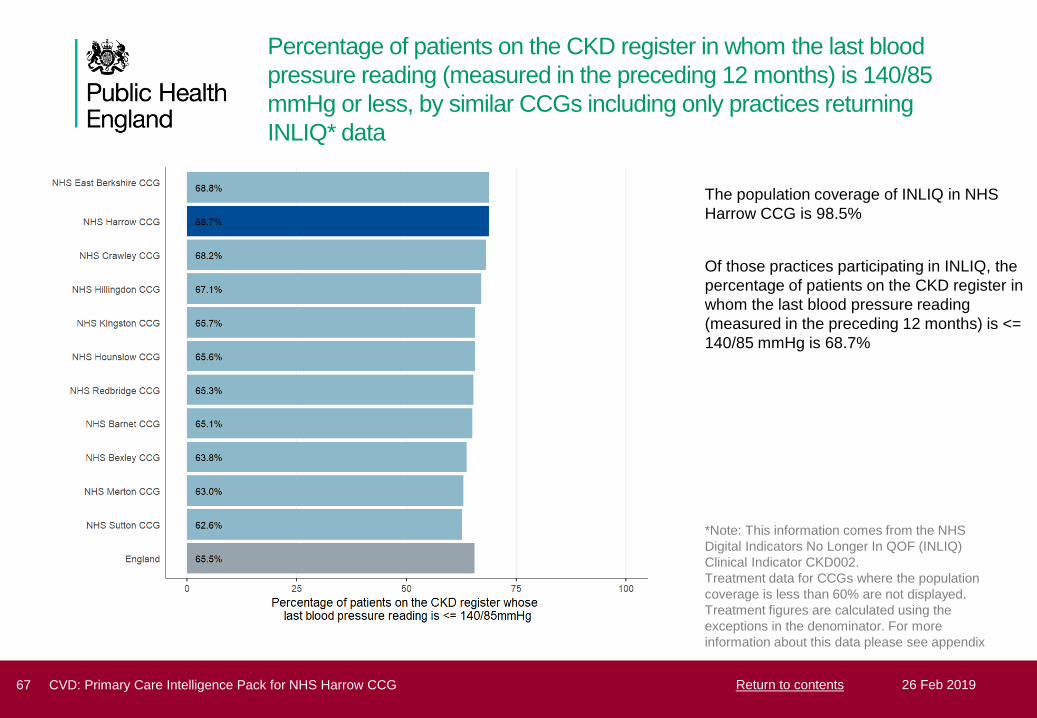
Percentage of patients on the CKD register in whom the last blood
pressure reading (measured in the preceding 12 months) is 140/85
mmHg or less, by CCGs in the STP including only practices returning
INLIQ* data
The population coverage of INLIQ in NHS
Harrow CCG is 98.5%
Of those practices participating in INLIQ, the
percentage of patients on the CKD register in
whom the last blood pressure reading
(measured in the preceding 12 months) is <=
140/85 mmHg is 68.7%
*Note: This information comes from the NHS
Digital Indicators No Longer In QOF (INLIQ)
Clinical Indicator CKD002.
Treatment data for CCGs where the population
coverage is less than 60% are not displayed.
Treatment figures are calculated using the
exceptions in the denominator. For more
information about this data please see appendix
66 CVD: Primary Care Intelligence Pack for NHS Harrow CCG 26 Feb 2019Return to contents
Percentage of patients on the CKD register in whom the last blood
pressure reading (measured in the preceding 12 months) is 140/85
mmHg or less, by similar CCGs including only practices returning
INLIQ* data
The population coverage of INLIQ in NHS
Harrow CCG is 98.5%
Of those practices participating in INLIQ, the
percentage of patients on the CKD register in
whom the last blood pressure reading
(measured in the preceding 12 months) is <=
140/85 mmHg is 68.7%
*Note: This information comes from the NHS
Digital Indicators No Longer In QOF (INLIQ)
Clinical Indicator CKD002.
Treatment data for CCGs where the population
coverage is less than 60% are not displayed.
Treatment figures are calculated using the
exceptions in the denominator. For more
information about this data please see appendix
67 CVD: Primary Care Intelligence Pack for NHS Harrow CCG 26 Feb 2019Return to contents
Percentage of patients on the CKD register with hypertension and
proteinuria who are currently treated with renin-angiotensin system
antagonists, by CCGs in the STP including only practices returning
INLIQ* data
The population coverage of INLIQ in NHS
Harrow CCG is 98.5%
Of those practices participating in INLIQ, the
percentage of patients on the CKD register
with hypertension and proteinuria who are
currently treated with renin-angiotensin
system antagonists is 74.8%
*Note: This information comes from the NHS
Digital Indicators No Longer In QOF (INLIQ)
Clinical Indicator CKD003/NM84.
Treatment data for CCGs where the population
coverage is less than 60% are not displayed.
Treatment figures are calculated using the
exceptions in the denominator. For more
information about this data please see appendix
68 CVD: Primary Care Intelligence Pack for NHS Harrow CCG 26 Feb 2019Return to contents

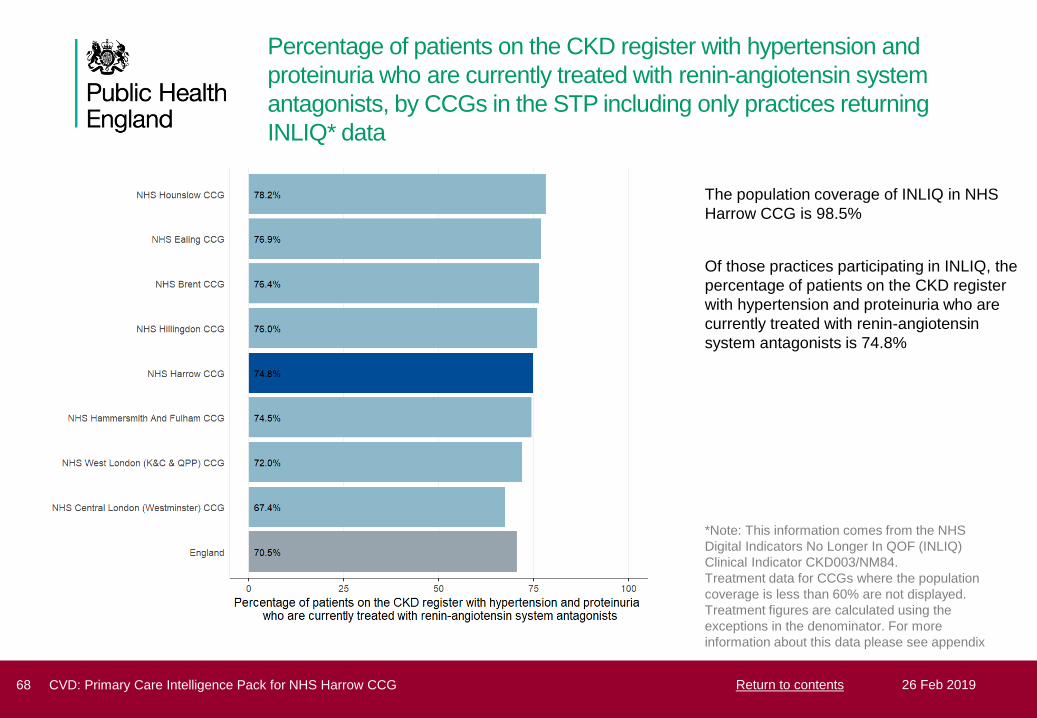
Percentage of patients on the CKD register with hypertension and
proteinuria who are currently treated with renin-angiotensin system
antagonists, by similar CCGs including only practices returning INLIQ*
data
The population coverage of INLIQ in NHS
Harrow CCG is 98.5%
Of those practices participating in INLIQ, the
percentage of patients on the CKD register
with hypertension and proteinuria who are
currently treated with renin-angiotensin
system antagonists is 74.8%
*Note: This information comes from the NHS
Digital Indicators No Longer In QOF (INLIQ)
Clinical Indicator CKD003/NM84.
Treatment data for CCGs where the population
coverage is less than 60% are not displayed.
Treatment figures are calculated using the
exceptions in the denominator. For more
information about this data please see appendix
69 CVD: Primary Care Intelligence Pack for NHS Harrow CCG 26 Feb 2019Return to contents

Heart
70 CVD: Primary Care Intelligence Pack for NHS Harrow CCG 26 Feb 2019Return to contents

Management of Heart Disease
Premature death and disability in
people with CHD can be reduced
significantly by systematic evidence
based management in primary careWhat questions should we ask in our CCG?
1. For each indicator how wide is the variation in
detection, and treatment?
2. How many people would benefit if all practices
performed as well as the best?
3. How can we support practices who are average and
below average to perform as well as the best in:
- more systematic delivery of evidence based care for
people with CHD
- improved detection and management of heart failure
What might help?
1. Roll out of GRASP-Heart Failure audit tool that
identifies people with heart failure who are
undiagnosed or under-treated
2. Education for health professionals to promote evidence
based management of CHD and high quality
measurement of blood pressure
3. Ensure access to rapid access diagnostic clinics and
specialist support for management of angina and heart
failure
4. Ensure access to cardiac rehabilitation for individuals
with CHD and heart failure
Coronary Heart Disease is one of the principal causes of premature
death and disability. The key elements of management for an individual
who has already had a heart attack or angina are symptom control and
secondary prevention of further cardiovascular events and premature
mortality. There is robust evidence to support the use of anti-platelet
treatment, statins, beta-blockers (BB) and angiotensin converting
enzyme inhibitors (ACE/I) or angiotensin receptor blockers (ARBs).
There is also robust evidence to support good control of blood pressure.
Each of these interventions is incentivised in QOF but variation in
achievement reporting at practice level shows that there is often
considerable potential for improving management and outcomes.
Heart failure is a common and an important complication of coronary
heart disease and other conditions. Appropriate treatment including up-
titration of ace inhibitors and beta blockers in heart failure due to left
ventricular systolic dysfunction (LVSD) can significantly improve
symptom control and quality of life and improve outcomes for patients.
Despite this, around a quarter of people with heart failure are undetected
and untreated.There is significant variation in the quality of care of
those who are diagnosed.
71 CVD: Primary Care Intelligence Pack for NHS Harrow CCG 26 Feb 2019Return to contents

Heart failure prevalence, by CCGs in the STP
Heart failure prevalence in NHS Harrow CCG
is 0.68% compared with 0.83% in England
Note: Using QOF clinical indicator HF001
72 CVD: Primary Care Intelligence Pack for NHS Harrow CCG 26 Feb 2019Return to contents

Heart failure prevalence, by similar CCGs
Note: Using QOF clinical indicator HF001
73 CVD: Primary Care Intelligence Pack for NHS Harrow CCG 26 Feb 2019Return to contents

Heart failure prevalence, by general practice
There are 1,823 people with diagnosed heart
failure in NHS Harrow CCG
The range of heart failure prevalence across
GPs in NHS Harrow CCG is 0.2% to 1.6%
Note: Using QOF clinical indicator HF001
74 CVD: Primary Care Intelligence Pack for NHS Harrow CCG 26 Feb 2019Return to contents

Percentage of patients with heart failure due to left ventricular systolic
dysfunction (LVSD) who are treated with ACE-I/ ARB, by CCGs in the
STP
366 people have heart failure with LVSD in
NHS Harrow CCG
Of these, 289 (79.0%) people are treated with
ACE-I or ARB
77 (21.0%) people (including excepted cases)
are NOT treated with ACE-I or ARB
Note: Using QOF clinical indicator HF003
denominator plus exceptions
75 CVD: Primary Care Intelligence Pack for NHS Harrow CCG 26 Feb 2019Return to contents

Percentage of patients with heart failure due to left ventricular systolic
dysfunction (LVSD) who are treated with ACE-I/ ARB, by similar CCGs
Note: Using QOF clinical indicator HF003
denominator plus exceptions
76 CVD: Primary Care Intelligence Pack for NHS Harrow CCG 26 Feb 2019Return to contents

Percentage of patients with heart failure due to left ventricular systolic
dysfunction (LVSD) who are NOT treated with ACE-I / ARB, by general
practice
In total, including excepted cases, there are
77 people who are NOT treated with ACE-I or
ARB
The range of the percentage of patients with
heart failure due to LVSD who are NOT
treated with ACE-I or ARB across GPs in
NHS Harrow CCG is 0.0% to 100.0%
The data labels on the chart refer to the total
count of people who are not treated with ACE-I or
ARB, including excepted cases, by general
practice
Note: Using QOF clinical indicator HF003
denominator plus exceptions
77 CVD: Primary Care Intelligence Pack for NHS Harrow CCG 26 Feb 2019Return to contents

Percentage of patients with heart failure due to left ventricular systolic
dysfunction (LVSD) who are treated with ACE-I/ ARB and BB, by
CCGs in the STP
289 people with heart failure with LVSD are
treated with ACE-I/ARB in NHS Harrow CCG
Of these, 228 (78.9%) people are additionally
treated with a beta blocker (BB)
61 (21.1%) people (including excepted cases)
are NOT additionally treated with BB
Note: Using QOF clinical indicator HF004
denominator plus exceptions
78 CVD: Primary Care Intelligence Pack for NHS Harrow CCG 26 Feb 2019Return to contents

Percentage of patients with heart failure due to left ventricular systolic
dysfunction (LVSD) who are treated with ACE-I/ ARB and BB, by
similar CCGs
Note: Using QOF clinical indicator HF004
denominator plus exceptions
79 CVD: Primary Care Intelligence Pack for NHS Harrow CCG 26 Feb 2019Return to contents

Percentage of patients with heart failure due to left ventricular systolic
dysfunction (LVSD) who are treated with ACE-I or ARB, but NOT also
with a BB, by general practice
In total, including excepted cases, there are
61 people with heart failure due to LVSD who
are treated with ACE-I or ARB, but NOT
additionally with a BB
The range of the percentage of patients with
heart failure due to LVSD who are treated
with ACE-I/ARB but NOT also a BB across
GPs in NHS Harrow CCG is 0.0% to 60.0%
The data labels on the chart refer to the total
count of people with heart failure due to LVSD
who are treated with ACE-I or ARB, but not also
with a BB, including excepted cases, by general
practice
Note: Using QOF clinical indicator HF004
denominator plus exceptions
80 CVD: Primary Care Intelligence Pack for NHS Harrow CCG 26 Feb 2019Return to contents

Percentage of patients with CHD whose blood pressure reading
(measured in the preceding 12 months) is 150/90 mmHg or less, by
CCGs in the STP
There are 7,302 people with coronary heart
disease in NHS Harrow CCG
Of these, 6,573 (90.0%) people have blood
pressure <= 150/90
729 (10.0%) people (including excepted
cases) have blood pressure that is NOT <=
150/90
Note: Using QOF clinical indicator CHD002
denominator plus exceptions
81 CVD: Primary Care Intelligence Pack for NHS Harrow CCG 26 Feb 2019Return to contents
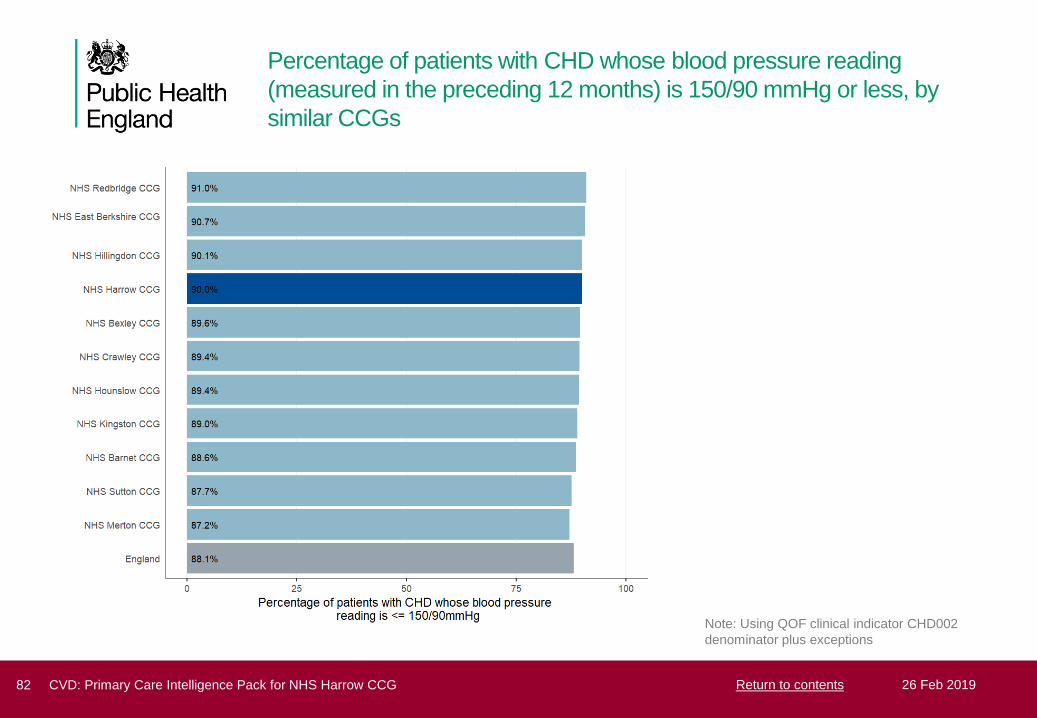
Percentage of patients with CHD whose blood pressure reading
(measured in the preceding 12 months) is 150/90 mmHg or less, by
similar CCGs
Note: Using QOF clinical indicator CHD002
denominator plus exceptions
82 CVD: Primary Care Intelligence Pack for NHS Harrow CCG 26 Feb 2019Return to contents

Percentage of patients with CHD whose blood pressure reading
(measured in the preceding 12 months) is NOT 150/90 mmHg or less,
by general practice
In total, including excepted cases, there are
729 people whose blood pressure is NOT <=
150/90
The range of the percentage of patients with
CHD whose blood pressure reading is NOT
<= 150/90 across GPs in NHS Harrow CCG
is 1.0% to 31.9%
The data labels on the chart refer to the total
count of people whose blood pressure is not
<=150/90, including excepted cases, by general
practice
Note: Using QOF clinical indicator CHD002
denominator plus exceptions
83 CVD: Primary Care Intelligence Pack for NHS Harrow CCG 26 Feb 2019Return to contents

Percentage of patients with CHD with a record in the preceding 12
months that aspirin, an alternative anti-platelet therapy, or an anti-
coagulant is being taken, by CCGs in the STP
There are 7,302 people with coronary heart
disease in NHS Harrow CCG
Of these, 6,787 (92.9%) people are recorded
as taking aspirin, an alternative anti-platelet
therapy or an anticoagulant
515 (7.1%) people (including excepted cases)
are NOT recorded as taking aspirin, an
alternative anti-platelet therapy, or an anti-
coagulant
Note: Using QOF clinical indicator CHD005
denominator plus exceptions
84 CVD: Primary Care Intelligence Pack for NHS Harrow CCG 26 Feb 2019Return to contents
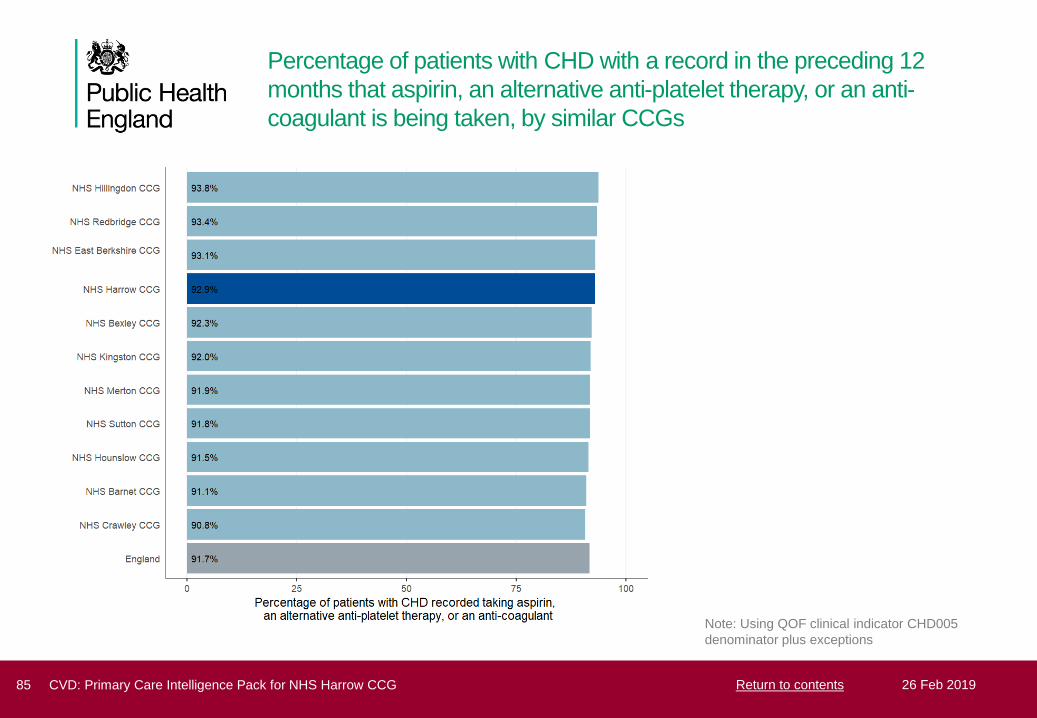
Percentage of patients with CHD with a record in the preceding 12
months that aspirin, an alternative anti-platelet therapy, or an anti-
coagulant is being taken, by similar CCGs
Note: Using QOF clinical indicator CHD005
denominator plus exceptions
85 CVD: Primary Care Intelligence Pack for NHS Harrow CCG 26 Feb 2019Return to contents

Percentage of patients with CHD without a record in the preceding 12
months that aspirin, an alternative anti-platelet therapy, or an anti-
coagulant is being taken, by general practice
In total, including excepted cases, there are
515 people NOT recorded as taking aspirin,
an alternative anti-platelet therapy, or an anti-
coagulant
The range of the percentage of patients with
CHD NOT recorded taking aspirin, an
alternative anti-platelet therapy, or an anti-
coagulant across GPs in NHS Harrow CCG is
0.0% to 19.3%
The data labels on the chart refer to the total
count of people who are not recorded as taking
aspirin, an alternative anti-platelet therapy, or an
anti-coagulant, including excepted cases, by
general practice
Note: Using QOF clinical indicator CHD005
denominator plus exceptions
86 CVD: Primary Care Intelligence Pack for NHS Harrow CCG 26 Feb 2019Return to contents
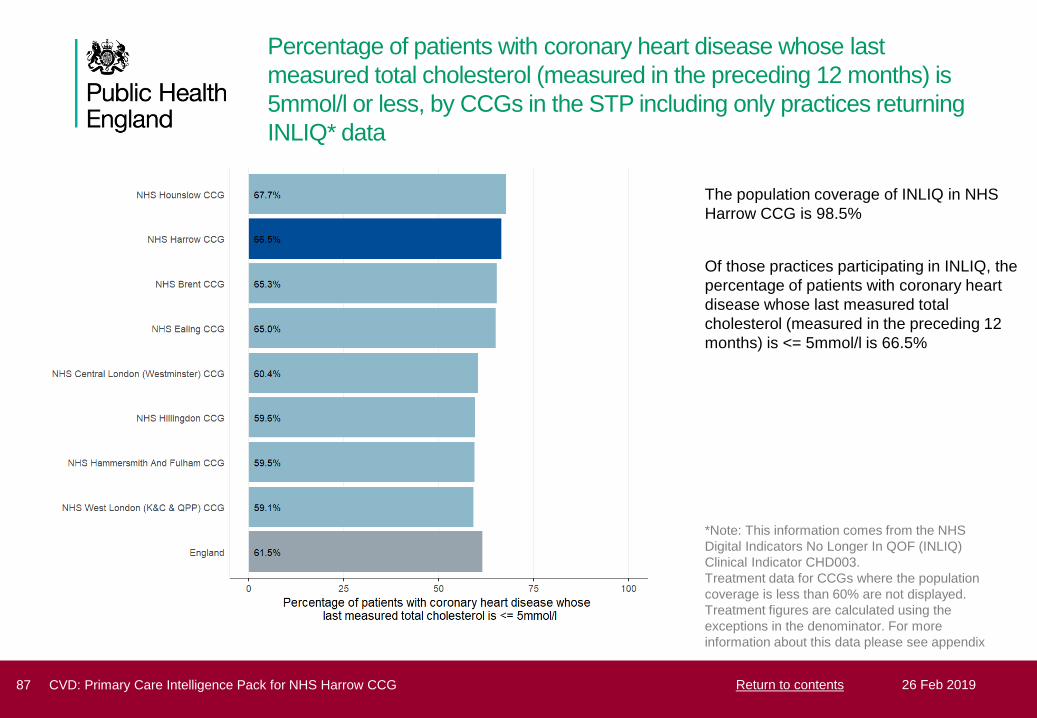
Percentage of patients with coronary heart disease whose last
measured total cholesterol (measured in the preceding 12 months) is
5mmol/l or less, by CCGs in the STP including only practices returning
INLIQ* data
The population coverage of INLIQ in NHS
Harrow CCG is 98.5%
Of those practices participating in INLIQ, the
percentage of patients with coronary heart
disease whose last measured total
cholesterol (measured in the preceding 12
months) is <= 5mmol/l is 66.5%
*Note: This information comes from the NHS
Digital Indicators No Longer In QOF (INLIQ)
Clinical Indicator CHD003.
Treatment data for CCGs where the population
coverage is less than 60% are not displayed.
Treatment figures are calculated using the
exceptions in the denominator. For more
information about this data please see appendix
87 CVD: Primary Care Intelligence Pack for NHS Harrow CCG 26 Feb 2019Return to contents

Percentage of patients with coronary heart disease whose last
measured total cholesterol (measured in the preceding 12 months) is
5mmol/l or less, by similar CCGs including only practices returning
INLIQ* data
The population coverage of INLIQ in NHS
Harrow CCG is 98.5%
Of those practices participating in INLIQ, the
percentage of patients with coronary heart
disease whose last measured total
cholesterol (measured in the preceding 12
months) is <= 5mmol/l is 66.5%
*Note: This information comes from the NHS
Digital Indicators No Longer In QOF (INLIQ)
Clinical Indicator CHD003.
Treatment data for CCGs where the population
coverage is less than 60% are not displayed.
Treatment figures are calculated using the
exceptions in the denominator. For more
information about this data please see appendix
88 CVD: Primary Care Intelligence Pack for NHS Harrow CCG 26 Feb 2019Return to contents

Cardiovascular disease outcomes
89 CVD: Primary Care Intelligence Pack for NHS Harrow CCG 26 Feb 2019Return to contents

Hospital admissions for coronary heart disease for all ages
In NHS Harrow CCG, the hospital admission
rate for coronary heart disease in 2017/18
was 608.8 per 100,000 population (1,270
admissions), compared with 502.3 for
England
Source: Hospital Episode Statistics (HES), 2003/04 to 2017/18, Copyright ©, 2019 Re-used with the permission of NHS Digital. All rights
reserved
90 CVD: Primary Care Intelligence Pack for NHS Harrow CCG 26 Feb 2019Return to contents

Hospital admissions for stroke for all ages
In NHS Harrow CCG, the hospital admission
rate for stroke in 2017/18 was 150.0 per
100,000 population (316 admissions),
compared with 169.0 for England
Source: Hospital Episode Statistics (HES), 2003/04 to 2017/18, Copyright ©, 2019 Re-used with the permission of NHS Digital. All rights
reserved
91 CVD: Primary Care Intelligence Pack for NHS Harrow CCG 26 Feb 2019Return to contents

Additional risk of complications for people with diabetes, one-year
follow up
For people with diabetes in NHS Harrow
CCG:
• The additional risk of a stroke was
44.5% higher
• The additional risk of a myocardial
infarction was 100.5% higher
• The additional risk of angina was
120.7% higher
• The additional risk of renal replacement
therapy was 268.6% higher
• The additional risk of heart failure was
116.9% higher
Note: This slide uses data from the National Diabetes
Audit (NDA)
92 CVD: Primary Care Intelligence Pack for NHS Harrow CCG 26 Feb 2019Return to contents

Deaths from coronary heart disease, under 75s
In NHS Harrow CCG, the early mortality rate
for coronary heart disease during 2015-2017
was 32.9 per 100,000 population, compared
with 38.7 for England
Source: Office for National Statistics (ONS) mortality data, 2003/05 to 2015/17, © Crown copyright, 2019 Re-used with the permission of the
Office for National Statistics. All rights reserved
93 CVD: Primary Care Intelligence Pack for NHS Harrow CCG 26 Feb 2019Return to contents

Deaths from stroke, under 75s
In NHS Harrow CCG, the early mortality rate
for stroke during 2015-2017 was 9.68 per
100,000 population, compared with 13.0 for
England
Source: Office for National Statistics (ONS) mortality data, 2003/05 to 2015/17, © Crown copyright, 2019 Re-used with the permission of the
Office for National Statistics. All rights reserved
94 CVD: Primary Care Intelligence Pack for NHS Harrow CCG 26 Feb 2019Return to contents

Appendix - INLIQ data
Indicators no longer in QOF:
Since 2014/15 several CVD related indicators have been removed from the Quality and Outcomes Framework. The indicators are referred to
as indicators no longer in QOF (INLIQ). Despite no longer being included in the QOF, NHS Digital collect and publish data on the coverage
and treatment levels for these indicators. The GP contract 2017/18 has recommended the continuation of this INLIQ data collection, and
practices are contractually required from 2017 to allow collection of data for a selection of activity no longer incentivised through QOF.
Despite these treatment measures no longer being incentivised in QOF, the Department of Health and Social Care, Public Health England
and other healthcare groups have indicated that the information linked to these indicators is essential for their work and wider healthcare
programmes. The indicators in this pack are HYP003, STIA004, STIA005, CHD003, CKD002 and CKD003/(NM84).
The INLIQ data collection is classified as an experimental statistic. This means that the data are in a testing phase and are not yet fully
developed. There are differences in the data collection for the INLIQ indicators which make comparison with previous years QOF treatment
outcomes data invalid. Not all practices currently submit INLIQ information; the approximate coverage (the proportion of people served by a
practice that submits INLIQ information) is 81% of the population and 78.4% of practices. This population coverage varies at CCG level.
In this pack we have reported the treatment measures only in CCGs with population coverage of 60% or more and the information for the
CCGs with lower coverage is not displayed. The 60% level has been selected as an arbitrary figure, as there is no precedent to show if this
level is either high enough to guarantee that the INLIQ subset represent the CCG as a whole, or conversely whether coverage figures lower
than 60% are sufficient to represent the CCG as a whole. Therefore to aid interpretation of the data we have presented the coverage figures
for each CCG and it is important to bear this coverage figure in mind when interpreting local figures. Please contact the NCVIN for further
details.
The original source for this data is NHS digital and available from:https://digital.nhs.uk/data-and-information/publications/statistical/gp-contract-services
To be consistent with current PHE QOF reporting practice, when calculating INLIQ treatment figures, people excepted from the INLIQ
indicator are included in the population denominator. In the original NHS Digital published data on the link above, for some indicators the
exceptions also included those not eligible for the interventions by virtue of their age or the characteristics of the disease (exclusions). In this
pack this affects indicators STIA005 and CKD003.
95 CVD: Primary Care Intelligence Pack for NHS Harrow CCG 26 Feb 2019Return to contents
Appendix - Data sources
Figures and information throughout the intelligence pack are sourced from the following references:
• Quality and Outcomes Framework (QOF), 2017/18, © Crown copyright, 2019, Re-used with the permission of NHS Digital. All rights
reserved
• Non-diabetic hyperglycaemia prevalence estimates, NCVIN, PHE:
https://www.gov.uk/government/publications/nhs-diabetesprevention-programme-non-diabetic-hyperglycaemia
• Diabetes prevalence estimates, NCVIN, PHE:
https://www.gov.uk/government/publications/diabetes-prevalence-estimates-forlocal-populations
• CKD Prevalence model, G.Aitken, University of Southampton , 2014:
https://www.gov.uk/government/publications/ckdprevalence-estimates-for-local-and-regional-populations
• NHS Stop smoking services, © Crown copyright, 2019, Re-used with the permission of NHS Digital. All rights reserved
• Norberg J, Backstrom S , Jansson J-H, Johansson L. Estimating the prevalence of atrial fibrillation in a general population using
validated electronic health data. Clin Epidemiol 2013 ; 5 475 - 481
• Hex N, Bartlett C, Wright D, Taylor M, Varley D. Estimating the current and future costs of type 1 and type 2 diabetes in the UK,
including direct health costs and indirect societal and productivity costs. Diabet Med 2012 ; 29 855 - 862
• National Diabetes Audit, 2017/18, © Crown copyright, 2019, Re-used with the permission of NHS Digital. All rights reserved
• Hospital Episode Statistics (HES), 2003/04 to 2017/18, Copyright ©, 2019 Re-used with the permission of NHS Digital. All rights
reserved
• Office for National Statistics (ONS) mortality data, 2003/05 to 2015/17, © Crown copyright, 2019 Re-used with the permission of the
Office for National Statistics. All rights reserved
96 CVD: Primary Care Intelligence Pack for NHS Harrow CCG 26 Feb 2019Return to contents
About Public Health EnglandPublic Health England exists to protect and improve the nation's health and wellbeing, and reduce health inequalities. We do this
through world-leading science, knowledge and intelligence, advocacy, partnerships and the delivery of specialist public health
services. We are an executive agency of the Department of Health and Social Care, and a distinct delivery organisation with
operational autonomy. We provide government, local government, the NHS, Parliament, industry and the public with evidence-
based professional, scientific and delivery expertise and support.
Public Health England
Wellington House
133-155 Waterloo Road
London SE1 8UG
Tel: 020 7654 8000
www.gov.uk/pheTwitter: @PHE_ukFacebook: www.facebook.com/PublicHealthEngland
© Crown copyright 2019
You may re-use this information (excluding logos) free of charge in any format or medium, under the terms of the Open
Government Licence v3.0. To view this licence, visit https://www.nationalarchives.gov.uk/doc/open-government-licence/version/3/
or email [email protected]. Where we have identified any third party copyright information you will need to obtain
permission from the copyright holders concerned.
Published 26 Feb 2019
PHE publications gateway number: 2017095
97 CVD: Primary Care Intelligence Pack for NHS Harrow CCG 26 Feb 2019Return to contents