care a lliance paper 1 ; an analysis... · the latest hse monthly report on home care provision,...
TRANSCRIPT
Care �Alliance
IrelandGuiding support for family carers
BriefingPaper 1
June 2016
Analysisof Home Care
Supports Funded bythe HSE 2008–2016
Care �Alliance
Ireland
Estimates vary, but it is considered that upwards of €4bn of care annually is provided by more than 187,000 Family Carers
1. What this Paper Is AboutThis paper seeks to summarise the situation of publicly funded home care over the period 2008–2016. Of particular interest is the overall change to the level of resources being directed to home care in the 2016 HSE Service Plan, in particular the actual number of home care hours to be delivered to those aged 65 and over.
1.1 Background
Much Irish health and social care policy documentation speaks of prioritising resources to enable older people to remain at home, as is almost invariably their wish. Family Carers, assisted by formal public home care provision, traditionally form the bedrock of enabling this policy to be made a reality. Estimates vary, but it is considered that upwards of €4bn of care annually is provided by more than 187,000 Family Carers (Family Carers Ireland, 2016), and approximately €418m of state funding is provided (directly and indirectly) towards funded home care1.
A tradition of ‘home help’ has been in existence for several decades in Ireland, in a less formalised and substantially less remunerated format until more recently. Since 2006, the development of home care packages (and other iterations of home care) has been an increasing part of this picture.
Although Ireland has a young population profile relative to its European peers (Eurostat, 2015), our population is ageing. Notwithstanding the improvement in the health of those 65 and over and specifically the gradual reduction in relative age-specific morbidity, this ageing of the population is putting more pressure on much of the health and social care infrastructure.
1
1 This figure is based on the delivery of an estimated 18.51m home care hours at an estimated cost of €20 per hour, €370m. The HSE has advised that their allocation for home care services in 2016 is €324m. (Pers. Comm. Michael Fitzgerald, Services for Older People, HSE, 23 June 2016). This difference is difficult to explain, but might point to an overestimation on our part of the actual number of home care hours delivered within the Home Care Package area. See later in this report how we generated an estimate of these hours. We understand that no official figures are available regarding the level of tax forgone in respect of the tax relief available for privately delivered home care, but we estimate that 5,000 families benefit from this tax relief to the tune of an average of €9,568 per annum (assuming 20 hours home care per week/1,040 pa, at a cost of €23 per hour, at the 40% marginal rate of tax). This equates to a cost of €48m per year. €23 per hour appears to be a common rate that private providers charge for one hour of home care.

In parallel it also appears that an increasing proportion of health and social care is now being paid for privately (either through health insurance and/or direct payments, albeit with quite generous tax rebates, most noticeably the €75,000 annual tax relief available for nursing and/or home care).
For a qualitative look at older people’s experiences of home care through the eyes of social workers who support them, we encourage you to read the recently published collaborative research report ‘Meeting Older People’s Preferences for Care’ (Donnelly, O’Brien, Begley, & Brennan, 2016). The report’s definition of terms is particularly helpful in understanding this area2.
1.2 Caveats
This paper is not an exhaustive review.
The focus of this paper is publicly funded home care supports for older people (i.e. 65 and older) and does not take account of any provision of home care/independent living support services for those under 65, which are generally captured within a separate HSE disability budget. The 2015 HSE Annual Report states that 1.4 million personal assistant hours and 2.7 million home support hours were provided for persons with disabilities in 2015. This compares with an estimated 18.4m home care hours provided in 2015 for those aged 65 and over.
This paper does not take account of the overall provision of respite care, defined as publicly funded out-of-home care, generally in institutions. Again, the 2015 HSE Annual Report indicates that in the region of 180,000 respite overnights were provided for almost 6,000 persons with disabilities (Health Service Executive, 2016b).
We also acknowledge that a number of not-for-profit organisations deliver valuable home-based respite care, particularly to older people, often funded in part by public
22 The definition of terms is presented in Appendix I, taken significantly but not exclusively from Donnelly et al (2016).
This ageing of the population is putting more pressure on much of the health and social care infrastructure
Care �Alliance
Ireland
3
3 Pers. Comm. Michael Fitzgerald, Services for Older People, HSE, 23 June 2016. This figure refers to the contracted provision by just one not-for-profit organisation, Family Carers Ireland. We are aware of other not-for-profit organisations who deliver home based respite care, for example The Alzheimer Society of Ireland who reported delivering 166,000 hours of respite care in 2014. We do not know the total quantum of such care delivered nationally or indeed the degree to which these supports are financed by state funds. (Ref: The Alzheimer Society of Ireland Directors Report and Financial Statements, 2014)4 Pers. Comm. Michael Fitzgerald, Services for Older People, HSE, 23 June 2016.
donations or self-funded by families. Time constraints in the preparation of this paper meant that it was not possible to establish whether this type of home-based care is captured in the HSE service targets/reports for home care provision. We make the assumption that it is not. We understand that several hundred thousand home based respite hours are being funded by the HSE in 20163.
In recent years, it appears that there have been adjustments to how the delivery of institutional and other respite care is measured by the HSE; it was not possible, therefore, to make accurate assessments of the changes in the overall quantum and availability of such support.
1.3 Assumptions
A number of what we believe to be reasonable assumptions are made in this paper; these include but are not limited to the following:
A number of not-for-profit organisations deliver valuable home-based respite care, particularly to older people, often funded in part by public donations or self-funded by families
1.3.1 The average cost of publicly delivered home care is €20 per hour4. This includes the blended costs of evening, weekend and bank holiday care, sick pay, travel costs and the costs of managing, supervising and training direct home care workers. While some have estimated the cost at less than this, we believe that lower estimates do not take account of pension costs and other ancillary costs (Leo Varadkar, 2015). If anything, we believe this €20 estimate to be a very conservative one. Rates for home care in the private sector can often be as high as €25 per hour, with a minimum hours requirement to make the service commercially viable.
1.3.2 Based on our understanding of the sector and on consultation with some service providers, we are assuming that an average home care package
From 2008 to 2012, the number of hours delivered in the traditional home help format has reduced by 17% while the number of home care hours delivered through home care packages (HCPs) has increased significantly.... This shift away from home help to other forms of home care delivery complicates any analysis of the overall level of home care support delivered
45 Pers. Comm. Michael Fitzgerald, Services for Older People, HSE, 23 June 2016.
equates to approximately 10 hours of care per week (500 hours per year). We did request official figures from the HSE but were advised that whilst this information is held locally, that the cost of formally gathering figures nationally would require considerable resources5.
1.3.3 Recent HSE publications (2015, Appendix II) use the term ‘Existing Level of Services’ (ELS). We understand this to mean the delivery of a similar level of service to the same percentage of a particular population (a pertinent example is, say, if 8% of those aged 65 received home care in 2015, what extra provision is required to ensure that 8% receive the same service in 2016, allowing for changes in population levels between 2015 and 2016). We believe this term to be a good proxy for measuring the concept of public accessibility of a particular service, in this case home care.
2. Key Themes
2.1 Home Help on a Downward Trajectory – Shift Towards Home Care Packages
From 2008 to 2012, the number of hours delivered in the traditional home help format has reduced by 17% (from 12.6m hours in 2008 to a projected 10.44m hours in 2016) (Health Service Executive, 2009b) while the number of home care hours delivered through home care packages (HCPs) has increased significantly. (For example, in 2008 there were 8,990 individuals receiving HCPs at year-end; in 2016 the target is 15,450 (Health Service Executive, 2009b, 2016)). This shift away from home help to other forms of home care delivery complicates any analysis of the overall level of home care support delivered.
Care �Alliance
Ireland
2.2 Managing Expectations and Budgetary Overruns
Budgetary overruns are a recurring theme in public health and social care delivery, most noticeably in the acute hospital sector, and to a lesser degree in the home care sector6. This is not unique to Ireland7. It would seem that targets at the beginning of the year for delivery of home care are sometimes set somewhat artificially low to make room for ‘upward adjustments’ as the year progresses (for example, the 2014 and 2015 outturns for HCPs were 21% and 11% above target (Health Service Executive, 2015a, 2016)). Our understanding is that these large variances are accounted for in part by additional resources being allocated during the year to support the reduction in delayed hospital discharges, as well as improved economic exchequer figures which made the release of additional resources as the year progressed more feasible.
2.3 Inconsistency in Use of Metrics
We believe that one of the most objective ways for measuring service level and availability is the actual number of hours of home care delivered over the period of one year, in particular when measuring changes in provision over a number of years. This has been the standard metric used by the HSE when describing home help, but not in the area of home care packages. While we appreciate that HCPs are more than just home care, the home care element is likely to be the most meaningful aspect in relation to assessing levels of overall community care support for vulnerable older people. The latest HSE monthly report on home care provision, reporting on February 2016 outturns, rather unhelpfully reports on home care support provision in two separate ways; specifically it reports on the accumulated number of hours of home help delivered year to date, and the number of individuals in receipt of a home care package (monthly) (Health Service Executive, 2016). While the development of more comprehensive holistic supports is very welcome (in terms of community occupational therapy, physiotherapy, podiatry, etc.), the availability of someone in the home on a daily/weekly basis to help keep the person in need of care well and independent is always likely to be considered the key measurement of service availability and delivery.
5
6 For example the HSE 2015 Annual Report points to a €200m budgetary overrun for hospitals but only €34.5m for social care and disabilities (Health Service Executive, 2016b)7 The UK NHS reported a budget overspend of £2.45bn in 2015, or about 2%. Annual HSE budgetary overruns (defined as the difference between year-end outturn and original budgetary allocation) in recent years appear to be higher as a percentage of overall spend, peaking at 5% in 2015 (Campbell, 2015a; Irish Fiscal Advisory Council, 2015).
This shift away from home help to other forms of home care delivery complicates any analysis of the overall level of home care support delivered
6
Accurate analysis over time is also complicated by frequent references to home help (HH) and home care packages in isolation, without reference to each other, and more recently references to intensive home care packages (IHCP), transitional care (TC) and delayed discharge initiatives.
There is some evidence that the actual number of hours of home help per client has reduced materially over the years. In 2000, the figure was estimated at eight hours per client per week (Mercer Ireland, 2002); the 2016 HSE targets suggest a figure of a little over four hours per client per week. This raises the question of the adequacy of provision at an individual level and may point to the apparent increase in the use of short 15/30-minute home care visits, something that has received much negative criticism in the UK in particular (Campbell, 2015b). Further examination of these estimates would be helpful.
2.4 The Significance of Demographics
Demographics provide an important context, in particular in light of the ageing population profile emerging and specifically the increase in those aged 85 and over. Each year there is in the region of a 3.1% increase in those aged 65 and over and a 4.5% increase in those aged 85 and over (Health Service Executive, 2015a, 2015b).
The demographic trends mean that while the same volume of home care may be provided from one year to the next, it must be shared amongst a greater number of people. This is the case in particular for those aged 85 and over, whose level
Each year there is in the region of a 3.1% increase in those aged 65 and over and a 4.5% increase in those aged 85 and over
There is some evidence that the actual number of hours of home help per client has reduced materially over the years

Care �Alliance
Ireland
7
8 “Around 16,000 older people received a home help service in 2000. Each recipient received, on average, eight hours help per week.” (Mercer Ireland, 2002; p43) This would equate to 6.65m hours per year in 2000. In 2016 the target for HSE provision is 18.51m hours of home care (our estimate, including Home Care Packages and Intensive Home Care Packages). This equates to a 178% increase, not a quadrupling. In 2016 the HSE plans to deliver home care supports to approximately 63,000 people, which we estimate equates to an average of 5.6 hrs per person per week, a per person reduction in hours delivered of almost one-third since 2000, assuming the Mercer estimate was accurate. As Home Care Packages tend to be more resource intensive than home help, the actual number of weekly hours provided per client is likely to be lower. Indeed, tthe 2015 home help figures of 10.3m hours delivered to 47,061 individuals suggests an average of 4.2 hours of home care per week.9 We estimate, using 1996 (414,000) and 2002 (436,000) Census data, that there were 429,000 people aged 65 and over in 2000 (Central Statistics Office, n.d.).
of dependency is greatest. This scenario results in less available home care at an individual (micro) level, while overall provision at the macro level might remain constant or may even increase.
2.5 Access and Utilisation Rates
Utilisation rates, put simply in the context of health and social care, may be described as the percentage of a given population/age group that use a particular service. In the context of home care we believe that accessibility and utilisation can be taken as being equivalent concepts. Accurately assessing home care utilisation rates for those aged 65 and over is difficult, in spite of numerous recent attempts to do so. Timonen et. al. (2012) refer to a 2009 estimated utilisation rate of 12.7%, and reported a near quadrupling of the numbers in receipt of home care since 2000. However, this did not equate to a quadrupling of the volume of care provided8. In fact, comparing 2000 and 2016 figures suggest an increase of approximately 178% in the volume of public home care provided (Mercer Ireland, 2002). While this is indeed a large increase, it occurs in the context of a 45% increase in the number of those aged 65 and over and an even greater increase in the 85 and over age cohort over this period9. It is possible that some of this increase represents step-down care post hospital discharge, although we do not have hard evidence to support this contention. It is also possible that the increase reflects greater use of home care supports by those under 65 years of age. Nonetheless, it does seem that since 2000 there has been a material increase in the volume of home care supports being funded by the State.
Accurately assessing home care utilisation rates for those aged 65 and over is difficult, in spite of numerous recent attempts to do so
8
Previous studies reported in Murphy et. al (2015) found that regional population-based studies have consistently found lower levels of service utilisation than the levels emanating from corresponding health service data. This TILDA study reports a utilisation rate of 8.2% (for the period 2009–2011), which is not consistent with the 10.1% target referenced for 2011 in the 2015 HSE report Planning for Health Trends and Priorities to Inform Health Service Planning 2016 (see Appendix II). This discrepancy is large and warrants further investigation. A reference in the 2009 HSE Service Plan to ‘85% of home help being delivered to older people’(Health Service Executive, 2009a; p39) may partly explain the discrepancy (a material percentage of home help recipients are under 65 years of age).
Another area of concern relates to the apparent ongoing reduction in the number of hours of home care delivered to each client, as referenced earlier in this paper. Excessive reliance on crude absolute utilisation ratios may mask deficits in care provision at an individual level.
Undoubtedly the relatively recent arrival of for-profit home care providers, alongside the enhanced tax relief available for such care, is a not insignificant aspect of overall home care provision. However, details on the quantum of such privately funded care in the overall home care sector are not readily identifiable. Clearly, this private provision would raise the overall utilisation rate.
The sources of, and sustainability of, funding for public provision of home care is an area worthy of consideration into the future. The 2015 review of the Nursing Home Support Scheme (NHSS) touched on this issue, but no clear recommendations were made (Department of Health, 2015).
The sources of, and sustainability of, funding for public provision of home care is an area worthy of consideration into the future
Excessive reliance on crude absolute utilisation ratios may mask deficits in care provision at an individual level
Care �Alliance
Ireland
9
3. What Does the 2016 Service Plan for Home Care Look Like?“The additional funding, while welcome, does not allow the services to keep pace with
the increasing demand and demographic pressures within the community. Specific pressures are evident in the areas of the NHSS scheme, home support and transitional care beds, where the level of provision is directly determined by the funding available.”
HSE Service Plan 2016; p34
“In 2016, in considering the increased demographics and in order to maximise the value of the available resources, the model of provision of home care will be reviewed to
improve and streamline access as well as the quality of the service provision, and this may necessitate maintaining waiting lists for both home help and HCPs in each CHO
{Community Health Organisation}.” HSE Service Plan 2016; p74
The 2016 budget allowed for €210.6m extra resources to be allocated across the HSE, largely to reflect the ageing population (this is known as non-pay funding). However, it appears that none of this extra funding was being allocated to home care. This contrasts sharply with the €14.7m being allocated to address demographic pressures in the Nursing Home Support Scheme. The rationale for this disparity has not been sufficiently articulated by the Department of Health or by the HSE.
Acknowledging the significant extra resources allocated in 2015 to home care provision, this apparent change in priorities for 2016 seems at odds with the stated policy of supporting people to remain in their own homes.
The net allocation for the Nursing Home Support Scheme is to increase by €35m between the figure spent in 2015 and that budgeted for in 2016, whereas there was in fact a planned reduction of €9.9m in expenditure for older people’s services (mostly represented by home care).
These resourcing priorities appear to reflect the firm legislative basis that now exists for nursing home care, and the absence of same for home care.
These resourcing priorities appear to reflect the firm legislative basis that now exists for nursing home care, and the absence of same for home care
As demographic pressures continue unabated, the likely deficit in home care provision will increase significantly in 2016
1010 Pers. Comm. Michael Fitzgerald, Services for Older People, HSE, 23 June 2016
The original 2016 budget allocation does allow for an extra €20m to support hospital discharge, which we have been advised will be used for home care services. We believe that the risk here is that the resources will be used solely for step-down facilities to reduce delayed hospital discharge. If this is the case, then arguably it is not reasonable to describe these as ‘extra’ home care resources, since this spending would be more accurately captured within the acute hospital budget.
The original 2016 Service Plan seeks to deliver the same level of home care supports as delivered in 2015, notwithstanding the concerns raised by the HSE at the time of the announcement in actually delivering this quantum of care within the budget originally allocated. As Table 1 shows, there was a material increase in home care supports delivered in both 2014 and 2015. However, as demographic pressures continue unabated, the likely deficit in home care provision will increase significantly in 2016.
In June 2016 the Minister for Health announced additional funding for the health and social care sector, most specifically €40m for home care. This is significant and is very welcome. It would appear that €20m of this will be used to ensure that the original HSE 2016 Service Plan targets for delivery will be met as opposed to these extra resources actually resulting in the delivery of extra (above target) home care hours10. This suggests that what might be beginning to emerge in the sector are higher hourly costs, or perhaps unrealistic targets (i.e.; insufficient original resourcing to actually deliver the targets set). Of the other €20m, “€10m will ensure that the rate of service allocation can be maintained during the summer months; and €10m has been ring fenced for home care as part of the new winter initiative (Simon Harris, 2016)”. This is indeed to be welcomed, however greater clarity on the anticipated outputs/outcomes is warranted.
The fear for the home care sector is that by the end of the year the acute hospital overruns, as reported on in the first two months of the year (the latest data publicly available), will absorb most of the increased formal resource allocation and that little will be left for additional allocation and/ or outputs for home care. In the first two months of the year the hospital sector accounted for 84% of the budgetary overrun (Health Service Executive, 2016).
Care �Alliance
Ireland
11
11 HSE 2015 Annual Report p 32.12 As of 31 December 2015, 15,272 individuals were in receipt of a HCP. We estimate this to average out annually at 500 hours home care, totalling what we estimate to be 7.64m home care hours.
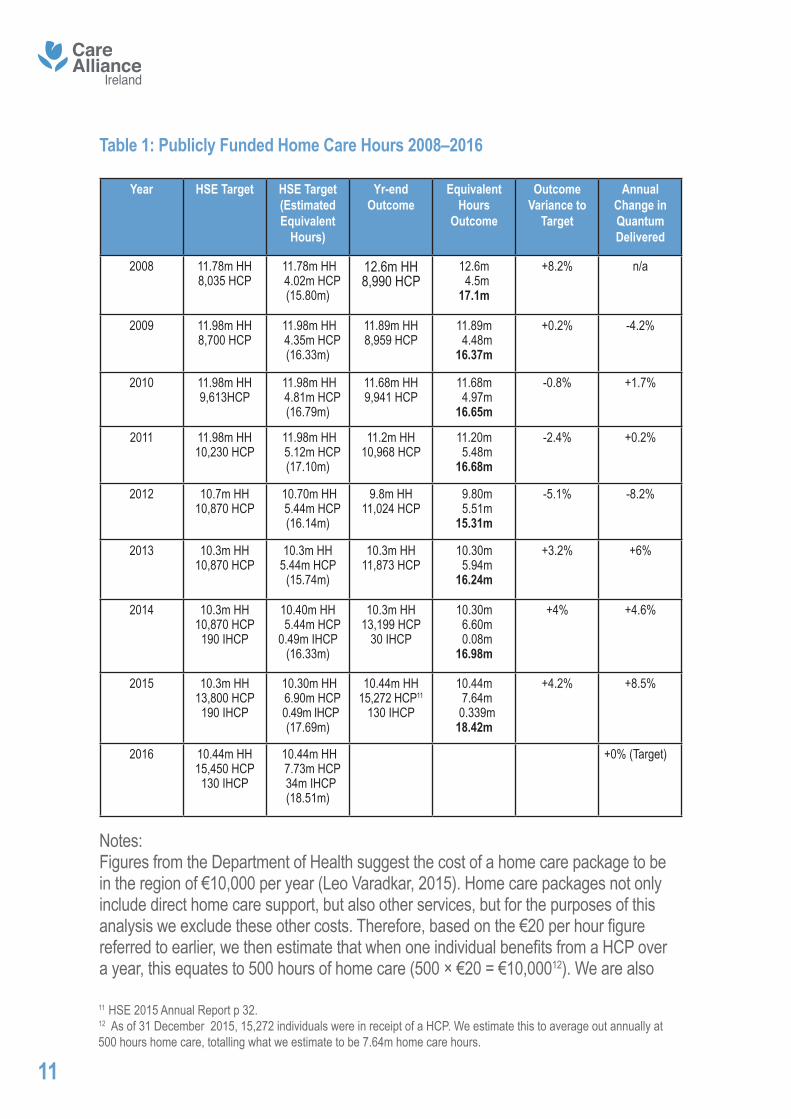
Table 1: Publicly Funded Home Care Hours 2008–2016
Year HSE Target HSE Target (Estimated Equivalent
Hours)
Yr-end Outcome
Equivalent Hours
Outcome
Outcome Variance to
Target
Annual Change in Quantum Delivered
2008 11.78m HH8,035 HCP
11.78m HH 4.02m HCP
(15.80m)
12.6m HH8,990 HCP
12.6m 4.5m17.1m
+8.2% n/a
2009 11.98m HH8,700 HCP
11.98m HH 4.35m HCP
(16.33m)
11.89m HH8,959 HCP
11.89m 4.48m16.37m
+0.2% -4.2%
2010 11.98m HH9,613HCP
11.98m HH 4.81m HCP
(16.79m)
11.68m HH9,941 HCP
11.68m 4.97m16.65m
-0.8% +1.7%
2011 11.98m HH10,230 HCP
11.98m HH 5.12m HCP
(17.10m)
11.2m HH10,968 HCP
11.20m 5.48m16.68m
-2.4% +0.2%
2012 10.7m HH10,870 HCP
10.70m HH 5.44m HCP
(16.14m)
9.8m HH11,024 HCP
9.80m 5.51m15.31m
-5.1% -8.2%
2013 10.3m HH10,870 HCP
10.3m HH5.44m HCP
(15.74m)
10.3m HH11,873 HCP
10.30m 5.94m16.24m
+3.2% +6%
2014 10.3m HH10,870 HCP190 IHCP
10.40m HH 5.44m HCP0.49m IHCP
(16.33m)
10.3m HH13,199 HCP
30 IHCP
10.30m 6.60m 0.08m16.98m
+4% +4.6%
2015 10.3m HH13,800 HCP190 IHCP
10.30m HH 6.90m HCP 0.49m IHCP
(17.69m)
10.44m HH15,272 HCP11
130 IHCP
10.44m 7.64m 0.339m18.42m
+4.2% +8.5%
2016 10.44m HH15,450 HCP130 IHCP
10.44m HH 7.73m HCP 34m IHCP
(18.51m)
+0% (Target)
Notes:Figures from the Department of Health suggest the cost of a home care package to be in the region of €10,000 per year (Leo Varadkar, 2015). Home care packages not only include direct home care support, but also other services, but for the purposes of this analysis we exclude these other costs. Therefore, based on the €20 per hour figure referred to earlier, we then estimate that when one individual benefits from a HCP over a year, this equates to 500 hours of home care (500 × €20 = €10,00012). We are also

12
assuming that this intensity of individual support with respect to home care packages has not changed over the period 2008–2016.
We generously estimate that one Intensive Home Care Package (IHCP) equates to the delivery of 2,600 hours per year. Data in the public domain suggests the annual cost is in the region of €52,000 per year. Again, these figures are subject to clarification by the HSE.
3.1 Are We Spending More Money on Home Care or Not?
Measuring overall expenditure in home care is also an important consideration. The recent Donnelly Et al. home care report, mentioned earlier, does intimate that less funds are being spent on home care than were being spent in 2008, although the source data is a little dated, based as it is on original 2015 budget allocations which were subsequently increased later in 2015. The 2016 budget and supplementary allocations will bring this overall allocation well above the 2008 figure. The 2010 reductions in pay imposed on many public sector workers and other workers paid by the State also complicates any analysis, although pay reductions were of a lower magnitude for those in the lower paid cohorts of health and social care employees where most home care workers would be positioned. It would seem, however, that 2016 will mark a new high for nominal public home care expenditure (both direct and indirect), since the previous peak expenditure in 2008.
4. Analysis of FiguresThe 2016 Service Plan targets, based on our assumptions, suggest there will be 18.51m hours of care delivered in 2016, more or less the same number as delivered in 2015. The recently announced extra resources in June 2016 have not quantified likely new outputs or specifically the numbers of extra home care hours that will be delivered. If variances shown in previous years between target and outturn are indications of likely future outcomes (range -5.1% to +8.2%, average +1.6%), it is reasonable to expect that
It would seem, however, that 2016 will mark a new high for nominal public home care expenditure (both direct and indirect), since the previous peak expenditure in 2008

Care �Alliance
Ireland
the overall quantum of public home care delivery may well continue to increase in 2016, for the fourth year running.
The 2016 initial allocation to older people’s services (the assumption being that the largest allocation of this is for home care) suggests a reduction of €9.9m compared to the 2015 level of expenditure. We are assuming that this reflects planned efficiencies in home care commissioning or reductions in other areas of expenditure rather than a reduction in the number of hours of home care being delivered. The 2015 year-end expenditure appears to have been considerably over budget, but the exact figure is not clear. This budget overrun probably reflects significantly the 4.2% higher number of hours of home care actually delivered in 2015 than was originally budgeted for.
There appears to have been a cumulative 20% increase in the number of hours of home care support delivered/funded by the HSE between the low point in 2012 (15.31m) and that delivered in 2015 (18.43m). Material assumptions are being made, however, relating to how many hours a HCP entails, and as such this 20% figure is open to modification upon receipt of further data from the HSE.
It is likely that 2015 marked the year when the overall volume of publicly funded home care was restored in hourly terms to the peak quantum of services delivered in 2008.
However, looking at delivery from a utilisation and accessibility perspective, increases in service delivery since 2013 will merely have partially restored the actual percentage of the 65+ group who are in receipt of services to the level that existed in 2008. Other
it is reasonable to expect that the overall quantum of public home care delivery may well continue to increase in 2016, for the fourth year running
It is likely that 2015 marked the year when the overall volume of publicly funded home care was restored in hourly terms to the peak quantum of services delivered in 2008
13
reports reiterate this situation. The recently published collaborative home care report by Donnelly Et al. states:
“Despite a 25% increase in the population of those aged 65 years and over and a near 30% increase in the population of those 85 years and over in the last seven years,
there has been nearly a 2% decrease in the number of people receiving support, from 64,353 people receiving HH and HCP in 2008 to 63,245 people in 2015.”
(Donnelly et al., 2016; p12)
The population of this age cohort (>65) has increased by 17.5% over the period 2011–2016, and is estimated to continue to increase at at least this rate from 2016 up to 2021 (17.3%). This is the leading factor in the annual increase in demand for home care.
A recent HSE report (Appendix II) suggests that to retain the utilisation ratio year on year will require a minimum of a 3–3.5% increase in the number of hours of home care delivered annually. While this level of utilisation has been sustained in 2013 and has increased in 2014 and 2015, it is coming from a very low base (in 2011/2012).
Since the low of 2012, the cumulative increase in hours of home care per person over 65 has been in the region of 8.5%. It must be borne in mind that the reduction in the utilisation rate was approximately 17% over the two-year period 2011–2012 (10.3% nominal reduction and 6.5% demographic reduction). Therefore, in summary, approximately one half of the reduction in utilisation (i.e.; accessibility) has been restored since 2013.
increases in service delivery since 2013 will merely have partially restored the actual percentage of the 65+ group who are in receipt of services to the level that existed in 2008
Approximately one half of the reduction in utilisation (i.e.; accessibility) has been restored since 2013
14
Care �Alliance
Ireland
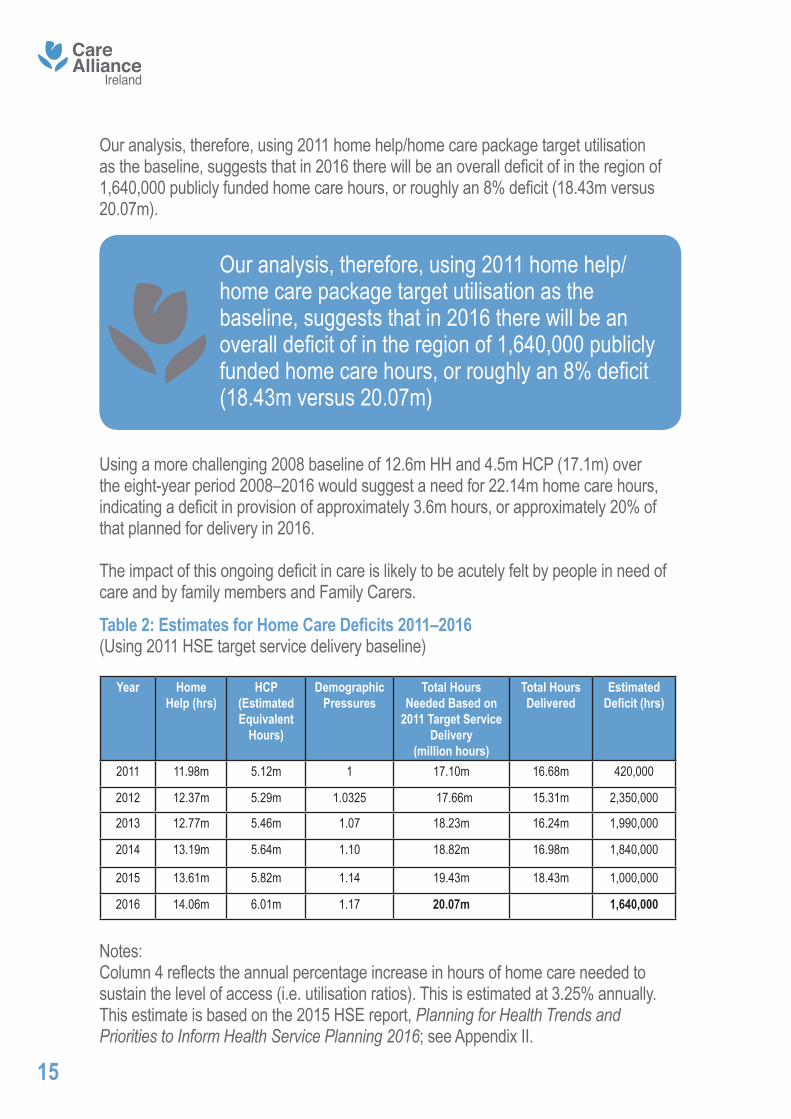
Our analysis, therefore, using 2011 home help/home care package target utilisation as the baseline, suggests that in 2016 there will be an overall deficit of in the region of 1,640,000 publicly funded home care hours, or roughly an 8% deficit (18.43m versus 20.07m).
Using a more challenging 2008 baseline of 12.6m HH and 4.5m HCP (17.1m) over the eight-year period 2008–2016 would suggest a need for 22.14m home care hours, indicating a deficit in provision of approximately 3.6m hours, or approximately 20% of that planned for delivery in 2016.
The impact of this ongoing deficit in care is likely to be acutely felt by people in need of care and by family members and Family Carers.
15
Our analysis, therefore, using 2011 home help/home care package target utilisation as the baseline, suggests that in 2016 there will be an overall deficit of in the region of 1,640,000 publicly funded home care hours, or roughly an 8% deficit (18.43m versus 20.07m)
Table 2: Estimates for Home Care Deficits 2011–2016(Using 2011 HSE target service delivery baseline)
Year Home Help (hrs)
HCP (EstimatedEquivalent
Hours)
Demographic Pressures
Total HoursNeeded Based on
2011 Target Service Delivery
(million hours)
Total Hours Delivered
Estimated Deficit (hrs)
2011 11.98m 5.12m 1 17.10m 16.68m 420,000
2012 12.37m 5.29m 1.0325 17.66m 15.31m 2,350,000
2013 12.77m 5.46m 1.07 18.23m 16.24m 1,990,000
2014 13.19m 5.64m 1.10 18.82m 16.98m 1,840,000
2015 13.61m 5.82m 1.14 19.43m 18.43m 1,000,000
2016 14.06m 6.01m 1.17 20.07m 1,640,000
Notes: Column 4 reflects the annual percentage increase in hours of home care needed to sustain the level of access (i.e. utilisation ratios). This is estimated at 3.25% annually. This estimate is based on the 2015 HSE report, Planning for Health Trends and Priorities to Inform Health Service Planning 2016; see Appendix II.
16
5. Discussion and Further Questions5.1 Some caution is warranted in any interpretation of these figures, in particular the assumption about how many hours of care per week are provided through home care packages and the hourly cost of home care.
5.2 The long-term decline in the provision of traditional home help reflects the apparent (but contested) move away from the provision by the State of companionship and housekeeping towards the provision of more personal/ intimate care. Significantly, Murphy et al. (2014) found no evidence of this alleged shift. This phenomenon is worthy of further investigation. In a sense the question is: to what extent has the bar for being eligible for new home care supports risen?
5.3 The provision of institutional step-down facilities appears to be increasingly used as a method of reducing delayed hospital discharge. While this is welcome, it must be met with a similarly enhanced resourcing of home care, otherwise the risk is that these step-down resources unnecessarily become long-term care.
5.4 Is it reasonable to suggest that hospital patients are increasingly being discharged home more quickly than they would have been in the past? Recent research undertaken amongst Family Carers indicates very poor experiences of the hospital discharge process. If so, what are the implications for overall demand on home care? Or does early discharge simply reflect the increasing number of relatively straightforward hospital procedures that do not need lengthy hospital-based recovery?
5.5 Have changes in assessment processes led to a more acute rationing of home care supports?
5.6 Is the imminent introduction of a Single Assessment Tool (SAT-InterRAI) likely to impact on home care allocation?
5.7 Should alternative funding approaches, including means testing or deferred payments, which might enable greater access to and provision of home care supports, be investigated?
5.8 To what extent can improved general health in the over 65s mitigate the overall increase in demand for home care supports?
Care �Alliance
Ireland
6. Implications for Family CarersWithout additional public resources being provided in 2016 for home care supports:
Ireland’s Family Carers will experience more intense pressure to provide care for loved ones at home;
Families will be increasingly pressurised to accept vulnerable relatives home from hospital without comprehensive discharge plans, including adequate home care supports;
Vulnerable adults will be at greater risk of neglect;
The deficit in home care will continue to increase.
7.1 We recommend that the HSE sets a 2016 goal of reaching the 2011 target level of public provision of home care per person aged 65+. Our figures suggest that this will require additional resourcing of €31m in 2016 equating to an additional 1.55m home care hours over and above current published targets13. This will also require the collection of data at a national level that details actual hours of home care delivered through Home Care Packages.
7.2 In the medium term, we recommend that the HSE sets a goal of reaching the 2008 level of public provision of home care per person aged 65+. Our figures suggest that this would require additional resourcing of €72m in 2016, rising to €116m in 201914.
Families will be increasingly pressurised to accept vulnerable relatives home from hospital without comprehensive discharge plans, including adequate home care supports
13 The 2011 HSE target (our estimate) was 17.1m hours. Using the 3.25% annual demographic pressure, this would build to 20.06m hours in 2016. The 2016 HSE target (our estimate) is 18.51m, leaving a difference of 1.55m. Estimated at a €20 per hour cost, this equates to €33m in 2016.14Assuming an annual 3.25% increase in home care hours is needed to sustain the utilisation levels, then this equates to a need for 22.09 m hours in 2016 (3.58 above 2016 targets) and for 24.31m hours in 2019, which equates to an additional 5.8m hours compared to 2016 Service Plan targets. At current prices, assumed to be €20 per hour, this equates to a cost of €72m and €116m respectively.
17
7. Recommendations
18
7.3 We recommend that all HSE publications use consistent terminology when describing home care provision.
7.4 We recommend that considered attempts be made to assess the current volume of privately provided home care.
7.5 We recommend that the move towards the regulation of home care is progressed during 2016.
7.6 We recommend that home care provision is set up on a statutory basis.
7.7 We recommend that further analysis is undertaken to explore the apparent material reduction in home help hours delivered per client.
7.8 We strongly recommend that the Department of Health liaise with the HSE and other interested parties in developing more sophisticated models of assessing appropriate levels of home care provision based on international norms and agreed levels of dependency. This analysis should inform public resourcing and annual service targets. The utilisation ratio in itself, while helpful, does not tell the whole picture in terms of adequacy of coverage and service provision, particularly in light of data that suggests a trend towards fewer hours of home care delivered per client.
7.9 Home care support needs are on a continuum from low to high. The rollout of the InterRAI assessment tool, proposed as a suitable model for assessing such needs, must be an organisational priority within the HSE. Progress on this initiative has been slow. We believe that with the development of this tool comes an opportunity to recalibrate baseline home care support needs and to better inform planning for our ageing population.
In the medium term, we recommend that the HSE sets a goal of reaching the 2008 level of public provision of home care per person aged 65+. Our figures suggest that this would require additional resourcing of €72m in 2016, rising to €116m in 2019
Care �Alliance
Ireland
Appendix I
Definition of Terms
Note some of these terms are not defined clearly by the Department of Health or the HSE.
Home Care Package (HCP)
A Home Care Package is a set of services provided by the HSE to help an older person to be cared for in their own home. The services, for example additional home help hours, nursing services, therapy services, might be needed due to illness, disability or after a stay in hospital or following rehabilitation in a nursing home. A Home Care Package includes extra services and supports that are over and above the normal community services that the HSE provides directly or through a HSE funded service. Community services, provided by the HSE, and HSE funded providers, include home help, nursing, physiotherapy, occupational therapy, speech & language therapy, day care services, respite care, etc. (Health Service Executive, 2015)
Intensive Home Care Packages (IHCP)
Per above, but more intensive in nature.
Home Help (HH)
Home Help Service is a formal state provision of care in the community. The Health Act (Section 61(1)) allows for the service to be provided free of charge. Historically, home help support was mainly targeted at domestic support to older people such as assistance with cleaning, cooking and other light household tasks. In recent years, the scope of the service has broadened with an emphasis on personal care including support with personal hygiene, washing and dressing (Personal Activities of Daily Living (PADL’s)). Many home help providers offer a maximum of 5 hours of home help support in one week. Any additional hours required need to be sourced through the Home Care Package (HCP) Scheme (Citizens Information Board, 2013).
19
Respite Care
Respite care may involve providing alternative family or institutional care for a person with a disability in order to enable the carer to take a short break, a holiday or a rest. It can cover very short-term respite, for example, a carer for an evening, or a much longer arrangement for a holiday. Schemes of respite care are sometimes called ‘Breakaway’ or ‘Friendship’ schemes.
Respite care or temporary care may be based in the community or in an institution. In practice, respite care is provided to a varying degree at a number of locations around the country – in some cases by a Health Service Executive (HSE) Area and in others by local or national voluntary organisations (Citizens Information Board, 2016).
Transitional Care (TC)
Transitional Care (TC) is a specified, certified program “to help hospitalized patients with complex chronic conditions, often the most vulnerable patients, transfer in a safe and timely manner from one level of care to another” ideally, to their home residence (Global Transnational Care, 2016).
Delayed Discharge
Delayed discharge (sometimes called delayed transfer or bed blocking) refers to the situation where a patient is deemed to be medically well enough for discharge but where they are unable to leave hospital because arrangements for continuing care have not been finalised (Bryan, Gage, & Gilbert, 2006).
20
Care �Alliance
Ireland
Appendix IIPlanning for Health Trends and Priorities to Inform Health Service Planning 2016 (Health Service Executive, 2015)
The publication of this document institutes a new, more sophisticated analysis of health and social care provision, particularly in the area of demographics and likely future demand. Of particular interest for this paper are the references to the ageing profile of our population and the implications this has for demand for home care support:
“This paper sets out the health needs and demands of the Irish population to support service planning 2016 in the HSE. It provides a population focused analysis of current and future needs and demands in terms of demographic pressures for 2016 and also provides a five year forecast to 2021. It is a key resource to inform priority setting across key areas in the health service and assist in the annual estimates process.” (p 1)
Key points from the report relevant to the delivery of and demand for home care supports for older people include:
The report goes on to comment on unmet need and international standards:
• The population aged 65 years and over is projected to increase by 3.1%, or 19,400 people, between 2015 and 2016.
• The population aged 85 years and over is projected to increase by 4.2%, or 2,900 people, between 2015 and 2016.
• Applying the 2014 utilisation rate per capita, it is projected that 14,062 standard home care packages and 10.97 million home help hours will be necessary in 2016 to provide solely for the increasing demographic pressure, assuming current models of care and levels of provision remain constant. This does not allow for any service improvement initiatives.
• The combined pressures of an increase in those aged 65 years and over and the ageing profile of carers translates into increasing demand for residential and home support services.
• Based on Census 2011 data, 4.1% of the population reported providing unpaid care to another person, with the number of carers over 15 years of age increasing by 13.7% from 2006 to 2011, and with the greatest increase occurring in those over 75 years (39%).
21
“Currently there is very little evidence internationally as to what proportion of the population aged 65 years and older requires home care, either through home care packages or home help hours. The OECD have quoted a figure that between 10% and 20% of people aged 65 years and over require long term care. Using the figure of 4.85% requiring residential care (both long stay and short stay care as discussed above), and considering 8.9% currently use home help services as described by Wren et al, it is reasonable to assume that approximately 10–11% of people aged 65 years and over require some form of home care. In 2011, we were close to this international standard with 10.1% of the population aged 65 years and over in receipt of home help hours. This has decreased to 8% by 2014 due to changes in the number of clients receiving home help hours and the increasing population base. Home help hours have decreased from 11.98 million in 2011 to 10.3 million in 2014.
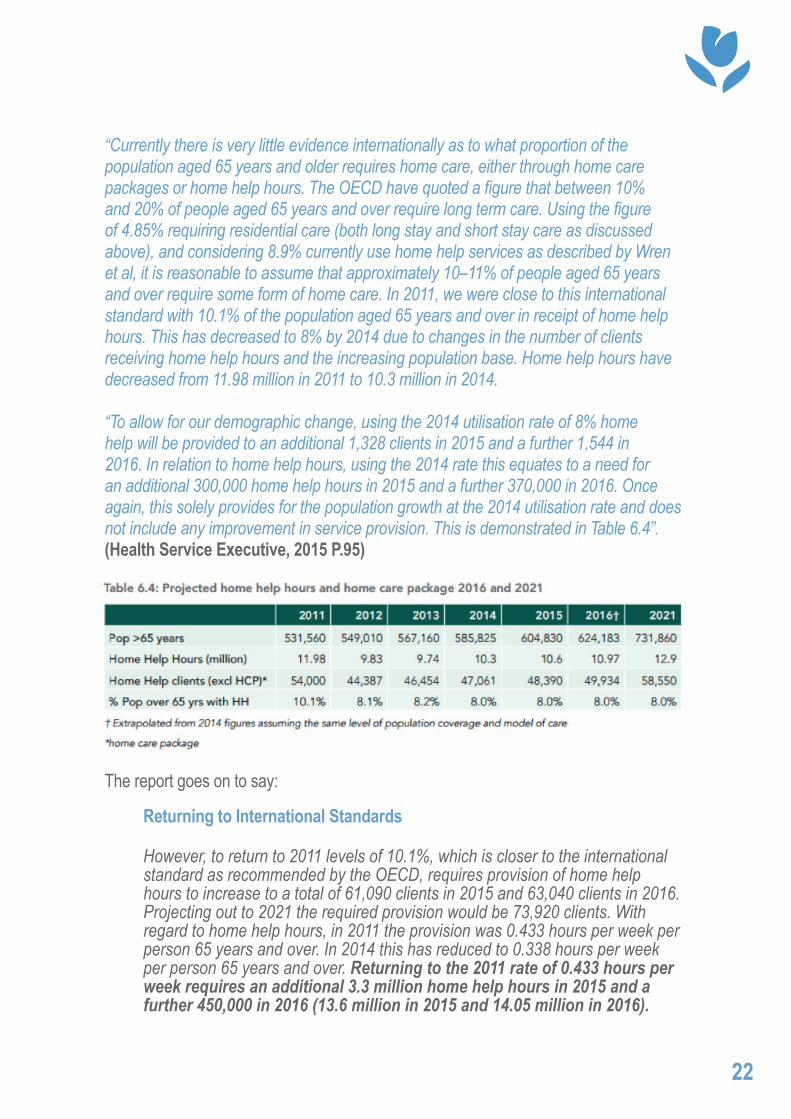
“To allow for our demographic change, using the 2014 utilisation rate of 8% home help will be provided to an additional 1,328 clients in 2015 and a further 1,544 in 2016. In relation to home help hours, using the 2014 rate this equates to a need for an additional 300,000 home help hours in 2015 and a further 370,000 in 2016. Once again, this solely provides for the population growth at the 2014 utilisation rate and does not include any improvement in service provision. This is demonstrated in Table 6.4”. (Health Service Executive, 2015 P.95)
The report goes on to say:
22
Returning to International Standards
However, to return to 2011 levels of 10.1%, which is closer to the international standard as recommended by the OECD, requires provision of home help hours to increase to a total of 61,090 clients in 2015 and 63,040 clients in 2016. Projecting out to 2021 the required provision would be 73,920 clients. With regard to home help hours, in 2011 the provision was 0.433 hours per week per person 65 years and over. In 2014 this has reduced to 0.338 hours per week per person 65 years and over. Returning to the 2011 rate of 0.433 hours per week requires an additional 3.3 million home help hours in 2015 and a further 450,000 in 2016 (13.6 million in 2015 and 14.05 million in 2016).
Care �Alliance
Ireland
23
Home Care Packages
Home care package clients have increased from 10,230 in 2011 to 13,199 in 2014. However, the level of provision does not reflect unmet need. In 2014, 13,199 standard home care packages, 15 intensive support home care packages were provided by the HSE. (HSE Performance Assurance Report December 2014). To maintain the same levels of population coverage in 2016 would require an additional 427 home care packages in 2015 and a further additional 436 home care packages in 2016.
Carers Demographic trends show a rise in those over 65 years and in particular in those aged 85 years and over, leading to an increased need for care. At the same time, they also show a decrease in the availability of those traditionally associated with care giving due to reduced family sizes and greater female participation in the labour force. These demographic changes may be partially offset by the increase in male life expectancy leading to a greater number of spousal carers and by the predicted decrease in disability rates amongst the over 65 population. Overall, 4.1% of the population reported that they provided unpaid care to another person with the number of carers increasing by 13.7% between the Census of 2006 and 2011 (Census 2011). The greatest percentage increase was seen in older people providing care to others with an increase of 39% in those over 75 providing care. Carers contributed 327 million hours of care in 2011 with the elderly (those over 70 years) providing almost 800,000 hours of care per week. For the first time in Census 2011, information on caring by those aged 14 and under was requested which revealed that children represent 2.3% of those providing unpaid care and provide an average of 9.2 hours care per week.
These figures indicate that the fastest growing population group providing care is the older population where there is a greater risk of the carer having or developing health problems themselves.
Such caring situations require greater supports from the state services and are at greater risk of sudden breakdown leading to a requirement for crisis intervention in situations such as the emergency admission of the carer to hospital. The findings from TILDA indicate that the vast majority of caregivers for older people living at home are unpaid (89.5%) with the remaining 10.5% paid caregivers. Amongst the unpaid carers, the finding of the spouse as the main carer is further evidence of ‘the older carer’ becoming an increasingly significant provider of care in the community.- (Health Service Executive, 2015)
Source: https://www.hse.ie/eng/services/publications/planningforhealth.pdfp 97/98
BibliographyBryan, K., Gage, H., & Gilbert, K. (2006). Delayed transfers of older people from hospital: causes and policy implications. Health Policy, 76, 194–201.
Campbell, D. (2016a, May 20). NHS hospitals in England reveal £2.45bn record deficit. The Guardian. Retrieved from https://www.theguardian.com/society/2016/may/20/nhs-in-england-reveals-245bn-record-deficit
Campbell, D. (2015b, September 23). Nice criticises “flying home care visits” as short as five minutes. The Guardian.
Central Statistics Office. (n.d.). Census 2002 and Census 1996. Ireland. Retrieved from http://www.cso.ie/en/census/census2002andcensus1996/
Citizens Information Board. (2013). Home Help Service (Citizens Information Website). Retrieved from http://www.citizensinformation.ie/en/health/health_services/care_in_your_community/home_helps.html
Citizens Information Board. (2016). Respite Care (Citizens Information Website). Retrieved from http://www.citizensinformation.ie/en/health/health_services/health_services_for_people_with_disabilities/respite_care.html
Department of Health. (2015). Review of the Nursing Homes Support Scheme, A Fair Deal. Department of Health. Retrieved from http://health.gov.ie/wp-content/uploads/2015/07/Review-of-Nursing-Homes-Support-Scheme.pdf
Donnelly, S., O’Brien, M., Begley, E., & Brennan, J. (2016). “I’d prefer to stay at home but I don’t have a choice”: Meeting Older People’s Preference for Care: Policy, but what about Practice? University College Dublin. Retrieved from https://www.ageaction.ie/sites/default/files/aa2c_asi2c_iasw_final_research_report-a4-report_lr_for_web_2.pdf
Care �Alliance
Ireland
Eurostat. (2015).File: Population age structure by major age groups, 2004 and 2014 (% of the total population). Eurostat. Retrieved from http://ec.europa.eu/eurostat/statistics-explained/index.php/File:Population_age_structure_by_major_age_groups,_2004_and_2014_(%25_of_the_total_population)_YB15.png
Family Carers Ireland. (2016). Achieving Fairness for Family Carers. Family Carers Ireland. Retrieved from http://familycarers.ie/wp-content/uploads/2016/01/Family-Carers-Ireland-Pre-Election-Manifesto-2016.pdf
Global Transnational Care. (2016). Global Transnational Care. Retrieved from https://www.globaltransitionalcare.com
Health Service Executive. (2009a). 2009 HSE National Service Plan. HSE.
Health Service Executive. (2009b). HSE 2008 Annual Report. HSE. Retrieved from http://www.hse.ie/eng/services/Publications/corporate/arafs08.pdf
Health Service Executive. (2015). Home Care Package Scheme. HSE. Retrieved from https://www.hse.ie/eng/services/list/4/olderpeople/benefitsentitlements/HCPinfobooklet.pdf
Health Service Executive. (2015). HSE 2014 Annual Report. HSE. Retrieved from https://www.hse.ie/eng/about/Who/corpoperf/Annual%20Report%202014.pdf
Health Service Executive. (2015). Planning for Health: Trends and Priorities to inform Health Service Planning 2016. HSE. Retrieved from https://www.hse.ie/eng/services/publications/planningforhealth.pdf
Health Service Executive. (2016). Health Service Executive National Service Plan 2016. HSE. Retrieved from https://www.hse.ie/eng/services/publications/serviceplans/nsp16.pdf
Health Service Executive. (2016). HSE 2015 Annual Report. HSE. Retrieved from http://www.hse.ie/eng/services/publications/corporate/annualrpt15.pdf
Health Service Executive. (2016). HSE Management Data Report. HSE. Retrieved from http://www.hse.ie/eng/services/publications/performancereports/feb16datadoc.pdf
Irish Fiscal Advisory Council. (2015).Controlling the health budget: Annual budget implementation in the public health area. Irish Fiscal Advisory Council. Retrieved from http://www.fiscalcouncil.ie/wp-content/uploads/2012/01/Health-Analytical-Note-FINAL.pdf
Leo Varadkar. (2015). Minister Varadkar speaking at a Dáil Debate on Home Help Service Provision (2015). Oireachtas na hEireann.
Mercer Ireland. (2002). Study to Examine the Future Financing of Long-Term Care in Ireland. Irish Stationary Office. Retrieved from http://www.welfare.ie/en/downloads/stetffolcii.pdf
Murphy, C., Whelan, B., & Normand, C. (2015). Formal Home-Care Utilisation by Older Adults in Ireland: Evidence from the Irish Longitudinal Study on Ageing (TILDA). Health and Social Care in the Community, 23(4), 408–418.
Simon Harris. (2016, June 16). Statement by the Minister for Health Simon Harris T.D. to the Dáil on Health Estimate for 2016 16th June 2016. Retrieved from http://health.gov.ie/blog/speeches/statement-by-the-minister-for-health-simon-harris-t-d-to-the-dail-on-health-estimate-for-2016-16th-june-2016/
Timonen, V., Doyle, M., & O’Dwyer, C. (2012). Expanded, but Not Regulated: Ambiguity In Home-Care Policy in Ireland. Health and Social Care in the Community, 20(3), 310–318.
Care �Alliance
Ireland
Care �Alliance
Ireland
Guiding support for family carers
Care Alliance IrelandCHY No: 14644Charity Registration No: 20048303Company No: 461315Registered office: Coleraine House, Coleraine Street, Dublin 7, Ireland, D07 E8XF.Telephone: +353 (0)1 874 [email protected]