career paths, organizational affiliation and the … · 1 career paths, organizational affiliation...
TRANSCRIPT
1
CAREER PATHS, ORGANIZATIONAL AFFILIATION AND THE ENACTMENT
OF ENTREPRENEURIAL INTENTIONS
Riccardo Fini1
Draft version: 25/01/2010
ABSTRACT
How entrepreneurs’ career-paths relate to the enactment of entrepreneurial intentions? Does
entrepreneurs’ organizational affiliation influence their entrepreneurial intentions? In an
attempt to provide answers to such questions, we draw on intentional theory in order to
explain heterogeneity in entrepreneurs’ intentional processes. We study the impact that
entrepreneurs’ affiliation to public research institutions has on the enactment of their
entrepreneurial intentions, comparing the intentional processes of a matched-pairs sample of
52 public entrepreneurs and 52 private entrepreneurs. After employing multivariate regression
analyses and structural equation modelling techniques, the empirical results are confirmed,
showing that entrepreneurial intentions are differently determined within the two samples.
These findings provide us new theoretical and empirical evidences on the impact that
individual features, developed as a result of different career paths and organizational
affiliations, have on the enactment of entrepreneurial intentions.
Key words: Entrepreneurial intention, career-paths, organizational affiliation, public
employee, psychological characteristics, individual skills, academic entrepreneurship,
common method bias, bootstrap, structural equation modelling.
1 E-mail: [email protected]

2
1. INTRODUCTION
Entrepreneurs’ intentions determine the form and the direction of nascent organizations
at their inceptions and affect the survival and growth of the organizations that they lead.
Although such actions can result from unintended and unplanned behaviors, intentions are
needed for them to become manifest (Bird, 1988).
In this article, we focus on the determinants of entrepreneurial intentions, studying the
heterogeneity in their enactment. We draw on intentional theory (Krueger, Reilly, & Carsrud,
2000), and we bring together psychological and contextual dimensions to explain such
differences.
Literature shows that entrepreneurial intentions are rooted in personal characteristics,
such as entrepreneurial self-efficacy (Zhao, Seibert & Hills, 2005) and risk-taking propensity
(Luthje & Franke, 2003), and in individual abilities, such as technical and managerial skills
(Wiklund & Shepherd, 2003). Contextual factors, such as environmental influences (Morris &
Lewis, 1995), are also needed for entrepreneurial intentions to become manifest.
As we acknowledge that several contributions have studied the determinants of
entrepreneurial intentions, still little is known on the dimensions that account for
heterogeneity in their enactment. In particular, it is still unclear if entrepreneurial intentions
arise following similar patterns for all entrepreneurs or if they are differently determined, as a
result of developed individual features or due to environmental exposures.
In an attempt to fill this void, in this contribution we compare the intentional processes
of two groups of entrepreneurs - who have established their firms after different career paths -
while employed in different organizations. In particular, we identify previous career and
organizational affiliation as the two dimensions responsible for the heterogeneity in the
enactment of entrepreneurial intentions. We compare public entrepreneurs, or individuals who
have established a new company - while employed in public research organizations - after a
3
career as public servants, with a control sample of entrepreneurs without such affiliation and
background. We put forward a set of hypotheses on the differences in the determinants of
their entrepreneurial intentions. Adopting a quasi-experimental design, we compare a
matched-paired sample of 52 public entrepreneurs and 52 private entrepreneurs. We test for
differences using univariate statistics, multivariate regression analysis, and structural equation
modelling technique on bootstrapped data samples.
Our results show that entrepreneurial intentions are differently enacted within the two
samples. As for public entrepreneurs they are determined by risk-taking propensity and
technical skills, while for private entrepreneurs they are fostered by entrepreneurial self-
efficacy and managerial skills. In both samples the environmental support has positive and
significant impact on entrepreneurial intentions. These results hold when we bootstrap and we
apply structural equation modelling technique on the simulated data samples.
This study contributes in two ways to the debate on the psychology of entrepreneurs.
First, relying on intentional theory, it assesses the impact that career-paths and organizational
affiliation have on entrepreneurial intentions, showing the existence of heterogeneity in their
formation processes. Second, it empirically tests a behavioural model of the determinants of
entrepreneurial intentions, accounting for both personal and contextual dimensions.
Our results are of interest also for practitioners. Financial investors’ decisions, as well
as several norms put in place by policy makers, rely on the assumption that some
entrepreneurs, because of their career-paths and organizational affiliation, develop
idiosyncratic skills, specific mindsets and biased perceptions, that differently enact their
intentions, hindering entrepreneurial behaviours and, ultimately, their ventures’ growth. Being
aware of how entrepreneurial intentions differently arise might help policy makers and
institutional investors to better rationalize their efforts toward the support of technology
transfer activities from universities to business market. On top of that, the documented
4
heterogeneity in intentional processes may possibly explain some differences in growth
patterns between academic spin-offs and private start-ups (Ensley & Hmieleski, 2005).
The rest of the paper is organized as follows: in section 2 we focus on intentional
theory. In section 3 we describe the role played by career paths and organizational affiliation
in the development of specific entrepreneurs’ features. We then put forward a set of
hypotheses on the differences between public and private entrepreneurs’ intentional
processes. In section 4 we present the methodology and the research design, while in section 5
we report the empirical results. A final section concludes with discussion and implications.
2. ENTREPRENEURIAL INTENTIONS
Intentions occupy a central position in cognitive approaches to understand human
behaviours (Tubbs & Ekeberg, 1991). According to Ajzen (1991) and Sutton (1998) most
behaviours of social relevance (i.e. health related behaviour and the establishment of new
organizations) are under volitional control. Intentions can be seen therefore as the immediate
determinants and the single best predictors of behaviours (Armitage & Conner, 2001).
Bird (1988), in her seminal work, studies entrepreneurial intentions. In particular, she
argues that the objective (or goal) of entrepreneurial intention can be identified in terms of
either the establishment of a new venture or the creation of new value within an existing
organization. Shane and Venkataraman (2000), building on her contribution, argue that the
two objectives that mainly characterize entrepreneurship are the establishment of new
independent firms, and the creation of new value in existing ones. Consistently,
entrepreneurial intentions can be seen as cognitive representations of the objectives and
actions to be implemented in order to either establish a new independent venture or create
new value within an existing organization.

5
It is certainly true that entrepreneurial ideas begin with inspiration; though intentions
are needed in order for them to become manifest (Del Mar & Shane, 2003). Consistent with
this approach, Krueger et al. (2000) argue that individuals do not start a business as a reflex,
but they do it intentionally. Hence, especially at the birth of an organization, the impact of the
entrepreneur’s intention is predominant; also because the influences of external stakeholders,
corporate structure, politics, image, and culture have not yet been established (Bird, 1988). As
a consequence, entrepreneurs’ intention determines the form and the direction of a nascent
organization at its inception.
Entrepreneurial intentions also influence the actions of established organizations.
Different theories model organizational behaviours as the result of individual intentions,
emerging through social and political processes determined by individuals. As an example,
Mitchel (1981) argues that CEOs’ and entrepreneurs’ intentions directly affect the
organizations that they lead. Similarly, Stevenson and Jarillo (1986) state that, in established
firms, leading individuals, as a result of their intentional processes, pursue and exploit
opportunities. The role of individual intentions become even more critical as it goes to small
entrepreneurial firms. In particular the strategic orientation and entrepreneurial intentions of
CEOs and entrepreneurs are likely to be tantamount to the strategic and entrepreneurial
orientations of their firms (Baum & Wally, 2003). Consequently, existing organizations
embody and elaborate intentions that, ultimately, affect ventures’ growth.
Intentional theory roots entrepreneurial intentions into two macro-areas, defined as
personal domains and contextual variables (Bird, 1988). Scholars address the former in terms
of “internal dimensions” - or entities that co-exist inside the individual (i.e. psychological
characteristics and individual skills) -; the latter instead are seen as “external dimensions” - or
as influences coming from the outside world (i.e. environmental support and technological
opportunities) (Manstead & Van Eekelen, 1998) -.

6
Internal dimensions are mostly identified in terms of psychological characteristics, and
individual skills and prior knowledge. Dropping a “trait-approach”, under which it has been
demonstrated that demographics and traits have resulted in a little explanatory power - failing
to predict entrepreneurship - (Gartner, 1989), scholars have mainly focused on psychological
characteristics, identifying them as responsible for determining entrepreneurial intention. In
particular, entrepreneurial self-efficacy (Zhao et al., 2005), or the individual’s confidence in
his or her ability to successfully perform entrepreneurial roles and tasks, and risk-taking
propensity (Forlani & Mullins, 2000), or a function of the variation in the distribution of
possible outcomes, the associated outcome likelihoods and their subjective values (Stewart &
Roth, 2001), have showed to determine entrepreneurial intentions2.
Individual skills and abilities accumulated by each entrepreneur are also predictors of
entrepreneurial activities. Wiklund and Shepherd (2003) argue that entrepreneurial intentions
can be conceptualized as functions of entrepreneurs’ developed abilities. Prior knowledge,
defined by Shane (1999) as the stock of information generated through people’s idiosyncratic
life experiences, as well as technical, industry and organizational skills, defined by Baum,
Locke and Smith (2001) as competences required to perform a specific job, influence
entrepreneurial intention.
Moreover, entrepreneurship scholars have theorized that an array of external factors,
such as the social, political, and economic contexts influence entrepreneurial intentions
(Morris & Lewis, 1995; Fini, Grimaldi & Sobrero, 2009). Governments may intervene with
funding schemes, tax policies and other support mechanisms that are aimed at mitigating
market inefficiencies and promoting entrepreneurship (Lerner, 1999). As for local context,
several studies have focused on the ability that both tangible resources, such as financial
2 In this contribution we see risk-taking propensity, coherently with the classical decision theory (March & Shapira, 1987) as a situational psychological characteristics. Conversely, other scholars see risk-taking propensity as predispositional rather than situational (Jackson, Hourany & Vidmar, 1972; Plax & Rosenfeld, 1976), consistently with the big five personality theory, which suggest that risk-propensity is a facet of the traits of extraversion (Mount & Barrik, 1995).

7
support (Beck, Demirguc-Kunt, & Maksimovic, 2005) and entrepreneurial support services
(Feldman, 2001; Foo, Wong, & Ong, 2005), and intangible resources, such as human capital
and routines, have in fostering entrepreneurial intention (Niosi & Bas, 2001).
Several contributions have thus studied the roots of entrepreneurial intentions.
Notwithstanding, scant attention has still been devoted to explain why entrepreneurial
intentions arise differently. In particular there is scant theoretical and empirical evidences
related to what factors account for differences in their enactment (Markman, Balkin, & Baron,
2002). In order to fill part of this void, in the next section, we focus on entrepreneurs’ career–
paths and organizational affiliations as the two dimensions responsible for such heterogeneity,
and we put forward a set of related hypotheses.
3. HETEROGENEITY IN ENTREPRENEURIAL INTENTIONS’ ENACTMENT
3.1 Career-paths, organizational affiliation and the development of intrinsic features
The extant literature acknowledges that individuals pick jobs as a result of their
abilities, intrinsic motivations and expectations of possible outcomes related to the specific
mansion (Jovanovic, 1979). On top of that, individuals self-select themselves into
organizations that have behavioural constraints consistent with their own inclinations and,
similarly, organizations select employees whose particular personal attributes are compatible
with organizational expectations (Baron, 1984). It follows that once individuals enter
organizations, they start to develop specific features, coherently with the missions of their
employers (Fujiwara-Greve & Greve 2000).
Public research institutions (PRIs) may be defined as ‘collections of interrelated rules
and routines that define appropriate actions in terms of relations between roles and situations’
(March & Olsen, 1989). According to this definition, both formal and informal aspects of
PRIs provide institutional influences to individuals that are part of them. PRIs’ work-related
8
rules and norms shape not only the administrative behaviour of public researchers but also the
basic attitudes they hold about the value of PRIs themselves. Such organizations, in fact, are
not just a mean to produce outputs, they are also social institutions in which individuals
interact and influence each others in the context of a structured environment. We can
therefore hold that individuals who choose to serve PRIs self-select themselves, being
influenced by the nature of the PRIs they are part of (Moynihan and Pandey, 2007). Such
individuals own and develop specific intrinsic features that are coherent with public
organizations’ missions (Ozcan & Reichstein, 2009).
Public researchers also belong to the scientific community. Every community has its
distinctive culture, that is characterized by an ideological schema, which controls its self-
identification, knowledge, goal, and conduct and which is expressed in the conventional
actions of its members (Van Dijk, 1995). Members of the scientific community not only share
an acceptance of a great deal of knowledge, methods and criteria against which to evacuate
claims, they also share an acceptance of a culture shaped by social and historical forces
(Hyland, 1997). They are underpinned by PRIs’ values of science: communality, skepticism,
disinterestedness and universality of scientific knowledge. Merton (1958) argues that the goal
of scientists, coherently with the missions of their alma mater, is to establish priority in
discovery, by being first to communicate an advance in knowledge, getting the recognition
awarded by the scientific community for such accomplishment. Such recognition has varied
forms, depending upon the importance the scientific community attaches to the discovery.
Heading the list there is eponymy, or the practice of attaching the name of the scientist to the
discovery, then Nobel prizes, and finally scientific publications (Stephan, 1996).
We can therefore conclude that both the exposure to PRIs’ institutional environment
and the belonging to the community of science foster PRIs’ employees to develop
psychological idiosyncrasies, specific abilities and biased perceptions. Firstly, PRIs not only

9
attract higher-quality employees (based on entrant individual skills - as specified by education
levels or aptitude test score (Crewson, 1995; Ozcan & Reichstein, 2009) -), but also foster
their employees to acquire a set of abilities and idiosyncratic skills that are coherent with their
tasks and missions (Ronstald, 1990). Secondly, PRIs’ employees shape their psychological
characteristics, developing specific mindsets and constructing beliefs based on what is
appropriate in light of their environment and the norms and behaviours of those around them
(Perry, 1996). Those who choose the public sector, originally, tend to have a greater interest
in altruistic and ideological goals; they decide to be employed as civil servants to make a
difference, having an impact on social welfare (Ozcan & Reichstein, 2009). Public
researchers also develop ‘professional’ and ‘organizational’ identities, through which they
seek to integrate their various statuses and roles, as well as their diverse experiences, into a
coherent image of themselves as a part of PRIs (Epstein, 1978). Finally, PRIs’ employees
differently interact with the environment, being biased by their institutional affiliation. As
they progress in their PRIs careers, they frame the external context, while the external context
perceive and interact with them as part of such organizations. For example, entrepreneurial
opportunities and market dynamism are then perceived differently by PRIs’ employees if
compared to private counterparts; pursuing such opportunities is indeed not consistent with
their parental institutions’ missions (Merton, 1988).
As a result of such developed psychological idiosyncrasies, specific abilities and biased
perceptions, individuals employed in PRIs enact entrepreneurial intentions differently, if
compared to other individuals with no such affiliation and background. Building on that, in
the next section, we put forward a set of hypotheses on differences in entrepreneurial
intentions’ determinants.

10
3.2 Hypotheses
Coherently with the debate on the foundation of intentionality, we see entrepreneurial
intentions as determined by internal dimensions, in terms of psychological characteristics and
individual skills, as well as by external dimensions, in terms of environmental influences.
As for the former domain, risk-taking propensity represents one of the entrepreneurs’
psychological facets in which the existing literature roots entrepreneurial intentions (Forlani
& Mullins, 2000). To such extent, several contributions have studied risk-taking propensity in
relation to individuals’ career-choices. In particular, Bellante and Link (1981) point out that
individuals with a low level of risk-taking propensity, more likely than others, choose an
employment in public sectors. These findings are confirmed by Blank (1985), who shows that
public servants, consistently with the risk-aversion strategies of their parental organizations,
are motivated by job security and stability, rather than by independence and high returns. We
can therefore argue that public entrepreneurs, because of their previous choices to be part of
PRIs, have less risk-taking propensity if compared to the private counterparts.
On top of that, public entrepreneurs belong to PRIs for many of which technology
transfer activities are only a part of the their institutional mission, as their main objectives
remain teaching and research. For many of them, being entrepreneurs mean putting aside
(even if only for a limited period of time) a stable position in order to try the entrepreneurial
venture. Moreover, in many PRIs, entrepreneurship is still looked at as a non ‘desirable’
thing; this creates even more difficulties in events of failure. This suggests that for public
researchers getting engaged into a new venture is a even more risky activity, if compared to
other entrepreneurs, because of both the intrinsic entrepreneurial risk embedded in the new
venture and the decision to leave a risk-less wage in a public job for a risky entrepreneurial
career with volatile earnings3 (Ozcan & Reichstein, 2009). We then hold that for public
3 Same empirical evidences support this view. Data shows that both initial earnings and earnings growth rates of most entrepreneurs are lower than those for comparable wage earners (Hamilton 2000), and that more than 1/3

11
researchers who decide to establish a new venture, risk-taking propensity plays a major role,
having a higher impact on entrepreneurial intentions than for private entrepreneurs.
Based on such arguments we put forward the following two hypotheses.
H1a: Public entrepreneurs have lower risk-taking propensity than private
entrepreneurs
H1b: The effect of risk-taking propensity on entrepreneurial intention is higher for
public entrepreneurs than for private entrepreneurs
Self-efficacy is another psychological facet proved to determine individual intentions.
Self-efficacy refers to a person’s belief in his or her capability to perform a given task
(Bandura, 1997) and to attain certain goals (Boyd & Vozikis, 1994). As a task oriented
behaviour, entrepreneurial self-efficacy can be defined as entrepreneurs’ beliefs and
confidence in their capabilities to affect the environment and being successful in
implementing entrepreneurial behaviors (Luthans & Ibrayeva, 2006).
Coherently with the aforementioned literature on public employment, individuals who
choose the public sector, consistently with the missions of their employers, tend to have a
greater interest in altruistic and ideological goals. As they progress in their careers, they
become gradually involved in PRIs and develop a strong sense of public service (the so-called
“public service motivation”), mutuating public service as their ultimate goal (Moynihan &
Pandey, 2007). As reviewed earlier by Wood and Bandura (1989) and by Zhao et al. (2005),
high self-efficacy expectations regarding performance in a specific behavioral setting lead
individuals to approach that setting, whereas low self-efficacy expectations lead individuals to
avoid that setting. It follows that individuals who firstly choose to being employed as public
of entrepreneurial activities likely fail during the first year of operations (based on Panel Study for Income Dynamics (PSID), Quadrini 1999).

12
servant, and only subsequently being entrepreneurs, will feel more confident in the
performance of altruistic and ideological behaviors rather then in attaining entrepreneurial
goals.
Moreover, consistent with previous research on career related self-efficacy, Boyd and
Vozikis (1994) and Chen, Greene and Crick (1998) view entrepreneurial self-efficacy as a
determinant of both the strength of entrepreneurial intentions and the likelihood that those
intentions will result in entrepreneurial actions. According to them, entrepreneurial intentions
are more likely to be positively affected by those individuals who have high beliefs in their
ability to influence the achievement of business goals (Chen et al., 1998). It follows that
entrepreneurial intentions are more likely predicted by entrepreneurial self-efficacy for those
individuals who consider themselves more efficacious in performing entrepreneurial roles and
tasks.
Based on that, we then put forward the following two hypotheses.
H2a: Public entrepreneurs have lower entrepreneurial self-efficacy than private
entrepreneurs
H2b: The effect of entrepreneurial self-efficacy on entrepreneurial intention is lower
for public entrepreneurs than for private entrepreneurs
Scholars also show that PRIs attract higher-quality individuals (Crewson, 1995; Ozcan
& Reichstein, 2009), helping them to acquire a set of abilities and idiosyncratic skills that are
coherent with PRIs tasks and missions – which have been identified primarily with research
related activities and teaching - (Ronstald, 1990). The public research system is designed so
to incentivate and recompensate mainly public knowledge and research development. As a
consequence PRIs’ employees through the years have come to develop mainly research skills,

13
contributing to the development of frontier knowledge, becoming themselves repository of
specific technical knowledge. We then expect that public entrepreneurs will develop cutting
edge abilities in technical-related fields, such as in product and process designs, if compared
to entrepreneurs with no such affiliation.
Building on this last point, scholars have also acknowledged the great relevance of
technical skills as important inputs for recognizing entrepreneurial opportunities, and more
generally, for triggering the entrepreneurial processes. Several PRIs’ employees, especially
the ones who research in high-technology fields, might see a commercialization potential of
their knowledge (Shane, 2004). Greater knowledge will directly provide greater awareness
about the existence of career options based on that knowledge (Ronstald, 1990). Coherently
with this view we see technical skills as critical in triggering entrepreneurial intentions for
public entrepreneurs.
Based on these arguments we put forward the following two hypotheses.
H3a: Public entrepreneurs have higher technical skills than private entrepreneurs.
H3b: The effect of technical skills on entrepreneurial intention is higher for public
entrepreneurs than for private entrepreneurs
Since the early 1980s, several PRIs have promoted closer linkages with the market,
adopting a more outward looking attitude on technology transfer and commercialization
related activities (Etzkowitz, 1983). As Slaughter and Leslie (1997) concluded ‘faculty
professional officers and administrators where reshaping their epistemology of science to
accommodate professional interactions with the market’. The investments that many PRIs
have done to foster entrepreneurial culture within their settings allowed researchers to
increase the frequency of interactions with industry people, and to develop more market-

14
oriented abilities. Notwithstanding, the development of managerial competences, such as
planning, organizing and executing entrepreneurial activities, are still under emphasized
within PRIs - if compared to private organizations -. Being employed in organizations with
mandates mainly focused on research related activities do not therefore foster the creation of
managerial competences among employees. We might then expect that public entrepreneurs
will develop lower levels of managerial skills if compared to entrepreneurs with no such
affiliations.
Besides that, there are several studies focused on technology transfer activities that
have highlighted that the lack of managerial competencies is often identified as one of the
main obstacles to academic spin-offs’ growth (Colombo & Grilli, 2005; O'Shea, Allen,
Morse, O'Gorman & Roche, 2007). Several researchers support this view and see public
entrepreneurship mainly fostered by industry skills and technical abilities rather then by
managerial skills. Sharing this approach, we hold that the impact of managerial skills on
entrepreneurial intentions for public entrepreneurs will be lower than for private ones.
We then propose the following two hypotheses.
H4a: Public entrepreneurs have lower managerial skills than private entrepreneurs
H4b: The effect of managerial skills on entrepreneurial intention is lower for public
than for private entrepreneurs
Finally, sharing the idea that intentions are determined by both internal and external
factors, we see environmental influences as direct predictor of entrepreneurial intentions
(Bird, 1988). Environment is framed as a result of affiliation to groups, organizations and
institutions (Saegert & Winkel, 1990; Charness, Rigotti & Rustichini, 2007). Public
researchers, as a result of their university affiliation, interpret the external environment

15
coherently with their roles as members of institutions. As public servant, they are biased in
scanning the environment for market opportunities (Burton et al., 2002). In particular, the
absence of (intense) competition in public markets increases the degree to which
organizations focus inward and erect information barriers that make it difficult for public
employees to glean information from the market for exploit entrepreneurial opportunities
(Ozcan & Reichstein, 2009).
In order to mitigate this, policy makers have put in place a set of norms and
infrastructures, aimed at supporting the technology transfer activities from PRIs to market.
The vast majority of these options, such as the access to business incubators (Mian, 1996) and
to science parks (Feldman, 2001), the presence of business plan competitions (Foo, Wong &
Ong, 2005) and the possibility to obtain financial incentives from governments (Beck et al.,
2005) are available to all firms. However, in several countries, in the attempt to bring research
to the market, a lot of effort has been specifically targeted to support entrepreneurial activities
spun-off from PRIs - in particular to the creation of academic spin-offs (Mustar, 1997;
Lockett, Siegel, Wright & Ensley, 2005). Specifically, the possibility to access public
laboratories and to be hosted in university incubators represent such examples (Mian 1996;
Feldman, 2001).
On top of that, public researchers are also more proactive in searching for government
support. This is again coherent with the idiosyncratic skills developed during their PRIs-
careers. Writing grants proposals or filing government applications in order to access public
infrastructures and equipments are activities in which public researchers are daily involved. It
follows that public entrepreneurs have more expertise in dealing with such bureaucratic
activities. The awareness about the availability of a highly supportive environment, together
with the developed abilities to deal with public bureaucracy will play a critical role in
determining their entrepreneurial intentions.

16
Coherently with that we put forward the two following hypotheses.
H5a: Public entrepreneurs receive greater support from the government than private
entrepreneurs
H5b: The effect of government support on entrepreneurial intention is higher for
public entrepreneurs than for private entrepreneurs
In Figure 1 we report the conceptual model summarizing the set of hypotheses
proposed in this section.
---------------------------------
Insert Figure 1 about here
---------------------------------
4. METHODOLOGY
4.1 Context
In order to test our assumptions, we adopted a quasi-experimental design. Coherently
with the definition provided by Cook and Campbell (1979), we identified a treatment (i.e.
starting a new venture while employed in a PRI), an outcome measure (i.e. the enactment of
entrepreneurial intentions), and some experimental units (i.e. a matched-pair sample of public
and private entrepreneurs). Beside that, we avoided using random assignment to create the
comparisons from which treatment-caused change is inferred. We used a passive
observational method and we drew causal inference based on measure taken all at one time,
with differential levels of both effects and exposures to presumed causes (i.e. entrepreneurs’
career-paths and organizational affiliation), being measured as they occur naturally, without
any experimental intervention. Moreover, in order to better describe individuals’ intentional
17
processes we selected a context characterized by high entrepreneurial dynamism within an
extremely static institutional landscape.
We thus located our study in the Emilia Romagna region, in Italy’s northeast. Emilia
Romagna, with an annual pro capita GDP of €28,684 - which is among the highest in Europe
(the European average is €22,400) (Eurostat 2005) -, represents one of the leading region in
EU for entrepreneurial activities. One of the peculiar characteristics of the Emilia Romagna
production system is represented by the presence of geographically concentrated clusters of
SMEs operating in specific sectors such as: industrial machinery (especially the packaging
sector), the agricultural and food sector (including well-known products such as Parmigiano
Reggiano (Parmesan) cheese, traditional balsamic vinegar and Parma ham), the mechanical
sector (with great strength in the motor industry, which includes Ducati, Ferrari, Lamborghini
and Maserati), the ceramic tile industry (the Sassuolo area is the world leader for both the
production of tiles and related machinery), and the bio-medical sector (specifically the
districts of Ferrara and Medolla) (Fini et al., 2009). Moreover, Emilia Romagna has been
identified by the EU commission as one of the leading regions in Europe for its increasing
number of academic spin-offs and, more generally, for its proactive role in supporting
research-to-industry technology transfer (Eurostat, 2007). With 89 firms, Emilia Romagna
leads Italy in terms of number of academic spin-offs (Piccaluga & Balderi, 2007) and
represents one of the few Italian regions where the commercialization of public research is
actually taking place.
Overall, the Italian context is characterized by the 26.4% of self-employment
(of total employed civilians); this percentage is above the 16.1% - average of OECD countries
(OECD, 2006) -. Notwithstanding, Italy is still characterized by a set of highly bureaucratic
governmental norms – that remained unchanged during the last decades – that are perceived
in most of the cases as obstacles to entrepreneurial activities (Baldini, Grimaldi & Sobrero,
18
2007). Beside that, government investments in new technologies and advanced knowledge are
fairly low. In 2006, the gross domestic expenditure (GDP) on R&D, as a percentage of GDP,
has been 1.14% - lower than OECD average of 2.26% -; similarly in 2003 the
investment in knowledge as a percentage of GDP has been 2.4% - lower than OECD average
of 4.9% -.
On top of that, Italian academics’ careers are very similar in all PRIs, showing no
idiosyncrasies due to the affiliation to specific institutions. They are all ruled by the same set
of norms, providing academics with a similar array of incentives. Moreover, in Italian PRIs,
and more generally in all Italian public organizations, there is almost no horizontal work force
mobility. Once an individual starts a career as a public employee, he/she remains employed in
the public sector and in that specific institution until retirement.
Given the availability of a such vivid entrepreneurial landscape – to a certain extent
fostered by PRIs technology transfer activities – and an highly static institutional landscape –
that provided all individuals with very similar set of incentives – we decided to compare the
intentional process of public and private entrepreneurs who established their firms in the
Emilia Romagna region. In the next section we describe the sampling strategy we relied on.
4.2 Sample and data gathering
4.2.1 Questionnaire
Based on the theoretical and empirical research about the foundation of
entrepreneurship, we developed a survey to collect primary data directly from entrepreneurs.
We gathered demographical information, such as gender, age and education, as well as
information on previous research and entrepreneurial activities, such as the number of patents
granted and the number of other firms established. We gathered information on the
entrepreneurs’ psychological characteristics, in terms of risk-taking propensity and
19
entrepreneurial self-efficacy, on developed skills, in terms of technical skills and managerial
skills, and on perceptions of entrepreneurial support received, in terms of government, context
and university support. We gathered some information on the motivational factors that have
fostered individuals to establish their own companies. We finally assessed the measurement
scale of entrepreneurial intention4 (scales and items are reported in appendix).
We ran a small-scale field pre-test to gather feedback on question phrasing and to find
out if other relevant facets of the domains under study remained untapped. Subsequently, a
panel of ten experts (professors and technology transfer managers) and ten entrepreneurs (5
public and 5 private entrepreneurs) validated the questionnaire. They provided very helpful
insights with regard to the questionnaire’s completeness and clarity, as well as an evaluation
of the time needed to complete it. No major inconsistencies emerged from this pre-test phase.
4.2.2. Sampling strategy
Our sampling strategy relies on a two-pronged approach. In order to control for
organizational and institutional dimensions, we first adopted a matching procedure at firm-
level, aimed at identifying a matched-pair sample of academic and private firms5. Secondly,
relying on the firm-level sampling strategy, we selected a matched-pair sample of public and
private entrepreneurs, comparing their intrinsic features and intentional processes6.
4 We also gathered some other information at both individual (i.e. personal traits and environmental influences) and firm level (i.e. turnover, innovative performance, debt and equity financing, and collaborations). The complete questionnaire has been translated and it’s available from the author. 5 We define academic spin-off as a company with either a PRI or at least one academic (full, associate, assistant professor, PhD student, research fellow or technician) among the founders. Such a definition encompasses situations where: a) there is a formal commitment of a PRI (the spin-off has passed through the spin-off regulation approval and the PRI is involved as one of the founders); b) there is no formal commitment of the PRI (except for individuals affiliated to PRI who decide to share equity) (Fini et al., 2009). We do not include in our definition those firms established by surrogate academic entrepreneurs based on a university technology licensing (Radosevich, 1995). On the contrary, we define private start-up a company without either PRI or public affiliated individuals between the founders, that at the establishment was not controlled by another private organization, either business or private institution (although other private organizations may have held minority shareholdings in the new firms (Colombo, DelMastro & Grilli, 2004). 6 We define a public entrepreneur as an individual who has founded and currently shares equity in an academic spin-off and he/she is employed (either tenure or not-tenured) in a PRI. With private entrepreneur we refer to an

20
4.2.2.1 Matching firms
Relying on existing research (Piccaluga & Balderi, 2007; Fini et al., 2009) and
through the regional PRIs7’ websites and technology transfer offices (where available), we
retrieved basic information on the population of 89 academic spin-offs, such as name,
telephone and e-mail contacts.
First, we targeted the regional population of academic spin-offs. After a first round of
e-mails at the end of November 2006, a second reminder sent to non-respondents at the
beginning of December 2006, and several phone calls, we set up face-to-face interviews with
134 individuals (132 founders and 2 CEOs) involved in 72 academic spin-offs. The data
collection was closed at the beginning of February 2007 with a total number of 72 academic
spin-offs visited and 132 entrepreneurs interviewed (we excluded the CEOs), corresponding
to an overall firm level response rate of 81% (=72/89) and an overall individual level response
rate of 39% (= 132/337).
We then matched the 72 academic spin-offs with 72 private start-ups in term of:
industry (ATECO code), year of establishment and localization8. The data collection started at
the end of February 2007 and was closed at the beginning of May 2007 with a total number of
61 private start-ups visited and 75 individuals interviewed (68 founders and 7 CEOs),
corresponding to an overall individual level response rate of about 37% (= 68/186).
We than dropped 9 pairs because for 9 private start-ups we collected information only
on CEOs and/or founders with an on-going relationship (as adjuncts) with PRIs9. Our final
matched-pairs sample included 52 academic spin-offs and 52 private start-ups10.
individual who founded and currently shares equity in a private start-up and he/she has not been employed (neither now nor in the past) in a PRI. 7 Five public universities and three public research centers. 8 The information on the regional population of private start-ups were retrieved through the databases of the Chamber of Commerce of Bologna. 9 These individuals started their commitments with PRIs after the establishment of their firms, as a result, based on our taxonomy, they are private entrepreneurs with an on-going temporary affiliation with public institutions. 10 As a roboustness check we also perfomed a matching procedure using a probit estimate (probability of being an academic spin-offs) by looking at industry, year of establishment and localization, with a one-to-one (nearest-
21
All the interviews were conducted by the same interviewer on the basis of the same
structured questionnaire and lasted, on average, two hours.
4.2.2.2 Matching individuals
We then implemented the matching procedure at individual level. Specifically, we had
information on 92 public entrepreneurs and 63 private entrepreneurs, among the founders of
the matched sample of 52 academic spin-offs and 52 private start-ups. The response rate for
academic spin-offs’ founders was 52% (=92/176) and for private start-ups’ founders 40%
(=63/158). In both sample no differences were recorded in terms of gender and year of birth
between respondents and non-respondents.
Relying on the collected evidences, we matched public entrepreneurs (treated
individuals) with private entrepreneurs (symmetric un-treated ones). We adopted three
different matching procedures, aimed at identifying two samples of individuals, founders of
comparable firms, with similar demographic profiles and likely to have been exposed to the
same set of entrepreneurial opportunities.
Coherently with a multiple respondents research design, we start considering the two
full samples of 92 public and 63 private entrepreneurs. We calculated the individual
propensity score (probability of being a public entrepreneur) using a probit estimate,
performing a one-to-one (nearest-neighbour) matching with replacement (Rosenbaum &
Rubin, 1983). As for the predictors, we encompassed both firm level dimensions, in terms of
industry, year of establishment, localization, and the presence of a private firm among the
founders, and individual level dimensions, in terms of gender and age. This procedure
neighbor) matching without replacement. The procedure resulted in a mean difference between academic and private firms of 4.26% (Std. Dev. .079), equaling a matching under a Caliper at. 30, confirming the goodness of the performed matching procedure.

22
resulted in a sample of 92 pairs, matched with a mean difference probability of 1.1% (Std.
Dev. .026), equalling a matching under Caliper at .15.
We then adopted a multiple-respondent approach characterized by a matching
procedure with no-replacement. This procedure allowed us to identify 63 pairs with a mean
difference probability of 4.01% (Std. Dev. .061), equalling a matching under Caliper at .36.
We finally adopted a single-respondent procedure, matching with no-replacement only
one entrepreneur for each firm. We identified 52 pairs, with a mean difference probability of
6.79% (Std. Dev. .107), equalling a matching under Caliper at .39.
As for all three specifications, mean difference probabilities and Caliper radius
resulted in acceptable values (Rosenbaum & Rubin 1983). These results allowed us to choose
the most parsimonious single respondent approach (52 vs. 52), avoiding the non-
independence of the regressors. Notwithstanding, as a robustness check, we tested our
regression models with both the 92 and 63 specifications. In Table 1 we report the group
means of the pre-treatment observable variables for the 52 pairs.
---------------------------------
Insert Table 1 about here
-----------------------------------
4.3 Measures and common method bias
We measured entrepreneurial intentions through an individual-level version of the
strategic posture scale (Covin & Slevin 1989). We characterize the entrepreneurial intention
concept in terms of willingness to create new value within an existing organization. This is
accomplished through the engagement in innovative, proactive and risky actions.
Innovativeness reflects an entrepreneur’s intention to have his/her firm engaged in new

23
experimentation and creative processes that may result in new products, services, or
technological processes. Proactiveness suggests the entrepreneur’s forward-looking
perspective, which is supposed to be a characteristic of a marketplace leader who has the
foresight to act in anticipation of future demand and shape the environment. Riskiness
measures the entrepreneur’s willingness to engage in risky projects and his/her preferences
for bold versus cautious acts in order to achieve firm objectives. For all other domains we
used scales used in the existing literature (see Table A1 in appendix for scales and items).
We evaluated the internal consistency of the constructs, checking for convergent
validity, through the assessment of the Composite Reliability (CR). CR is calculated as the
sum of the square roots of the item-squared multiple correlations squared and divided by the
same quantity plus the sum of the error variance (Werts, Linn, & Joreskog, 1974). Estimates
of CR above .60 and statistically significant concept-to-domain coefficients (t>2.0, p<.05) are
usually considered supportive of convergent validity (Bagozzi & Yi, 1988). All values had
CR significantly higher than the stipulated criteria, and all items were statistically significant.
Table 2 summarizes the measurement model latent variables, the number of measurement
items, the measurement description and format, and the composite reliability (CR).
---------------------------------
Insert Table 2 about here
-----------------------------------
We also verified the discriminant validity of the constructs using a three-pronged
approach. First, we computed the 95% confidence interval for each off-diagonal element of
the phi matrix, showing that in no case the interval included the value of 1.00. Second, we
performed a more formal test of discriminant validity, comparing the model under scrutiny

24
with a series of more restricted models in which the correlation between each pair of latent
constructs (or traits) has been, for one pair of constructs at a time, constrained to unity. The
significant differences in chi-square (one degree of freedom), between the null model and the
more restricted ones, points to a rejection of the hypothesis that any two constructs are not
mutually distinct. Finally, we determined that the average variance extracted by each latent
variable’s measure was larger than its shared variance with any other latent variable. This
index estimates the amount of variance captured by a construct’s measure relative to random
measurement error (Fornell & Larcker, 1981).
We also dealt with common method bias with both procedural and statistical methods
(Podsakoff, MacKenzie, Lee & Podsakoff, 2003). From a procedural standpoint, great care
was taken in the design of the questionnaire (i.e. proximal separation between the
measurement of the predictor and criterion variables, and use of different scale formats, such
as Likert-style scales, semantic differential scales, reverse coded and negatively worded
items) and in the execution of the interviews (i.e. same interviewer and protocol). For some
predictors, such as environmental support related dimensions, as we report in Table A1 in the
appendix, we checked the consistency of the primary data gathered assessing the correlation
with existing secondary sources. Unfortunately, the “behavioral nature” of the research made
impossible, in some cases, to collect data from different sources. Moreover, limitations due to
the entrepreneurs’ tight schedules also inhibited the temporal distancing of different parts of
the questionnaire.
From a statistical standpoint, additional remedies were implemented to control for the
method biases that might occur in this particular research setting; more specifically, a
conservative single-method bias was assumed. According to the specifications of the
hierarchically nested co-variance structure models, originally recommended by Widaman
(1985) and subsequently used by Williams, Cote, and Buckley (1989), we used confirmatory

25
factor analysis to test four alternative measurement models. Model 1 (Null) was a null
measurement model assuming that no factors underlie the data and that inter-correlations
between measures could be explained by random error only. Model 2 (Trait) was a full
measurement model, in which the 6 traits of interest, plus random error, were assumed to
underlie the data. Model 3 (Method) posited that variation in measures could be explained by
a single method factor plus random error. Finally, Model 4 (Trait-Method) assumed that the
data could be accounted for by the 6 traits in Model 2, plus a single uncorrelated method
factor, plus random error. The results are presented in Tables 3 and 4. Table 3 shows the
results for Models 1-4, while Table 4 reports the comparisons between models needed to test
for the significance of trait and method effects.
---------------------------------
Insert Tables 3 and 4 about here
-----------------------------------
In order to assess the presence of a trait effect we compared the Trait and Null models
(Δχ2 (38)=1309.86, p<.001) and Trait-Method and Method models (Δχ2 (40)=589.98, p<.001),
revealing significant trait effects. Then, we proceeded to evaluate the presence of a common
method bias, checking for possible method effects, through the assessment of the differences
between Models 3 vs. 1 and Models 4 vs. 2. Both the comparisons between Method and Null
models (Δχ2 (25)=811.07, p<.001) and Trait-Method and Trait models (Δχ2 (27)=91.19,
p<.001) revealed that the method effect was significant.
Conclusively, we can state that the variance in the entrepreneurs’ responses can be
explained by the simultaneous effect of traits, method, and random error. The highly
unsatisfactory fit of the Method model (M3) and the small (albeit significant) gain in fit

26
achieved by adding the method factor to the Trait model (Method-Trait model, M4) support
the idea that common method bias accounts for a small variance in the data.
In particular as a result of Method-trait model, we decomposed the total variance in
trait effect (.44), method effect (.06) and error effect (.50). The impact of method bias
therefore is quite low, accounting for just 6% of the overall variance. A comparison to other
empirical benchmarks by Williams et al. (1989) gives further support to this assumption (trait:
.50; method: .27 and error: .23). Moreover, looking at individual measures (data are available
upon request), the method bias was uniformly low: the only exceptions were some of the
indicators underlying entrepreneurial intention that exhibit a moderate amount of bias (.10).
Therefore, in this specific case, we can safely state that the method bias will not play a
relevant role in inflating the structural relations between predictor and criterion variables.
In sum, the results of the independence test, the assessment of the convergent and
discriminant validities and the satisfactory estimation of the common method bias enabled us
to proceed to the estimation of multivariate models.
5. ANALYSES
5.1 Multiple sample analyses
We first compare the paired samples under a set of observable characteristics. We
firstly assess entrepreneurs’ educational level. Our results show that public entrepreneurs
have better educational profiles (in terms of years devoted to higher education), if compared
to private ones (11.69 vs. 8.31; p<.01). Similar patterns are reported for patenting activities,
showing that public entrepreneurs have obtained a higher number of patents than private
entrepreneurs, from the Italian Patent Office (1.27 vs. .12; p<.05), from the European Patent
Office (1.04 vs. .06; p<.05) and from the United States Patent Office (.94 vs. 04; p<.05). Also

27
the entrepreneurial activities differ between the two samples. Public entrepreneurs have
established fewer companies11 than private ones (.31 vs. .98; p<.01).
---------------------------------
Insert Table 5 about here
-----------------------------------
We also look for differences in factors fostering individuals to start their own
companies. Among the most important factors, they acknowledge the possibility to obtain
financial gains (.56 vs. .52; n.s.), to exploit new business opportunities (.56 vs. .56; n.s.) and
to create new jobs (.65 vs. 56; n.s.). Coherently with their PRIs employees positions, public
entrepreneurs haven’t started their companies aiming for independence and freedom, as
private ones did (.33 vs. .56; p<.05), but in order to commercialize the outputs of their own
research (.81 vs. .44; p<.01).
---------------------------------
Insert Table 6 about here
-----------------------------------
We finally look for some differences in individuals’ unobservable characteristics. As
for psychological characteristics, our result show that academics’ risk-taking propensity is
lower than private entrepreneurs’ one (5.29 vs. 6.02; p<.01), finding support for hypothesis
H1a. On the contrary, no statistical differences are registered in terms of entrepreneurial self-
efficacy; hypothesis H2a is therefore not supported. As we look for differences in individual
11 Other than the ones under scrutiny.
28
skills we find that the two samples do not differ in terms of technical skills (4.36 vs. 4.35;
n.s.), while they differ in terms of managerial skills (5.80 vs. 5.30; p<.01). Hypotheses H3a
and H4a are then not supported. Finally, as for contextual dimensions, we find that
government support is perceived to be significantly higher for academic entrepreneurs than
for private ones (3.35 vs. 1.56; p<.01). This result supports hypothesis H5a.
---------------------------------
Insert Table 7 about here
-----------------------------------
5.2 OLS regression models
As reported in Table 8, we use multivariate analyses to test for differences in
entrepreneurs’ intentional paths. As result of our quasi-experimental design, we managed to
collect information only on a small sample of individuals, being then unable to compare the
two samples applying structural equation modeling technique (Bollen, 1989). Therefore,
relying on the previously described confirmatory factor analysis, we specify both predictors
and dependent variable as first order latent factors and, in order to include them in linear
probability OLS models, we construct one macro indicator per latent factors, averaging the
items loading on that factor. We then regress entrepreneurial intention on the set of
covariates. In the regression table, for both samples, we report the mean and standard
deviation of the dependent variable, showing that no statistical differences occur between the
entrepreneurial intentions of the two types of entrepreneurs (5.28 vs. 5.42; n.s).
Conversely, the regression paths show that entrepreneurial intentions are differently
enacted within the two samples. We assess the different impacts of risk-taking propensity and
entrepreneurial self-efficacy on entrepreneurial intention. In particular, public entrepreneurs’

29
intentions are mainly explained by risk-taking propensity (βacad=.14; p<.05) while private
entrepreneurs’ intentions are mainly fostered by entrepreneurial self-efficacy (βpriv=.05;
p<.01). We also assess some differences with regard to developed skills. Our results show that
technical skills of public entrepreneurs better predict entrepreneurial intentions (βacad=.12;
p<.1), than for private ones. On the contrary, managerial skills of private entrepreneurs have
stronger impact (βpriv=.38; p<.01) than for public counterparts. Finally, in both samples the
government support has a highly positive effect for both public (βacad=.09; p<.1) and private
entrepreneurs (βpriv=.27; p<.05).
---------------------------------
Insert Tables 8, 9, 10 about here
-----------------------------------
5.3 Structural equation models on bootstrapped samples
In order to check for both stability and replicability of OLS results we implement
bootstrap analysis. Bootstrap is probably the best-known re-sampling method, that instead of
relying on theoretical assumptions to derive sampling distributions for statistical estimators, it
attempts to estimate these distributions empirically, using information drawn from the
original sample12 (Fan, 2003).
We employ a nonparametric bootstrap to perform statistical inference and to test for
the robustness of the obtained results. Re-samples of size N=52 are drawn with replacement
from the two original samples (i.e. public and private). To investigate the accuracy of the
bootstrap with respect to the number of bootstrap samples drawn (BS), each simulated data
12 In our case the paired-sample used to estimate the OLS models.

30
set has been repeatedly modeled in LISREL 8.80 (Joreskog & Sorbom, 2006), using 250, 500,
1000 and 2000 BS, drawn from the original sample (Nevitt & Hancock, 2001). All
bootstrapped samples are mutually independent of one another (i.e. none of the bootstrap
samples drawn for a particular value of BS are used as samples for any other value of BS).
For each bootstrapped sample we compute the corresponding correlation matrix and
we re-estimate the structural equation model, computing the structural coefficients for both
samples. If the structural equation model estimation procedure does not converge, we drop the
improper solutions, without replacing them with new samples. In Table 11 we report the
number of converged modellization (n). In our case, the occurrence of improper solution is
mainly due to small sample size conditions (N<100) (Nevitt & Hancock, 2001). In Table 11,
for both samples, we report the average values and standard deviations of gamma coefficients
under different bootstrapping conditions.
---------------------------------
Insert Table 11 about here
-----------------------------------
As Table 11 shows, the patterns within the two samples are confirmed and are more
evident as the bootstrapped sample sizes increase. Public entrepreneurs’ intentions are mostly
predicted by risk-taking propensity and technical skills, while for private entrepreneurs by
entrepreneurial self-efficacy and managerial skills. In both cases the impact of the
government support is positive and significant.
Differences between the two samples are coherent with the results obtained in OLS
regression models. As for psychological characteristics the impact of risk-taking propensity
becomes significantly higher for public (p<.01, as the sample size increases), while the

31
entrepreneurial self-efficacy is lower (p<.01). Similarly, the impact of technical skills is
higher for public (p<.01) while the influence that managerial skills have on entrepreneurial
intentions is lower (p<.01, as the sample size increases). Coherently with the previous
findings no differences are recorded in terms of government support.
5.4 Test of hypotheses on the determinants of entrepreneurial intentions
The obtained results allow us to test for the second set of hypotheses we put forward.
In Table 12 we provide a summary of the test of hypotheses, assessing the differences in the
determinants of entrepreneurial intentions.
As for the OLS specifications, in order to test for path differences, we run a test of
equality between the sets of coefficients in the two linear regressions (Chow test; Chow,
1960). In the table we report the path differences (βdiff), calculated as β(public) - β(private),
and the corresponding statistical significances (F-test results). Conversely, for structural
models we report, for each bootstrapped replication, the average path difference (γdiff),
estimated as γ(public) - γ(private), and the corresponding statistical significances (T-test
results).
In the OLS models, the path from risk-taking propensity to entrepreneurial intentions
does not differ between samples (βdiff=.212; n.s), although results show a higher impact for
public entrepreneurs than for private entrepreneurs. On the contrary, the pattern is statistically
different in all structural models (.514<γdiff<.94; p<.05). This implies that Hypothesis 1 is
only partially supported.
In both OLS and structural models, the path linking entrepreneurial self-efficacy to
entrepreneurial intention shows statistical differences between public and private
entrepreneurs. In particular, the influence of entrepreneurial self-efficacy is significantly
smaller for public entrepreneurs than for private entrepreneurs (βdiff=-.035; p<.05 and

32
-.771<γdiff<-.667; p<.01). Hypothesis 2 is then supported.
Similarly, we find some differences in the impact of both technical and managerial
skills on entrepreneurial intention. As for the former, the impact is higher for academic
entrepreneurs than for private entrepreneurs (βdiff=.29; p<.01 and .963<γdiff<.99; p<.01).
Hypothesis 3 therefore turns out to be supported. As for the latter, inequality is also registered
in terms of the impact of managerial skills on entrepreneurial intention. In particular the
impact of managerial skills is lower for academic entrepreneurs, both in OLS (βdiff=-.385;
p<.05) and structural models (-1.45<γdiff<-.859; p<.01). Hypothesis 4 is thus verified.
Finally we test for differences in the impact of government support on entrepreneurial
intention. Our results do not show any differences between the two paths, both in OLS
analysis (βdiff=-.175; n.s.) and in structural models (.086<γdiff<.486; n.s.). Hypothesis 5 is not
supported13.
---------------------------------
Insert Table 12 about here
-----------------------------------
6. CONCLUSION
6.1 Discussion
Public culture, which is an invisible but existing part of PRIs, promotes a sense of
organizational identity, trough a commitment to common values and beliefs such as mission,
ethics and trust. This culture affects members beyond their defined jobs and roles (Moon,
1999). Being affiliated to PRIs endow public researchers with a public service oriented 13 We adopt different OLS specifications in order to test for differences in regression paths. We assess the same differences between public and private entrepreneurs either comparing 92 public vs. 63 private (full sample), 63 public vs. 63 private (under matching procedure 63 vs. 63 with no-replacement) and 92 public vs. 92 private (under matching procedure 92 vs. 92 with replacement). The impact of entrepreneurial self-efficacy, technical skills and managerial skills systematically differ between the two samples.

33
mindset, as they come to share PRIs specific beliefs, values and culture (Henkel, 2005). All
their actions and behaviours are thus fostered by motivations that are coherent with their alma
mater’ missions.
In this contribution, we draw on the public service literature and we study how the
individuals’ specificities, developed as a result of their affiliation to PRIs, affect their
intentional process. In particular, relying on intentional theory, we compare the intentional
paths of individuals affiliated to PRIs - who decided to start a venture -, with a matched-pairs
sample of entrepreneurs without such previous career and affiliation.
Our results show that both types of entrepreneurs intend to equally pursue the creation
of new economic value within their businesses. Notwithstanding, their entrepreneurial
intentions are enacted following two markedly different intentional paths. Our proposed
behavioural model helps us to characterize such heterogeneity, allowing us to test for the two
sets of five hypotheses we put forward. After employing multivariate regression analyses and
structural equation modelling techniques, we show that entrepreneurial intentions are
differently rooted and differently determined within the two samples. For public
entrepreneurs, intentions are mainly predicted by risk-taking propensity and technical skills,
while for private entrepreneurs are strongly influenced by entrepreneurial self-efficacy and
managerial skills. In both groups, government support has a significant impact on the
entrepreneurial intentions. The two patterns highly differ in terms of technical skills - that
strongly predict public entrepreneurs intentions – as well as in terms of entrepreneurial self–
efficacy and management skills - that foster private entrepreneurs’ intentions -.
We can conclude that public entrepreneurship is then fostered by the awareness of a
superior knowledge in technical fields. Such entrepreneurs, before being involved in their
firms, have been excellent researchers – or at least they have developed cutting edge skills as
a result of their careers as researchers -. Conversely, private entrepreneurs appear to be

34
individuals who root their entrepreneurial intentions in intrinsic motivational factors and in
the ability to motivate and manage their employees and collaborators. Such motivational
aspects turn out to be critical in triggering their intentions.
Public entrepreneurship seems therefore a matter of abilities developed within the
PRIs and transferred to the market; these individuals act because they know how to do it.
Private entrepreneurship emerges instead from individuals’ belief of being able to perform
entrepreneurial actions through the management of the right resources. Private entrepreneurs
act therefore because they know they can do it.
6.2 Limitations
Despite we carefully design our study, this research still suffers from some limitations.
First of all, the cross-sectional design this research rests upon is robust enough to grant the
internal consistency of the obtained results, while greater care (and more research) is needed
in order to generalize the results to a broader entrepreneurial population. The cross-sectional
nature of our quasi-experiment allowed us to test for direct antecedents of intentions, without
being able to assess their impact on entrepreneurial behaviors and firms performances.
Secondly, we root our behavioral model on both individual and contextual variables.
As for the former we focus on psychological characteristics and developed skills, while for
the latter, we target environmental support. Besides these domains, we acknowledge that
some other factors, such as personal traits, social ties and technological opportunities, have
been proposed as antecedents of entrepreneurial intentions. Notwithstanding, we have decided
not to model them. We exclude demographics and personal traits because of their proved
inefficacy in predicting entrepreneurial intentions. We do not include social ties and network,
as we see social relations as direct predictor of entrepreneurial behaviors (Stam & Elfring,
2008). Finally, as we acknowledge the relevance of industry opportunities, market

35
heterogeneity (Miller & Friesen, 1982) and organizational factors (Covin & Slevin, 1988) in
predicting entrepreneurial intentions, we exclude them from our conceptual model as we
control for these dimensions with the firm-level matching-procedure.
36
REFERENCES Ajzen, I. 1991. The theory of planned behavior. Organizational Behavior and Human
Decision Processes, 50: 179-211. Armitage, C. J., & Conner, M. 2001. Efficacy of the theory of planned behavior: A meta–
analytic review. British Journal of Social Psychology, 40: 471–499. Bagozzi, R. P., & Yi, Y. 1988. On the Evaluation of Structural Equation Models. Academy of
Marketing Science Journal, 16(1): 74-95. Baldini, N., Grimaldi, R., & Sobrero, M. 2007. To patent or not to patent: A survey of Italian
inventors on motivations, incentives and obstacles to university patenting. Scientometrics, 70: 333–354.
Bandura, A. 1997. Self-efficacy: the exercise of self control. New York: Freeman. Baron, J. N. 1984. Organizational perspectives on stratification. Annual review of sociology,
10: 37–69. Baum, J. R., & Wally, S. 2003. Strategic decision speed and firm performance. Strategic
Management Journal, 24(11): 1107–1129. Baum, R.J., Locke, E., & Smith, K.G. 2001. A multidimensional model of venture growth.
Academy of Management Journal, 44(2): 292-303. Beck, T., Demirgüç-Kunt, A., & Maksimovic, V. 2005. Financial and legal constraints to firm
growth: does size matter?. Journal of Finance, 60(1): 137-151; Bellante, D., & Link., A. N. 1981. Are public sector workers more risk averse than private
sector workers? Industrial and Labor Relations Review, 34(3): 408–412. Bird, B. 1998. Implementing Entrepreneurial Ideas: The Case for Intention. The Academy of
Management Review, 13(3): 442-453. Blank, R. M. 1985. An analysis of workers’ choice between employment in the public and
private sectors, Industrial and Labor Relations Review. 38(2): 211–224. Bollen, K. 1989. Structural Equations with Latent Variables. New York: John Wiley &
Sons, Inc. Boyd, N.G. & Vozikis, G.S. 1994. The influence of self-efficacy on the development of
entrepreneurial intentions and actions. Entrepreneurship: Theory & Practice, 18(4): 63–77.
Burton, D. M., Sorensen, J. B., & Beckman, C. 2002. Coming from good stock: Career
histories and new venture formation. In M. Lounsbury & M. Ventresca (Eds.), Research in the sociology of organizations, vol. 19: 229 –262. Greenwich, CT: JAI Press.
37
Charness, G., Rigotti, L., & Rustichini, A. 2007. Individual behavior and group membership. The American Economic Review, September: 1340-1352.
Chen, C. C., Greene, P. G., & Crick, A. 1998. Does entrepreneurial self-efficacy distinguish
entrepreneurs from managers? Journal of Business Venturing, 13: 295–316. Chow G. C. 1960. Tests of Equality Between Sets of Coefficients in Two Linear Regressions.
Econometrica, 28(3): 591-605. Colombo, M. G., Del Mastro, M., & Grilli, L. 2004. Entrepreneurs’ human capital and the
start-up size of new technology-based firms. International Journal of Industrial Organization, 22: 1183–1211.
Colombo, M. G., Grilli, L. 2005. Founders' human capital and the growth of new technology-
based firms: A competence-based view, Research Policy 34(6): 795-815. Cook, T. & Campbell, D. 1979. Quasi Experimentation: design and analysis issues for field
settings. Houghton Mifflin, Boston. Covin, J. G., & Slevin, D. P. 1989. Strategic management of small firms in hostile and benign
environments. Strategic Management Journal, 10: 75-87. Crewson, P. E. 1995. Comparative analysis of public and private sector entrant quality.
American Journal of Political Science, 41(3): 1057–1065. Del Mar, F., & Shane, S. 2003. Does business planning facilitate the development of new
ventures? Strategic Management Journal, 24 (12): 1165–1186. Ensley, M. D. & Hmieleski, K. M. 2005. A comparative study of new venture top
management team composition, dynamics and performance between university-based and independent start-ups. Research Policy, 34(7): 1091–1105.
Epstein, A. 1978. Ethos and Identity, Tavistock, London. Etzkowitz, H. 1983. Entrepreneurial Scientists and Entrepreneurial Universities in American
Academic Science. Minerva, 21: 198-233. Eurostat. 2005. European Commission website, Long term indicators for regions and cities.
http://ec.europa.eu/index_en.htm. Eurostat. 2007. European Commission website, Cordis. http://cordis.europa.eu/home_en.html Fan, X. 2003. Using commonly available software for bootstrapping in both substantive and
measurement analyses. Educational and Psychological Measurement, 63(1): 24-50. Feldman, M. P. 2001. The entrepreneurial event revisited: firm formation in a regional
context. Industrial and Corporate Change, 10(4): 861-875.

38
Fini, R., Grimaldi, R., & Sobrero, M. 2009. Factors Fostering Academics to Start up New Ventures: an Assessment of Italian Founders' Incentives. Journal of technology transfer, 34: 380–402.
Foo, M. D., Wong, P. K. & Ong, A. 2005. Do others think you have a viable business idea?
Team diversity and judges' evaluation of ideas in a business plan competition’. Journal of Business Venturing, 20(3): 385-402.
Forlani, D., & Mullins, J.W. 2000. Perceived risks and choices in entrepreneurs’ new venture
decisions. Journal of Business Venturing, 15: 305 – 322. Fornell, C., & Larcker, D. F. 1981. Structural equation models with unobservable variables
and measurement error: Algebra and statistics. Journal of Marketing Research, 18(3): 382-389.
Fujiwara-Greve, T., & Greve., H. R. 2000. Organizational ecology and job mobility. Social
Forces, 79(2): 547–585. Gartner, W. B. 1989. Who is an entrepreneur? is the wrong question. Entrepreneurship
Theory and Practice, 13(4): 47–68. Gomez-Mejia, L.R., & Balkin, D. 1989. Effectiveness of Individual and aggregate
compensation strategies. Industrial relations, 28(3): 431-445. Gupta, A.K., & Govindarajan, V. 2000. Knowledge flows within multinational corporations.
Strategic management journal, 21(4): 473-496. Hamilton, B. H. 2000. Does entrepreneurship pay? An empirical analysis of the returns of
self-employment. Journal of Political Economy, 108(3): 604–631. Henkel, M. 2005. Academic Identity and Autonomy in a Changing Policy Environment.
Higher Education, 49: 155–176. Hyland K., 1997. Scientific claims and community values: articulating an academic culture.
Language & Comunication, 17(1): 19-31. Jackson, D. N., Hourany, L., & Vidmar, N. J., 1972. A four dimensional interpretation of risk
taking. Journal of Personality, 40: 433-501. Joreskog, K., & Sorbom, D. 2006. Lisrel 8.80, software. Jovanovic, B. 1979. Job matching and the theory of turnover. Journal of Political Economy,
87(5): 972–990. Krueger, N. F., Reilly, M., & Carsrud, A. 2000. Competing models of entrepreneurial
intentions. Journal of business venturing, 15(5/6): 411-432. Lerner, J. 1999. The Government as Venture Capitalist: The Long-Run Impact of the SBIR
Program. Journal of Business, 72(3): 285–318.

39
Lockett, A., Siegel, D., Wright, M. & Ensley, D. 2005. The Creation of Spin-off firms at Public Research Institutions: Managerial and Policy Implications. Research Policy, 34(7): 981-993.
Luthans, F., & Ibrayeva, E. S. 2006. Entrepreneurial self-efficacy in central Asian transition
economies quantitative and qualitative analyses. Journal of International Business Studies, 37: 92-110.
Luthje, C., & Franke, N. 2003. The ‘making’ of an entrepreneur: testing a model of
entrepreneurial intent among engineering students at MIT. R&D Management, 33(2): 135–148.
Manstead, A. S. R., & Van Eekelen, S. A. M. 1998. Distinguishing between perceived
behavioral control and self-efficacy in the domain of academic achievement intentions and behaviors. Journal of Applied Social Psychology, 28: 1375–1392.
March, J. G., & Shapira, Z. 1987. Managerial perspectives on risk and risk taking.
Management Science, 33: 1404 – 1418. March, J. G., & Olsen J.P. 1989. Rediscovering Institutions: The Organizational Basis of
Politics. New York: Free Press. Markman, G. D., Balkin, D. B., & Baron, R. A. 2002. Inventors and new venture formation:
The effects of general self-efficacy and regretful thinking. Entrepreneurship Theory and Practice, 27(2): 149 –166.
Merton R. K., 1958. The Matthew effect in science. Science, 159 (3810): 56-63. Merton, R. K. 1988. The Matthew Effect in Science, II, Cumulative Advantage and the
Symbolism of Intellectual Property ISIS, 79: 606-623. Mian, S.A. 1996. Assessing value-added contributions of university technology business
incubators to tenant firms. Research Policy, 25(3): 325-335. Miller, S. & Friesen, P., 1982. Innovation in conservative and entrepreneurial firms: Two
models of strategic momentum. Strategic Management Journal, 3: 1-25. Mitchel, J. 1981. The Effect of Intentions, Tenure, Personal, and Organizational Variables on
Managerial Turnover. The Academy of Management Journal, 24(4): 742-751. Moon, M. J. 1999. The Pursuit of Managerial Entrepreneurship. Public Administration
Review, 59(1): 31−43. Morris, M., & Lewis, P. 1995. The determinants of entrepreneurial activity. European
journal of marketing, 29(7): 31-48. Mount, M. K., & Barrick, M. R. 1995. The big five personality dimensions: implications for
research and practice in human resources management. Research in personal and human resources management, 13: 153 – 200.
40
Moynihan, D., & Pandey, S. K. 2007. The role of organizations in fostering public service motivation. Public Administration Review, 67(1): 40-53.
Mustar, P. 1997. Spin off enterprises. How French academics create high-tech companies:
conditions for success or failure. Science and Public Policy, 24(1): 37-43. Nevitt, J, & Hancock, GR. 2001. Performance of bootstrapping approaches to model test
statistics and parameter standard error estimation in structural equation modeling. Structural Equation Modeling, 8: 353–77.
Niosi, J., & Bas, T.G. 2001. The competencies of regions: Canada’s clusters in
Biotechnology. Small Business Economics, 17(1–2): 31–42. OECD. 2006. Country statistical portal, http://www.oecd.org/statsportal O'Shea, R. P., Allen, T. J., Morse, K. P., O'Gorman, C., & Roche, F. 2007. Delineating the
anatomy of an entrepreneurial university: the Massachusetts Institute of Technology experience, R & D Management, 37(1): 1-25.
Özcan, S. & Reichstein, T. 2009. Transition to Entrepreneurship from the Public Sector:
Predispositional and Contextual Effects, Management Science, forthcoming. Perry, J. 1996. Bringing Society in: Toward a theory of public service motivation. Journal of
Public Administration Research and Theory, 10(2): 471-488. Piccaluga, A., & Balderi, C. 2007. Consistenza ed evoluzione delle imprese spin off della
ricerca pubblica in Italia. Report Finlombarda. Plax, T., & Rosenfeld, L., 1976. Correlates of risky decision making. Journal of Personality
Assessment. 40: 413 – 418. Podsakoff, P.M., MacKenzie, S., Lee, J-Y., & Podsakoff, N.P. 2003. Common Method Biases
in Behavioral Research: A Critical Review of the Literature and Recommended Remedies. Journal of Applied Psychology, 88: 879–903.
Quadrini, V. 1999. The importance of entrepreneurship for wealth concentration and mobility.
Review of Income and Wealth, 45(3): 1–19. Radosevich, R. 1995. A model for entrepreneurial spin-offs from public technology sources.
International Journal of Technology Management, 10(7/8): 879-93. Roberts, E. B., & Fusfeld, A. R. 1981. Staffing the Innovative Technology-Based
Organization. Sloan Management Review, 22(3): 19. Ronstadt, R. 1990. The educated entrepreneurs: a new era of entrepreneurial education is
beginning. In C.A. Kent (Eds.), Entrepreneurship education: current developments, future directions, Quorum Books, Westport.
Rosenbaum, P. R. & Rubin, D. B. 1983. The central role of the propensity score in
observational studies for causal effects. Biometrika, 70(1): 41-55.

41
Saegert, S. & Winkel, G. H. 1990. Environmental Psychology. Annual Reviews Psychology,
41: 441-477. Shane, S. 1999. Prior knowledge and the discovery of entrepreneurial opportunities
Organization Science, 11(4): 448–469. Shane, S. 2004. Academic Entrepreneurship: University Spin-offs and Wealth Creation.
UK: Edward Elgar Publishing. Shane, S., & Venkataraman, S. 2000. The Promise of Entrepreneurship as a Field of
Research, Academy of Management Review, 25(1): 217–226. Slaughter, S. & Leslie, L. 1997. Academic Capitalism: Politics, Policies, and the
Entrepreneurial University. Baltimore, MD: Johns Hopkins University Press. Stam, W., & Elfring, T. 2008. Entrepreneurial Orientation and New Venture Performance:
The Moderating Role of Intra and Extraindustry Social Capital, The Academy of Management Journal, 51(1): 97–111.
Stephan, P. E., 1996. The economics of science. Journal of Economic Literature, 34(3):
1199. Stevenson, H.H., & Jarillo, J.C. 1986. Preserving entrepreneurship as companies grow.
Journal of Business Strategy, 6: 10–23. Stewart, W., & Roth, P. 2001. Risk propensity differences between entrepreneurs and
managers: A meta-analytic review. Journal of Applied Psychology, 86: 145-153. Sutton, S. 1998. Predicting and Explaining Intentions and Behavior: How Well Are We
Doing? Journal of Applied Social Psychology, 28(15): 1317-1338. Tubbs, M. E., & Ekeberg, S. E. 1991. The role of intentions in work motivation:
Implications for goal-setting theory and research. Academy of Management Review. 16, 180-199.
Van Dijk, T. A. 1995. Discourse semantics and ideology. Discourse and Society, 6(2): 243 –
289. Werts, C. E., Linn, R. L., & Joreskog, K. 1974. Interclass reliability estimates: Testing
structural assumptions. Educational and Psychological Measurement, 34: 25–33. Widaman, K. F. 1985. Hierarchically nested covariance structure models for multitrait-
multimethod data. Applied Psychological Measurement, 9: 1–26. Wiklund, J., & Shepherd, D. 2003. Knowledge-Based Resources, Entrepreneurial Orientation,
and the Performance of Small and Medium-Sized Businesses. Strategic Management Journal, 24: 1307–1314.
42
Williams, L.J., Cote, J.A., & Buckley, M.R. 1989. The lack of method variance in self-reported affect and perceptions at work: Reality or artifact? Journal of Applied Psychology, 74: 462–468.
Wood, R., & Bandura, A. 1989. Social cognitive theory of organizational management.
Academy of Management Review, 14(3): 361-384. Zhao, H., Seibert, S. E. & Hills, G.E. 2005 The Mediating Role of Self-Efficacy in the
Development of Entrepreneurship Intentions. Journal of Applied Psychology, 90(6): 1265-1272.

43
EXHIBITS
TABLE 1 Matched-pairs comparison: pre-treatment observables
Observables
Mean public
entrepreneurs (N=52)
Mean private
entrepreneurs (N=52)
Difference T-test
Firm level Year of establishment 2003.19 2003.31 -.12 -.27 (.31) (.29) (.42) Localization: North-east .15 .13 .02 .28 (.05) (.05) (.07) Localization: South-east .06 .06 .00 .00 (.03) (.03) (.05) Localization: North-west .13 .17 -.04 -.54 (.05) (.05) (.07) Sector: Environment .27 .19 .08 .93 (.06) (.06) (.08) Sector: Biomedical .17 .13 .04 .54 (.05) (.05) (.07) Sector: Material .27 .29 -.02 -.22 (.06) (.06) (.09) Sector: Advanced services .04 .02 .02 .58 (.03) (.02) (.03) Private firm among founders .19 .15 .38 .34 (.05) (.10) (.11)
Individual level Male .85 .92 -.08 -1.22 (.05) (.04) (.06) Age 57.69 57.12 .58 .26 (1.62) (1.56) (2.25)
Standard errors in parentheses. *** p<.01, ** p<.05, * p<.1. Baseline dummy for Localization is South-west. In the South-west category we include Bologna and Modena, in the Nort-east one we include Ferrara, in the South-east one we include Forlì-Cesena and Ravenna, while in the Nort-west one we include Reggio Emilia, Parma and Piacenza. Baseline dummy for Sector is Electronics. In the Electronics category we include aerospace, computers, electronic components, internet and telecommunication services and software; in the Environment one we include environment related services and energy; in the Biomedical one we include biochemistry, biotechnology, medical and pharmaceuticals; in the Material one we include, mechanical equipment, optical equipment, advanced mechanics and automation; in the Advanced Services one we include architectural, civil engineering and statistical services.
TABLE 2 Predictor Measures (N=104)
Domain and predictor
Item Scale format Research reference CR
Entrepreneurial intention Entrepreneurial intention 9 1 to 7 forced choice scale Covin & Slevin, 1989 .88
Psychological characteristics Entrepreneurial self-efficacy 2 0 to 7 scale Baum, Locke & Smith, 2001 .92 Risk-taking propensity 4 1 to 7 likert like scale Gomez & Meija, 1989 .85
Skills and prior knowledge Technical skills 3 1 to 7 scale Gupta & Govindarajan, 2000 .80 Managerial skills 5 1 to 7 likert like scale Roberts & Fusfeld, 1981 .89
Contextual dimension Government support 2 1 to 7 likert like scale Fini, Grimaldi & Sobrero, 2009 .73
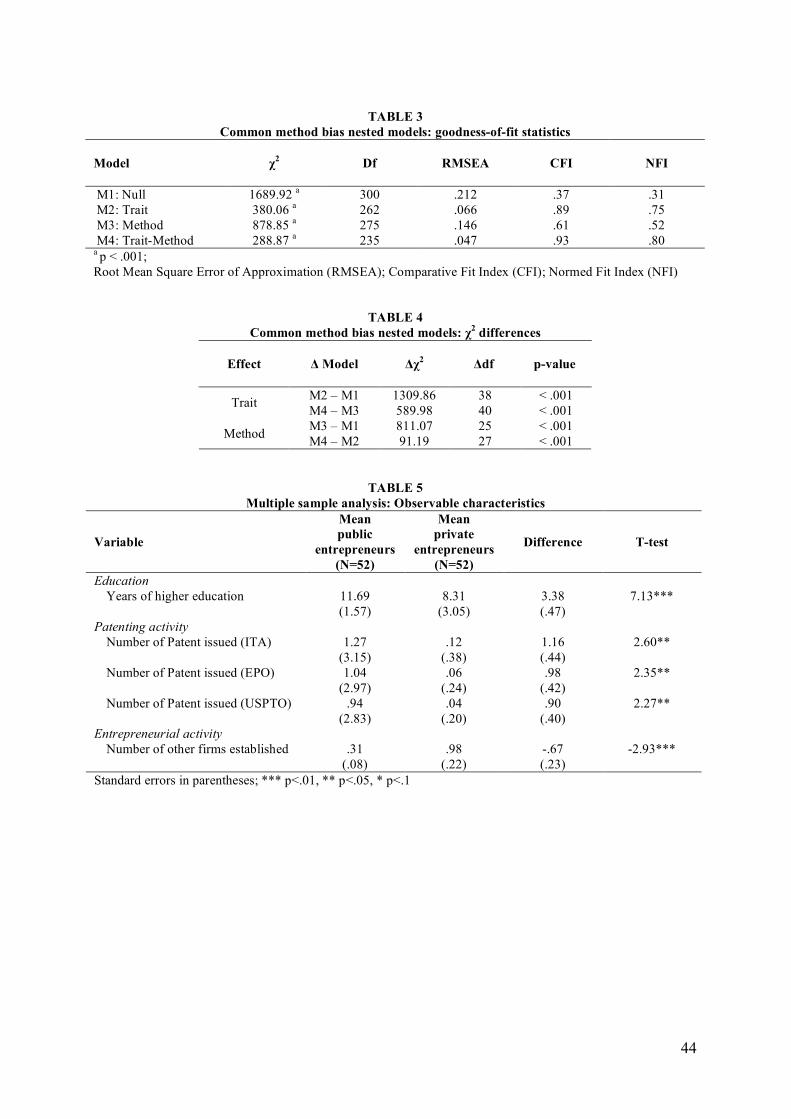
44
TABLE 3
Common method bias nested models: goodness-of-fit statistics
Model χ2
Df
RMSEA
CFI NFI
M1: Null 1689.92 a 300 .212 .37 .31 M2: Trait 380.06 a 262 .066 .89 .75 M3: Method 878.85 a 275 .146 .61 .52 M4: Trait-Method 288.87 a 235 .047 .93 .80 a p < .001; Root Mean Square Error of Approximation (RMSEA); Comparative Fit Index (CFI); Normed Fit Index (NFI)
TABLE 4 Common method bias nested models: χ2 differences
Effect
Δ Model Δχ2 Δdf p-value
M2 – M1 1309.86 38 < .001 Trait M4 – M3 589.98 40 < .001 M3 – M1 811.07 25 < .001 Method M4 – M2 91.19 27 < .001
TABLE 5 Multiple sample analysis: Observable characteristics
Variable
Mean public
entrepreneurs (N=52)
Mean private
entrepreneurs (N=52)
Difference T-test
Education Years of higher education 11.69 8.31 3.38 7.13*** (1.57) (3.05) (.47)
Patenting activity Number of Patent issued (ITA) 1.27 .12 1.16 2.60** (3.15) (.38) (.44) Number of Patent issued (EPO) 1.04 .06 .98 2.35** (2.97) (.24) (.42) Number of Patent issued (USPTO) .94 .04 .90 2.27** (2.83) (.20) (.40)
Entrepreneurial activity Number of other firms established .31 .98 -.67 -2.93***
(.08) (.22) (.23) Standard errors in parentheses; *** p<.01, ** p<.05, * p<.1
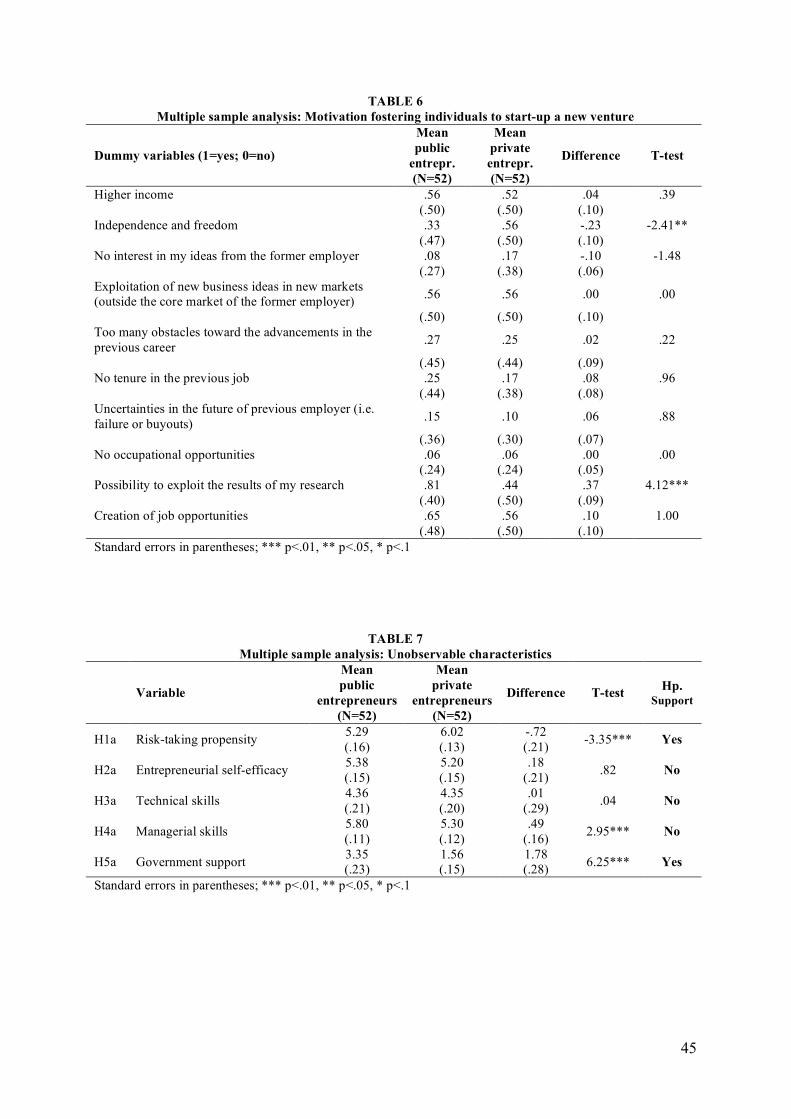
45
TABLE 6 Multiple sample analysis: Motivation fostering individuals to start-up a new venture
Dummy variables (1=yes; 0=no)
Mean public
entrepr. (N=52)
Mean private entrepr. (N=52)
Difference T-test
Higher income .56 .52 .04 .39 (.50) (.50) (.10) Independence and freedom .33 .56 -.23 -2.41** (.47) (.50) (.10) No interest in my ideas from the former employer .08 .17 -.10 -1.48 (.27) (.38) (.06) Exploitation of new business ideas in new markets (outside the core market of the former employer) .56 .56 .00 .00
(.50) (.50) (.10) Too many obstacles toward the advancements in the previous career .27 .25 .02 .22
(.45) (.44) (.09) No tenure in the previous job .25 .17 .08 .96 (.44) (.38) (.08) Uncertainties in the future of previous employer (i.e. failure or buyouts) .15 .10 .06 .88
(.36) (.30) (.07) No occupational opportunities .06 .06 .00 .00 (.24) (.24) (.05) Possibility to exploit the results of my research .81 .44 .37 4.12*** (.40) (.50) (.09) Creation of job opportunities .65 .56 .10 1.00 (.48) (.50) (.10) Standard errors in parentheses; *** p<.01, ** p<.05, * p<.1
TABLE 7
Multiple sample analysis: Unobservable characteristics
Variable
Mean public
entrepreneurs (N=52)
Mean private
entrepreneurs (N=52)
Difference T-test Hp. Support
H1a Risk-taking propensity 5.29 (.16)
6.02 (.13)
-.72 (.21) -3.35*** Yes
H2a Entrepreneurial self-efficacy 5.38 (.15)
5.20 (.15)
.18 (.21) .82 No
H3a Technical skills 4.36 (.21)
4.35 (.20)
.01 (.29) .04 No
H4a Managerial skills 5.80 (.11)
5.30 (.12)
.49 (.16) 2.95*** No
H5a Government support 3.35 (.23)
1.56 (.15)
1.78 (.28) 6.25*** Yes
Standard errors in parentheses; *** p<.01, ** p<.05, * p<.1
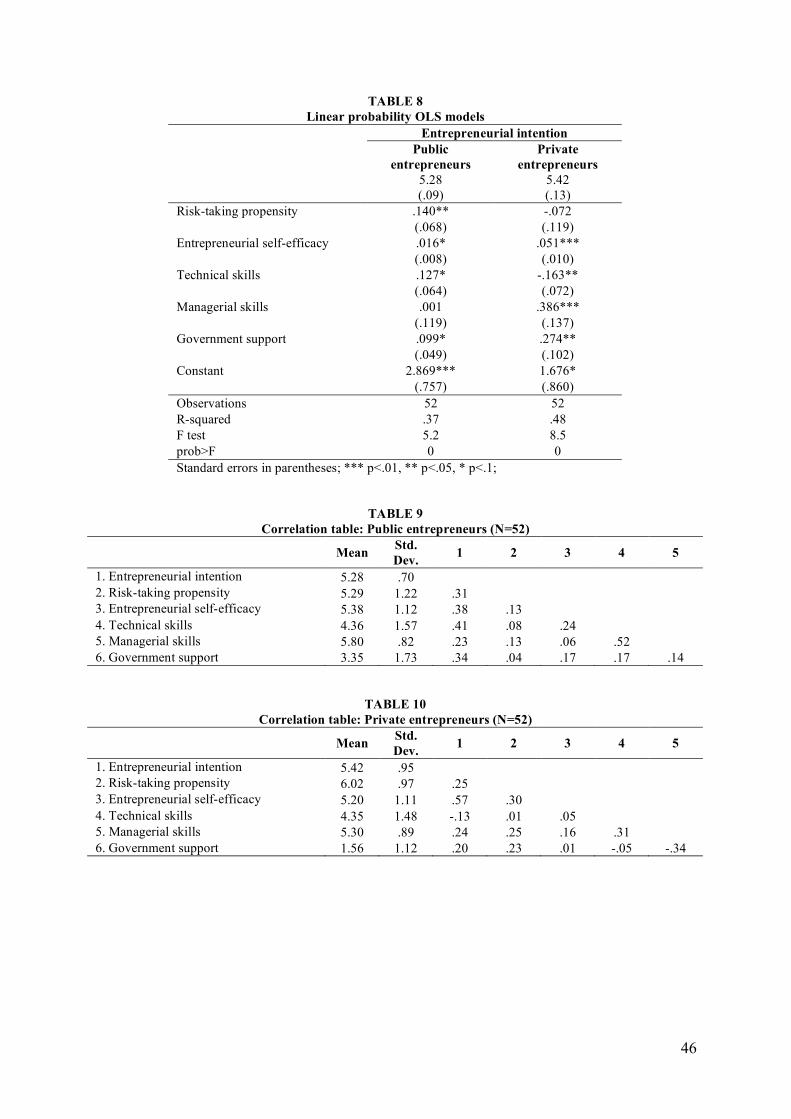
46
TABLE 8 Linear probability OLS models
Entrepreneurial intention
Public entrepreneurs
Private entrepreneurs
5.28 (.09)
5.42 (.13)
Risk-taking propensity .140** -.072 (.068) (.119) Entrepreneurial self-efficacy .016* .051*** (.008) (.010) Technical skills .127* -.163** (.064) (.072) Managerial skills .001 .386*** (.119) (.137) Government support .099* .274** (.049) (.102) Constant 2.869*** 1.676* (.757) (.860) Observations 52 52 R-squared .37 .48 F test 5.2 8.5 prob>F 0 0 Standard errors in parentheses; *** p<.01, ** p<.05, * p<.1;
TABLE 9
Correlation table: Public entrepreneurs (N=52)
Mean Std. Dev. 1 2 3 4 5
1. Entrepreneurial intention 5.28 .70 2. Risk-taking propensity 5.29 1.22 .31 3. Entrepreneurial self-efficacy 5.38 1.12 .38 .13 4. Technical skills 4.36 1.57 .41 .08 .24 5. Managerial skills 5.80 .82 .23 .13 .06 .52 6. Government support 3.35 1.73 .34 .04 .17 .17 .14
TABLE 10
Correlation table: Private entrepreneurs (N=52)
Mean Std. Dev. 1 2 3 4 5
1. Entrepreneurial intention 5.42 .95 2. Risk-taking propensity 6.02 .97 .25 3. Entrepreneurial self-efficacy 5.20 1.11 .57 .30 4. Technical skills 4.35 1.48 -.13 .01 .05 5. Managerial skills 5.30 .89 .24 .25 .16 .31 6. Government support 1.56 1.12 .20 .23 .01 -.05 -.34

47
TABLE 11 Summary of means and standard deviations for Gamma in SEM
Bootstrap (BS=250)
Means Bootstrap (BS=500)
Means Bootstrap (BS=1000)
Means Bootstrap (BS=2000)
Means
Path specification Public
entrepr. Private entrepr.
Public entrepr.
Private entrepr.
Public entrepr.
Private Entrepr.
Public entrepr.
Private entrepr.
n=199 n=164 T-test n=395 n=334 T-test n=801 n=668 T-test n=1574 n=1348 T-test Risk-taking propensity Entrepreneurial intention .334 -.18 2.33** .314 -.39 4.70*** .324 -.616 8.80*** .329 -.58 12.74*** (1.066) (2.878) (1.146) (2.7) (1.136) (2.752) (1.182) (2.524) Entrepreneurial self-efficacy Entrepreneurial intention .038 .809 -5.29*** .085 .814 -9.25*** .117 .824 -15.99*** .129 .796 -25.6*** (1.814) (.473) (1.317) (.632) (1.011) (.583) (.825) (.523) Technical skills Entrepreneurial intention .805 -.158 6.94*** .813 -.165 10.18*** .774 -.216 15.39*** .771 -.215 21.82*** (1.427) (1.165) (1.242) (1.347) (1.19) (1.271) (1.326) (1.077) Managerial skills Entrepreneurial intention -.402 .457 -2.24** -.528 .602 -4.99*** -.597 .851 -10.09*** -.546 .854 -15.12*** (3.738) (3.485) (2.843) (3.263) (2.364) (3.126) (2.281) (2.723) Government support Entrepreneurial intention .964 .478 1.24 .989 .715 1.05 1.02 .949 .4 1.017 .931 .71 (2.917) (4.449) (2.225) (4.538) (2.271) (4.287) (2.455) (4.002) Standard deviations in parentheses; *** p<.01, ** p<.05, * p<.1; Bootstrap samples, both for Public and Private entrepreneurs, are of the same size (N=52) of the two original samples; BS=number of bootstrapped samples; n=number of bootstrapped samples that converge to a solution.
TABLE 12 Summary of the test of hypotheses
OLS (βdiff) SEM (γdiff) BS=250 SEM (γdiff) BS=500 SEM (γdiff) BS=1000 SEM (γdiff) BS=2000 Hp. Path specification Path diff Sig. Path diff Sig. Path diff Sig. Path diff Sig. Path diff Sig. support H1b Risk-taking propensity
Entrepreneurial intention .212 - .514 ** .70 *** .94 *** .909 *** Part.
H2b Entrepreneurial self-efficacy Entrepreneurial intention -.035 ** -.771 *** -.73 *** -.71 *** -.667 *** Yes
H3b Technical skills Entrepreneurial intention .290 *** .963 *** .98 *** .99 *** .986 *** Yes
H4b Managerial skills Entrepreneurial intention -.385 ** -.859 ** -1.13 *** -1.45 *** -1.4 *** Yes
H5b Government support Entrepreneurial intention -.175 - .486 - .27 - .07 - .086 - No
*** p<.01, ** p<.05, * p<.1; Path differences are computed for OLS as β(public) - β(private) and for SEM as γ(public) - γ(private)

48
FIGURE 1 Summary of hypotheses

49
APPENDIX TABLE A1
Details of Measures Latent variable Items description Entrepreneurial intention In the next year I want my firm:
1. (1) favors a strong emphasis on the marketing of tried and true products or services or (7) favors a strong emphasis on R&D, technological leadership and innovation
2. (1) favors the introduction of no new lines of products or services or (7) favors the introduction of very many new lines of products or services
3. (1) favors changes in product or services lines mostly of a minor nature or (7) favors quite dramatic changes in product or services line
4. (1) responds to action which competitors initiate or (7) initiates actions which competitors then respond to
5. (1) would be very seldom the first businesses to introduce new products/services or (7) would be the first business to introduce new products/services
6. (1) seeks to avoid competitive clashes, preferring a “live and let live” posture or (7) adopts a very competitive, “undo the competitors” posture
7. (1) has a strong proclivity for low risk projects (with normal and certain rates of return) or (7) has a strong proclivity for high risk projects (with chances of very high returns)
8. (1) explores the environment gradually, via timid, incremental behavior or (7) acts bold, wide-ranging in order to achieve the firm’s objectives
9. (1) adopts a cautious, “wait and see” posture in order to minimize the probability of making costly decisions or (7) adopts a bold, aggressive posture in order to maximize the probability of exploiting potential opportunities.
Risk-taking propensity
Please indicate how strongly you agree or disagree with each statement by circling the appropriate number (1=strongly disagree; 7=strongly agree):
1. I’m not willing to take risks when choosing a job or a company to work for
2. I prefer a low risk/high security job with a steady salary over a job that offers high risks and high rewards
3. I prefer to remain in a job that has problems that I know about rather than take the risk of working at a new job that has unknown problems even if the new job offers greater rewards
4. I view risk on a job as a situation to be avoided at all costs.
Entrepreneurial self-efficacy
Thinking about your skills, write a number from the confidence scale below (1 to 7) to show how sure you are that you can beat the % change in 2007 (compared with 2006) [the same for 2008 compared with 2007]:
1. Up 100% or better 2. Up 50% or better 3. Up 20% or better 4. Up 5% or better 5. No change or better 6. Down 5% or better 7. Down 10% or better 8. Down 25% or better.
Technical skills Please assess the skill levels you have now (1=no skills at all; 7=very skilled): 1. Product designs 2. Process designs 3. Production systems.
Managerial skills
Please indicate how strongly you agree or disagree with each statement by circling the appropriate number (1=strongly disagree; 7=strongly agree):
1. I’m good at problem solving 2. I’m good at communicating my point of view and supporting my ideas 3. I’m good at motivating people and leading teams 4. I’m good at the maintaining interpersonal relationships and coordinating people
5. I’m good at developing resources and creating new competencies within the organization
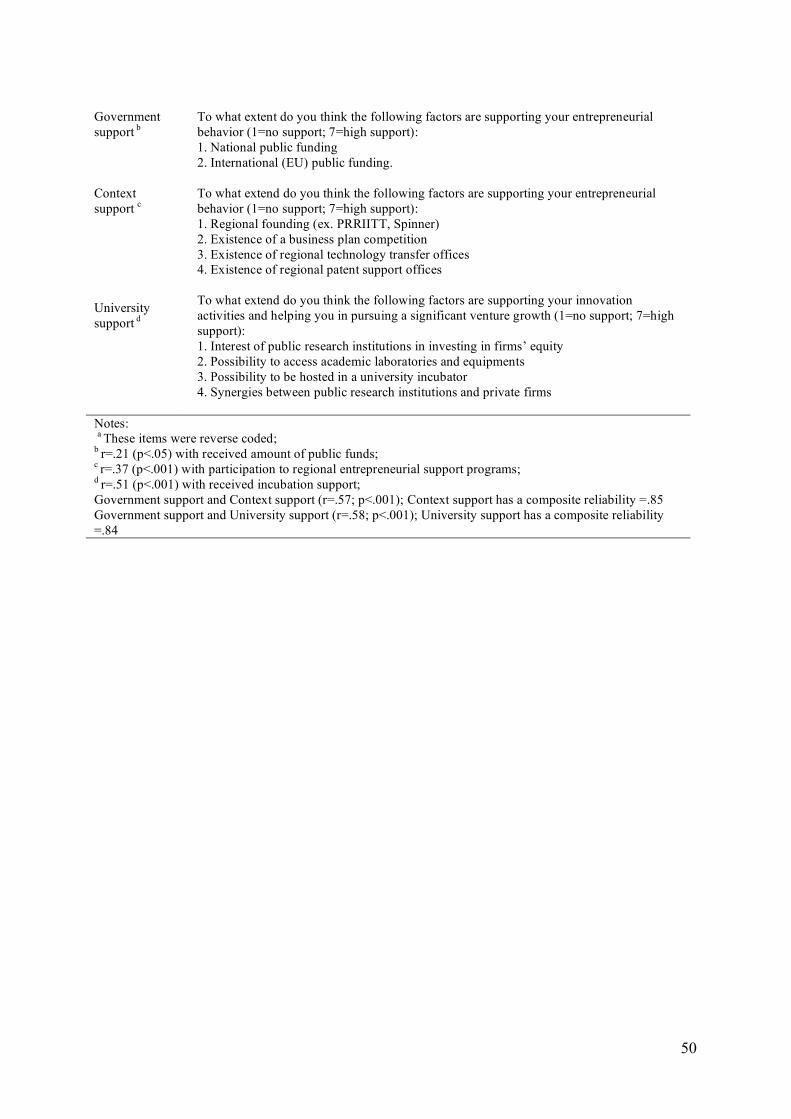
50
Government support b
To what extent do you think the following factors are supporting your entrepreneurial behavior (1=no support; 7=high support):
1. National public funding 2. International (EU) public funding. Context support c
To what extend do you think the following factors are supporting your entrepreneurial behavior (1=no support; 7=high support):
1. Regional founding (ex. PRRIITT, Spinner) 2. Existence of a business plan competition 3. Existence of regional technology transfer offices 4. Existence of regional patent support offices
University support d
To what extend do you think the following factors are supporting your innovation activities and helping you in pursuing a significant venture growth (1=no support; 7=high support):
1. Interest of public research institutions in investing in firms’ equity 2. Possibility to access academic laboratories and equipments 3. Possibility to be hosted in a university incubator 4. Synergies between public research institutions and private firms Notes: a These items were reverse coded; b r=.21 (p<.05) with received amount of public funds; c r=.37 (p<.001) with participation to regional entrepreneurial support programs; d r=.51 (p<.001) with received incubation support; Government support and Context support (r=.57; p<.001); Context support has a composite reliability =.85 Government support and University support (r=.58; p<.001); University support has a composite reliability =.84