careoregon - redesigning a care model
TRANSCRIPT
CareOregon
Opportunities and Challenges
Redesigning a Care Model
Patrick CurranPresident and CEO
®
®

Agenda
Demographic and clinical profile
Program examples
• Health Resilience program
• MEDS (My Easy Drug System)
Moving upstream
Challenges with current system
Discussion
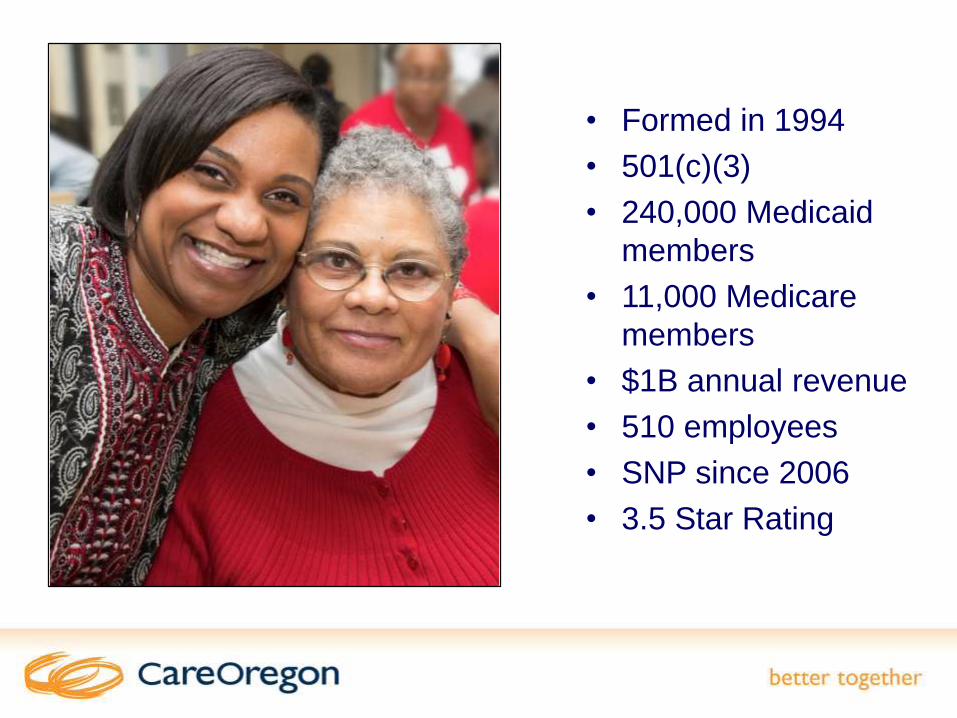
• Formed in 1994
• 501(c)(3)
• 240,000 Medicaid
members
• 11,000 Medicare
members
• $1B annual revenue
• 510 employees
• SNP since 2006
• 3.5 Star Rating
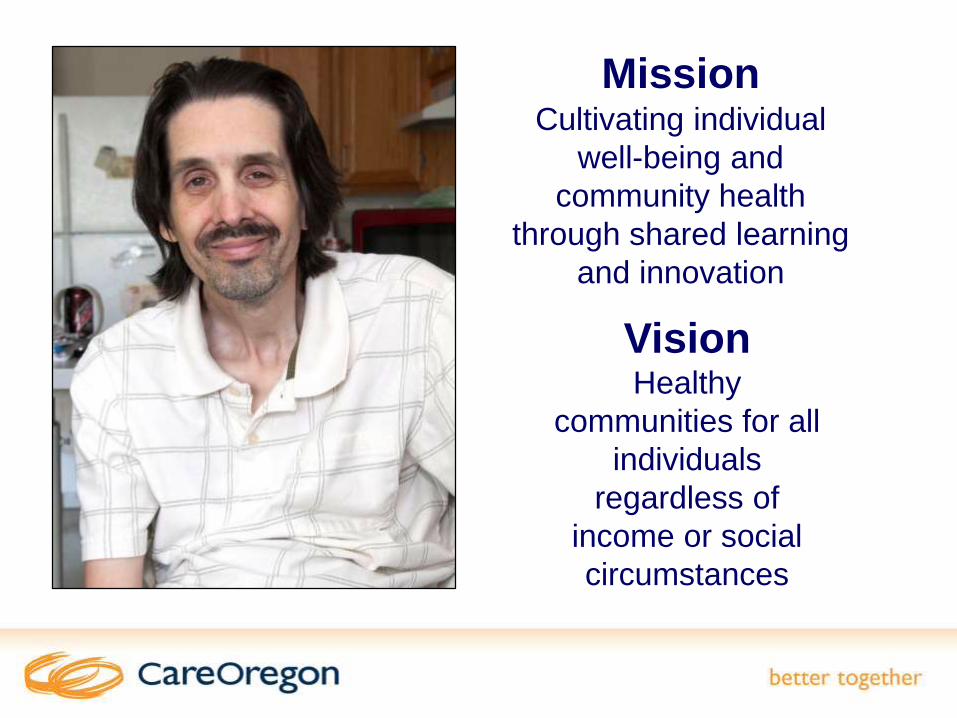
MissionCultivating individual
well-being and
community health
through shared learning
and innovation
VisionHealthy
communities for all
individuals
regardless of
income or social
circumstances
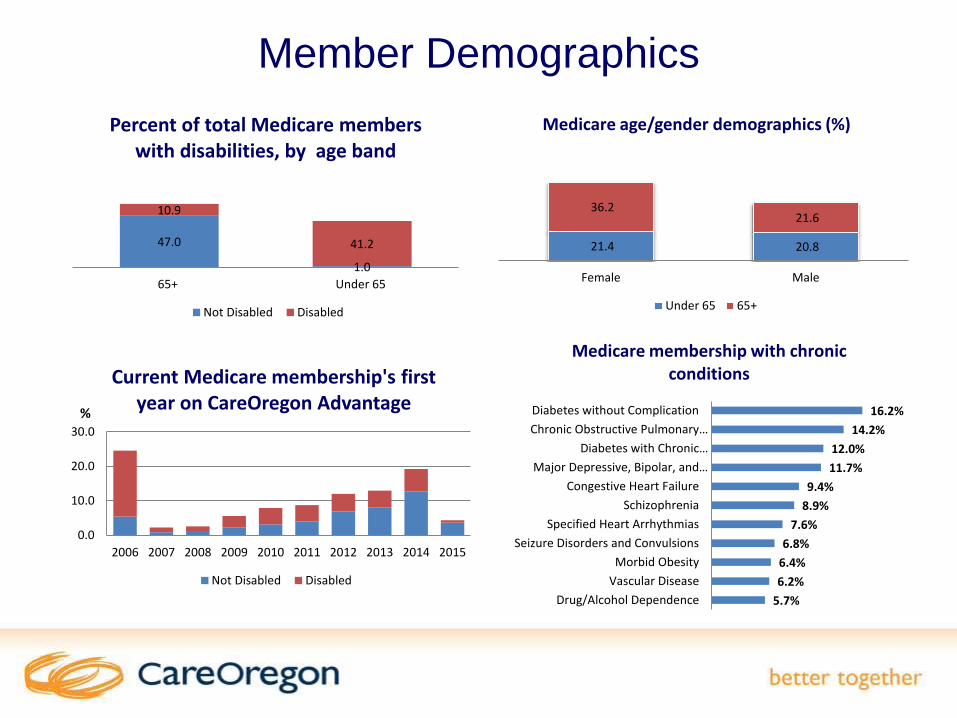
Member Demographics
47.0
1.0
10.9
41.2
65+ Under 65
Percent of total Medicare members with disabilities, by age band
Not Disabled Disabled
0.0
10.0
20.0
30.0
2006 2007 2008 2009 2010 2011 2012 2013 2014 2015
Current Medicare membership's first year on CareOregon Advantage
Not Disabled Disabled
%
21.4 20.8
36.2 21.6
Female Male
Medicare age/gender demographics (%)
Under 65 65+
5.7%
6.2%
6.4%
6.8%
7.6%
8.9%
9.4%
11.7%
12.0%
14.2%
16.2%
Drug/Alcohol Dependence
Vascular Disease
Morbid Obesity
Seizure Disorders and Convulsions
Specified Heart Arrhythmias
Schizophrenia
Congestive Heart Failure
Major Depressive, Bipolar, and…
Diabetes with Chronic…
Chronic Obstructive Pulmonary…
Diabetes without Complication
Medicare membership with chronic conditions

41%
28%
26%
13%12%
11% 11%
8%
6%
0%
5%
10%
15%
20%
25%
30%
35%
40%
45%
Depression Diabetes Asthma COPD CHF Heart Schizophrenia Chronic RenalFailure
Bipolar
Percentage of CareOregon Advantage D-SNP members with various chronic conditions
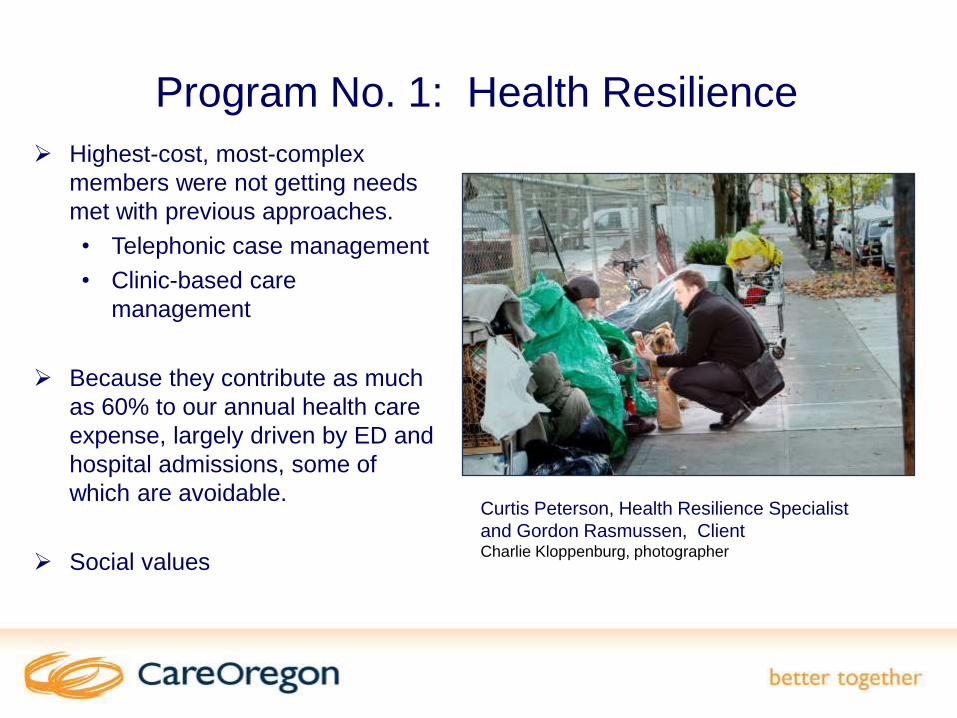
Program No. 1: Health Resilience
Highest-cost, most-complex
members were not getting needs
met with previous approaches.
• Telephonic case management
• Clinic-based care
management
Because they contribute as much
as 60% to our annual health care
expense, largely driven by ED and
hospital admissions, some of
which are avoidable.
Social values
Curtis Peterson, Health Resilience Specialist
and Gordon Rasmussen, ClientCharlie Kloppenburg, photographer
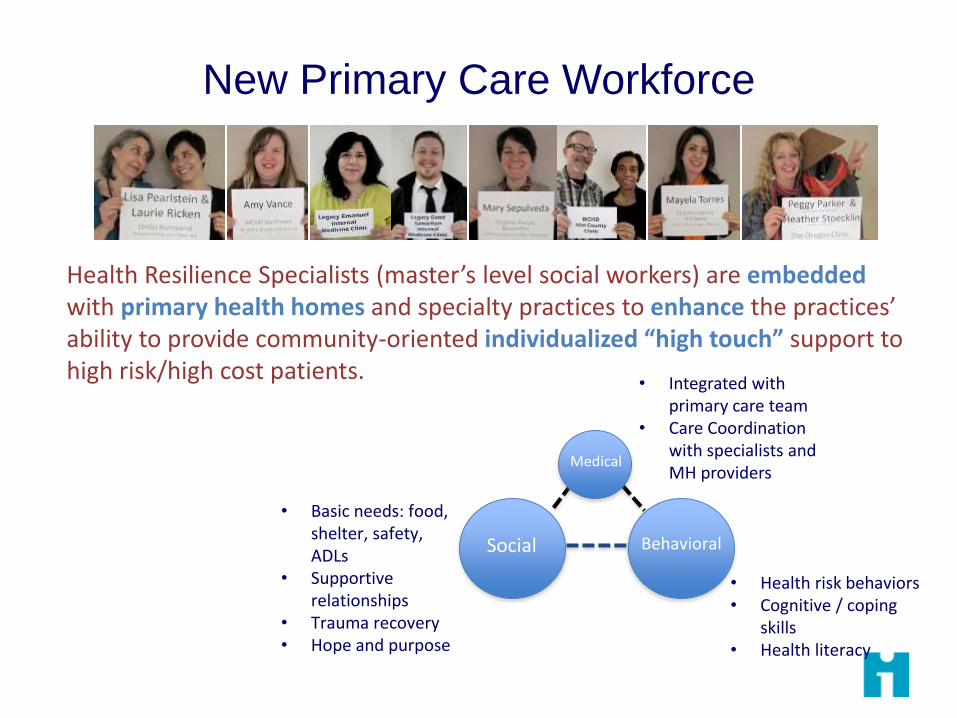
New Primary Care Workforce
Health Resilience Specialists (master’s level social workers) are embedded with primary health homes and specialty practices to enhance the practices’ ability to provide community-oriented individualized “high touch” support to high risk/high cost patients.
Social Behavioral
Medical
• Health risk behaviors• Cognitive / coping
skills• Health literacy
• Basic needs: food, shelter, safety, ADLs
• Supportive relationships
• Trauma recovery• Hope and purpose
• Integrated with primary care team
• Care Coordination with specialists and MH providers

Clinical Assessment Data:
Health Resilience Clients N= 275
No36%
Yes64%
Active behavioral health challenge
75%
51%
31%
Depression
Anxiety
PTSD
Yes55%No
3%
Hx of traumatic experiences
Unknown42%
Yes54%
No30%
Active traumaUnknown
16%
Yes42%
No58%
Chronic pain
Current living situation
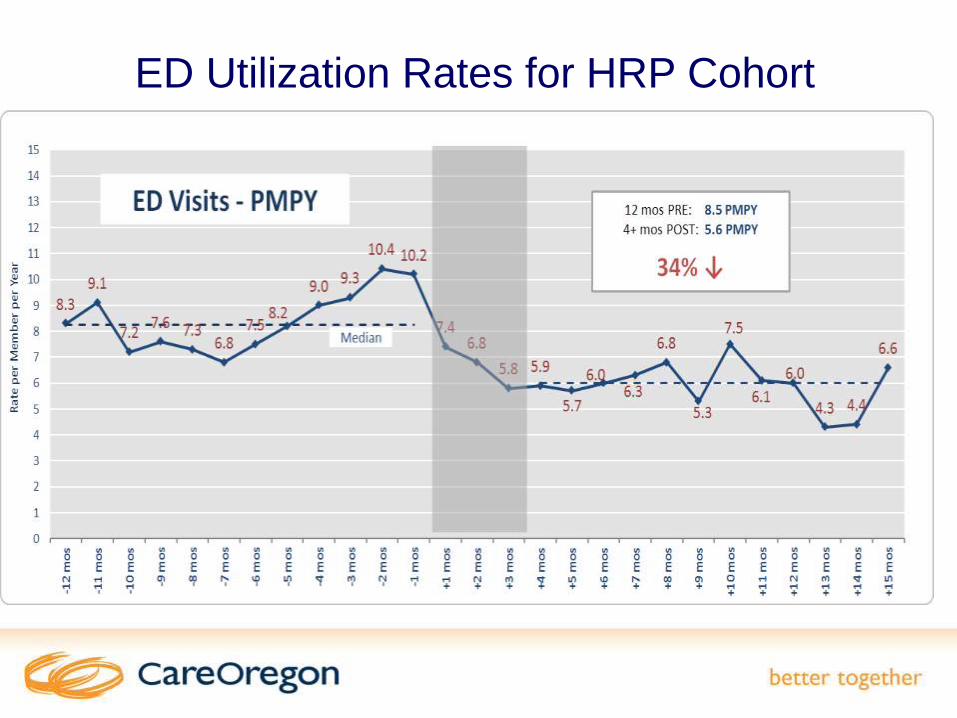
ED Utilization Rates for HRP Cohort

Hospital Utilization Rates for HRP cohort
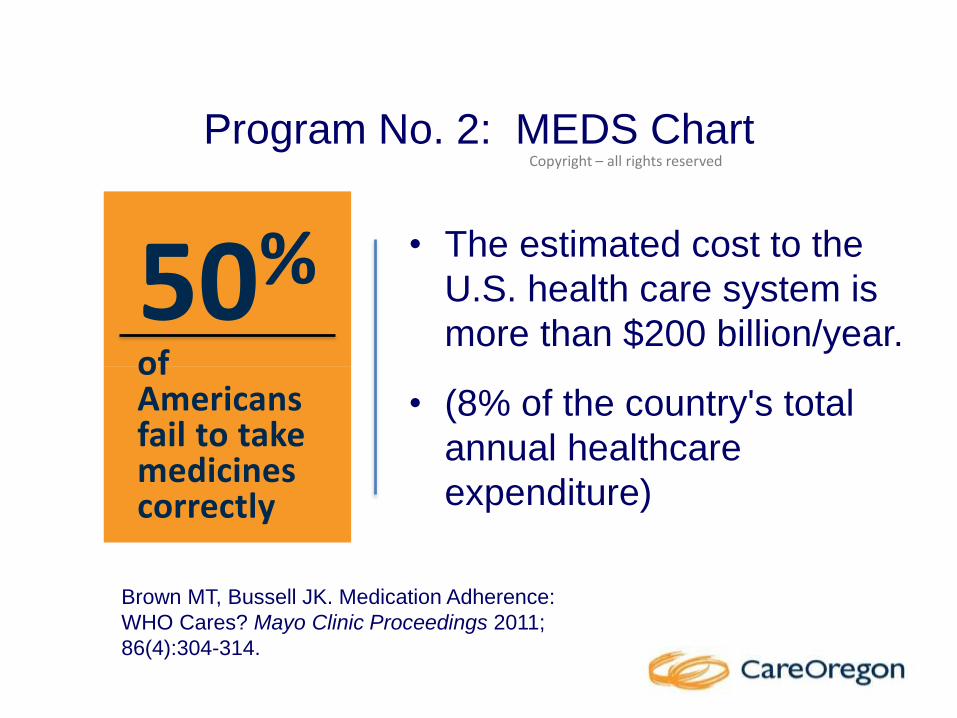
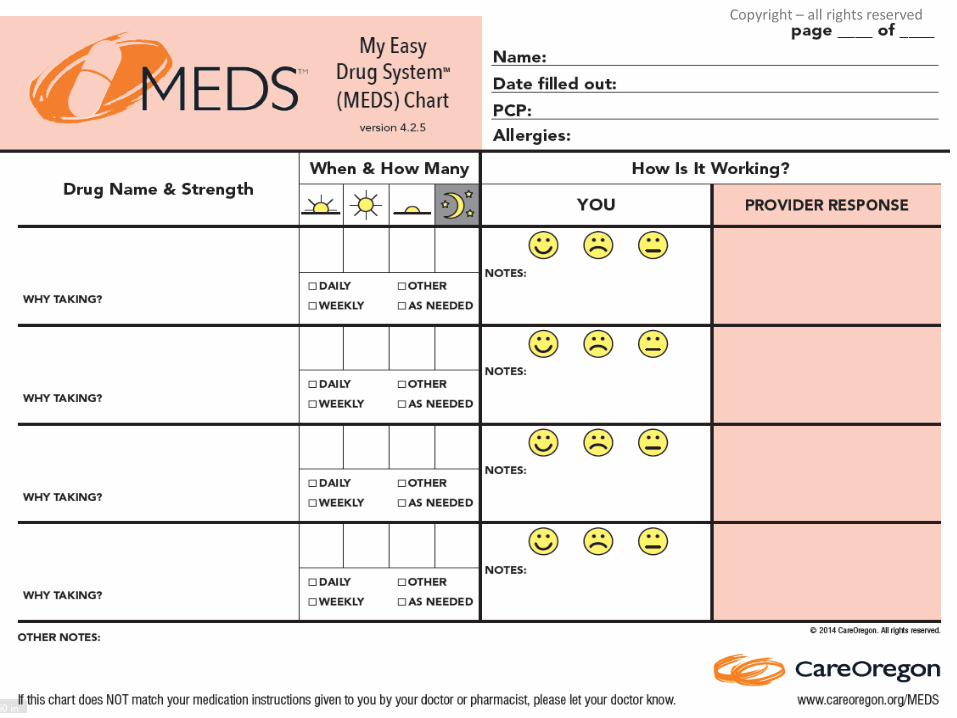
Program No. 2: MEDS Chart
• The estimated cost to the
U.S. health care system is
more than $200 billion/year.
• (8% of the country's total
annual healthcare
expenditure)
12
50%of Americans fail to take medicines correctly
Brown MT, Bussell JK. Medication Adherence:
WHO Cares? Mayo Clinic Proceedings 2011;
86(4):304-314.
Copyright – all rights reserved
V
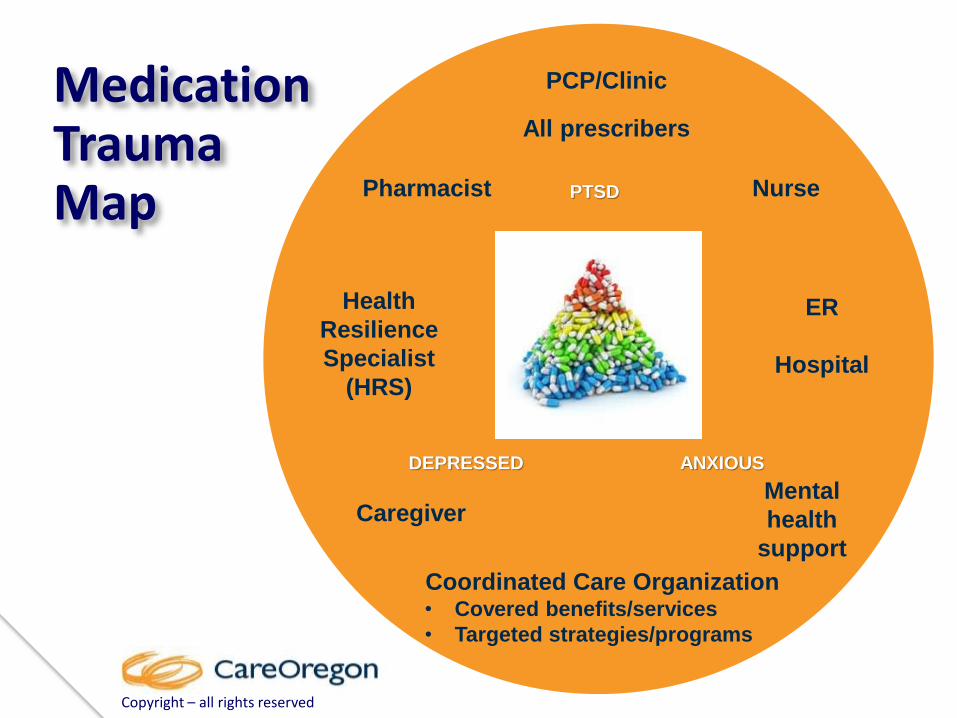
All prescribers
Pharmacist
PCP/Clinic
Health
Resilience
Specialist
(HRS)
ER
Hospital
Coordinated Care Organization• Covered benefits/services
• Targeted strategies/programs
Caregiver
Patient
+/-
Caregiver
PTSD
DEPRESSED ANXIOUS
Medication TraumaMap
Copyright – all rights reserved
Nurse
Mental
health
support
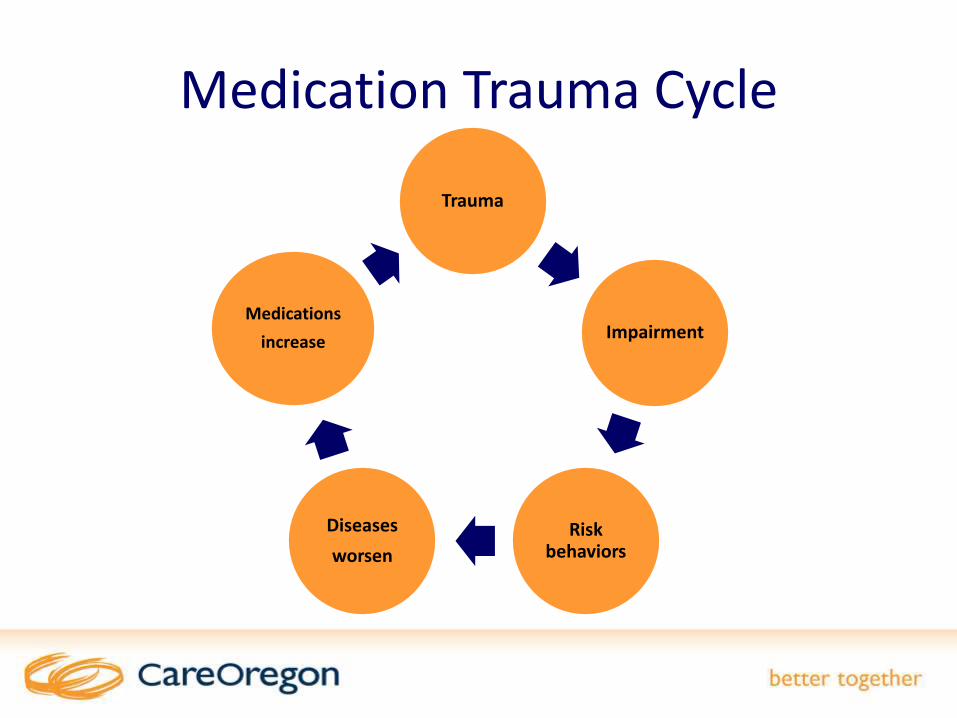
Medication Trauma Cycle
Trauma
Impairment
Risk behaviors
Diseases
worsen
Medications
increase
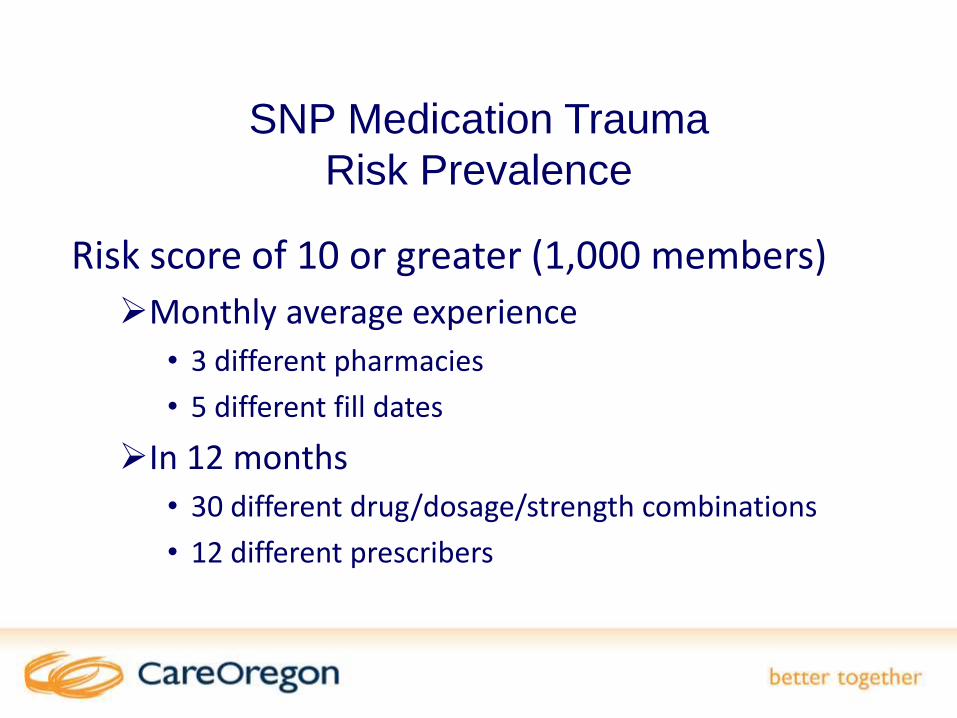
SNP Medication Trauma
Risk Prevalence
Risk score of 10 or greater (1,000 members)
Monthly average experience
• 3 different pharmacies
• 5 different fill dates
In 12 months
• 30 different drug/dosage/strength combinations
• 12 different prescribers

Medication Trauma Treatment
“Fewer medications taken the right way for the right length of time is better than lots of medications taken the wrong way and stopped due to side effects, drug interactions, confusion and fear.”
MEDS Chart helps the care team
take the next step in educating
patients about how they
can simplify, change or reduce
medications.
Copyright – all rights reserved
Copyright – all rights reserved
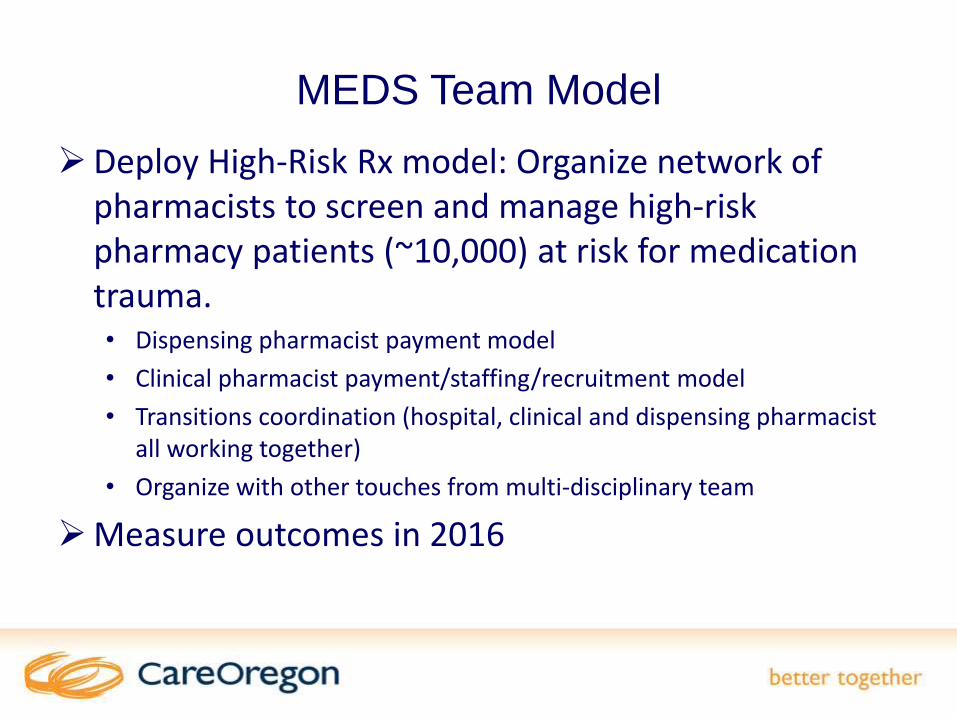
MEDS Team Model
Deploy High-Risk Rx model: Organize network of pharmacists to screen and manage high-risk pharmacy patients (~10,000) at risk for medication trauma. • Dispensing pharmacist payment model
• Clinical pharmacist payment/staffing/recruitment model
• Transitions coordination (hospital, clinical and dispensing pharmacist all working together)
• Organize with other touches from multi-disciplinary team
Measure outcomes in 2016

SNP Conservative Cost Savings
6.7:1 ROI with pharmacist time
• If every actively managed empaneled patient achieves one point better in risk score.
If 1 in 6.7 patients succeeds, then it breaks even.
Somewhere between 1:1 and 7:1 is likely reality.
• Other MTM programs show 3 to 10:1 ROI but have not focused on high-risk trauma Medicaid and SNP populations through trauma-informed care principles.

Overall Utilization Strategy
Old Model of Care
• Entire population
• Telephonic
• Regulatory focus
• Health-plan based
New Model of Care
• High-risk population
• Face-to-face
• Clinical focus
• Partnering with delivery
system
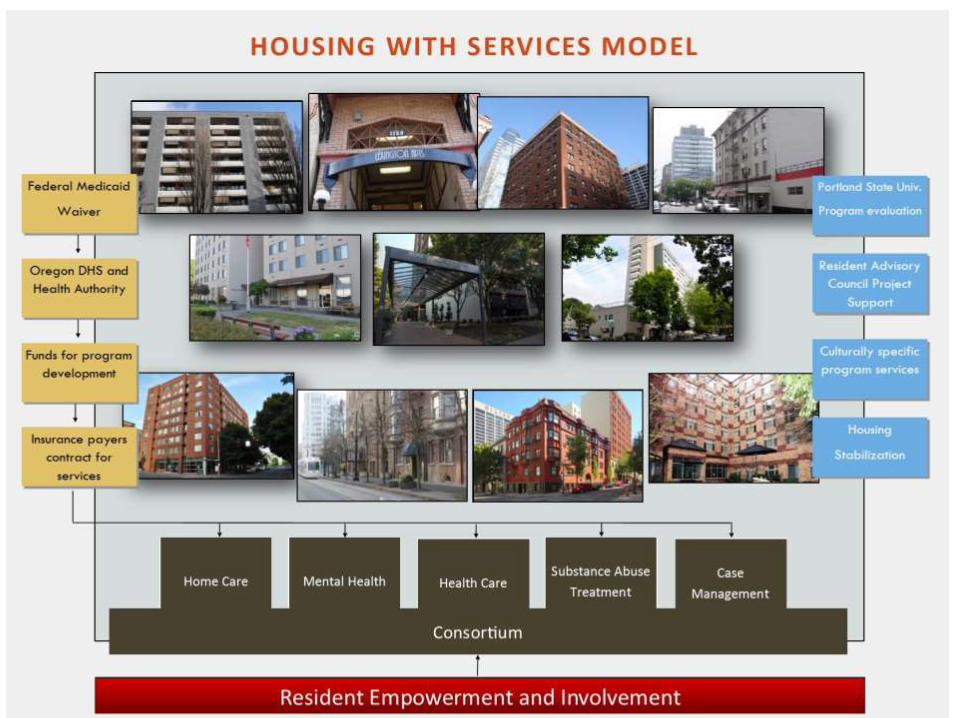
Housing with Services Model
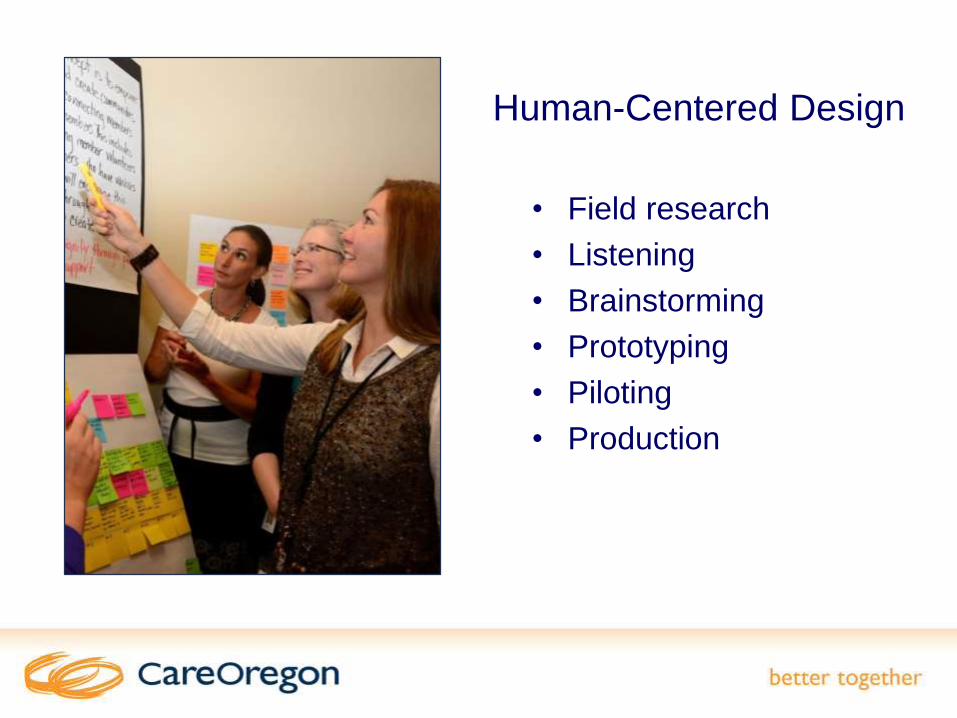
Human-Centered Design
• Field research
• Listening
• Brainstorming
• Prototyping
• Piloting
• Production

SNP Model of Care Elements
1. Description of the SNP-specific target population
2. Measurable goals
3. Staff structure and care management goals
4. Interdisciplinary care team
5. Provider network having specialized expertise and use of clinical
practice guidelines and protocols
6. Model of Care training for personnel and provider network
7. Health risk assessment
8. Individualized care plan
9. Communication network
10. Care management for the most-vulnerable subpopulations
11. Performance and health outcome measurement
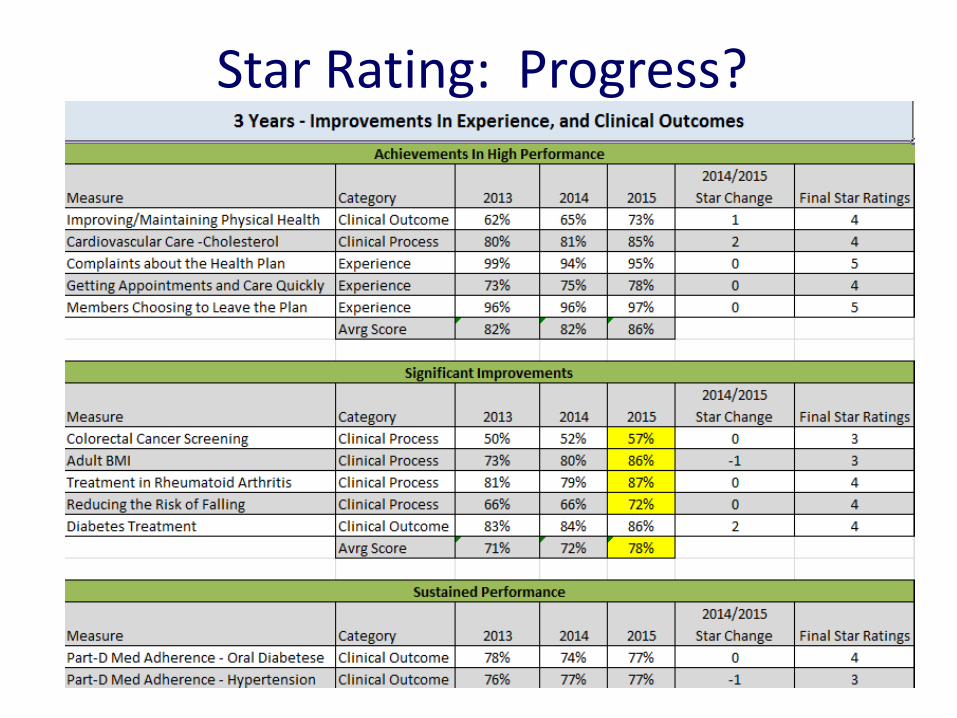
Star Rating: Progress?