carey mini mart
TRANSCRIPT
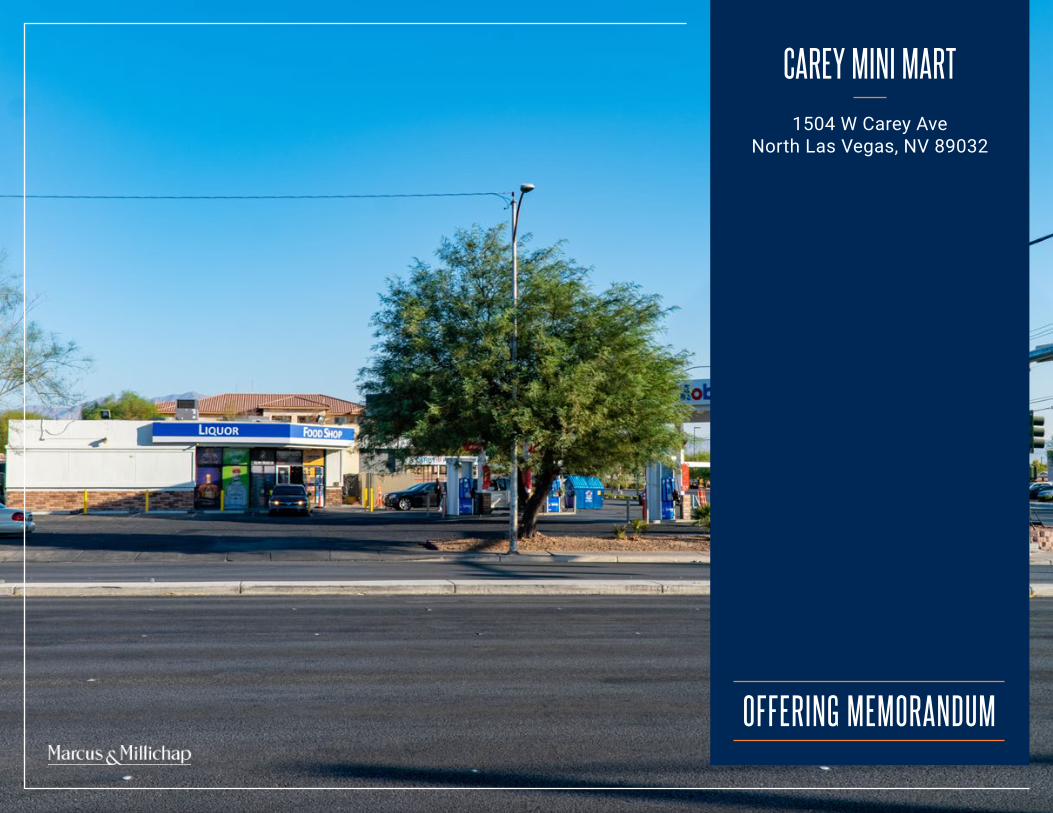
CAREY MINI MART
OFFERING MEMORANDUM
1504 W Carey AveNorth Las Vegas, NV 89032

MARCUS & MILLICHAPTEAM IN NEVADA
NET LEASED TEAM IN NEVADA
RETAIL TEAM IN NEVADA
Enterprise Rent-A-Car
Wendy’s Portfolio
Holiday Motel Portfolio
Big O’ Tires
Shops at Village Square
Starbucks
UCLA Student Housing
Durango-Teton Center
DaVita Dialysis
Sherwin Williams
Dollar General
AutoZone
Arby’s Portfolio
Jack in the Box
Meineke
Smith’s Food & Drug
Fatburger
Cummin’s Inc.
Family Dollar Portfolio
Masco II Industrial Park
Las Vegas Blvd Land
Plaza Storage
O’Reilly Auto Parts
Jack in the Box
7-Eleven
Jiffy Lube
24 Hour Fitness
Chase Bank
Taco Bell Portfolio
Service King
La Bonita Markets
W Flamingo Shopping Strip
Dunkin’ Donuts
Chipotle
Advance Auto Parts
Dairy Queen
NOTABLE NATIONWIDE TRANSACTIONSTHE ALVINO TEAM OF MARCUS & MILLICHAP
DUSTIN R. ALVINOFIRST VICE PRESIDENT OF INVESTMENTS
MADELYN RUPPRECHTAGENT ASSISTANT
JAKE WASSERKRUGASSOCIATE
TAMIR ISRAELIMARKETING COORDINATOR
NICK GRAYDIRECTOR, MMCC
(702) [email protected]: NV BS.0143692
(702) [email protected]: NV S.0185362
(702) [email protected]
(702) [email protected]
(702) [email protected]: 1152363 | NV: 4096
LEAD AGENTS
ANDY PASBAKHSH ASSOCIATE
JOE KASZUPSKIASSOCIATE
(702) [email protected]: NV S.0189780
(702) [email protected]: NV S.0190554
HAMILTON WHYTEASSOCIATE
(702) [email protected]: NV S.0190848
TABLE OF CONTENTS
06
07
08
19
09
24
30
22
INVESTMENTOVERVIEW
FINANCIAL ANALYSIS
PROPERTYFACTS
SURROUNDINGRETAIL
PROPERTYPHOTOS
MARKETOVERVIEW
DEMOGRAPHICS
LAS VEGASDEVELOPMENT PROJECTS
Investment Overview
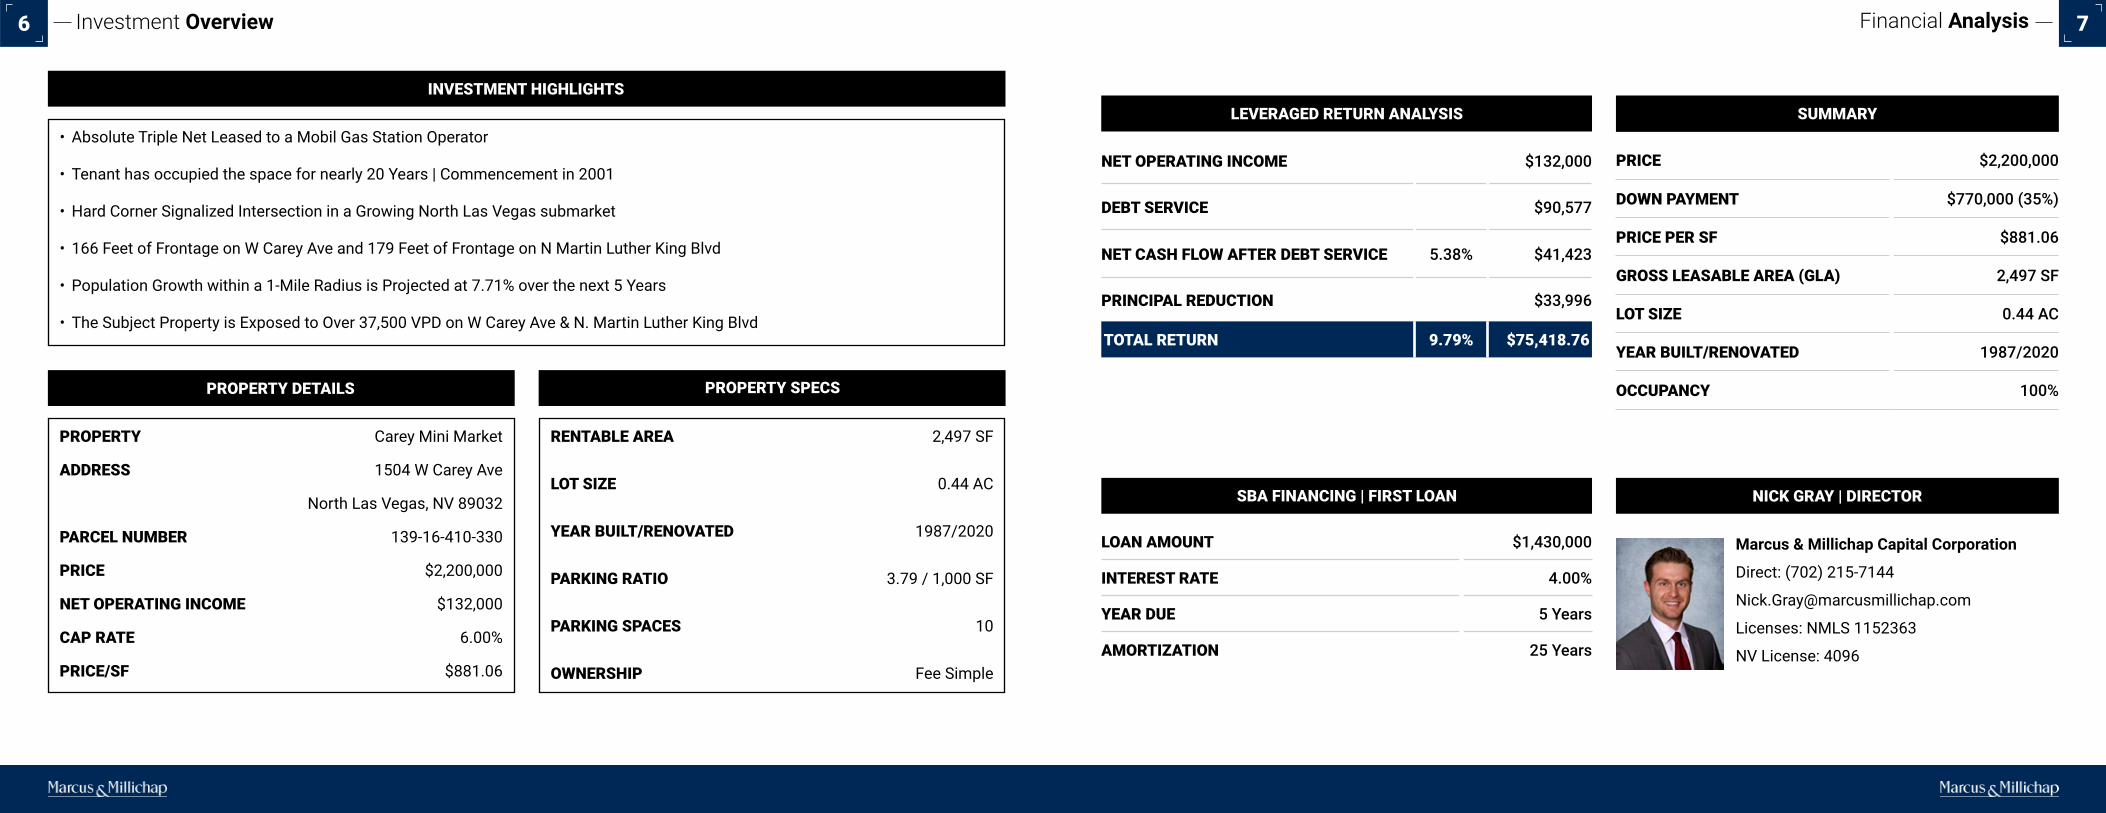
RENTABLE AREA 2,497 SF
LOT SIZE 0.44 AC
YEAR BUILT/RENOVATED 1987/2020
PARKING RATIO 3.79 / 1,000 SF
PARKING SPACES 10
OWNERSHIP Fee Simple
PROPERTY Carey Mini Market
ADDRESS 1504 W Carey Ave
North Las Vegas, NV 89032
PARCEL NUMBER 139-16-410-330
PRICE $2,200,000
NET OPERATING INCOME $132,000
CAP RATE 6.00%
PRICE/SF $881.06
INVESTMENT HIGHLIGHTS
PROPERTY DETAILS PROPERTY SPECS
• Absolute Triple Net Leased to a Mobil Gas Station Operator
• Tenant has occupied the space for nearly 20 Years | Commencement in 2001
• Hard Corner Signalized Intersection in a Growing North Las Vegas submarket
• 166 Feet of Frontage on W Carey Ave and 179 Feet of Frontage on N Martin Luther King Blvd
• Population Growth within a 1-Mile Radius is Projected at 7.71% over the next 5 Years
• The Subject Property is Exposed to Over 37,500 VPD on W Carey Ave & N. Martin Luther King Blvd
Financial Analysis
NET OPERATING INCOME $132,000
DEBT SERVICE $90,577
NET CASH FLOW AFTER DEBT SERVICE 5.38% $41,423
PRINCIPAL REDUCTION $33,996
TOTAL RETURN 9.79% $75,418.76
LOAN AMOUNT $1,430,000
INTEREST RATE 4.00%
YEAR DUE 5 Years
AMORTIZATION 25 Years
PRICE $2,200,000
DOWN PAYMENT $770,000 (35%)
PRICE PER SF $881.06
GROSS LEASABLE AREA (GLA) 2,497 SF
LOT SIZE 0.44 AC
YEAR BUILT/RENOVATED 1987/2020
OCCUPANCY 100%
LEVERAGED RETURN ANALYSIS SUMMARY
SBA FINANCING | FIRST LOAN NICK GRAY | DIRECTOR
Marcus & Millichap Capital Corporation
Direct: (702) 215-7144
Licenses: NMLS 1152363
NV License: 4096
6 7

TRAFFIC COUNTS
ACCESS
IMPROVEMENTS
PARKING
PARCEL NUMBER
YEAR BUILT/RENOVATED
ZONING
Ingress/Egress on W Carey Ave and N Martin Luther King Blvd
W Carey Ave & N Martin Luther King Blvd: +/- 37,500 VPD
1987/2020
2,497 SF Builidng
Ratio: 3.79 /1,000 SF
Parcel: 139-16-410-330Acres: 0.44 AC
Commercial; C-1
Property Facts Property Photos8 9

Property PhotosProperty Photos10 11

Property Photos Property Photos12 13

Property Photos Property Photos14 15

Property Photos Property Photos16 17

Property Photos Surrounding Retail
MARTIN
LUTHER
KIN
G BLV
D: 37,500 V
PD
18 19
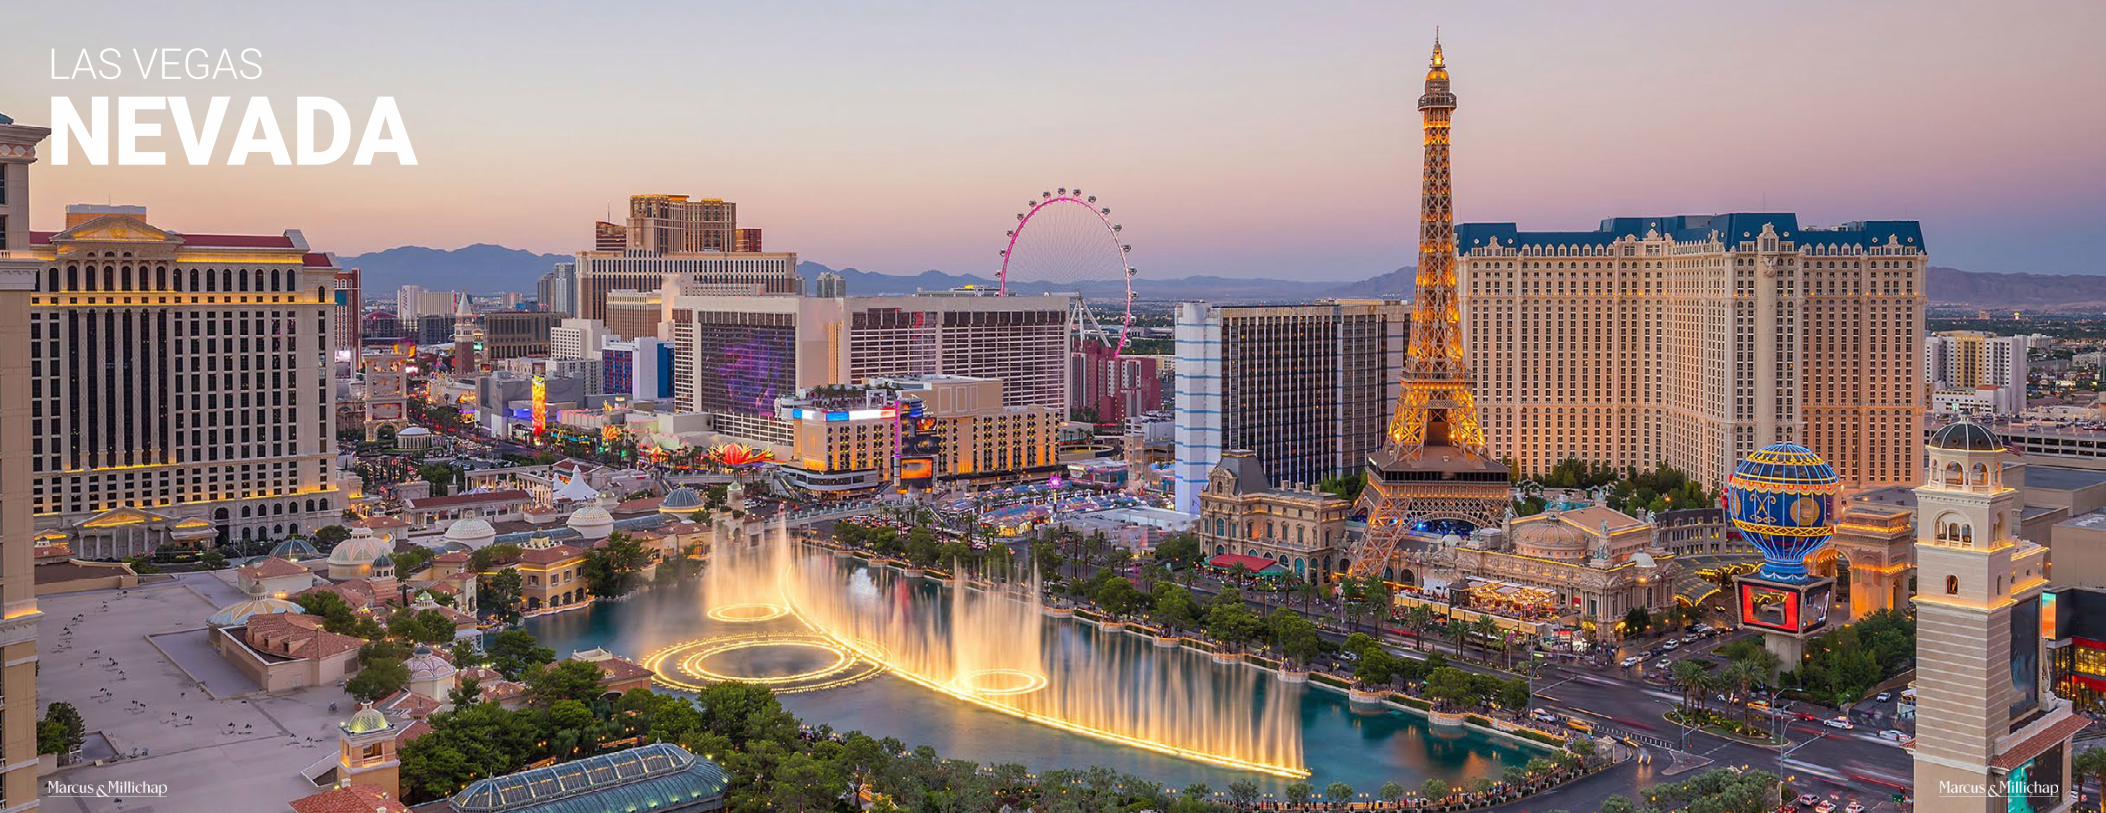
LAS VEGAS
NEVADA

Las Vegas Development Projects
Raiders Headquarters Circa Hotel & Casino
Las Vegas BallparkUNLV School of Medicine
Las Vegas Development Projects
MSG Sphere Las Vegas
The Drew (Previously Fontainbleu) Resorts World
Las Vegas Convention Center Expansion
22 23

Market Overview
The stadium project is estimated to come at a cost of around $1.9 billion.
It’s a state-of- the-art facility that neighbors the Las Vegas Strip and is being designed by Kansas City-based MANIAC Architecture. The site it’d be located on is a 63-acre piece of land on Russell Road, on the west side of Interstate 15.
The plan is for it to be a domed, air-conditioned stadium with a capacity of 65,000 spectators. If a Super Bowl were to come to Las Vegas — which seems highly likely — the stadium can increase its capacity to 72,000 seats.
The design of the stadium currently includes a retractable, natural turf field and giant glass walls that open for a better view of the strip.
LAS VEGAS
24

Our story began with a goal … to bring NHL hockey to Las Vegas. Our goal has been realized and Las Vegas has shown that we are ready - ready for the energy, excitement and thrill that only NHL hockey can deliver. We’ve done the research, polled the community and rallied our local businesses. ALL are eager to support an NHL team. Las Vegas is proud to have joined the elite list of NHL cities.
FOR OUR COMMUNITY
We want friends and families to attend games together — and look forward to those outings, where memories will be created. We want coworkers to gather around the water cooler the day after an exciting hockey game to talk about the plays, the hat tricks and who got iced. And, we want to add to the quality of life in Las Vegas. We believe an NHL® team in Las Vegas will make all of this a reality.
FOR OUR YOUTH
Hockey is an excellent motivator for our youth, teaching the value of team skills, hard work and determination. If we are able to secure a team in Las Vegas, we are committed to supporting youth hockey in Las Vegas through the development of youth hockey rinks, programs and other activities.
NHL HOCKEY HAS ARRIVED IN LAS VEGAS
Market Overview 27

ROBUST EMPLOYMENT GROWTHA diversifying employment base will support job growth, which is expected to outpace the U.S. growth rate over the next five years.
STRONG POPULATION GAINSThe metro’s population is forecast to increase dramatically in the coming years, exceeding national gains.
VAST TOURISM INDUSTRYVisitor volume reached 42 million in 2018, ranking Las Vegas among the top tourist destinations in the country.
LAS VEGAS OVERVIEW
Las Vegas is considered one of the premier entertainment cities of the world, with more than 42.1 million visitors recorded in 2018. It has evolved into a world-class destination for resorts, restaurants, shopping and diversified entertainment options.
The Las Vegas-Henderson-Paradise MSA is also one of the fastest-growing metros in the nation. The population of nearly 2.2 million people ranks it among the top 50 most populous metros in the U.S. In conjunction with rising wages, the metro’s median household income recently surpassed the national average by 1.4 percent as it climbed 5.1 percent. This increase allows residents to make more discretionary spending.
METRO HIGHLIGHTS
Market Overview
ECONOMY
SHARE OF 2019 EMPLOYMENT
• With all 10 of the nation’s largest hotels located in Las Vegas, tourism and entertainment are the most significant drivers of the Las Vegas economy; however, the economy is diversifying into distribution, back-office operations and manufacturing.
• The metro’s business-friendly environment, access to Western markets, large labor force, and availability of high-speed data attract companies such as Switch, Amazon, K2 Energy, Scientific Games, Sunpreme, Tectonics, Virtual Guard, VadaTech and Zappos.
• The 2.3 million-square-foot Las Vegas Convention Center is one of the largest in the world and draws more than 6 million attendees annually.
MAJOR AREA EMPLOYERS
Wynn Resorts Boyd Gaming
Station Casinos Valley Heath System
MGM Resorts Cosmopolitan of Las Vegas
Las Vegas Sands Dignity Health - St. Rose Dominican
Caesars Entertainment United Healthcare of Nevada
3%MANUFACTURING
14%PROFESSIONAL
10%GOVERNMENT
29%HOSPITALITY & LEISURE
6%FINANCIAL SERVICES
17%TRADE, TRANSPORTATION &
UTILITIES
7%CONSTRUCTION
10%EDUCATION & HEALTHCARE
1%INFORMATION TECHNOLOGY
3%OTHER SERVICES
Market Overview28 29
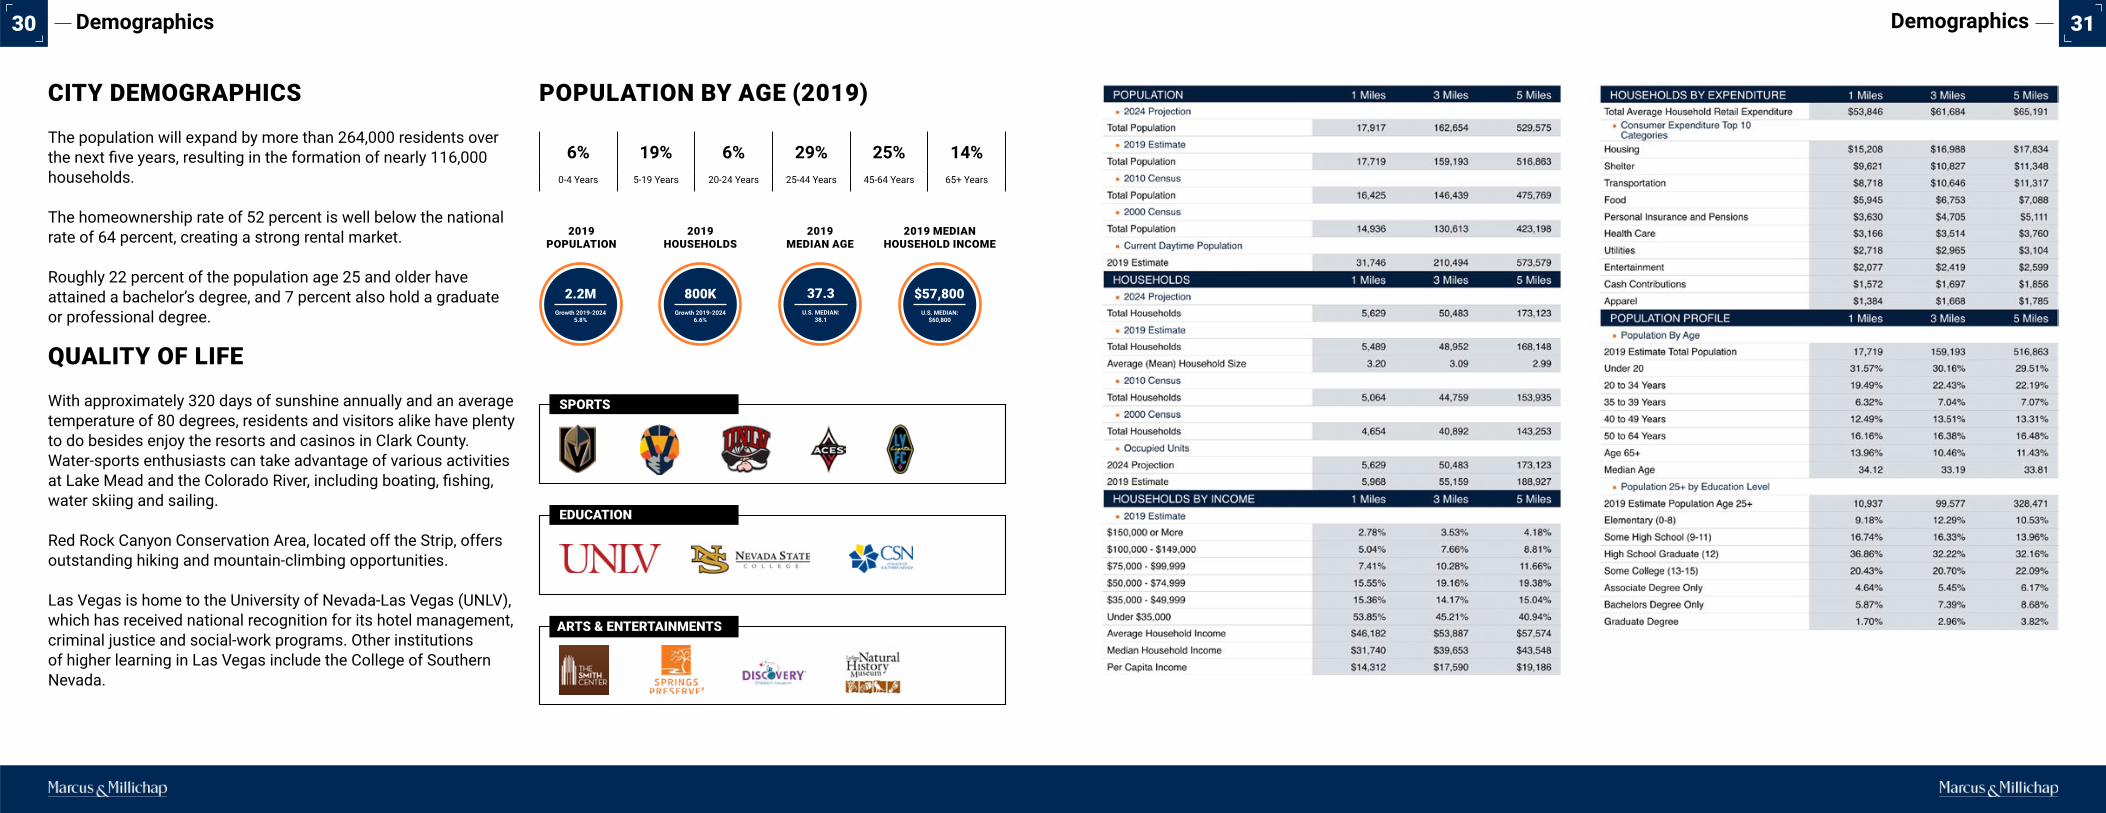
CITY DEMOGRAPHICS
QUALITY OF LIFE
The population will expand by more than 264,000 residents over the next five years, resulting in the formation of nearly 116,000 households.
The homeownership rate of 52 percent is well below the national rate of 64 percent, creating a strong rental market.
Roughly 22 percent of the population age 25 and older have attained a bachelor’s degree, and 7 percent also hold a graduate or professional degree.
6% 19% 6% 29% 25% 14%0-4 Years 5-19 Years 20-24 Years 25-44 Years 45-64 Years 65+ Years
POPULATION BY AGE (2019)
With approximately 320 days of sunshine annually and an average temperature of 80 degrees, residents and visitors alike have plenty to do besides enjoy the resorts and casinos in Clark County. Water-sports enthusiasts can take advantage of various activities at Lake Mead and the Colorado River, including boating, fishing, water skiing and sailing. Red Rock Canyon Conservation Area, located off the Strip, offers outstanding hiking and mountain-climbing opportunities.
Las Vegas is home to the University of Nevada-Las Vegas (UNLV), which has received national recognition for its hotel management, criminal justice and social-work programs. Other institutions of higher learning in Las Vegas include the College of Southern Nevada.
2019 POPULATION
2019 HOUSEHOLDS
2019 MEDIAN AGE
2019 MEDIAN HOUSEHOLD INCOME
2.2M Growth 2019-2024
5.8%
800KGrowth 2019-2024
6.6%
37.3U.S. MEDIAN:
38.1
$57,800U.S. MEDIAN:
$60,800
SPORTS
EDUCATION
ARTS & ENTERTAINMENTS
Demographics Demographics30 31

NON-ENDORSEMENT NOTICE
Marcus & Millichap is not affiliated with, sponsored by, or endorsed by any commercial tenant or lessee identified in this marketing package. The presence of any corporation’s logo or name is not intended to indicate or imply affiliation with, or sponsorship or endorsement by, said corporation of Marcus & Millichap, its affiliates or subsidiaries, or any agent, product, service, or commercial listing of Marcus & Millichap, and is solely included for the purpose of providing tenant lessee information about this listing to prospective customers.
CONFIDENTIALITY AND DISCLAIMER
The information contained in the following Marketing Brochure is proprietary and strictly confidential. It is intended to be reviewed only by the party receiving it from Marcus & Millichap and should not be made available to any other person or entity without the written consent of Marcus & Millichap. This Marketing Brochure has been prepared to provide summary, unverified information to prospective purchasers, and to establish only a preliminary level of interest in the subject property. The information contained herein is not a substitute for a thorough due diligence investigation. Marcus & Millichap has not made any investigation, and makes no warranty or representation, with respect to the income or expenses for the subject property, the future projected financial performance of the property, the size and square footage of the property and improvements, the presence or absence of contaminating substances, PCB’s or asbestos, the compliance with State and Federal regulations, the physical condition of the improvements thereon, or the financial condition or business prospects of any tenant, or any tenant’s plans or intentions to continue its occupancy of the subject property. The information contained in this Marketing Brochure has been obtained from sources we believe to be reliable; however, Marcus & Millichap has not verified, and will not verify, any of the information contained herein, nor has Marcus & Millichap conducted any investigation regarding these matters and makes no warranty or representation whatsoever regarding the accuracy or completeness of the information provided. All potential buyers must take appropriate measures to verify all of the information set forth herein, providing tenant lessee information about this listing to prospective customers.
ALL PROPERTY SHOWINGS ARE BY APPOINTMENT ONLY. PLEASE CONSULT YOUR MARCUS & MILLICHAP AGENT FOR MORE DETAILS.
SINGLE TENANT NET LEASE DISCLAIMER
Marcus & Millichap hereby advises all prospective purchasers of Net Leased property as follows:
The information contained in this Marketing Brochure has been obtained from sources we believe to be reliable. However, Marcus & Millichap has not and will not verify any of this information, nor has Marcus & Millichap conducted any investigation regarding these matters. Marcus & Millichap makes no guarantee, warranty or representation whatsoever about the accuracy or completeness of any information provided.
As the Buyer of a net leased property, it is the Buyer’s responsibility to independently confirm the accuracy and completeness of all material information before completing any purchase. This Marketing Brochure is not a substitute for your thorough due diligence investigation of this investment opportunity. Marcus & Millichap expressly denies any obligation to conduct a due diligence examination of this Property for Buyer.Any projections, opinions, assumptions or estimates used in this Marketing Brochure are for example only and do not represent the current or future performance of this property. The value of a net leased property to you depends on factors that should be evaluated by you and your tax, financial and legal advisors.
Buyer and Buyer’s tax, financial, legal, and construction advisors should conduct a careful, independent investigation of any net leased property to determine to your satisfaction with the suitability of the property for your needs.
Like all real estate investments, this investment carries significant risks. Buyer and Buyer’s legal and financial advisors must request and carefully review all legal and financial documents related to the property and tenant. While the tenant’s past performance at this or other locations is an important consideration, it is not a guarantee of future success. Similarly, the lease rate for some properties, including newly-constructed facilities or newly-acquired locations, may be set based on a tenant’s projected sales with little or no record of actual performance, or comparable rents for the area. Returns are not guaranteed; the tenant and any guarantors may fail to pay the lease rent or property taxes, or may fail to comply with other material terms of the lease; cash flow may be interrupted in part or in whole due to market, economic, environmental or other conditions. Regardless of tenant history and lease guarantees, Buyer is responsible for conducting his/her own investigation of all matters affecting the intrinsic value of the property and the value of any long-term lease, including the likelihood of locating a replacement tenant if the current tenant should default or abandon the property, and the lease terms that Buyer may be able to negotiate with a potential replacement tenant considering the location of the property, and Buyer’s legal ability to make alternate use of the property.
By accepting this Marketing Brochure you agree to release Marcus & Millichap Real Estate Investment Services and hold it harmless from any kind of claim, cost, expense, or liability arising out of your investigation and/or purchase of this net leased property.
SPECIAL COVID-19 NOTICE
All potential buyers are strongly advised to take advantage of their opportunities and obligations to conduct thorough due diligence and seek expert opinions as they may deem necessary, especially given the unpredictable changes resulting from the continuing COVID-19 pandemic. Marcus & Millichap has not been retained to perform, and cannot conduct, due diligence on behalf of any prospective purchaser. Marcus & Millichap’s principal expertise is in marketing investment properties and acting as intermediaries between buyers and sellers. Marcus & Millichap and its investment professionals cannot and will not act as lawyers, accountants, contractors, or engineers. All potential buyers are admonished and advised to engage other professionals on legal issues, tax, regulatory, financial, and accounting matters, and for questions involving the property’s physical condition or financial outlook. Projections and pro forma financial statements are not guarantees and, given the potential volatility created by COVID-19, all potential buyers should be comfortable with and rely solely on their own projections, analyses, and decision-making.)
Demographics
POPULATION RACE & ETHNICITY
HOUSEHOLDS
HOUSING
INCOME EMPLOYMENT
In 2019, the population in your selected geography is 17,719. The population has changed by 18.63% since 2000. It is estimated that the population in your area will be 17,917.00 five years from now, which represents a change of 1.12% from the current year. The current population is 46.95% male and 53.05% female. The median age of the population in your area is 34.12, compare this to the US average which is 38.08. The population density in your area is 5,636.52 people per square mile.
The current year racial makeup of your selected area is as follows: 19.00% White, 52.47% Black, 0.49% Native American and 3.71% Asian/Pacific Islander. Compare these to US averages which are: 70.07% White, 12.87% Black, 0.19% Native American and 5.66% Asian/Pacific Islander. People of Hispanic origin are counted independently of race. People of Hispanic origin make up 36.24% of the current year population in your selected area. Compare this to the US average of 18.17%.
There are currently 5,489 households in your selected geography. The number of households has changed by 17.94% since 2000. It is estimated that the number of households in your area will be 5,629 five years from now, which represents a change of 2.55% from the current year. The average household size in your area is 3.20 persons.
The median housing value in your area was $116,241 in 2019, compare this to the US average of $212,058. In 2000, there were 2,863 owner occupied housing units in your area and there were 1,791 renter occupied housing units in your area. The median rent at the time was $553.
In 2019, the median household income for your selected geography is $31,740, compare this to the US average which is currently $60,811. The median household income for your area has changed by 0.88% since 2000. It is estimated that the median household income in your area will be $36,058 five years from now, which represents a change of 13.60% from the current year. The current year per capita income in your area is $14,312, compare this to the US average, which is $33,623. The current year average household income in your area is $46,182, compare this to the US average which is $87,636.
In 2019, there are 6,970 employees in your selected area, this is also known as the daytime population. The 2000 Census revealed that 39.28% of employees are employed in white-collar occupations in this geography, and 61.37% are employed in blue-collar occupations. In 2019, unemployment in this area is 10.71%. In 2000, the average time traveled to work was 29.00 minutes.
32

PRESENTED BYDustin R. AlvinoFirst Vice President of Investments(702) [email protected]: NV BS.0143692
Andy PasbakhshAssociate(702) [email protected]: NV S.0189780
Joe KaszupskiAssociate(702) [email protected]: NV S.0190554
Hamilton WhyteAssociate(702) [email protected]: NV S.0190848
Jake WasserkrugAssociate(702) [email protected]: NV S.0185362