carin hjalmarsson christer nilsson - diva portal639868/fulltext01.pdf · findings: the analysis...
TRANSCRIPT
0 / 37
BACHELOR THESIS Spring 2013
Business Administration
The Future of IKEA
——Watch your expansion steps
Authors
Xiyu Chen
Jing Zhang
Lu Yang
Scientific Supervisor
Christer Nilsson
Language Supervisor
Carin Hjalmarsson
Examiner
Christer Nilsson
1 / 37
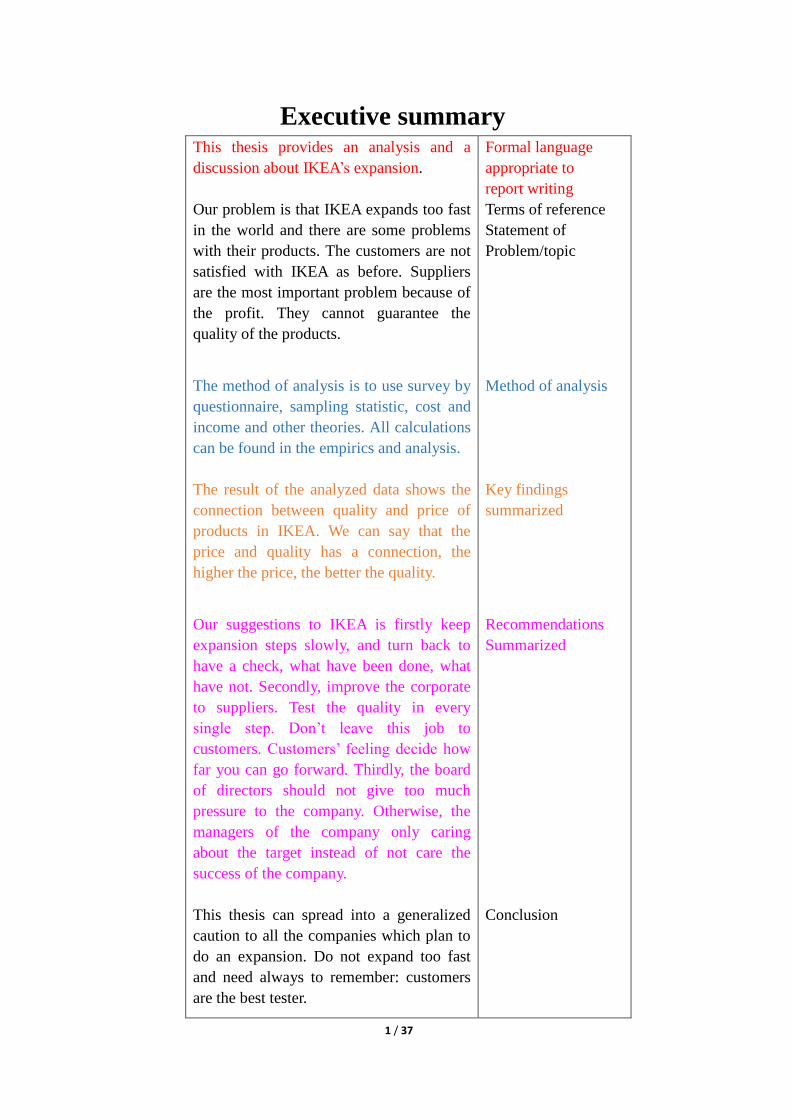
Executive summary
This thesis provides an analysis and a
discussion about IKEA’s expansion.
Our problem is that IKEA expands too fast
in the world and there are some problems
with their products. The customers are not
satisfied with IKEA as before. Suppliers
are the most important problem because of
the profit. They cannot guarantee the
quality of the products.
The method of analysis is to use survey by
questionnaire, sampling statistic, cost and
income and other theories. All calculations
can be found in the empirics and analysis.
The result of the analyzed data shows the
connection between quality and price of
products in IKEA. We can say that the
price and quality has a connection, the
higher the price, the better the quality.
Our suggestions to IKEA is firstly keep
expansion steps slowly, and turn back to
have a check, what have been done, what
have not. Secondly, improve the corporate
to suppliers. Test the quality in every
single step. Don’t leave this job to
customers. Customers’ feeling decide how
far you can go forward. Thirdly, the board
of directors should not give too much
pressure to the company. Otherwise, the
managers of the company only caring
about the target instead of not care the
success of the company.
This thesis can spread into a generalized
caution to all the companies which plan to
do an expansion. Do not expand too fast
and need always to remember: customers
are the best tester.
Formal language
appropriate to
report writing Terms of reference
Statement of
Problem/topic
Method of analysis
Key findings
summarized
Recommendations
Summarized
Conclusion
2 / 37
Abstract
Purpose/ aim: The aim is to examine if IKEA expand too fast. We try to find answers
to this problem. This is a huge problem to IKEA and other large-scale companies
which plan to expand in the world.
Design/methodology/approach: Data on customers’ feelings has been collected
through questionnaires. The analysis includes a description of the sample and statistic
test. After the test, the relationship between price and quality will be found.
Findings: The analysis showed that the expansion of IKEA is fast enough to affect
the quality of the products. There is a positive relationship between the quality and
price. The rule is that the higher the price the better the quality. The data collected
from the questionnaires shows that people think that the quality of IKEA’s products
has decreased. In the analysis, the details are showed. What happened, and why did it
happen?
From this we suggest that IKEA should slow down the steps to expansion and pay
more attention to the quality of the products.
Originality/ value: The topic about IKEA’s expansion is a totally new area, which
hasn’t been researched upon before. Most people think IKEA is a miracle and they
always hope IKEA will build more stores in the world, but with this we disagree.
Based on these findings we would argue that IKEA should slow down the steps to
expansion and pay more attention to the quality of the products. This study has value
for all the large-scale companies that want to find a way to analyze if a company
expands too fast.
Keywords: IKEA, Expansion, price and quality, and supplier.
3 / 37
Acknowledgement
We would like to express our gratitude to all those who gave us possibility to
complete this thesis.
We are deeply indebted to our supervisor Christer Nilsson from the Kristianstad
University, Sweden, whose help stimulating suggestions and encouragement helped
us in all the time of research for and writing of this thesis.
Carin Hjalmarsson focused on the final version of the thesis for English style and
grammar, she corrected both and offered suggestions for improvement.
We are also grateful to Pierre Carbonnier, who taught us business skills in order to
help us to finish a scientific thesis.
Sincerely

4 / 37
Table of content Ch1. Introduction……………………………………………………………….…06
1.1 Problem…………………………………………………………………….06
1.2 Purpose…………………………………………………………………….07
1.3 Limitations…………………………………………………………………..07
1.4 Outline of the thesis………………………………………………………….07
Ch2. Background…………………………………………………………………..09
2.1 IKEA synopsis………………………….…………………………………....09
2.2 History……………………………………………………………………….09
2.3 Problem description………………………………………............................10
Ch3. Literature review……………………………………………………………..11
3.1 Disadvantage of expanding a business…………………………………..…11
3.2 The relationship between price and quality…………………………………11
3.3 Opinion to agree with the high speed expansion……………………………12
3.4 Opinion to disagree with the high speed expansion……………………...…12
Ch4. Hypothesis………………………………………….........................................13
4.1 The relationship between price and customers……………………………...13
4.2 The expansion of IKEA……………………………………………………..13
Ch5. Theory………………………………………………………………………..15
5.1 Principal thinking figure…………………………………………………….15
5.2 Short introduction of theories will be used in this thesis………………...…16
5.2.1 SWOT………………………………………………………………...16
5.2.2 Growth speed compare……………………………………………….16
5.2.3 Cost and income………………………………………………………16
Ch6. Method………………………………………………………………………17
6.1 Sample goal…………………………………………………………….......17
6.2 Sample method……………………………………………………………..17
6.3 Sample size…………………………………………………………………17
6.4 Sample place………………………………………………………………..18
6.5 Result………………………………………………………………………..18
Ch7.Empirics………………………………………………………………………19
7.1 Chi-square test for figure 6.51………………………………………………19
7.2 Chi-square test for figure 6.52………………………………………………21
Ch8.Analysis………………………………………………………………………23
8.1 What happened on IKEAand the market?………………………………….23
8.2 Why it happened?……………………………………………………….....25
8.3 What should IKEA do and IKEA’s expand direction…………………….....28
8.4 Validity……………………………………………………………………...29
8.5 Reliability………………………………...…………………………………29
Ch9. Synthesis………………………………………………………………….……30
Ch10.Conclusion…………………………………………………………………..31
References…………………………………………………………………………33
Appendix…………………………………………………………………………..34
5 / 37
List of Tables
Table 6.1 The connection between current quality and price of products……………18
Table 6.2 The connection between previous quality and price of products……...…..18
Table 7.1 The relationship between current price and quality………………………..19
Table 7.2 The relationship between previous price and quality………………...……21
Table 8.1.1 The Growth rate/ Growth number……………………………………….23
List of Figures
Figure 5.1 The principal thinking figure……………………………………………..15 Figure 8.1.2 Line chart of Growth rate/ Growth numbers……………………………24
Figure 8.1.3 Bar chart for Price and Quality……………………………………..…26
Figure 8.1.4 Bar chart of customers’ desire for IKEA products…………………….26
Figure 8.2 Cost of suppliers……………………………………………………..…...27
Figure 8.3 IKEA expansion speed……………...…………………………………….29
6 / 37
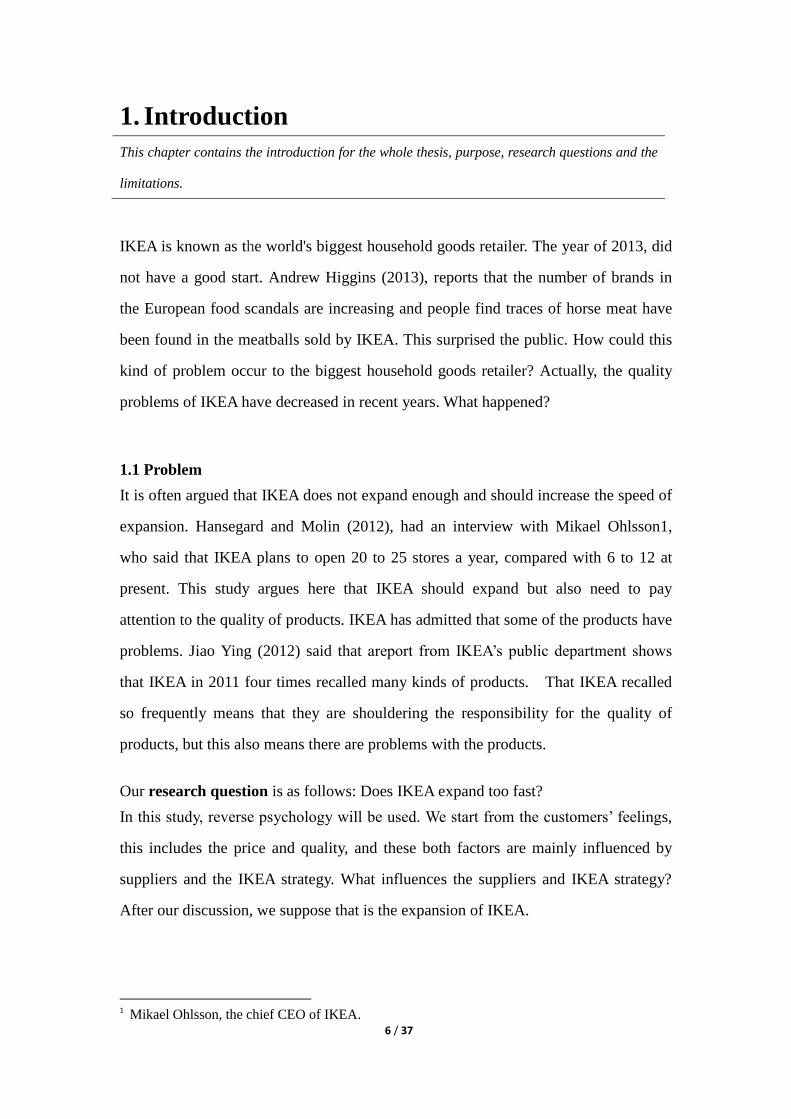
1. Introduction
This chapter contains the introduction for the whole thesis, purpose, research questions and the
limitations.
IKEA is known as the world's biggest household goods retailer. The year of 2013, did
not have a good start. Andrew Higgins (2013), reports that the number of brands in
the European food scandals are increasing and people find traces of horse meat have
been found in the meatballs sold by IKEA. This surprised the public. How could this
kind of problem occur to the biggest household goods retailer? Actually, the quality
problems of IKEA have decreased in recent years. What happened?
1.1 Problem
It is often argued that IKEA does not expand enough and should increase the speed of
expansion. Hansegard and Molin (2012), had an interview with Mikael Ohlsson1,
who said that IKEA plans to open 20 to 25 stores a year, compared with 6 to 12 at
present. This study argues here that IKEA should expand but also need to pay
attention to the quality of products. IKEA has admitted that some of the products have
problems. Jiao Ying (2012) said that areport from IKEA’s public department shows
that IKEA in 2011 four times recalled many kinds of products. That IKEA recalled
so frequently means that they are shouldering the responsibility for the quality of
products, but this also means there are problems with the products.
Our research question is as follows: Does IKEA expand too fast?
In this study, reverse psychology will be used. We start from the customers’ feelings,
this includes the price and quality, and these both factors are mainly influenced by
suppliers and the IKEA strategy. What influences the suppliers and IKEA strategy?
After our discussion, we suppose that is the expansion of IKEA.
1 Mikael Ohlsson, the chief CEO of IKEA.
7 / 37
1.2 Purpose
The ambition of this paper is firstly to examine the relationship between price and
quality for IKEA products. Secondly it is to test if IKEA expand too fast and thirdly,
how to solve the problem and make our suggestions.
1.3 Limitations
The limitation of this thesis is that not all the factors were discussed and analyzed.
There are three factors influencing the customers’ feelings: price quality and service,
but only price and quality were mainly discussed and analyzed. We focus on the price
and quality and give our conclusions.
1.4 Outlines
Chapter 1 Introduction
This chapter contains the introduction for the whole thesis, purpose, research
questions, limitations and the outlines. In this chapter, it shows that why we want to
write this thesis.
Chapter 2 Background
This chapter contains the IKEA synopsis, history and problem description. In this
chapter, it introduces more information about IKEA.
Chapter 3 Literature review
This chapter contains the literature review about the disadvantage of expanding a
business, the relationship between price and quality, and options to agree or disagree
with the high speed expansion.
Chapter 4 Hypothesis
This chapter describes the two hypothesis of the thesis, one is the relationship
between price and quality and the other one is about the expansion of IKEA. These
two hypotheses will be explained and analyzed in the following chapters.
8 / 37
Chapter 5 Theory
This chapter contains the principal thinking figure, and introduces the theory that will
be used in this thesis: SWOT analyzes growth speed, cost and income.
Chapter 6 Method
This chapter contains the sample goal, sample method, sample size, sample place and
result.
Chapter 7 Empirics
This chapter contains the chi-square test which will be introduced in this chapter. The
sample data will be calculated in this chapter.
Chapter 8 Analysis
This chapter is the integrated, systematic and scientific analysis of the topic. Different
theories will be used to analyze.
Chapter 9 Synthesis
In this chapter, we will illustrate that the combination of different theories can prove
that IKEA expand too fast.
Chapter 10 Conclusion
This chapter is a summary chapter for this thesis.
9 / 37
2. Background
This chapter contains the IKEA synopsis, history and problem description.
In chapter Background, all the information about IKEA will be introduced as the
support of this thesis, and it describes the development path until now for IKEA. After
this, the hypothesis and question can be put forward.
2.1. IKEA synopsis
IKEA is a widely known home furnishing retailer. It has grown rapidly since it
was set up in 1943. Nowadays, it is the world's largest furniture retailer,
recognized for its Scandinavian style. The furniture are nice designed and
functional. The majority of IKEA's furniture is flat-pack, ready to be assembled by
the consumer. This will reduce in the costs of packaging. IKEA carries a range
almost ten thousand products, including home furniture and accessories. This wide
range is available in all IKEA stores and customers can order much of the range
online through IKEA's website. Li Zhi (2010).
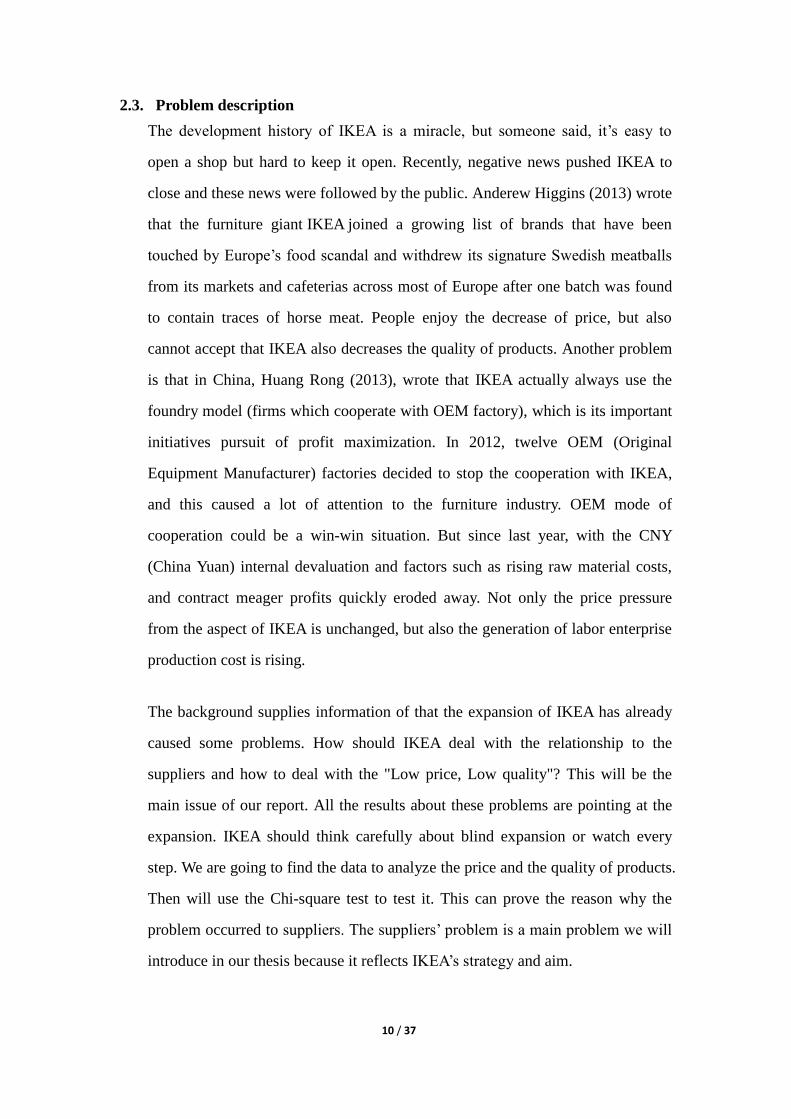
2.2. History (Picture from: Osama (2011))
10 / 37
2.3. Problem description
The development history of IKEA is a miracle, but someone said, it’s easy to
open a shop but hard to keep it open. Recently, negative news pushed IKEA to
close and these news were followed by the public. Anderew Higgins (2013) wrote
that the furniture giant IKEA joined a growing list of brands that have been
touched by Europe’s food scandal and withdrew its signature Swedish meatballs
from its markets and cafeterias across most of Europe after one batch was found
to contain traces of horse meat. People enjoy the decrease of price, but also
cannot accept that IKEA also decreases the quality of products. Another problem
is that in China, Huang Rong (2013), wrote that IKEA actually always use the
foundry model (firms which cooperate with OEM factory), which is its important
initiatives pursuit of profit maximization. In 2012, twelve OEM (Original
Equipment Manufacturer) factories decided to stop the cooperation with IKEA,
and this caused a lot of attention to the furniture industry. OEM mode of
cooperation could be a win-win situation. But since last year, with the CNY
(China Yuan) internal devaluation and factors such as rising raw material costs,
and contract meager profits quickly eroded away. Not only the price pressure
from the aspect of IKEA is unchanged, but also the generation of labor enterprise
production cost is rising.
The background supplies information of that the expansion of IKEA has already
caused some problems. How should IKEA deal with the relationship to the
suppliers and how to deal with the "Low price, Low quality"? This will be the
main issue of our report. All the results about these problems are pointing at the
expansion. IKEA should think carefully about blind expansion or watch every
step. We are going to find the data to analyze the price and the quality of products.
Then will use the Chi-square test to test it. This can prove the reason why the
problem occurred to suppliers. The suppliers’ problem is a main problem we will
introduce in our thesis because it reflects IKEA’s strategy and aim.

11 / 37
3. Literature review
This chapter contains the literature review about the disadvantage of expanding a business, the
relationship between price and quality, and options to agree or disagree with the high speed
expansion.
In the introduction we argued that IKEA should pay attention to customer’s feelings
when the firm is rapidly expanding. Rapid expanding brings some disadvantages.
3.1. Disadvantage of expanding a business
Although the literature covers a wide variety of such theories, this review will
focus on four major factors. Ralph Heibutzki (year of publication unknown)
claims that there are four main disadvantages of expanding a business:
compromised quality, employee turnover, financial challenges and loss of control.
In this case study, we will mainly focus on the factor of “compromised quality”.
This argument illustrates that rapid growth can lead to declined quality.
3.2. The relationship between price and quality
The arguments in this literature review draws on the consumer and market
behavior when consumers use price as a cue to quality. Steven M. Shugan (1984),
divided customers into three types: those who only care about the price, those who
only care about quality and those who care about them both. Their behaviors
decide the price and quality. Another important theory is that the change of price
of low price products can bring a bigger influence on the quality than the change
of price of high level products. This can also help us to explain the reason why the
quality of IKEA products is worse than before.
12 / 37
3.3. Opinion to agree with the high speed expansion
Some would argue that IKEA should keep the steps to expansion, and even go
faster. Zhi Li (2010) claims that IKEA already understands the China market
more than before. If IKEA accelerates the speed of expansion, they will get more
customers. The success of IKEA in China market only depends on the time. If
there is enough time, IKEA will succeed in China market.
3.4. Opinion to disagree with the high speed expansion.
Others have argued that IKEA should not continue to expand too fast because of
the quality problems. Andrew Ward (2011) interviewed the CEO of IKEA-
Mikael Ohlsson. Mr Ohlsson said he was determined that the expansion in China
would go more smoothly, with plans to add another eight to the company’s
existing stores at a rate of just one or two a year. “The potential in China is
enormous but there is no rush,” he said. “We want to make sure we are always
doing a good job where we already are before moving on.” Mr Ohlsson’s words
are exactly what we want to suggest to all firms.
In this chapter we situated our argument in the literature on the interview from
Andrew Ward (2011), because Mr Ohlsson’s words are completely the core idea of
this study.

13 / 37
4. Hypothesis
This chapter describes the two hypothesis of the thesis, one is the relationship between price and
quality and the other one is about the expansion of IKEA. These two hypotheses will be explained
and analyzed in the following chapters.
From the literature review and the research question, we conclude two hypotheses in
our thesis. Each one of them can be supported by one or two articles. The hypothesis
only discusses two variables.
4.1 The relationship between price and quality
Discussing the relationship between the price and the quality, Shugen (1984), claims
that there are mainly three kinds of customers, the first type of customers only care
about the price. Whatever the quality of the products, they only buy the cheap goods.
These customers are mainly low-income customers. The second type of customers
only care about quality. Whatever the price of goods, they only buy the good-quality
goods. These customers are mainly high or middle-income customers. Finally, the
third type of customers cares both about the price and the quality or we can call that to
care about the cost performance. Shugen’s comment that the price and quality have a
settled relevance means when the price increases the quality increases.
Hypothesis 1: The products of IKEA also follow this pattern, when the price increases,
the quality increases.
4.2 The expansion of IKEA
In order to achieve the target from board of directors: they should increase sale
volume with 10%. IKEA has rapidly expanded in the recent years. Is it a good
phenomenon? Many people think that IKEA is suitable for expansion, because they
see the increase of capital every year. The brilliant and cool people do not agree with
the same idea. They know the disadvantage of that. Heibutzki (year of publication
unknown) claims that there are four main disadvantages of rapid expansion; the first

14 / 37
one is compromised quality, the second one is employee turnover, the third one is
financial challenges and the last one is loss of control.
Hypothesis 2: If IKEA expands too fast it will lead to quality problems.

15 / 37
5. Theory
This chapter contains the principal thinking figure, and introduce the theory that will be used in
this thesis: SWOT analyzes, growth speed, cost and income
In this thesis, many theories can be used, and these theories can prove the possibility
of the results. They will be introduced in this chapter shortly one by one and then they
can be used in analysis and synthesis.
5.1. Principal thinking figure
Figure 5.1 The principal thinking figure
Explanation of the principal thinking figure:
In this study, the customers feelings and the expansion of IKEA is the most important
to study. In the figure we can see the customers’ feelings at the start, and the
expansion of IKEA at the end. Customers’ feelings are the most important for the

16 / 37
customers and these feelings include the price of the products they bought and the
quality of them, also the service which they enjoyed when they were shopping. How
does the price and quality influence the products? We think this is mainly because of
the cost of suppliers and the strategy of IKEA. They cooperate together to decide the
quality and price. They have a very strong connection and they can also influence
each other. In this study, we think that the expansion of IKEA decide the influencing
factors and the reason for this we will give in the chapter about analysis.
5.2 Short introduction of the theories in this thesis
5.2.1 SWOT
SWOT analysis is a basic marketing theory. It is an acronym in which its four
letters: strengths, weaknesses, opportunities and threats. Nikolaus Schall (year of
publication unknown) claims that a SWOT session is a means of obtaining
information from participants. That information is composed of observations and
analysis of those observations by the participants. This theory used in this study
can supply the two arguments. Optimistic people can see the growth of IKEA and
be satisfied about it. Pessimistic people can see the shortages of IKEA.
5.2.2 Growth speed comparison
In this dissertation we present a way to test the speed of growth, because of the
data number of IKEA stores from 2008-2012. The total revenue from 2008-2012
have been collected from the official yearly report of IKEA. We divided the
growth rate by the growth number of stores and the number showed us the
expanding speed. The most important is that the result number can show if there is
a relationship between the number of stores and the increase of total revenue.
5.2.3 Cost and income
The figure of cost and income (see in chapter method) is used to show the
situation which suppliers that corporate with IKEA are faced with. It can be used
to explain the change of cost that leads to the change of price.

17 / 37
6. Method
This chapter contains the sample goal, sample method, sample size, sample place and result
Sampling is the main method and how to use sampling in this thesis will be
introduced in this chapter. When we put sampling into practice we have to be
equipped with a clear plan and thought.
6.1 Sample goal
The study’s empirical object is IKEA, and the data were collected by using a
questionnaire. The idea was according to the customers’ feelings. We assume to divide
the customers’ feelings into three parts and they are price, quality and service. Every
single part can affect the customers’ feelings about one company. In this dissertation,
price and quality will be deeply discussed in order to conclude the relevance.
6.2 Sample method
In this study, stratified sampling and pilot sampling will be used to collect data. We
aim to find the relationship between price and quality of IKEA products. Our plan is
to divide both the price and quality into three levels each. For price, the three levels
are low, medium and high, and for quality, the three levels are good, common and
bad.
6.3 Sample size
The total number of questionnaires is 200. The questionnaires were delivered in IKEA
stores. The respondents were disturbed about only one minute, the time it took to
answer the questions. When using this way to collect all the data there will be no
waste in questionnaires, and it is possible to prompt and explain immediately when
the respondents meet some problems. In the end, all the questionnaires had been used
and 180 of them were valuable. The wastage rate is 20/200= 0.1.
18 / 37
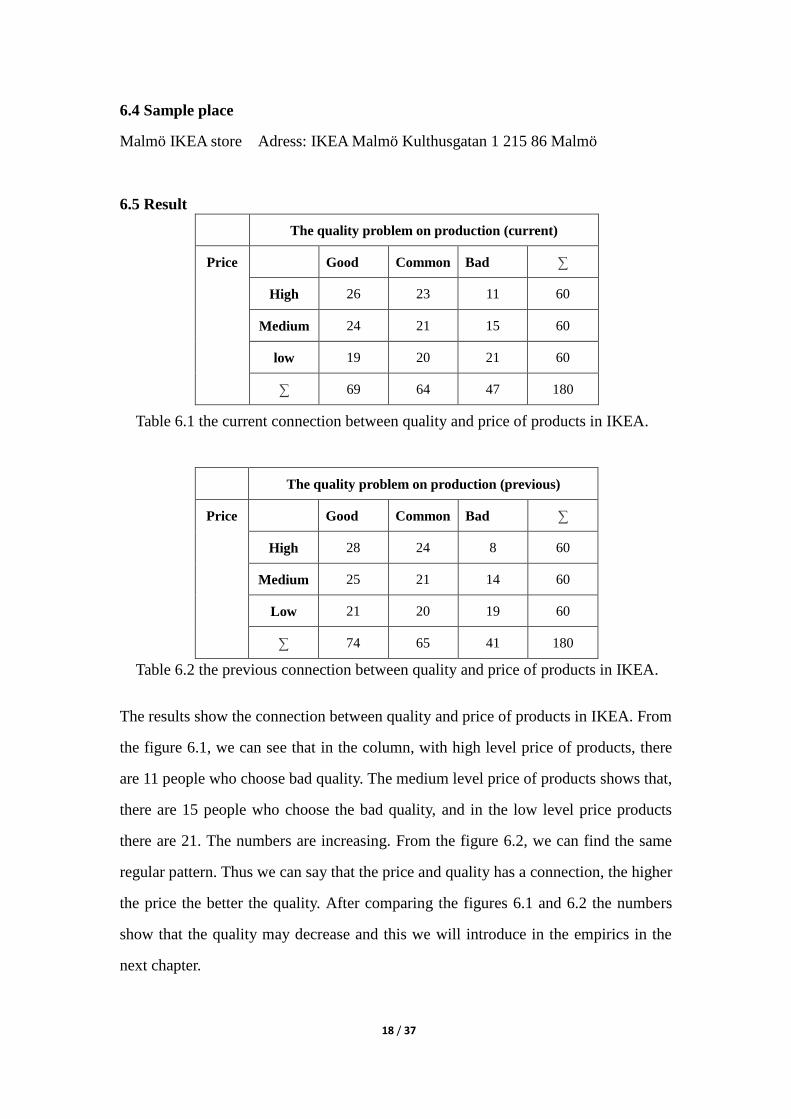
6.4 Sample place
Malmö IKEA store Adress: IKEA Malmö Kulthusgatan 1 215 86 Malmö
6.5 Result
The quality problem on production (current)
Price Good Common Bad ∑
High 26 23 11 60
Medium 24 21 15 60
low 19 20 21 60
∑ 69 64 47 180
Table 6.1 the current connection between quality and price of products in IKEA.
The quality problem on production (previous)
Price Good Common Bad ∑
High 28 24 8 60
Medium 25 21 14 60
Low 21 20 19 60
∑ 74 65 41 180
Table 6.2 the previous connection between quality and price of products in IKEA.
The results show the connection between quality and price of products in IKEA. From
the figure 6.1, we can see that in the column, with high level price of products, there
are 11 people who choose bad quality. The medium level price of products shows that,
there are 15 people who choose the bad quality, and in the low level price products
there are 21. The numbers are increasing. From the figure 6.2, we can find the same
regular pattern. Thus we can say that the price and quality has a connection, the higher
the price the better the quality. After comparing the figures 6.1 and 6.2 the numbers
show that the quality may decrease and this we will introduce in the empirics in the
next chapter.

19 / 37
7. Empirics
This chapter contains the chi-square test which will be introduced in this chapter
Chi-square test is the main method to test the relationship between the two variables.
The data which has been collected is managed into tables, after using the Chi-square
test to test. Then we can know that hypothesis 0 is accepted or rejected.
7.1 Chi-square test for table 6.1
Table 7.1 The relationship between current price and quality
The current quality problem on production
Price Good Common Bad ∑
High 26(23) 23(21.333) 11(15.666) 60
Medium 24(23) 21(21.333) 15(15.666) 60
Low 19(23) 20(21.333) 21(15.666) 60
∑ 69 64 47 180
I. Null Hypothesis:
H0: there is an association between the current number of production
problem and the price.
H1: there is no association between the current number of production
problem and the price.
II. Statistic Test: Since the groups in the study are independent and
the number more than two, a statistical test for k independent groups
(the problem number of production and price) is appropriate. Since
the data are in discrete categories, the chi-square test is appropriate.
III. Significance Level: Let α = 0.05 and N is the number of price
which participated in the study = 180.
IV. Sampling distribution: Under the null hypothesis, χ2 as
computed from Table (I) is distributed approximately as χ2 with df =
(r-1) (k-1). When H0 is true, the probability associated with the
occurrence of values as large as or larger than an observed χ2 is

20 / 37
tabled in Appendix Table C2.
V. Rejection region: The region of rejection consists of all values of
χ2 which are so large that the probability associated with their
occurrence when H0 is true is less than or equal to α = 0.05.
VI. Decision: Tables summarize the frequency of occurrence of
salary levels within each category for each of the problem number of
production. The table also shows in italics the numbers of prices
which might be expected to show the quantity of prices which is
divided by the problem number of production.
The size of χ2 reflects the magnitude of the discrepancy between the
observed and the expected values in each of the cells. We may
calculate χ2 for the values in Table
χ2 = (26-23)
2 /23+ (24-23)
2 /23 + (19-23)
2 /23+ …… + (21-15.666)
2 /15.666 = 6.419
df = (r-1) (k-1) = 4
Reference to Appendix Table C reveals that such a value of χ2 quale to
56.419, less than 9.49 which is significant 0.05 level. Therefore, the
result is less than significant level. Our decision is to accept H0.
2 From the table C in Alan Agresti and Barbara Finlay (2009), statistical method for the social sciences. Appendix
table C. P594. When df=4, χ2=6.419. So the right-tail probability is between 0.250 to 0.100.
21 / 37
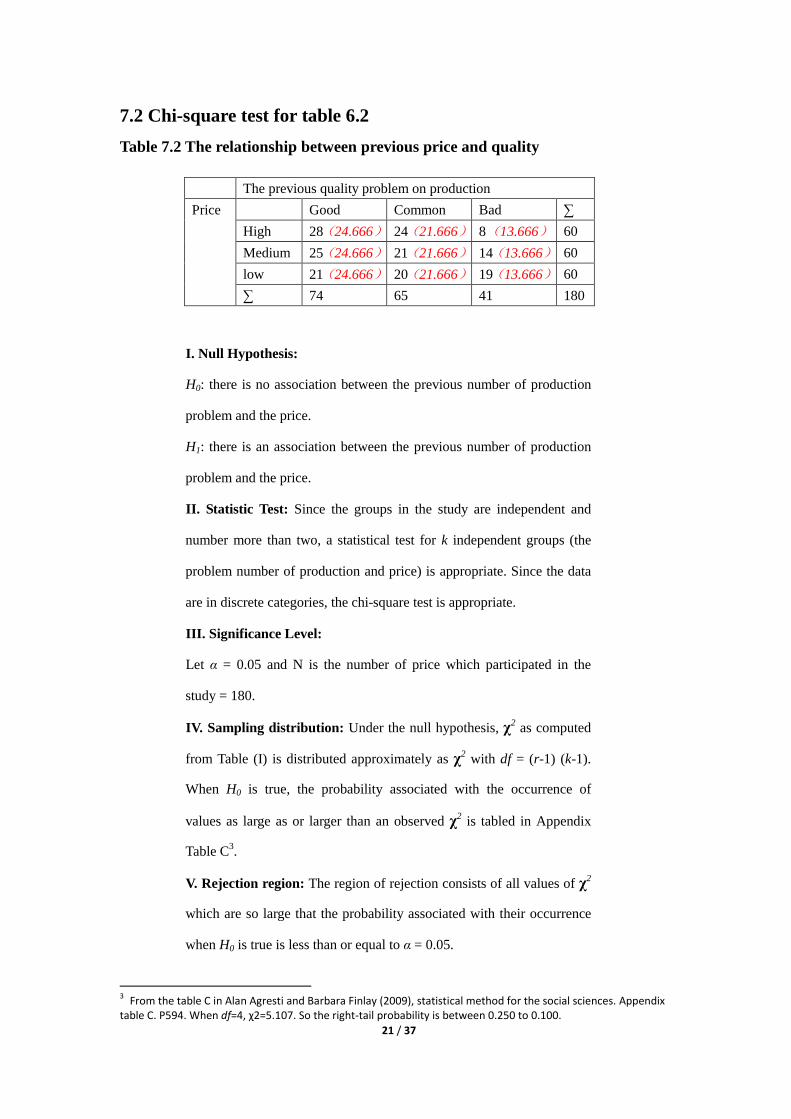
7.2 Chi-square test for table 6.2
Table 7.2 The relationship between previous price and quality
The previous quality problem on production
Price Good Common Bad ∑
High 28(24.666) 24(21.666) 8(13.666) 60
Medium 25(24.666) 21(21.666) 14(13.666) 60
low 21(24.666) 20(21.666) 19(13.666) 60
∑ 74 65 41 180
I. Null Hypothesis:
H0: there is no association between the previous number of production
problem and the price.
H1: there is an association between the previous number of production
problem and the price.
II. Statistic Test: Since the groups in the study are independent and
number more than two, a statistical test for k independent groups (the
problem number of production and price) is appropriate. Since the data
are in discrete categories, the chi-square test is appropriate.
III. Significance Level:
Let α = 0.05 and N is the number of price which participated in the
study = 180.
IV. Sampling distribution: Under the null hypothesis, χ2 as computed
from Table (I) is distributed approximately as χ2 with df = (r-1) (k-1).
When H0 is true, the probability associated with the occurrence of
values as large as or larger than an observed χ2 is tabled in Appendix
Table C3.
V. Rejection region: The region of rejection consists of all values of χ2
which are so large that the probability associated with their occurrence
when H0 is true is less than or equal to α = 0.05.
3 From the table C in Alan Agresti and Barbara Finlay (2009), statistical method for the social sciences. Appendix
table C. P594. When df=4, χ2=5.107. So the right-tail probability is between 0.250 to 0.100.

22 / 37
VI. Decision: Tables summarize the frequency of occurrence of salary
levels within each category for each of the problem number of
production. The table also shows in italics the numbers of prices which
might be expected to show the quantity of prices which is divided by the
problem number of production.
The size of χ2 reflects the magnitude of the discrepancy between the
observed and the expected values in each of the cells. We may calculate
χ2 for the values in Table
χ2 = (28-24.666) 2 /24.666+ (25-24.666) 2 /24.666 + (21-24.666) 2
/24.666+ …… + (19-13.666) 2 /13.666 = 5.107
df = (r-1) (k-1) = 4
Reference to Appendix Table C reveals that such a value of χ2 quale to
5.107, less than 9.49 which is significant 0.05 level. Therefore, the
result is less than significant level. Our decision is to reject H0.
23 / 37
8. Analysis
This chapter is the integrated, systematic and scientific analysis of the topic.
In the analysis chapter, we can analyze the thesis and hypothesis carefully, and once
we start to analyze, it must be a logic, scientific process analyzing why IKEA has this
problem and how to solve this problem. All the theories can be used to explain and
prove this.
8.1 What happened on IKEA and market?
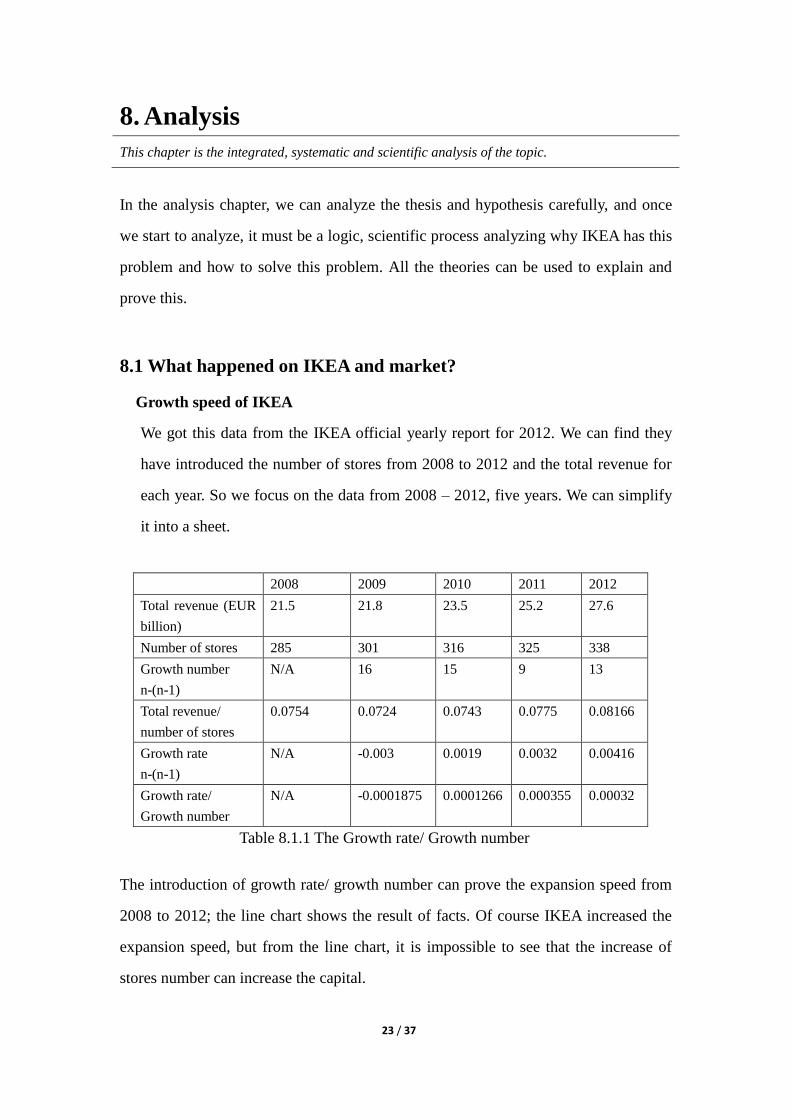
Growth speed of IKEA
We got this data from the IKEA official yearly report for 2012. We can find they
have introduced the number of stores from 2008 to 2012 and the total revenue for
each year. So we focus on the data from 2008 – 2012, five years. We can simplify
it into a sheet.
2008 2009 2010 2011 2012
Total revenue (EUR
billion)
21.5 21.8 23.5 25.2 27.6
Number of stores 285 301 316 325 338
Growth number
n-(n-1)
N/A 16 15 9 13
Total revenue/
number of stores
0.0754 0.0724 0.0743 0.0775 0.08166
Growth rate
n-(n-1)
N/A -0.003 0.0019 0.0032 0.00416
Growth rate/
Growth number
N/A -0.0001875 0.0001266 0.000355 0.00032
Table 8.1.1 The Growth rate/ Growth number
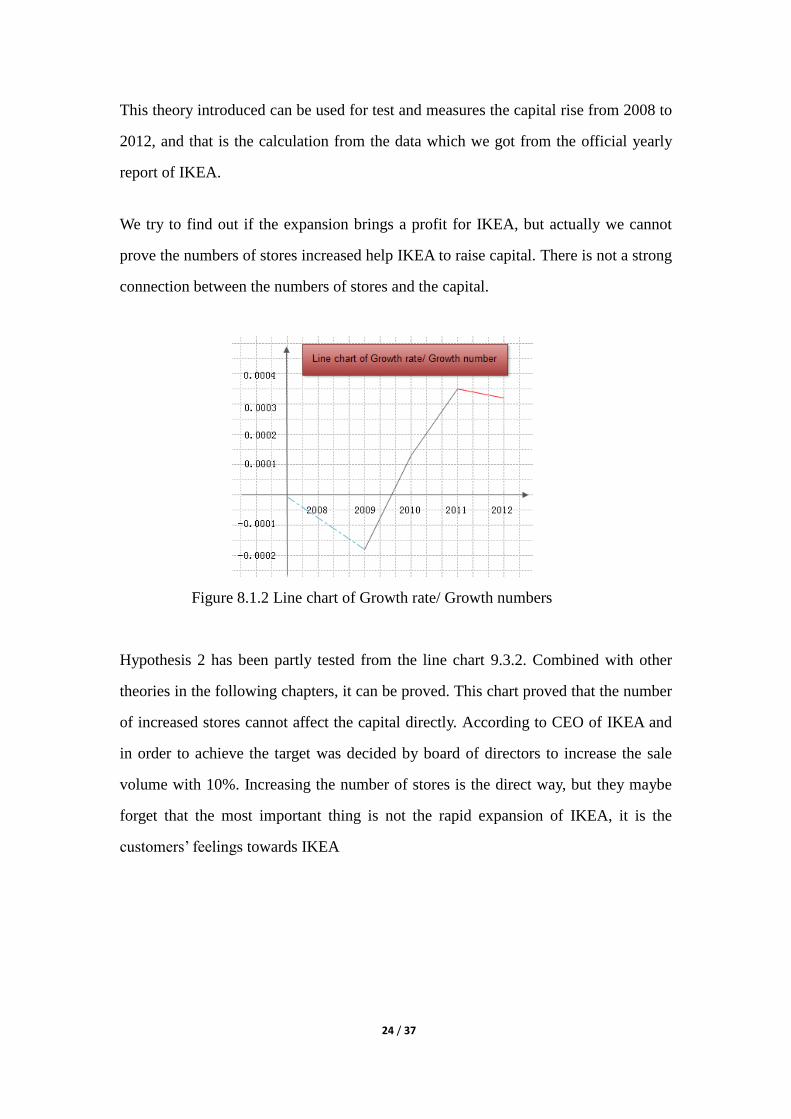
The introduction of growth rate/ growth number can prove the expansion speed from
2008 to 2012; the line chart shows the result of facts. Of course IKEA increased the
expansion speed, but from the line chart, it is impossible to see that the increase of
stores number can increase the capital.
24 / 37
This theory introduced can be used for test and measures the capital rise from 2008 to
2012, and that is the calculation from the data which we got from the official yearly
report of IKEA.
We try to find out if the expansion brings a profit for IKEA, but actually we cannot
prove the numbers of stores increased help IKEA to raise capital. There is not a strong
connection between the numbers of stores and the capital.
Figure 8.1.2 Line chart of Growth rate/ Growth numbers
Hypothesis 2 has been partly tested from the line chart 9.3.2. Combined with other
theories in the following chapters, it can be proved. This chart proved that the number
of increased stores cannot affect the capital directly. According to CEO of IKEA and
in order to achieve the target was decided by board of directors to increase the sale
volume with 10%. Increasing the number of stores is the direct way, but they maybe
forget that the most important thing is not the rapid expansion of IKEA, it is the
customers’ feelings towards IKEA

25 / 37
8.2 Why it happened?
8.2.1 SWOT analyze in China
The SWOT analyze the situation of IKEA in the China market and the reason for
chooseing the China market is because China is an immature and not saturated
market, still with a room to go further. According to Li Zhi (2010), we divide the
SWOT into four charts.
8.2.2 Cost and income
After the questionnaire and the raw data was collected, it was necessary to deal
with them and statistic in a bar chart. Data for different variables is presented in
the bar chart. It is the result after analysis.
1. Brand products with the same business
model, the concentration is not high
2. To a certain extent, furniture products are
the necessities of people's life, the market
capacity is big.
3. With the improvement of income level,
the purchasing power of Chinese households
also increased
4. The strengthening of the global awareness
of environmental protection, which
coincides with the IKEA concept.
5. Products in the market and more to meet
the demand of the main consumers.
1. Raw materials and labor costs are rising.
2. Quality control is not stable, the customers
complaints on product quality and service have.
3. New product development cycle is long, and
the cost is too high.
4. Cross-regional products and cultures are
different.
5. Customers picking up goods by themselves
cause the loss of customers’ satisfaction.
6. Supplier quality issues, and its production
management overall level is low.
1. IKEA has 100 years of history and deep
Nordic culture
2. One of top 500 companies, high brand
awareness
3. Intergrade design, produce and sale.
4. Exhibition hall to show the products to
customers
5. Environmental: good corporate image.
6. Flat packaging transportation; self-help
delivery.
1. Industry competition leads to product prices
fall further.
2. Supplier price instability and the decrease of
the quality of the product.
3. Slowdown in market growth.
4. China's new labor law implementation,
increased labor costs.
5. China's furniture market is not standardized
led to the vicious competition.

26 / 37
2624
1923
21 20
1115
21
0
5
10
15
20
25
30
Expansive Meidum Cheap
QU
ALT
IY
PRO
BLE
M
PRICE LEVEL
Price and Quality
good common bad
Figure 8.1.3 Bar chart for Price and Quality
Hypothesis 1 have been tested. From the bar chart, the following regularities can
be summarized:
1. There is a connection between price and quality (chi-square also tested it).
2. This proved that the quality of products from IKEA have decreased compared to
before.
Customers still can accept when the products have some quality problem, when
the price is cheap. The cost performance is still worth it. Many customers
mentioned this point. However, other customers hope they can buy good quality
products but to a cheap price.
8.2.3 Customers’ desire
Quality 22
Price 31
Qulaity and Price 127
22 31
127
0
50
100
150
Customers' desire for IKEA products
Quality Price Qulaity and Price
Figure 8.1.4 Bar chart of customers’ desire for IKEA products
27 / 37
How did it happen? In this study we think the key point is suppliers. IKEA did
well in many areas such as transportation, sell design and advertising, but it
cannot control the suppliers’ products well. This problem can be divided into two
aspects; one is the supply aspects, the other is the IKEA aspects.
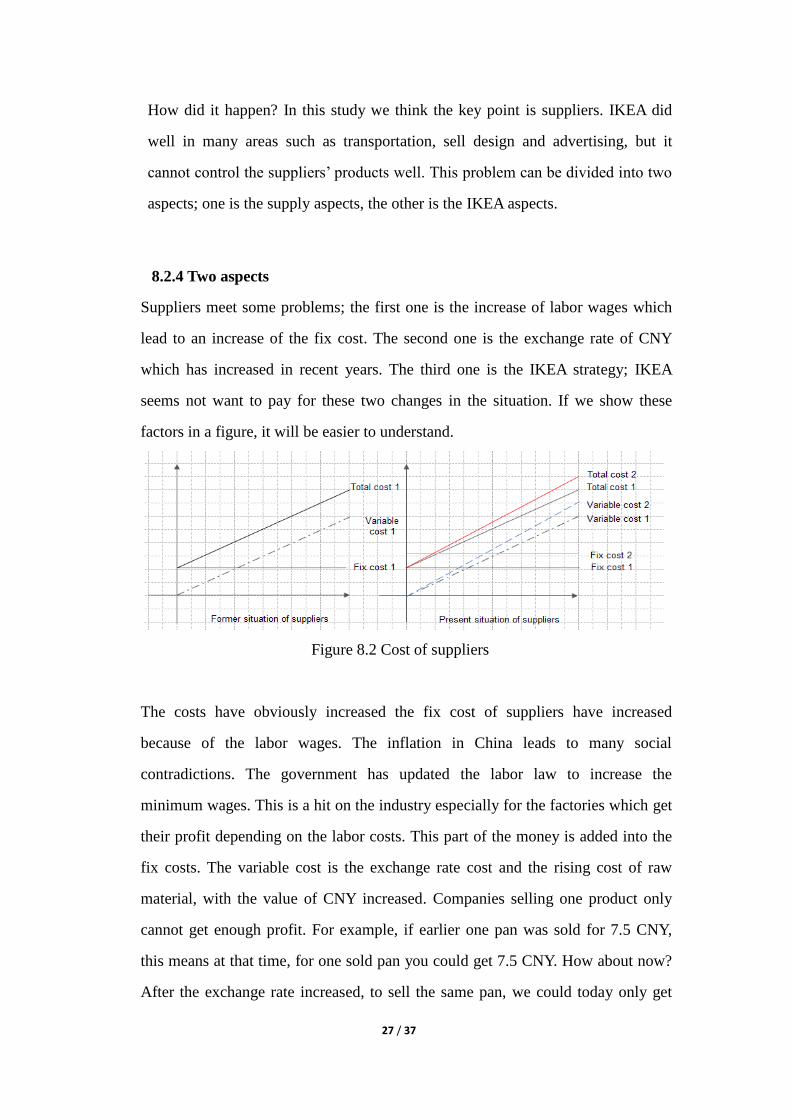
8.2.4 Two aspects
Suppliers meet some problems; the first one is the increase of labor wages which
lead to an increase of the fix cost. The second one is the exchange rate of CNY
which has increased in recent years. The third one is the IKEA strategy; IKEA
seems not want to pay for these two changes in the situation. If we show these
factors in a figure, it will be easier to understand.
Figure 8.2 Cost of suppliers
The costs have obviously increased the fix cost of suppliers have increased
because of the labor wages. The inflation in China leads to many social
contradictions. The government has updated the labor law to increase the
minimum wages. This is a hit on the industry especially for the factories which get
their profit depending on the labor costs. This part of the money is added into the
fix costs. The variable cost is the exchange rate cost and the rising cost of raw
material, with the value of CNY increased. Companies selling one product only
cannot get enough profit. For example, if earlier one pan was sold for 7.5 CNY,
this means at that time, for one sold pan you could get 7.5 CNY. How about now?
After the exchange rate increased, to sell the same pan, we could today only get

28 / 37
6.5 CNY. Suppliers lost 1 CNY invisibly. As for the raw material, parts of
suppliers which support raw materials will face this problem. The CPI4 rising step
by step because of the inflation and the price for one unit raw material has also
increased. Of course, the suppliers should face this problem by themselves. The
three changes are perpetual pressing the profit from suppliers, so they cannot
guarantee the quality of products.
As for IKEA, not only in the China market, IKEA want to decrease all the prices
of products for more market shares from its competitors and for more profit.
Therefore the company can hardly promise to give more benefit to the suppliers.
8.3 What should IKEA do and IKEA’s expand direction
Expansion step description
The expansion can hardly be tested by any single theory; it can be described in
other ways, and the figure 9.41 shows how to describe the expansion speed of a
company. Although it can be a little bit abstract. We assume that if a company does
not expand over the limit, the expansion will not influence the quality and the
capital, which is shown in part1. If a company has already a problem with the
quality of products and service, it looks like in part2. If the company solves the
problem and is suitable for expansion, the company can still expand just like the
green line. If the company cannot solve the problem, it can be described just like
the red line. Then the company has to stop and stable the situation.
4 CPI: Consumer Price Index. Measures changes in the price level of a market basket of consumer
goods and services purchased by households.

29 / 37
Figure 8.3 IKEA expansion speed
8.4 Validity
This paragraph will describe the validity of this thesis. The analysis of this thesis was
based on the data collection. The data was collected by using stratified sampling
method in order to decrease the margin of error in collecting data. This can also keep
the faith in science.
8.5 Reliability
This paragraph will describe the validity of this thesis. The solution of the thesis can
be used in real life. If the chief manager can think deeply about this, we believe that
IKEA will have a better prospect.

30 / 37
9. Synthesis
In this chapter, we will illustrate that the combination of different theories can prove that
IKEA expand too fast.
IKEA is the biggest household articles company. Each step of development is to
attract the public’s eyes. In this study, we query the expansion speed of IKEA. No
companies can always be perfect, it must include IKEA!
The expansion speed can hardly be measured and tested, but it can be tested in other
ways. A company with a good situation and preparation can expand. A company
without a very good situation and preparation must look out. A company that is
already in trouble cannot continue to expand. The situation of IKEA is not very good,
it still looks brilliant on the surface, but in the deeper level, there is a big problem.
That is the quality of the products.
Firstly, the calculation in the official yearly report showed that although the capital of
the company increases every year, they cannot prove that the expansion brings a profit.
Secondly, and the most important part which support our thesis is the result of
sampling. The data was collected by sampling, and after the chi-square test, it proved
that there is a strong connection between the price and quality. In ten years, IKEA
reduce the average price with 20%, but in these ten years, the costs are increasing. We
also proved that the quality of products of IKEA decreased indeed. If IKEA does not
expand so fast, it can help suppliers to deal with the problem of quality. Big numbers
of stores bring the huge demand. In order to fill this, IKEA has to accept some quality
problem from the suppliers. Thirdly, customers are always the best spokesmen and
testers. Their needs and comments are the most important things.
This thesis tested the connection between price and quality and proved that when the
normal price increased, the quality increased, and vice versa, if the price is lower, the
quality should be lower too.
31 / 37
10. Conclusion
This chapter is a summary chapter for this thesis.
The problem of this study is that IKEA expands too fast. More and more quality
problems influence the customers’ feelings and the image of the company. The hard
situation makes it difficult for them continuing to guarantee the quality of the
products. According to the literature review, some theses were found to help us with
thoughts and theory. They support this thesis.
The value of this thesis is firstly, it provides empirical knowledge about the
relationship between price and quality for IKEA products. Secondly, it shows that the
development path of IKEA and give suggestions to the future development and thirdly,
it contributes to the field if large-scale companies are suitable to expansion and how
fast it should go.
This thesis collected the data from IKEA stores. People were divided into three groups
and in each group were 60 people divided after income. Then the chi-square test was
used to prove the relevance. The most important part is analysis and discussion. In
these two parts, the main thinking and idea were introduced. We used a scientific way
to analyze why IKEA expands too fast and we also gave our suggestions to IKEA.
Firstly, slow down the expansion steps, and turn back to have a check; what have been
done, what have not. Secondly, improve the corporate to suppliers. Test the quality in
every single step. Don’t leave this job to customers. Customers’ feelings decided how
far you can go forward and thirdly the board of directors should not give too much
pressure to the company. Otherwise, the managers of the company only care about the
target instead not caring about the success of the company. Adjust the policy from the
top manager in order to change the management pattern. Put the key point on not only
the profit but also the quality.

32 / 37
This thesis can spread into a generalized caution to all the companies which plan to do
an expansion. WE want to advise them not to expand too fast and always remember
that the: customers are the best tester.
Future research
However, there are still some shortage and limits of this thesis; firstly, IKEA has more
than one million members and also a lot of customers that are not members of IKEA.
Our sample has just 180 people that maybe with a wide error. Secondly, that IKEA
expands too fast even influence the quality of products, but this is a new topic and
there is a lack of the support in literature review. Many points and information is
published by news, not the thesis. Thirdly, data of IKEA is not easy to collect because
of the properties of IKEA, so we cannot give any final or explicit suggestions to IKEA
with the lack of data support. The suggestions build on the analysis and synthesis and
finally, because of the condition, the data collection was operated in Sweden, but the
main part of the thesis is discussing IKEA in the China market. Different countries
must have different thoughts and ideas. This error can influence the result. In the
future research, all these points will be improved in order to get a result without error
as accurate as possible.
33 / 37
Reference Alan Agresti and Barbara Finlay (2009), statistical method for the social sciences.
Fourth edition. Person international edition. America.
Andrew ward (2011), Ikea takes cautious approach on China. Financial Times.
http://www.ftmailbox.com/story/001036500/ce. Accessed on: 2013-05-05.17:25:08
IKEA annual official report, welcome_inside_2011. Pdf edition. PP. 1-26.
IKEA annual official report, welcome_inside_2012. Pdf edition. PP. 1-47.
IKEA_Group_Sustainability_Report_FY12_FINAL. Pdf edition. PP. 1-98.
Jen Hansegard and Anna Molin (2012), IKEA to Accelerate Expansion. The wall
street journal. Europe edition. Available at:
http://online.wsj.com/article/SB10000872396390444450004578003971406212516.html#ar
ticleTabs%3Darticle. Accessed on: 2013-05-05.18:09:25
Jiao Ying (2012), IKEA recalled four times a year a variety of commodity quality
problem of concern. Available at:
http://jiaju.chinadaily.com.cn/2012-07/13/content_15576489.htm. Accessed on:
2013-05-05.16:58:09
Li Zhi (2010), the competitive advantage of IKEA and IKEA in China, master thesis
in logistics and innovation management. University of Gävie. P. 6.
Li Zhi (2010), the competitive advantage of IKEA and IKEA in China, master thesis
in logistics and innovation management. University of Gävie. P. 30.
Luu Trong Tuan, Nguyen Thi Truc Phuong, Luu Thi Bich Ngoc & Luu Hoang Mai
(2013), Powdered Milk Consumers’ Buying Behavior. International Journal of
Business and Management; Vol. 8, No. 2. PP. 29-37.
Ralph Heibutzki (???), the Disadvantages of Expanding a Business. Available at:
http://smallbusiness.chron.com/disadvantages-expanding-business-22611.html.
Accessed on: 2013-05-05.20:05:16
Richard Milne (2013), IKEA founder questions rapid expansion. Financial Times.
Available at:
http://www.ft.com/cms/s/0/7061b22a-664d-11e2-919b-00144feab49a.html#axzz2SMQgsC
Ai. Accessed on: 2013-05-05. 20:14:58
Steven M. Shugan (1984), "Price-Quality Relationships", in NA - Advances in
Consumer Research Vol. 11, eds. Thomas C. Kinnear, Provo, UT: Association
for Consumer Research, PP. 627-632.
34 / 37
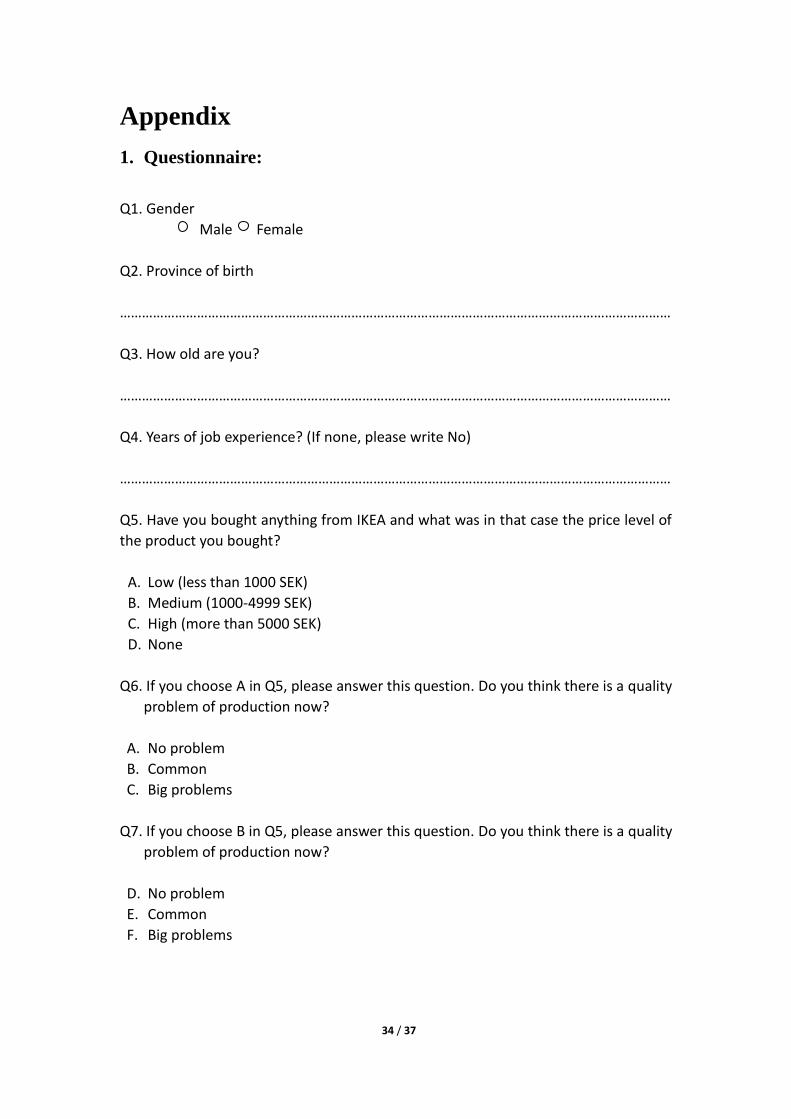
Appendix
1. Questionnaire:
Q1. Gender
Male Female
Q2. Province of birth
……………………………………………………………………………………………………………………………………
Q3. How old are you?
……………………………………………………………………………………………………………………………………
Q4. Years of job experience? (If none, please write No)
……………………………………………………………………………………………………………………………………
Q5. Have you bought anything from IKEA and what was in that case the price level of
the product you bought?
A. Low (less than 1000 SEK)
B. Medium (1000-4999 SEK)
C. High (more than 5000 SEK)
D. None
Q6. If you choose A in Q5, please answer this question. Do you think there is a quality
problem of production now?
A. No problem
B. Common
C. Big problems
Q7. If you choose B in Q5, please answer this question. Do you think there is a quality
problem of production now?
D. No problem
E. Common
F. Big problems

35 / 37
Q8. If you choose C in Q5, please answer this question. Do you think there is a quality
problem of production now?
G. No problem
H. Common
I. Big problems
Q9. If you choose A in Q5, please answer this question. Do you think there is a quality
problem on the products which you bought BEFORE?
J. No problem
K. Common
L. Big problems
Q10. If you choose B in Q5, please answer this question. Do you think there is a
quality problem on the products which you bought BEFORE?
A. No problem
B. Common
C. Big problems
Q11. If you choose C in Q5, please answer this question. Do you think there is a
quality problem on the products which you bought BEFORE?
A. No problem
B. Common
C. Big problems
Q12. What do you think about the future of IKEA?
A. Hopelessness
B. Normal
C. Very high expectations
D. No idea
Q13. Do you think that there is a strong connection between the price and the
quality?
A. Without a connection
B. Normal
C. Strong
D. No idea

36 / 37
Q14. What do you care most?
A. Quality
B. Price
C. Both
Q15. Which way do you think IKEA should use to balance the quality and profit?
A. Price increase, quality increase
B. Price not change and increase the product ability.
C. Price lower and increase the product ability.
D. No idea.
Q16. What is your salary? (Unit: SEK)
A. 1000-4999
B. 5000-9999
C. 10000-19999
D. 20000-40000
E. more than 40000
Thanks for your cooperation