carolyn boroden fibonacci trading –mcgraw hill19 fibonacci price projections low fibonacci price...
TRANSCRIPT
1
Synchronicity Market TimingCarolyn Boroden
Fibonacci Trading –McGraw Hill
2
3
4
5
6
7
Why use this type of Fibonaccianalysis??
It enables you to identify high probability, relatively low risk trade SETUPS where the risk is clearly defined along with the TARGETS.
8
This works on any time frame and essentially any good market data.
I have applied this method to Stocks, ETF’s, Futures and the FOREX markets.
It is an excellent methodology to use with OPTIONS strategies!!
You can see things in the market that you will NEVER see using indicators alone.
9
Fibonacci Numbers
Fibonacci Number Series: 0,1,1,2,3,5,8,13,21,34,55,89,144,233,etc…
The number series will continue to infinity by adding the previous two numbers
10
Fibonacci RATIOSderived from the # series
are used in this analysis
The ratios used are:.382, .50, .618, .786, 1.0, 1.272 & 1.618
(.236, 2.618, 4.236-confirming ratios)
11
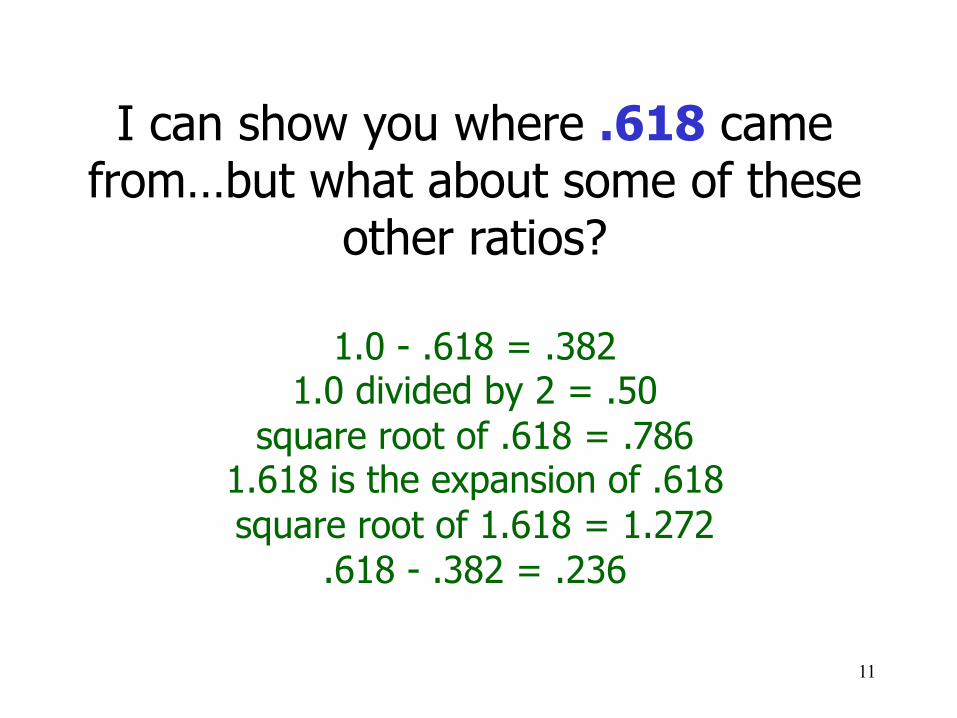
I can show you where .618 came from…but what about some of these
other ratios?
1.0 - .618 = .3821.0 divided by 2 = .50
square root of .618 = .7861.618 is the expansion of .618square root of 1.618 = 1.272
.618 - .382 = .236
12
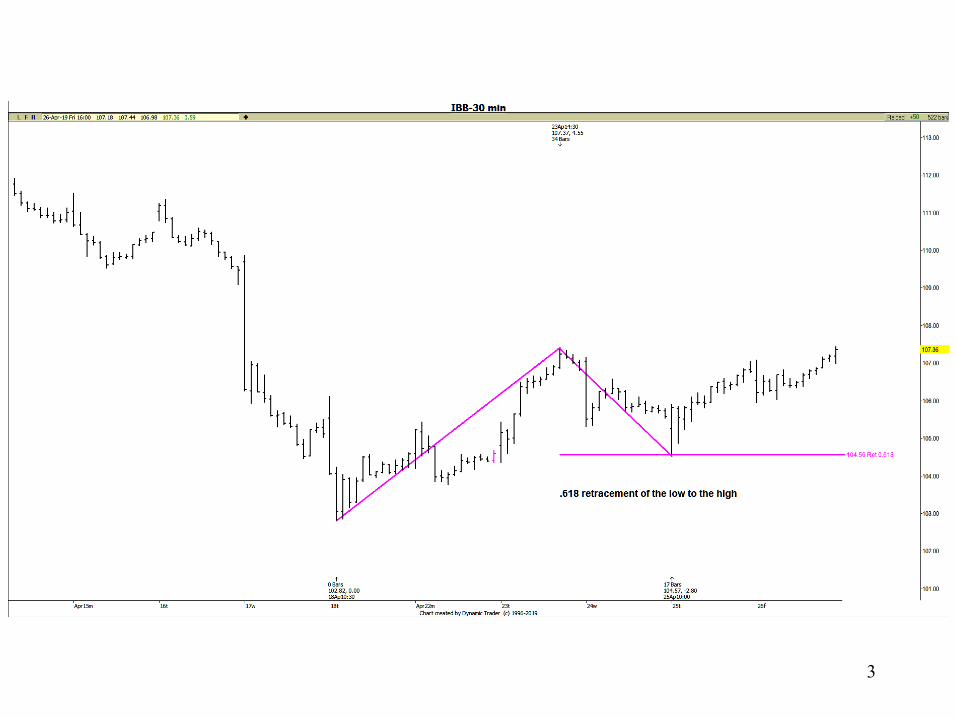
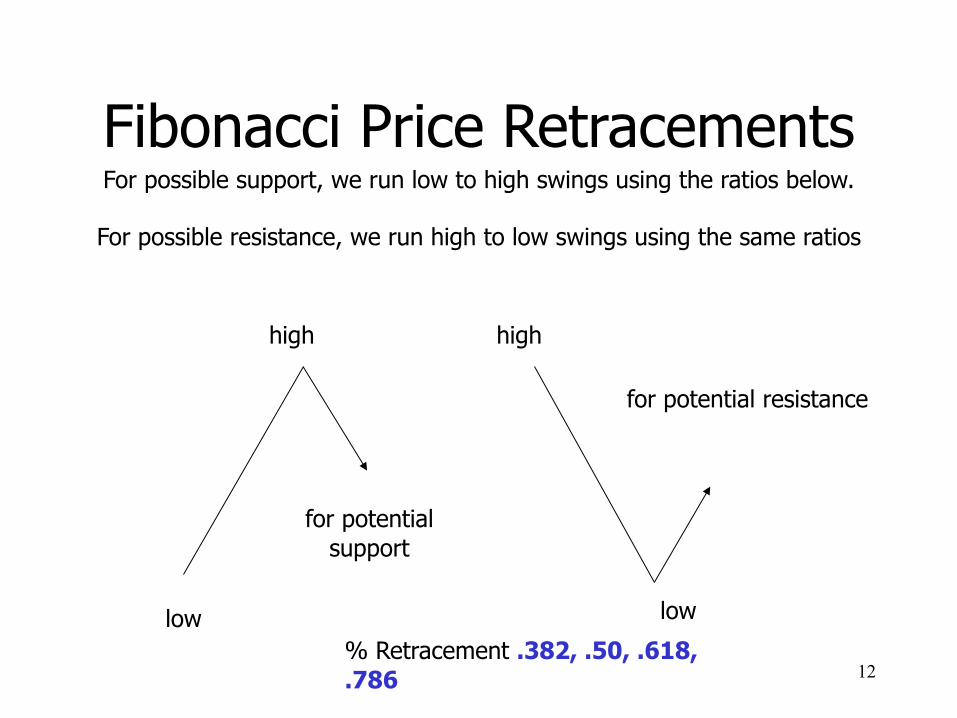
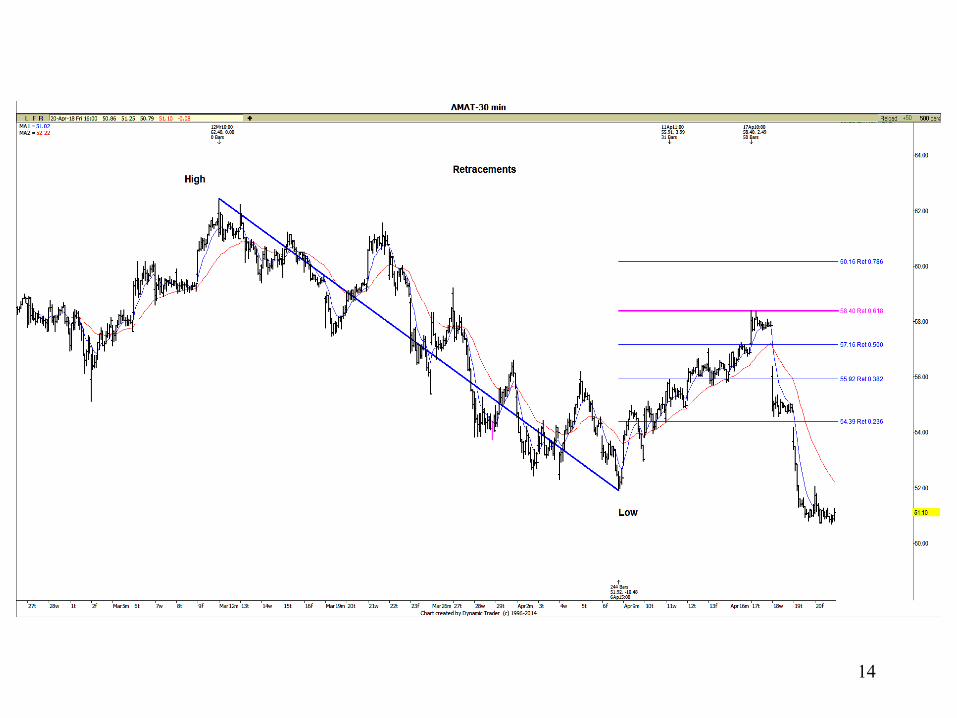
Fibonacci Price RetracementsFor possible support, we run low to high swings using the ratios below.
For possible resistance, we run high to low swings using the same ratios
% Retracement .382, .50, .618, .786
low
high
for potential support
for potential resistance
high
low
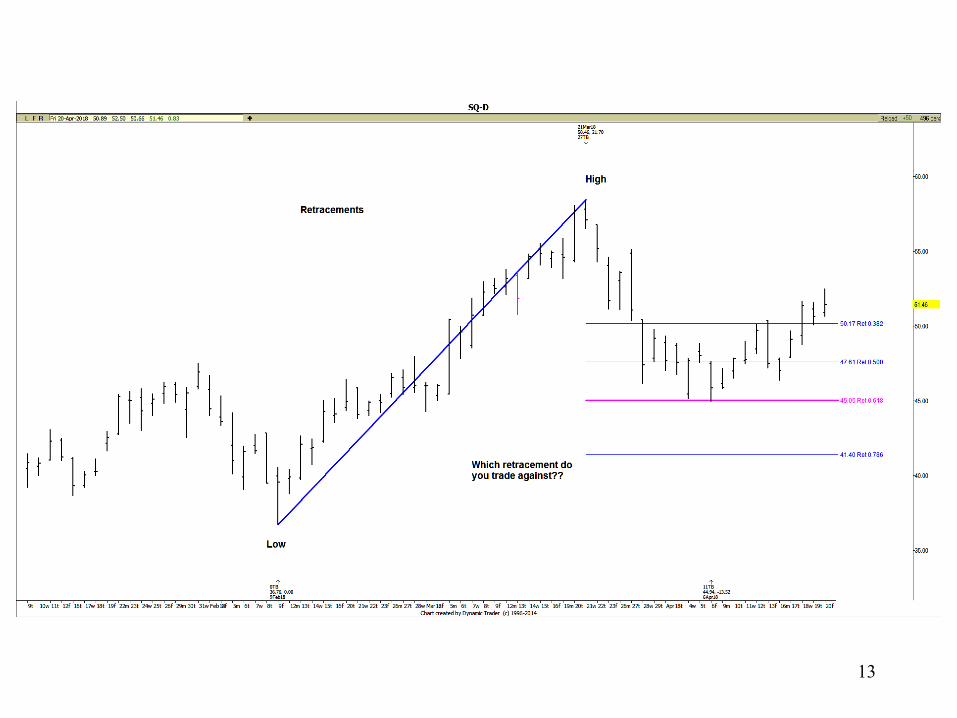
13
14
15
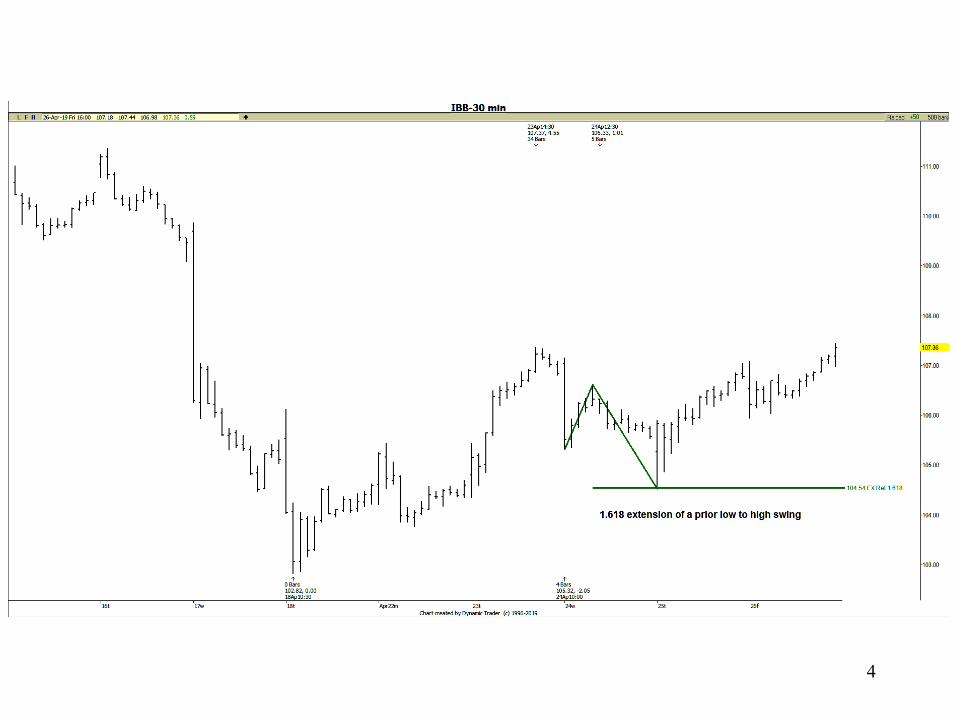
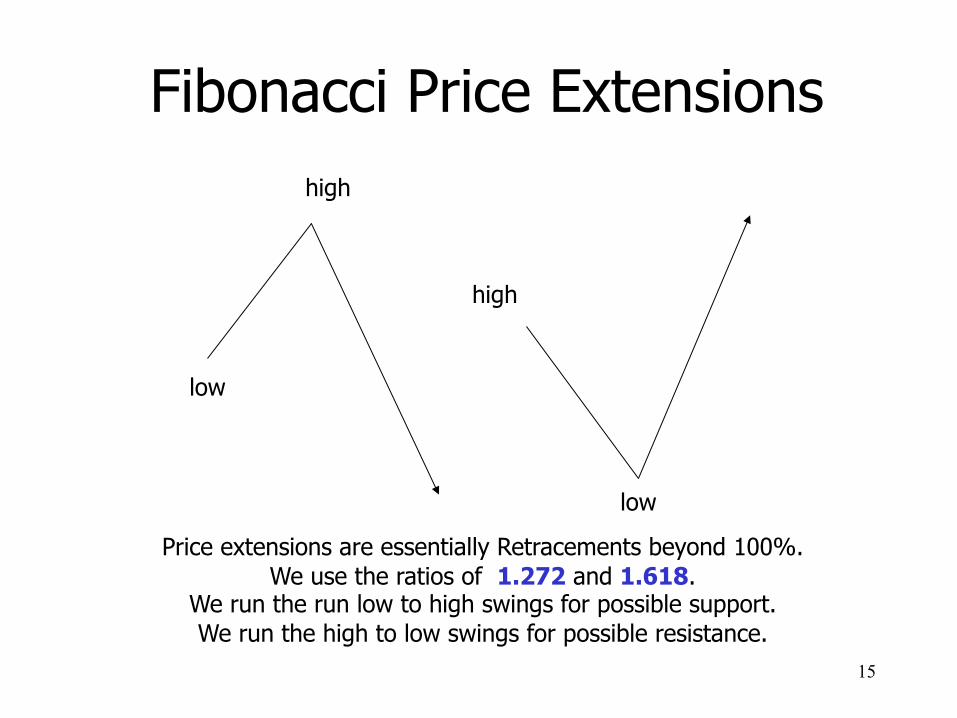
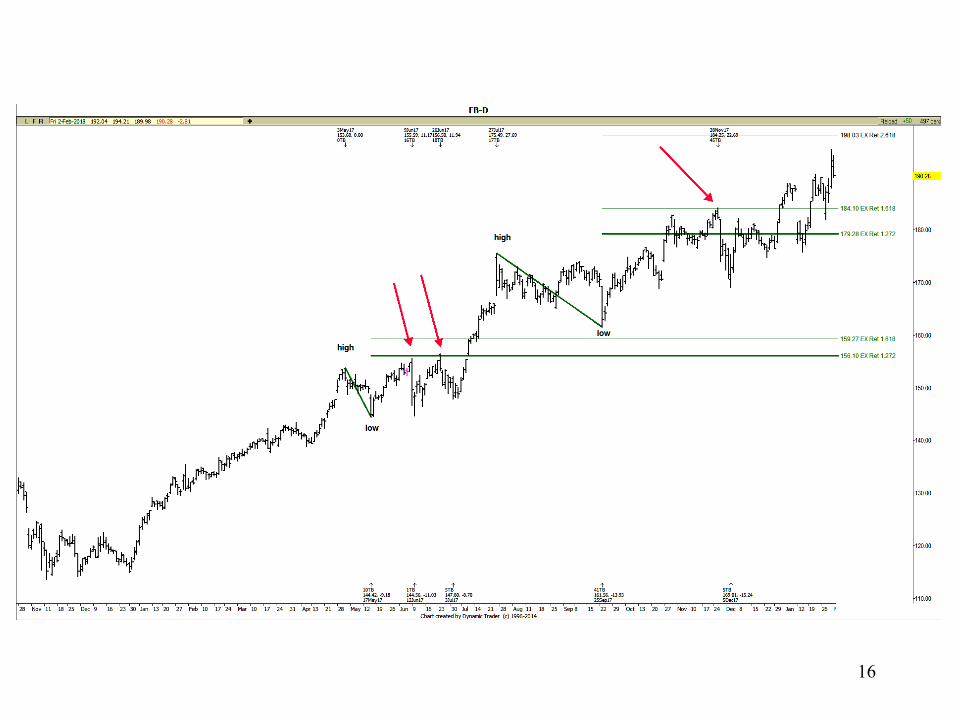
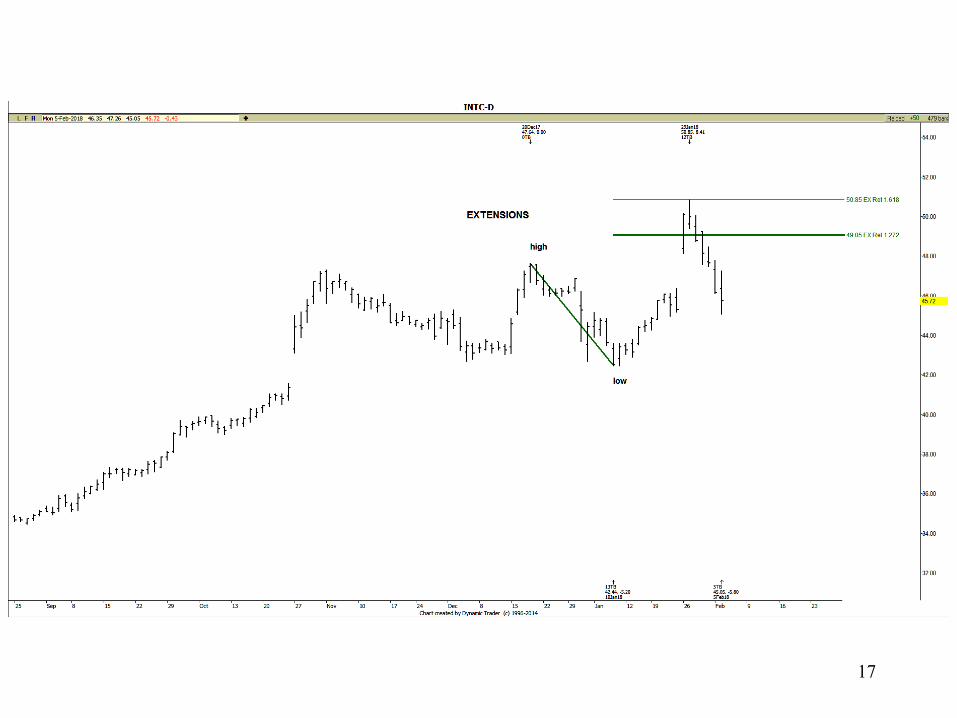
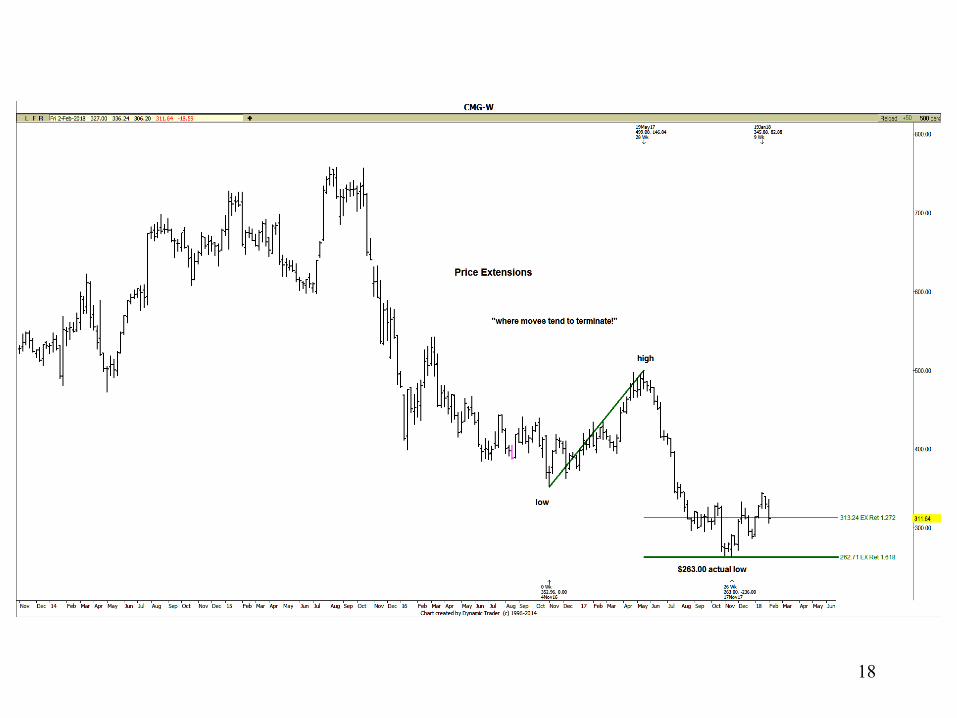
Fibonacci Price Extensions
Price extensions are essentially Retracements beyond 100%. We use the ratios of 1.272 and 1.618.
We run the run low to high swings for possible support.We run the high to low swings for possible resistance.
low
high
high
low
16
17
18
19
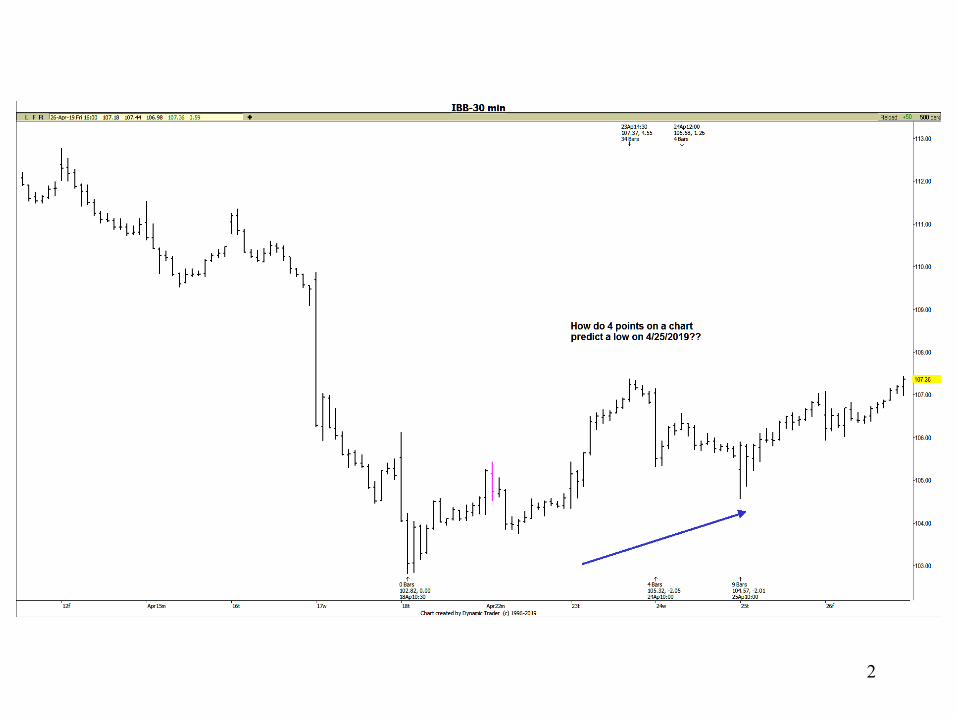
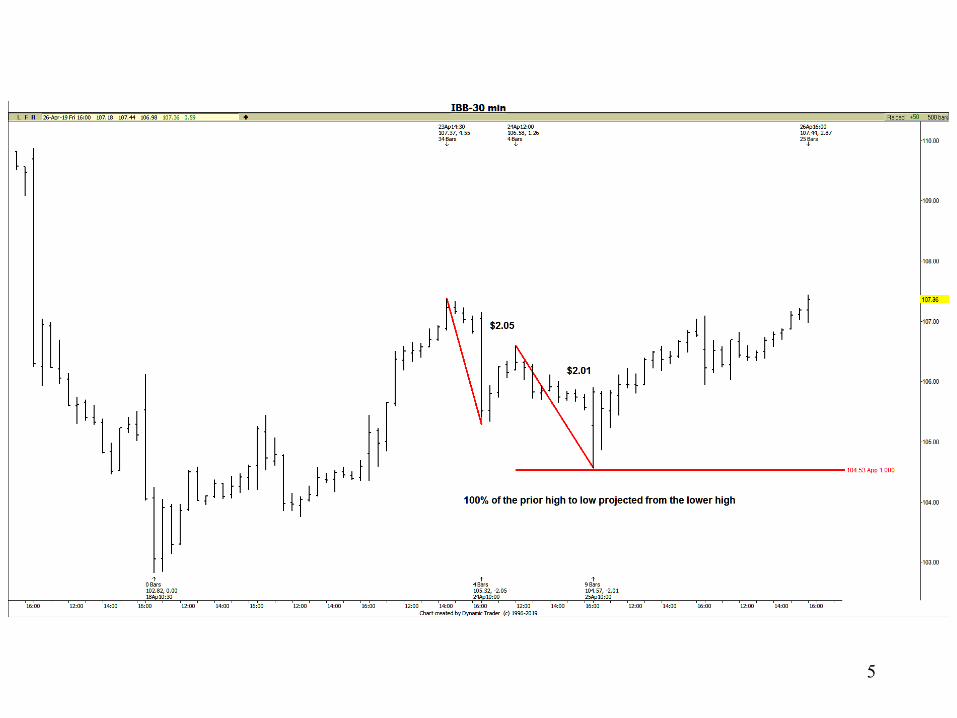
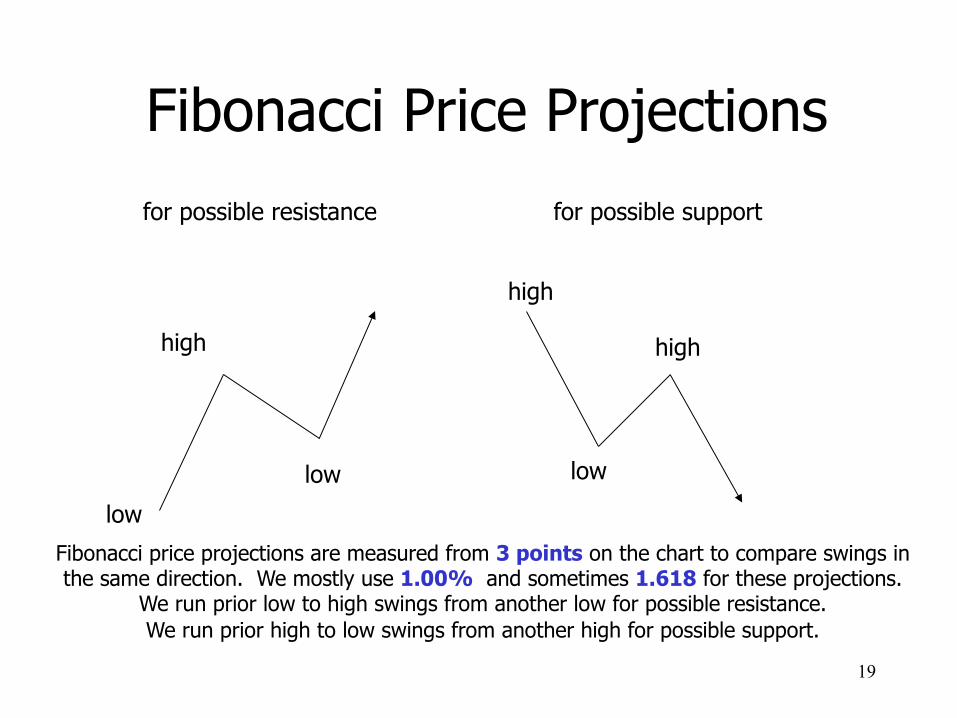
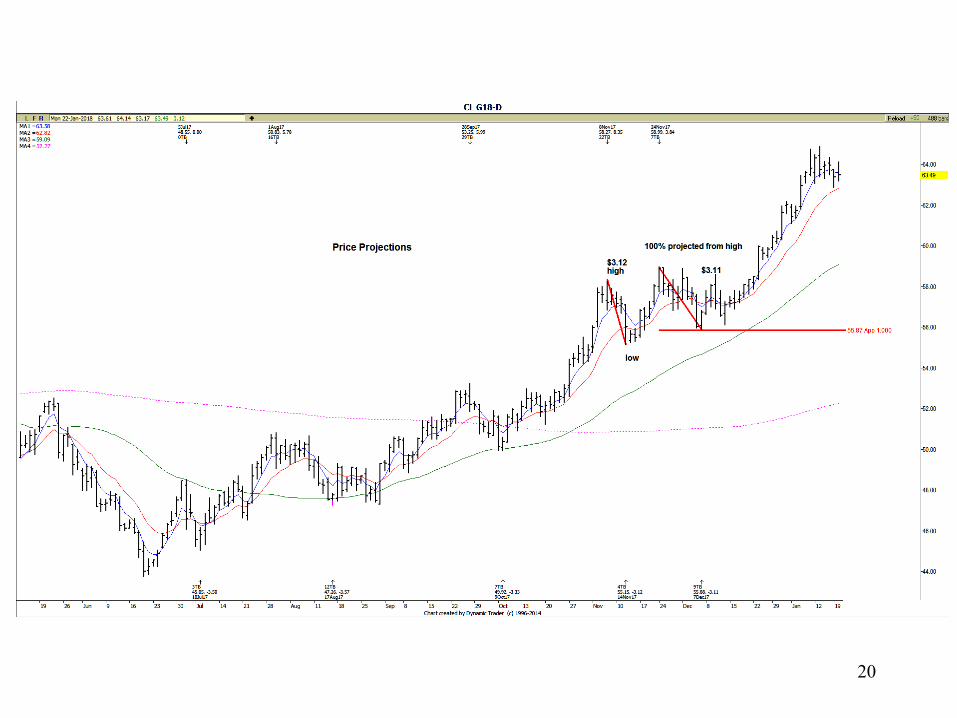
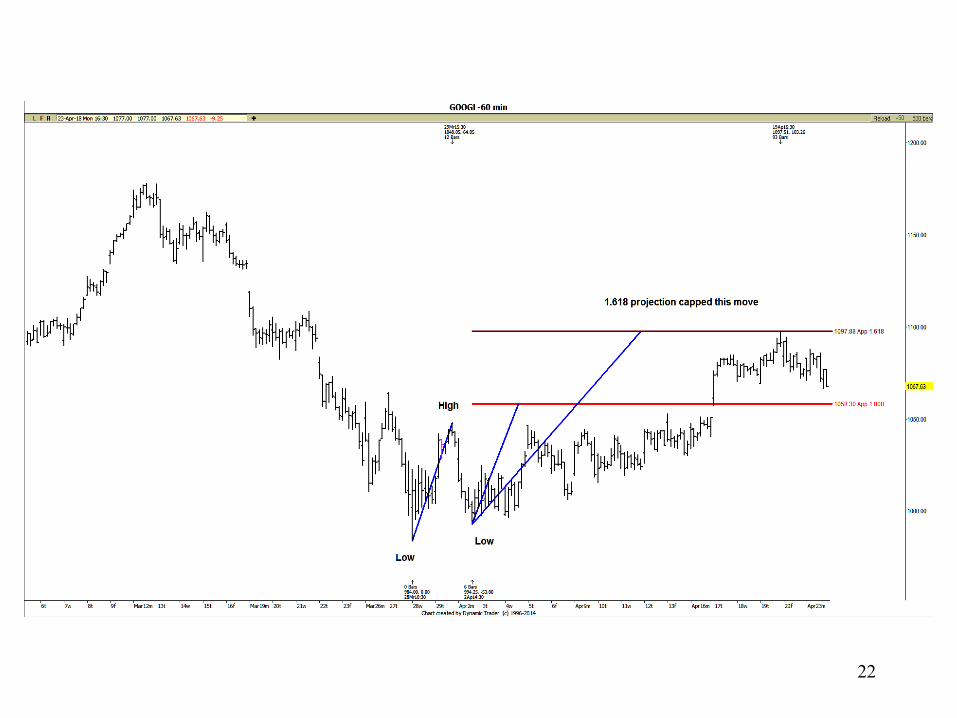
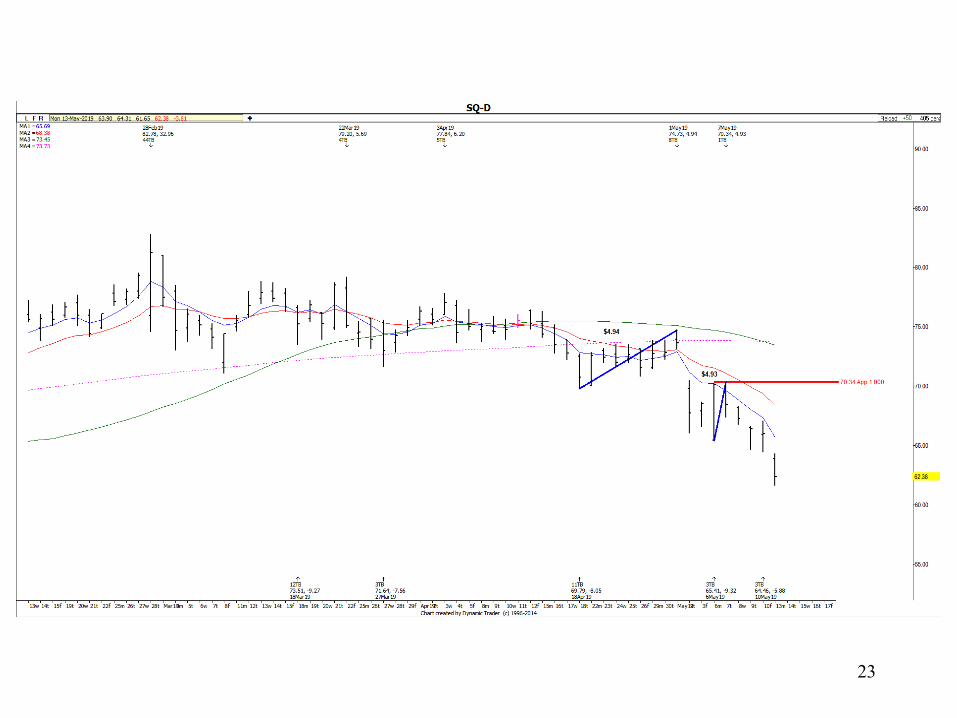
Fibonacci Price Projections
lowFibonacci price projections are measured from 3 points on the chart to compare swings in the same direction. We mostly use 1.00% and sometimes 1.618 for these projections.
We run prior low to high swings from another low for possible resistance.We run prior high to low swings from another high for possible support.
high
low
for possible resistance for possible support
high
low
high
20
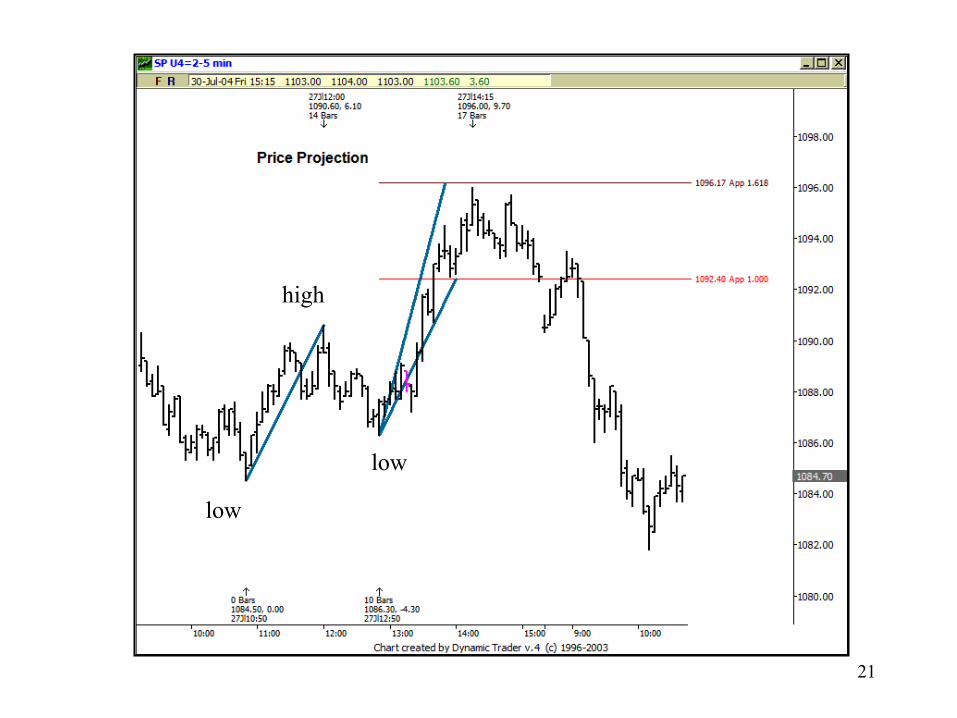
21
low
high
low
22
23
24
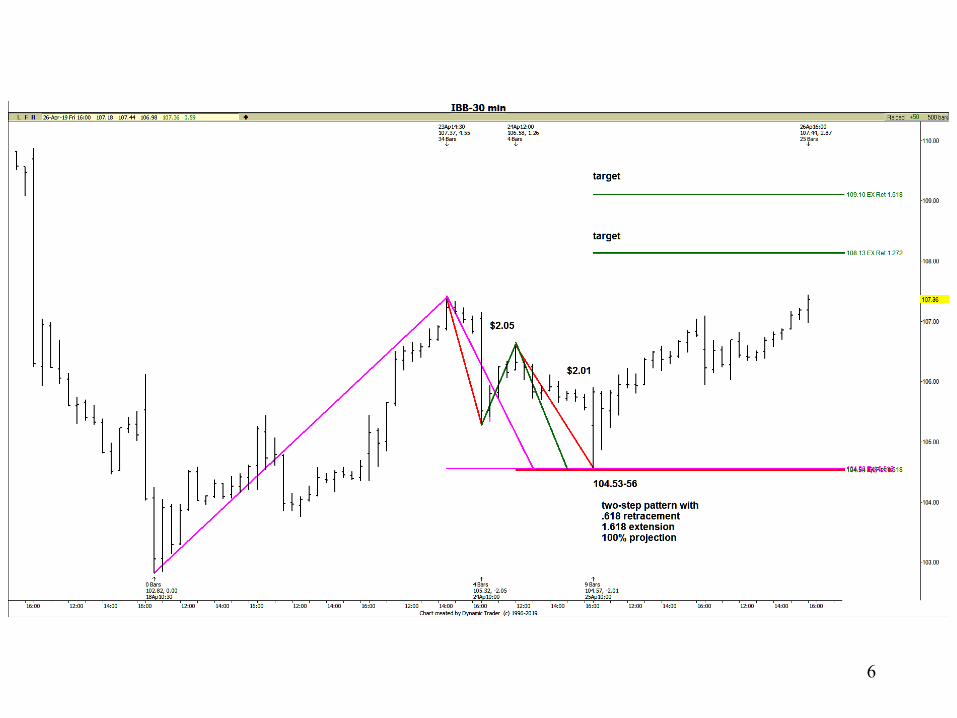
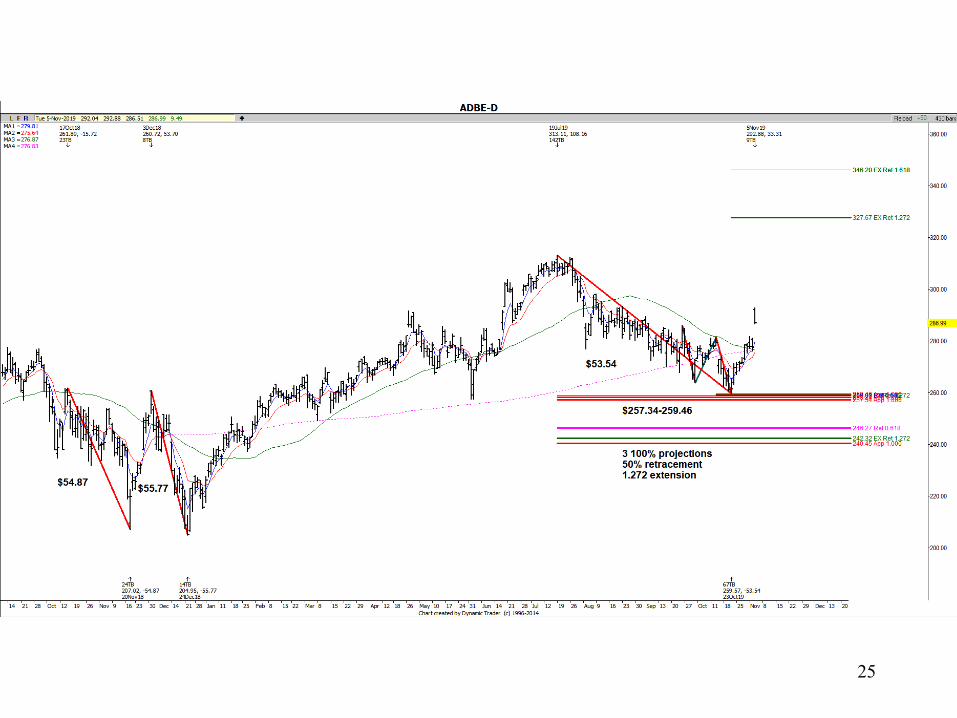
My most powerful trade setup is called a
Fibonacci PRICE Cluster
Definition: the coincidence of at least 3 Fibonacciprice relationships that come together within a
relatively tight range.
25
26
Now how do you trade this??
First we need what I call a TRIGGER to tell us it is worth placing a bet against this
price cluster zone!!
For this we go down to a lower time frame chart!
27
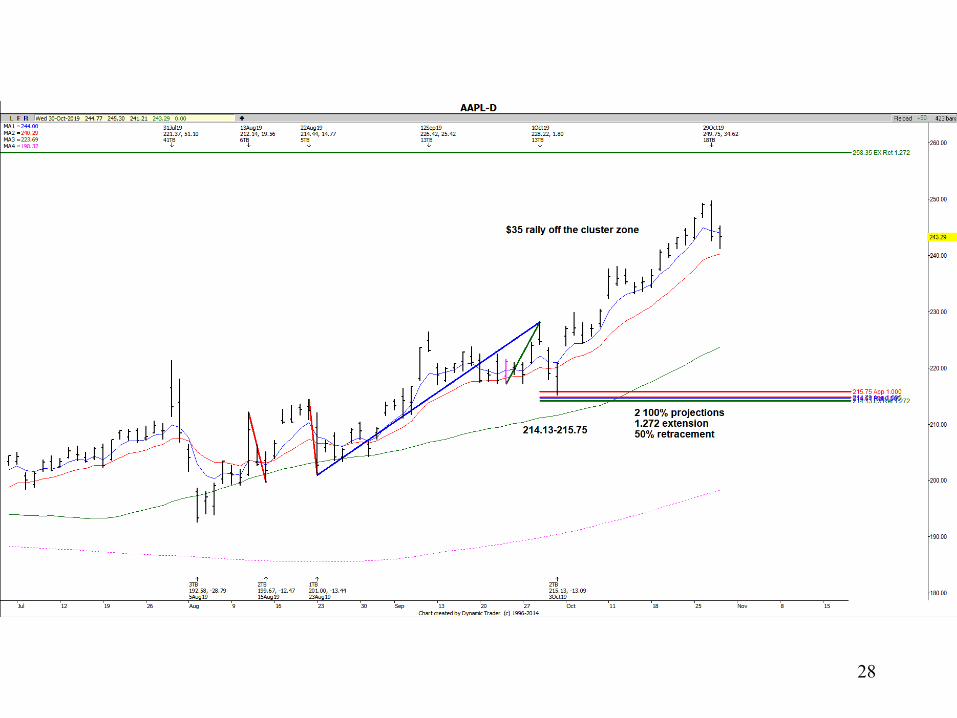
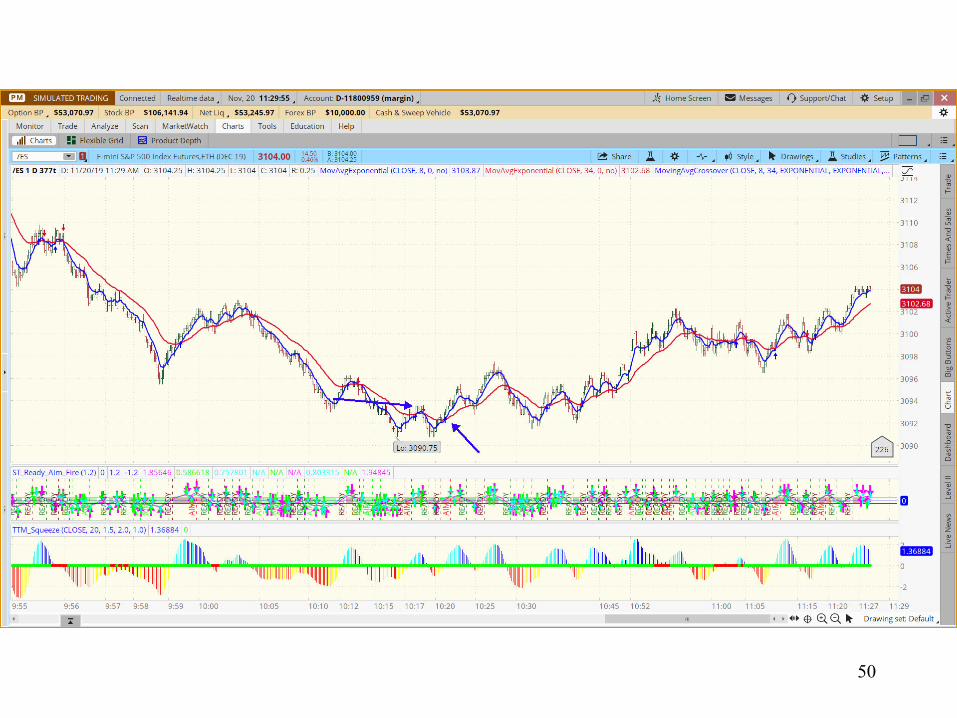
Formula to make money with my setups: Setup + trigger = trade entry then manage (NO trigger = no trade) Identify your setup: price cluster setup (3 or more Fibonacci price relationships) symmetry setup (single symmetry projection or more in the direction of the trend) two-step setup (3 or more Fibonacci price relationships within a two-step pattern formation) If price tests and RESPECTS the setup zone, for A TRIGGER GO TO A LOWER TIME FRAME CHART for an entry as it will signal an entry closer to where your RISK is defined! Swing Trade Setup Time Frames Weekly, Daily, 120 or 30-minute trade setups can be used for swing trades Trigger time frames: 15- minute for aggressive entry (will get stopped out more often) 30- minute for regular entry (won't get stopped as much as the 15-minute chart) Buy Trigger for a Swing Trade Entry: 8 ema crosses above the 34 ema AND a prior swing high is taken out Sell Trigger for a Swing Trade Entry: 8 ema crosses below the 34 ema AND a prior swing low is taken out ***Either take the initial trigger or the next pullback after the trigger*** If you are NOT comfortable with the risk, then don’t take the trade!!!***
28
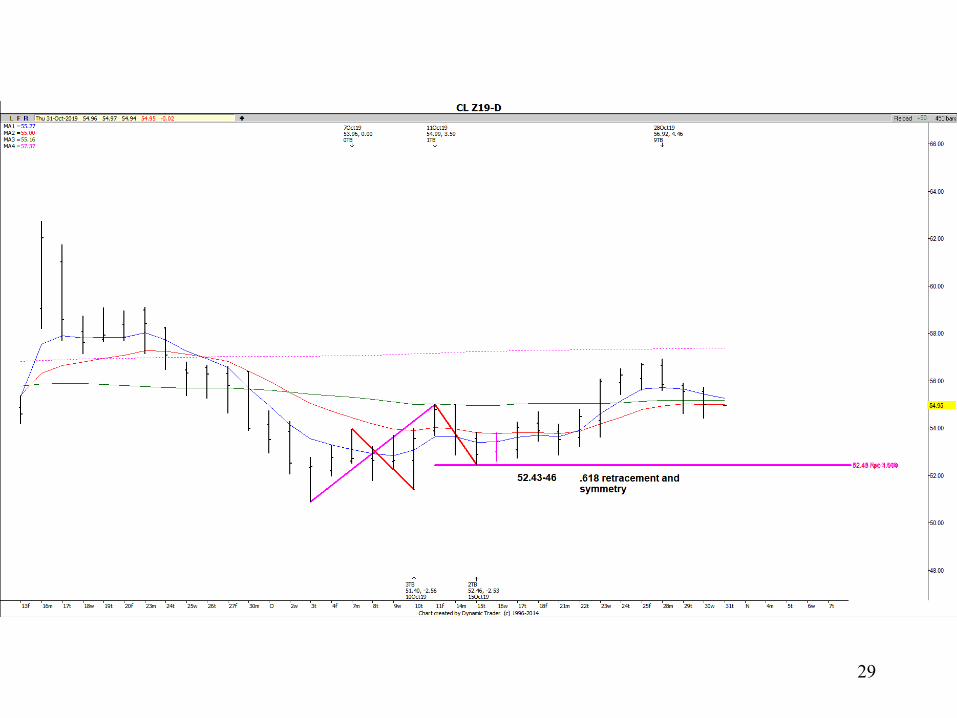
29
30
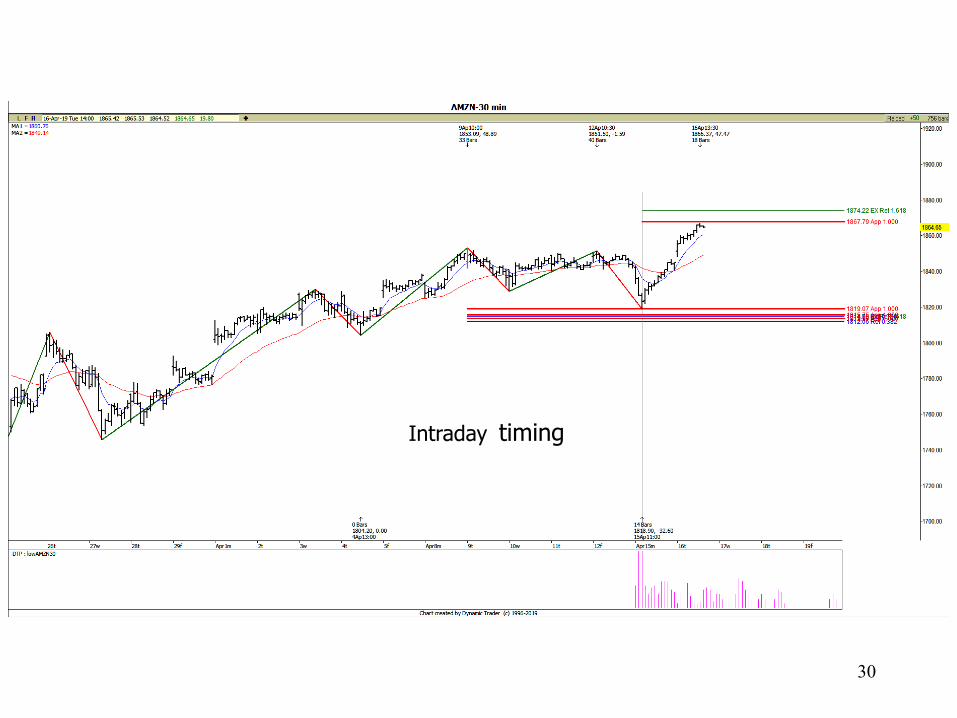
Intraday timing
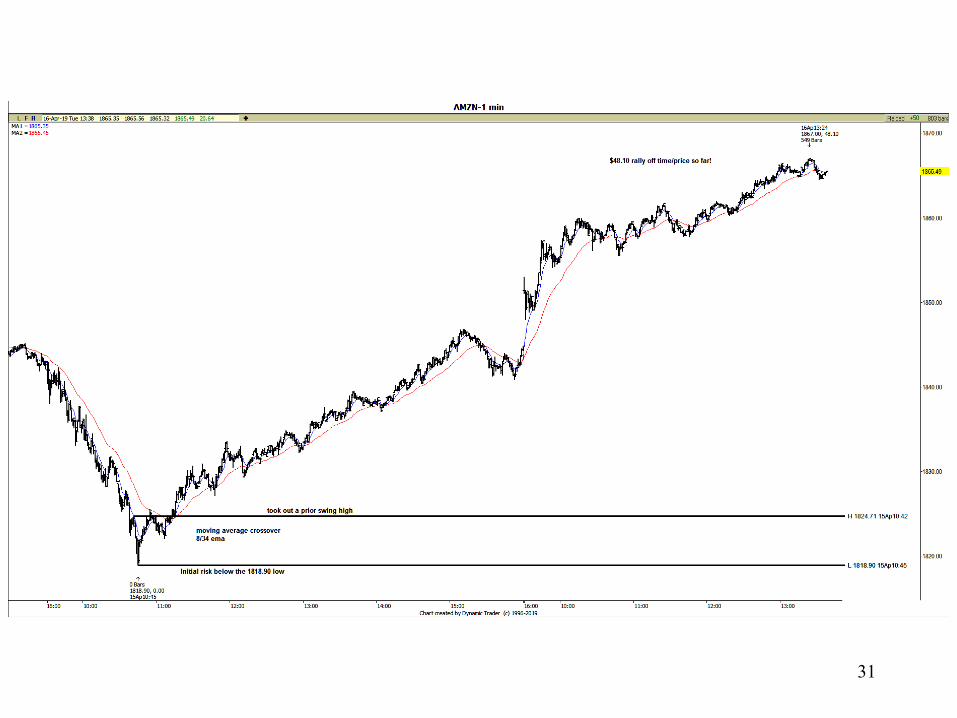
31
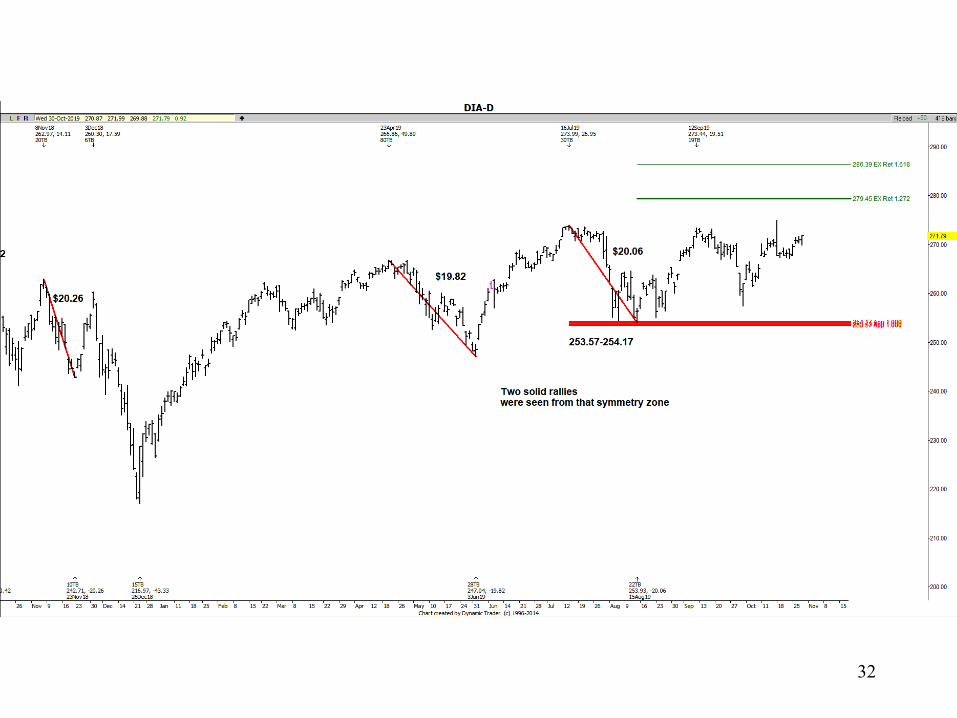
32
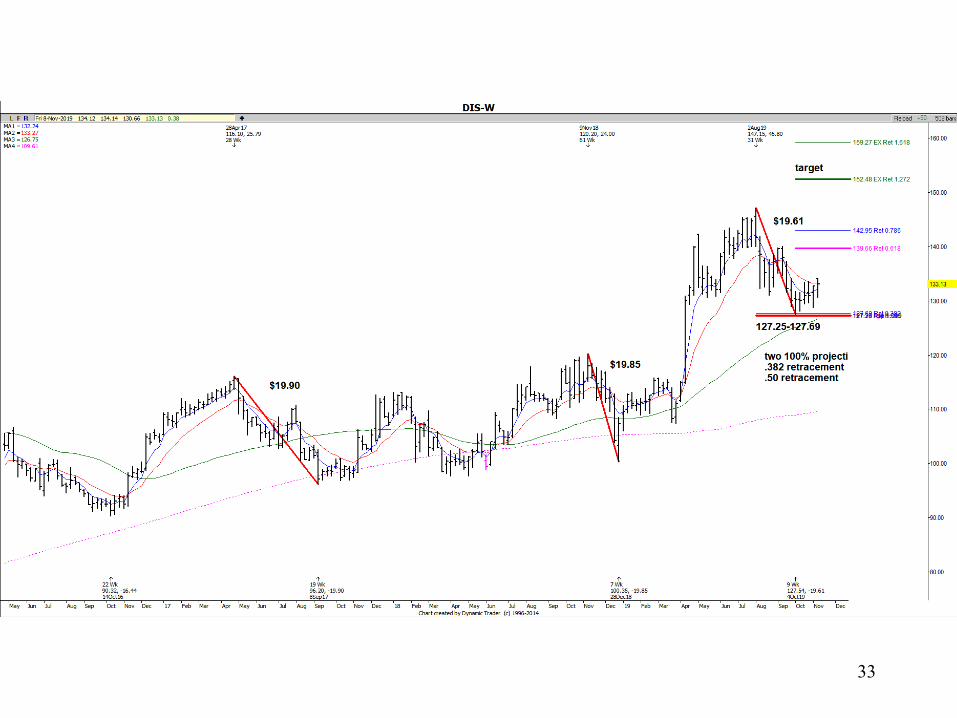
33
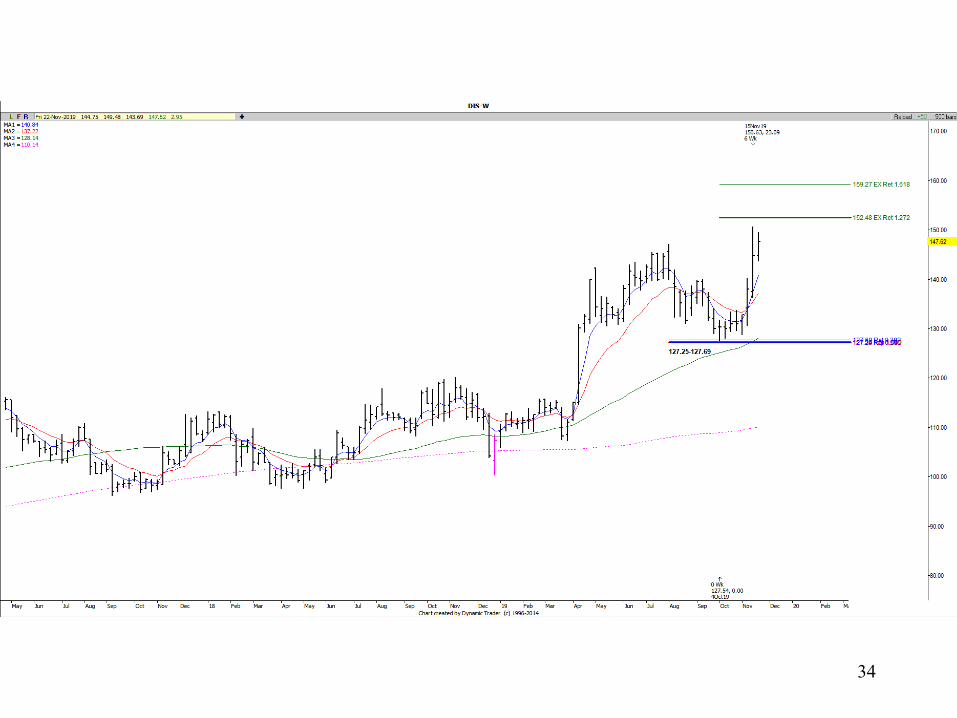
34
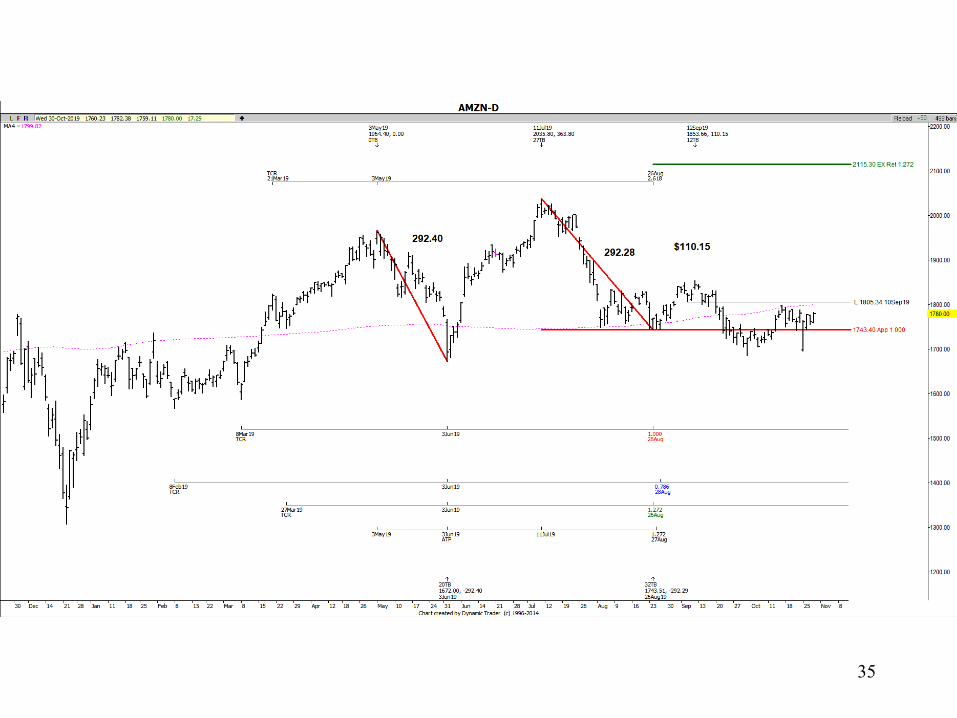
35
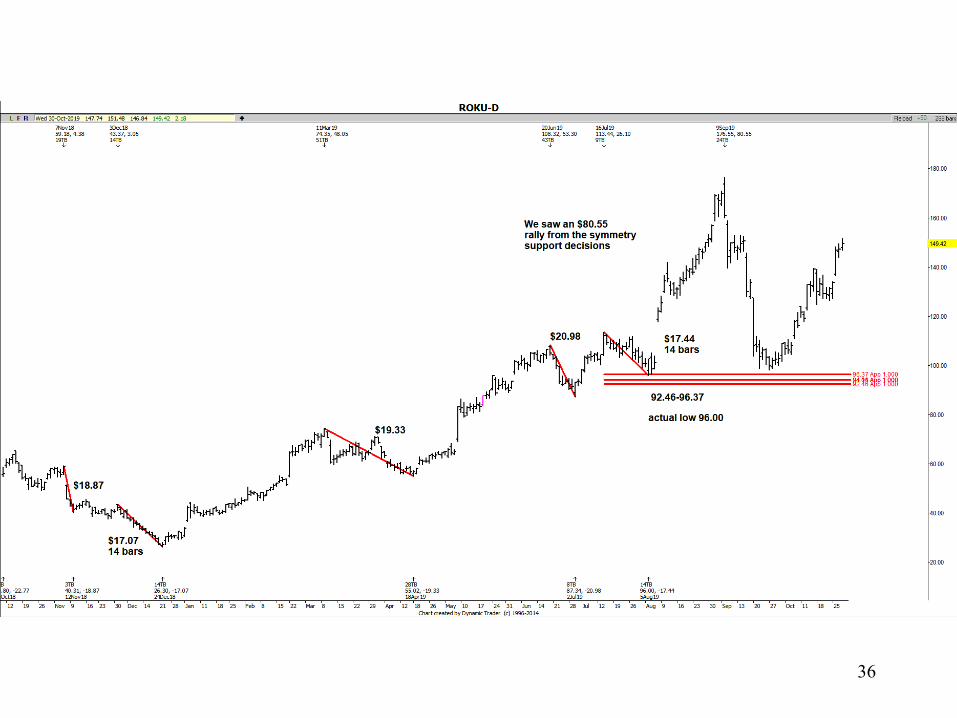
36
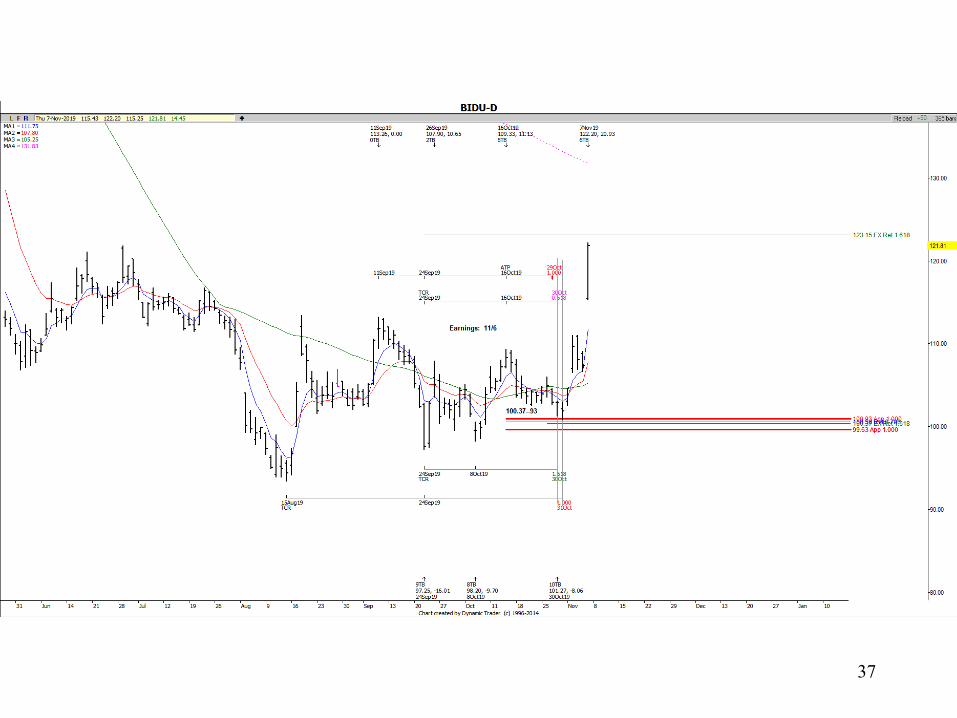
37
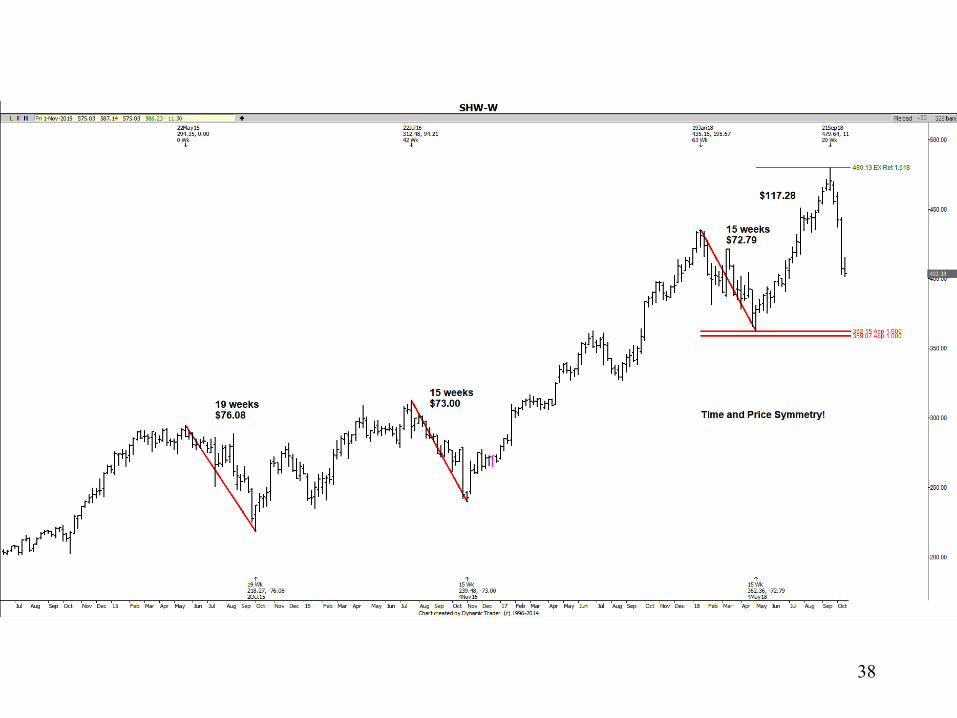
38
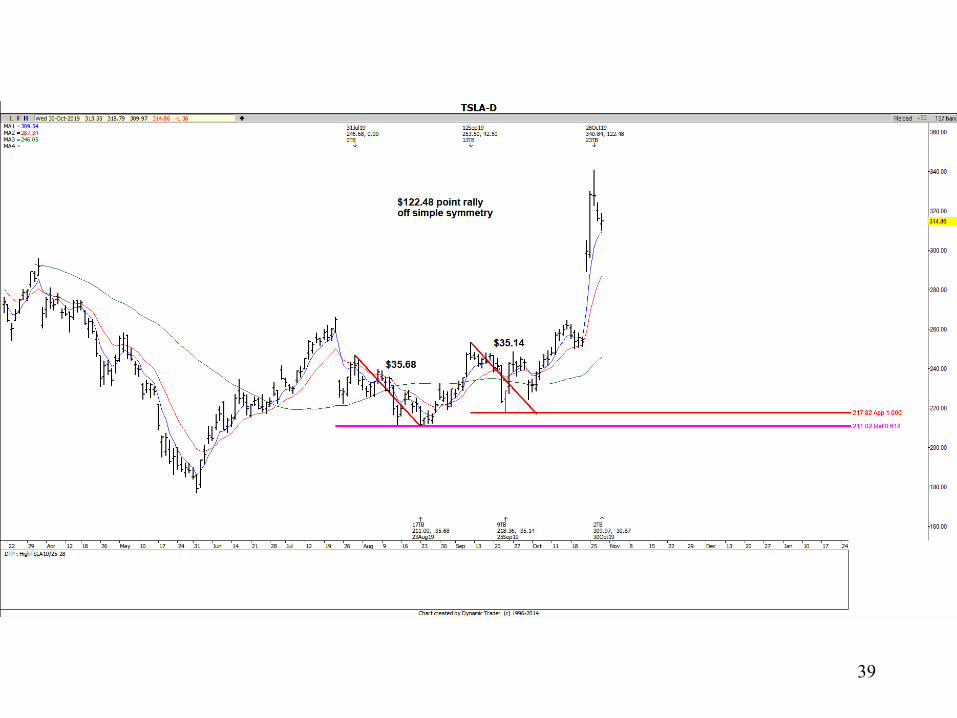
39
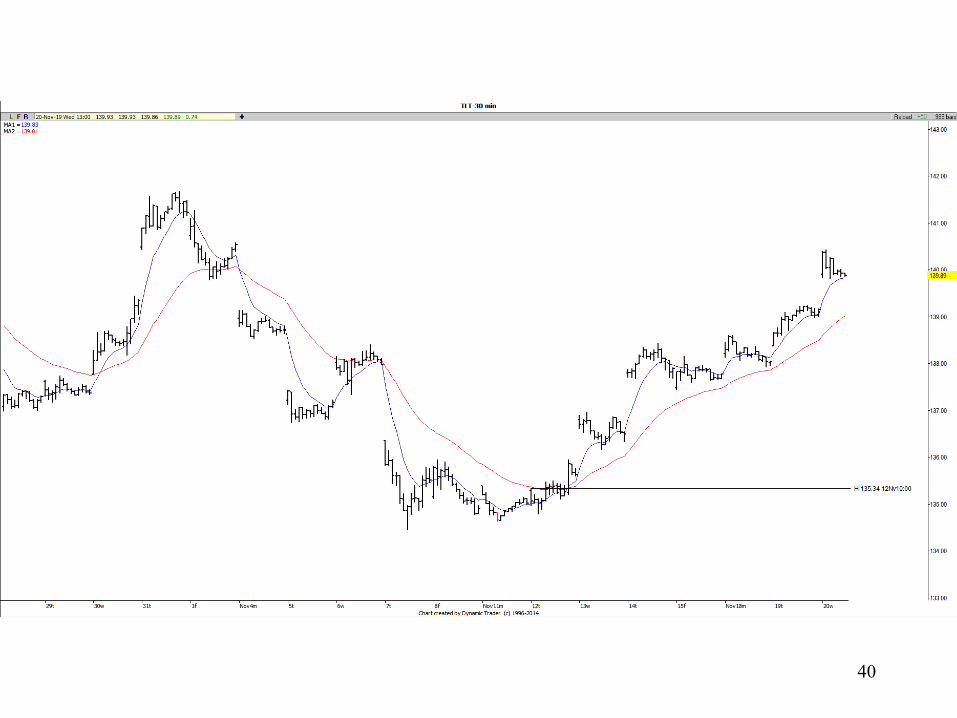
40
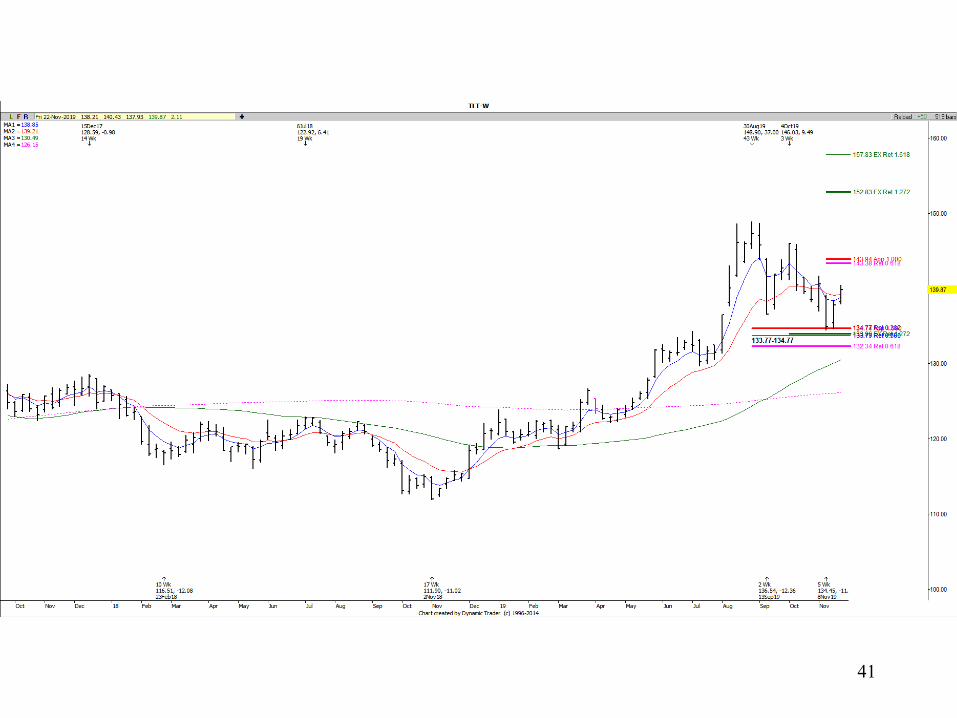
41
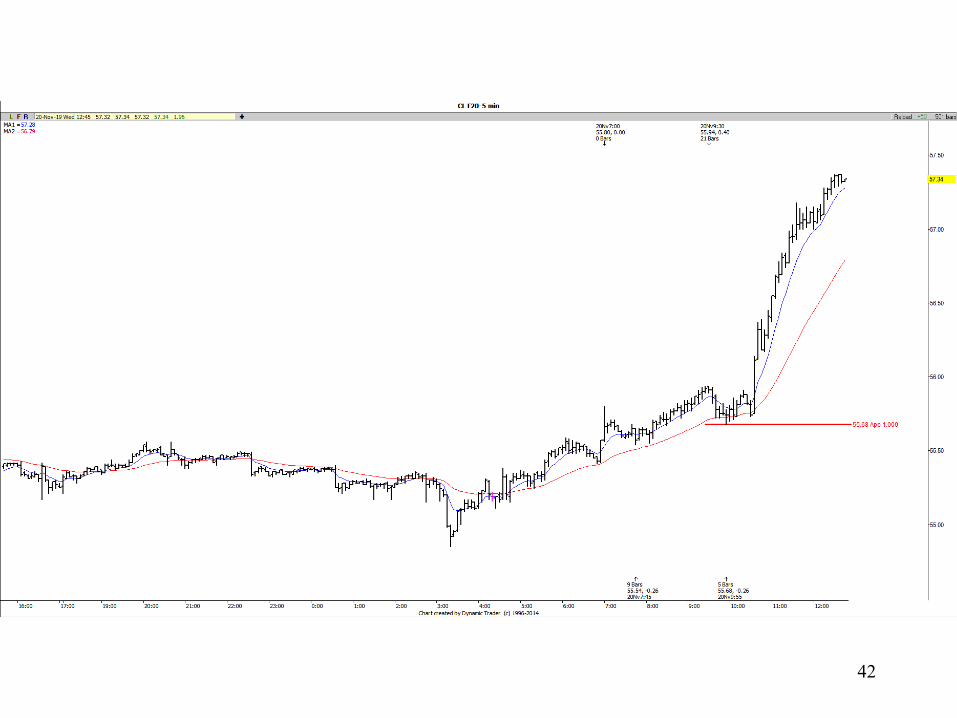
42
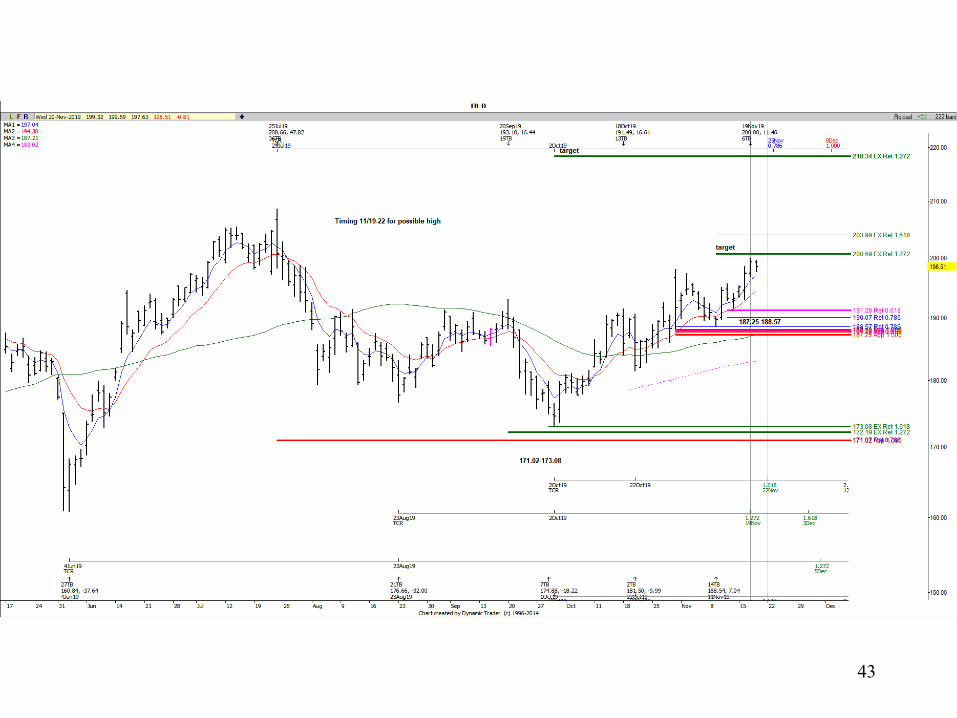
43
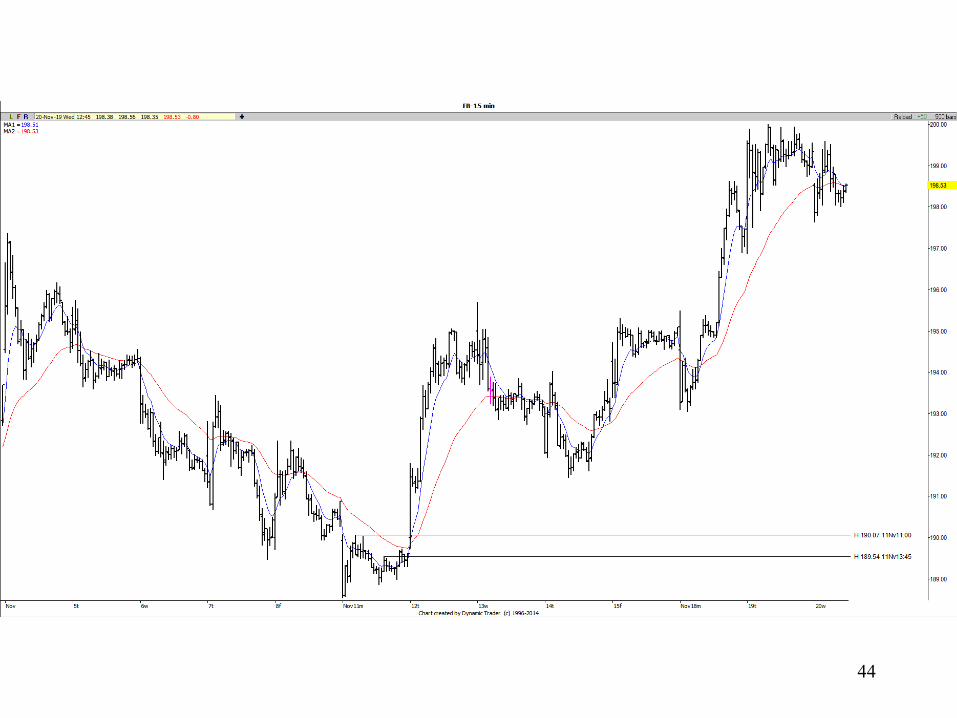
44
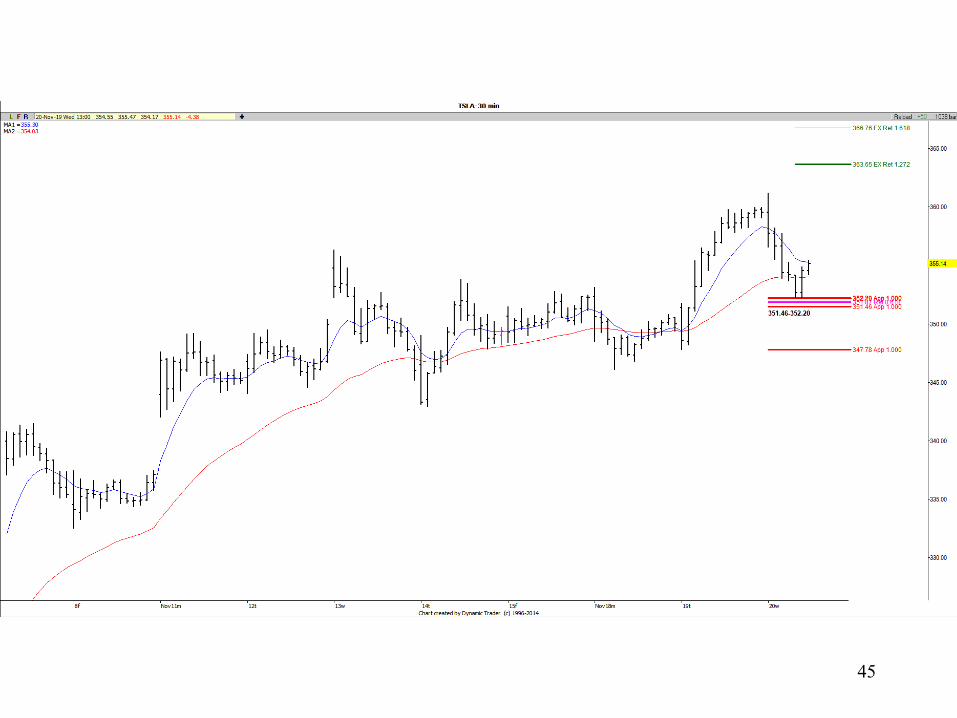
45
46
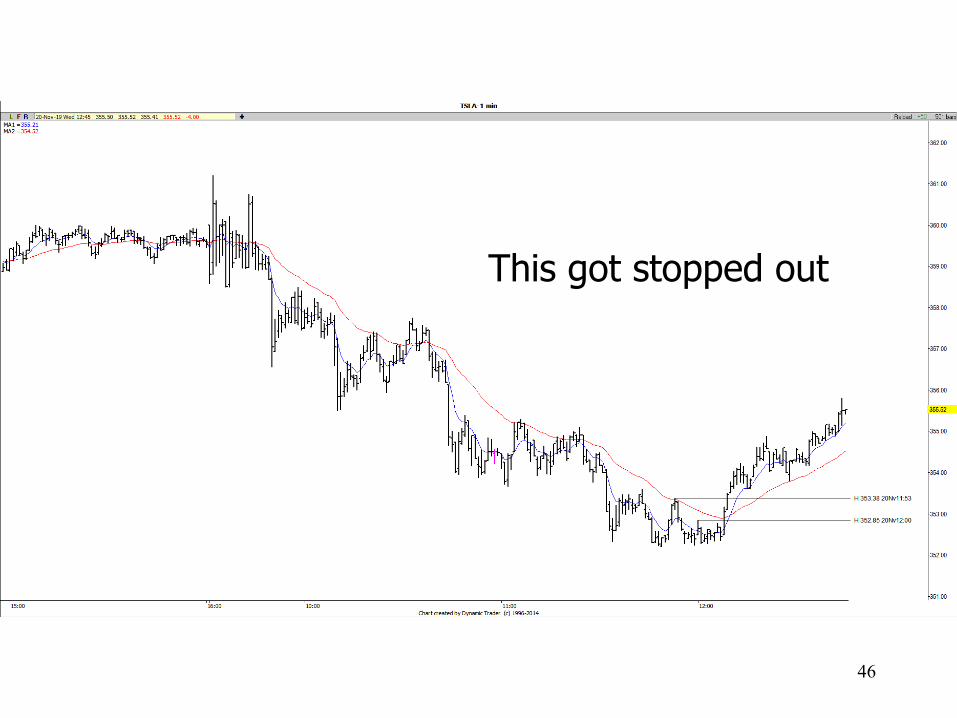
This got stopped out
47

48
49
50