carrefour hy2011 uk hy2011_uk_0.pdfcarrefour planet rollout underway: ... excluding logistic...
TRANSCRIPT

1
New game plan

2
Introduction & Summary – Lars Olofsson• First‐Half Highlights• Midway through the Transformation Plan: Achievements • H1 2011: Lessons Learned• New Game Plan, New Team
Results Review – Pierre Bouchut
New game plan, pursuing our strategic priorities – Lars Olofsson• FRANCE ‘RESET’ – New Commercial Strategy and Action Plan – Noël Prioux• PLANET – Progress Update• ADJUSTING – to new context in Southern Europe• GROWTH MARKETS – Brazil and China Update
Conclusion – Lars Olofsson

3
Introduction & SummaryLars Olofsson
4
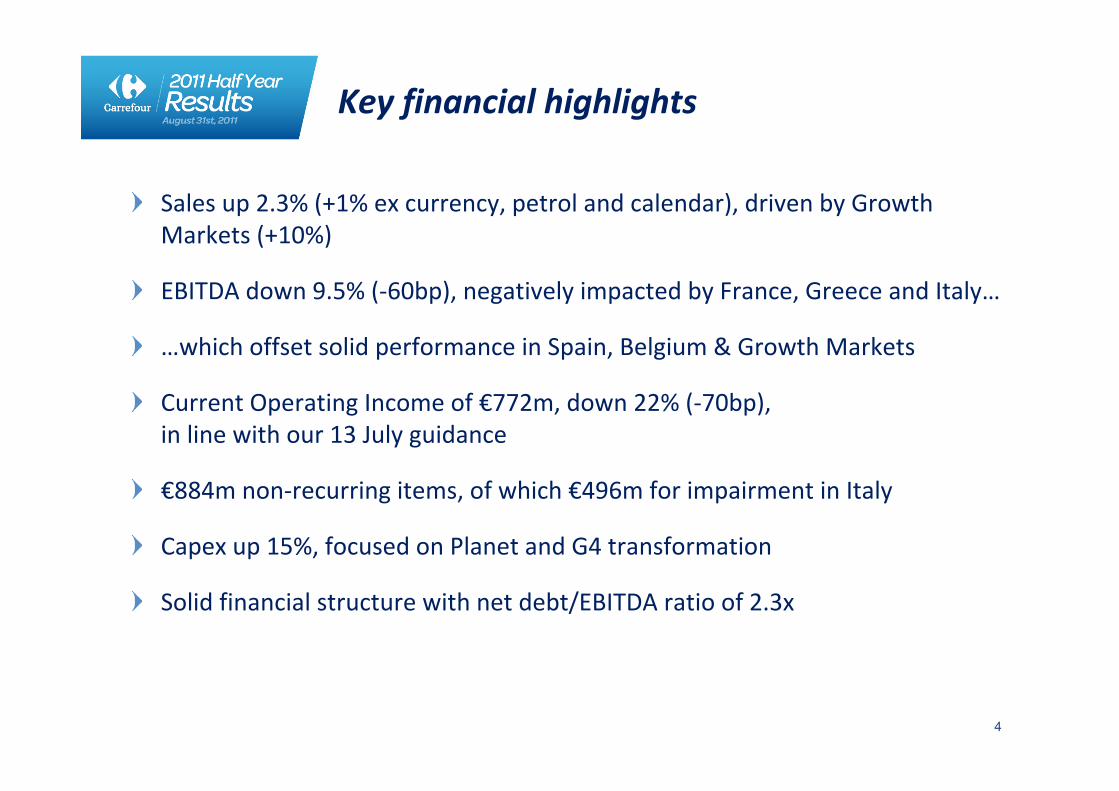
Key financial highlights
Sales up 2.3% (+1% ex currency, petrol and calendar), driven by Growth Markets (+10%)
EBITDA down 9.5% (‐60bp), negatively impacted by France, Greece and Italy…
…which offset solid performance in Spain, Belgium & Growth Markets
Current Operating Income of €772m, down 22% (‐70bp), in line with our 13 July guidance
€884m non‐recurring items, of which €496m for impairment in Italy
Capex up 15%, focused on Planet and G4 transformation
Solid financial structure with net debt/EBITDA ratio of 2.3x

5
Overall environment characterized by major price hikes from suppliers and worsening economic environment in Southern Europe during Q2
Unsatisfactory execution of Group strategy in France
Disappointing performance in Italy and Greece
Resilient performance in Spain
Encouraging recovery in Brazilian hypermarkets
Confirmed turnaround in Belgium, Poland and Taiwan
Carrefour Planet rollout underway: 13 stores across Europe in Q2
Spin‐off of DIA completed
Key business highlights

6
Mid‐way through the Transformation Plan: Achievements
HYPERMARKET REINVENTION: ROLLING OUTPlanet: from 6 pilot stores to the launch of industrial roll out
COST SAVINGS: DELIVERED€1.3bn of cost reductions achieved since launch of Plan
BRAND REVITALIZATION: ON TRACKCarrefour branded offer repositioned and enriched assortment
BEST PRACTICE SHARING: UNDERWAYCompetence centers created to share best practices throughout the group

7
H1 2011: Lessons learned
FRANCE
Too much, too quickly
Unsatisfactory execution of strategy
Intensifying price competition due to commodity price hikes
Over‐focus on market share
● New head for France in place
● Action plan implemented to regain momentum
● New commercial strategy focused on enhanced price competitiveness and sustainable traffic gains

8
H1 2011: Lessons learned
Built‐in rigidities in our processes and complexity of our organization
ORGANIZATION
Duration and depth of downturn in Europe and commodity price hikes severely affecting consumption
ENVIRONMENT •Slower GDP forecast in Europe•Adjusted Capex and further cost savings in Europe
•Timeline on purchasing savings and inventory reduction revised
•Reinforced executive team •Better coordinate plans, processesand people
•Adjust speed of implementation•Enhance predictability through improved internal controls

9
Decisive actions to regain momentum
• New game plan
France “Reset”
Adapting to the new context in Europe
• New Team
• Pursuing strategic priorities Continue delivering on Transformation Plan
Focus on growth levers:Emerging Markets
Planet
Carrefour brand
Step change to meet our Strategic Goal: Sustainable, Profitable Growth
10
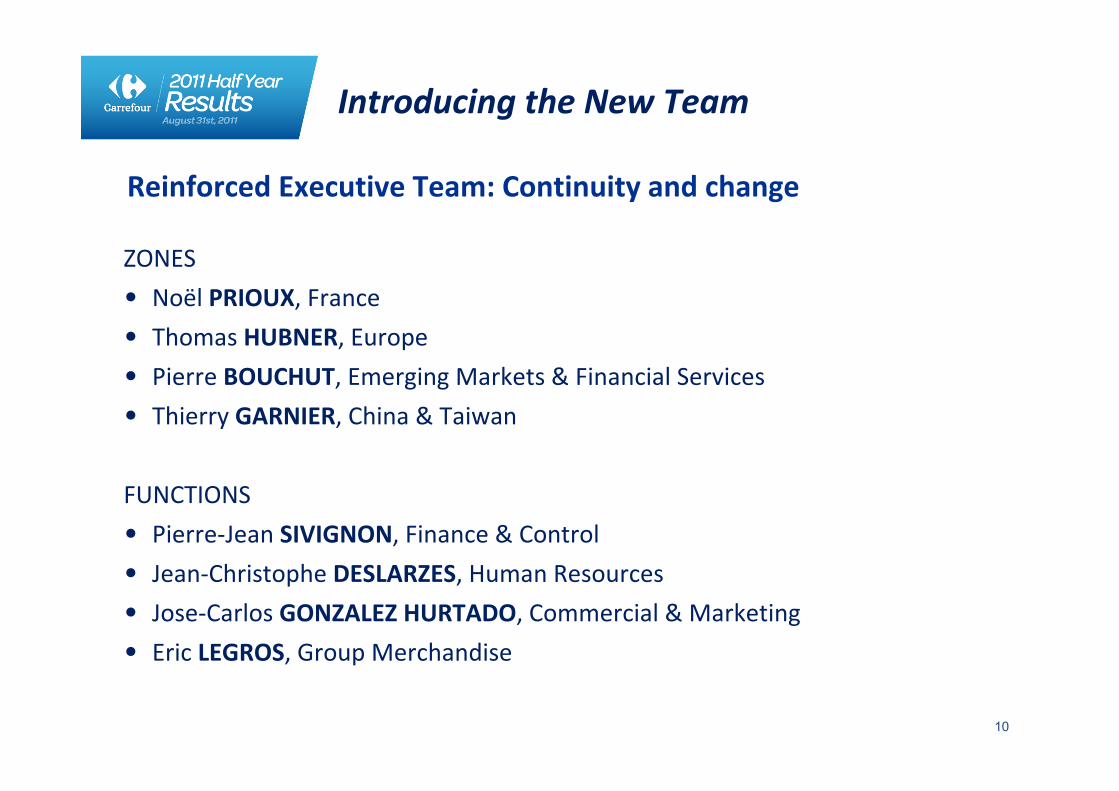
ZONES
• Noël PRIOUX, France
• Thomas HUBNER, Europe
• Pierre BOUCHUT, Emerging Markets & Financial Services
• Thierry GARNIER, China & Taiwan
FUNCTIONS
• Pierre‐Jean SIVIGNON, Finance & Control
• Jean‐Christophe DESLARZES, Human Resources
• Jose‐Carlos GONZALEZ HURTADO, Commercial & Marketing
• Eric LEGROS, Group Merchandise
Reinforced Executive Team: Continuity and change
Introducing the New Team

11
Pierre Bouchut

12
Summarized H1 P&L
(1) Adjusted as per DIA deconsolidation, Thailand deconsolidation and restated as per Brazil(2) Excluding the depreciation of the assets of our integrated supply chain operations (€50m in H1 2011 and €37m in H1 2010)
Net Sales 38,710 39,607 2.3%
H1 2011 Var.H1 2010 (1)
Non‐recurring items (353) (884) 150.1%
Net financial expenses (349) (342) (2.2%)
Income tax (238) (490) 105.8%
Net income, Group share
€m
Interest expenses (270) (258) (4.4%)Other financial expenses (79) (84) 6.3%
97 (249) na
Current operating income 989 772 (22.0%)
Net income from disc. operations 85 680
EBITDA (2) 1,855 1,679 (9.5%)
Operating income 636 (112) (117.5%)
302 153 (49.3%)Net income, Group share, Adjusted for exceptional items

13
Sales growth in a challenging environment
€38,710m
102.3
H1 2010 sales Petrol impactOrganic expansion
& acquisitions (2)
Like for likeEx petrol
Fx Impact H1 2011 salesH1 2011 sales at constant
exchange rates ex petrol
ex calendar impact
(1) Adjusted as per IFRS 5, Thailand and DIA have been retroactively deconsolidated
(2) The variation between the reported 2.7% increase in H1 sales including VAT is mainly explained by an increase in the value added tax in several European countries: Spain, Greece, Poland and Romania. This 0.4% difference has been included in the “Organic expansion & acquisitions” column.
Change in net sales (1) (2)
(in %)
+0.1 +0.9
101.0 +1.1
+0.2
€39,607m

14
Sales growth driven by emerging markets
€m
France
Europe
Latin America
Asia
16,806
H1 2010
11,989
6,463
3,452
38,710
17,073
H1 2011
11,517
7,298
3,719
39,607
1.6%
Evolution
‐3.9%
12.9%
7.7%
2.3%Total
‐0.2%
Evolution at constant exch. rates ex petrol
‐4.6%
11.6%
6.7%
1.0%

15
Decrease in commercial margin in a tougher competitive environment
20 bp decrease in commercial margin as a % of sales ex petrol (‐40bp inc. petrol)
Tough competitive environment in Europe, notably in France
Strong rise in commodity prices
Positive impact of €42m from logistics gains
8,494
8,428
21.4%
21.8%
23.4%
23.6%
Commercialincome
(€m)
Commercialmargin
as a % of sales
Ex petrolCommercial margin
as a % of sales
H1 2010 H1 2011

16
Stable underlying SG&A as a percentage of sales
€m H1 2010 ChangeH1 2011
SG&A (excluding asset costs) (6,149) +3.8%
As a % of sales 15.9%
(6,381)
16.1% +20bp
Asset costs (rents & depreciation) (1,290) +3.9%
As a % of sales 3.3%
(1,341)
3.4% +10bp
As a % of sales 19.2%
SG&A including asset costs (7,439) +3.8%(7,722)
19.5% +30bp
Adjusted for the end of the Loi Fillon benefits and other non‐recurring elements, underlying SG&A costs as a % of sales are stable

17
SG&A (ex. asset costs) up despite significant cost savings
(1) The incidence of foreign exchange differences was neutral on H1 SG&A costs
158
75
169
SG&A ex. asset costsH1 2010
Cost savingsCost inflation (salaries, “LoiFillon”, etc.)
SG&A ex. asset costsH1 2011
Additional operating taxes
Expansion and transformation
Other & Forex (1)
(195)25
Change in SG&A excluding asset costs(€m)
€6,149m
€6,381m

18
Efficiency gains on all fronts
Store operations
Support functions
Other SG&A
Total cost reductions
51
33
86
236
H1 2011
Cost reductions 66Of which
Rest of the World
Of which G4
Operating cost savings
Logistics cost savings
195
42
€m
Total cost reductions 236

19
EBITDA (1)(2)(€m and % of sales)
Net sales(€m)
Current OperatingIncomebefore
Group overhead(€m and % of sales)
CAPEX(€m)
France: unsatisfactory sales and EBITDA performance
Net sales broadly stable ex petrol (+1.6% inc. petrol)
EBITDA down 17.4% reflecting: • A decrease in commercial margin due to rise in supplier tariffs
• Impact of operational issues (out‐of‐stock, textile, fresh food pricing)
• Increase in operating costs in French hypermarkets
Current Operating Income down 37%
CAPEX up 22% mainly focused on IT and start‐up phase of Planet23,000 gross new sqm, 12,000 net sqm
(1) Unallocated headquarter costs of €76 m in H1 2010 and €73m in H1 2011 (2) excluding logistic depreciation of €12m in H1 2010 and €36 m in H1 2011
8815.2%
728 4.3%
16,806
17,073
5473.3%
3442.0%
239
292
‐17.4%
+1.6%
‐37.1%
+22%
H1 2010 H1 2011

20
Europe: EBITDA weighed down by Greece and Italy
5354.5%
4353.8%
11,989
11,517
2432.0%
1681.5%
166
246
‐18.8%
‐3.9%
‐30.7%
+48%
(1) Unallocated headquarter costs of €76m in H1 2010 and €73m in H1 2011 (2) excluding logistic depreciation of €22m in H1 2010 and €11m in H1 2011
Net sales down 4.6% ex petrol at constant exchange rates (‐3.9% including petrol and currency)
EBITDA margin down 70bp reflecting: • decline in sales of €472m • decrease in commercial margin• strong grip on operating costs overall• deteriorating profitability in Greece and Italy
Current Operating Income margin down 50bp
Ex. Greece and Italy, broadly flat EBITDA and Current Operating Income up 6%
CAPEX up 48%, boosted by Carrefour planet rollout145,000 gross new sqm, 46,000 net sqm
EBITDA (1)(2)(€m and % of sales)
Net sales(€m)
Current OperatingIncomebefore
Group overhead(€m and % of sales)
CAPEX(€m)
H1 2010 H1 2011
21
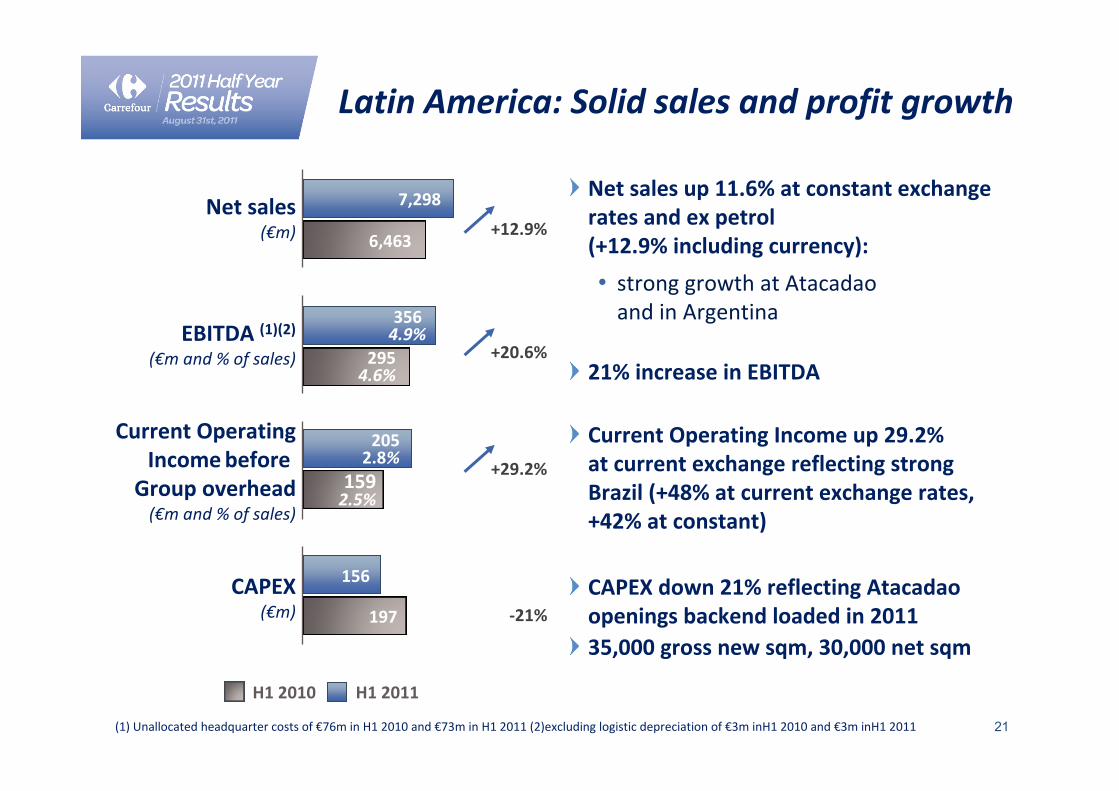
Latin America: Solid sales and profit growth
1592.5%
Net sales up 11.6% at constant exchange rates and ex petrol (+12.9% including currency):
• strong growth at Atacadao and in Argentina
21% increase in EBITDA
Current Operating Income up 29.2% at current exchange reflecting strong Brazil (+48% at current exchange rates, +42% at constant)
CAPEX down 21% reflecting Atacadao openings backend loaded in 201135,000 gross new sqm, 30,000 net sqm
2954.6%
356 4.9%
6,463
7,298
2052.8%
156
(1) Unallocated headquarter costs of €76m in H1 2010 and €73m in H1 2011 (2)excluding logistic depreciation of €3m inH1 2010 and €3m inH1 2011
197
+20.6%
+12.9%
‐21%
+29.2%
EBITDA (1)(2)(€m and % of sales)
Net sales(€m)
Current OperatingIncomebefore
Group overhead(€m and % of sales)
CAPEX(€m)
H1 2010 H1 2011

22
Asia: Rise in sales and EBITDA
2206.4%
2336.3%
3,452
3,719
1183.4%
1283.4%
56
67
(1) Unallocated headquarter costs of €76m in H1 2010 and €73m in H1 2011
+6.2%
+7.7%
+8.7%
+19%
Net sales up 6.7% ex petrol and at constant exchange rates(+7.7% including petrol and currency)
EBITDA up 6.2% reflecting:
• Resilient performance in China with an increase of 2.7% at current exch. rates
• Confirmed turnaround in Taiwan
CAPEX up 19%35,000 gross new sqm; 3,000 net sqm
EBITDA (1)(€m and % of sales)
Net sales(€m)
Current OperatingIncomebefore
Group overhead(€m and % of sales)
CAPEX(€m)
H1 2010 H1 2011

23
Transformation Plan: cost reduction on track
1,065
570485
860
1,135
2009 – 2012 targets and achievements for operating cost savings, ex DIA (€m)
1,300
1,870
Targeted Achieved
2009 2010 H1 2011 2012
On track on operating cost savings:• €236m achieved in H1 2011
• Target of €480m for 2011
Main cost reduction drivers• Logistics savings
• Contract renegotiation with third parties
• Energy, recycling and other SG&A reduction

24
Transformation Plan: on track on cumulative purchasing gains despite lost momentum in H1
No further purchasing savings booked in H1 2011 in a context of:
• Tough negotiations
• Tough price competition
• Strong rises in commodity prices335
4040
250
356
335
850
2009 – 2012 targets and achievements for purchasing gains, ex DIA (€m)
Targeted Achieved
2009 2010 H1 2011 2012

25
Personal Financial Services: Continued solid growth of all KPIs
Savings accounts (€m)
Consumer Credit Outstanding (€m) Insurance premiums (€m)
+2.8%5,708
5,551 +4.0%133
128
Number of cards (millions)
+2.5%1,824
1,779+3.7%
14.2
13.7
Launch of “Carrefour Banque” brand in H1
Brazil: New partnership agreement with Itau Unibanco
H1 2010 H1 2011

26
Europe (mainly Spain & Belgium)
Rest of the World (mainly Brazil, Colombia
and Argentina)France
Geographical breakdown (%)
Other contribution
InsuranceBanking
Breakdown of Personal Finance Services contribution (%)
18%
5%77%
30%
37%
33%
(1) Before unallocated headquarter costs and including financial services commissions, warrantee revenues and cost saving generated by the reduction in fees as compared to competing payment cards
Personal Financial Services: +15.5% in Current Operating Income (1)
Current Operating Income (1) (€m)Net Banking income evolution (€m)
H1 2010 H1 2011
532
473 +12.5%
181
157 +15.5%

27 (1) Current Operating Income pre‐group overhead
Net rents ‐ Total
Of which Carrefour tenants
Of which external tenants
EBITDA
Current Operating Income (1)
France, Spain, Italy, and HO (€m)
Carrefour Property: Downward adjustment in rents to be in line with market practice
‐5.7%
‐4.9%
‐5.7%
5.9%
‐3.4%
Var.
160
362
336
25
337
H1 2010
151
H1 2011
344
317
27
325

28
€884m non‐recurring charges
Restructuring OtherNet capital gains / losses
Transformation (3)
(1) Impairment: mainly linked to Italy(2) Allowances for tax litigation in France, Brazil and equity tax in Colombia(3) Transformation: mainly linked to the implementation of our cost cutting measures
(516)
16
Impairment (1)
(39)
(244)
Operating tax expense (2)
(22)
(79)
Total
(884)

29
Slight improvement in inventory turn
H1 2011 inventories up €48mvs. H1 2010 (€m)
Improvement in inventory turn(days of COGS down 0.7)
H1 2010 H1 2011H1 2010 H1 2011
6,494
6,447 37.037.7

30
17%
32%
51%
19%
42%
39%
CAPEX up with focus on Planet and remodelling
New space
Remodelling /Maintenance
France
Europe
Latin America
Asia
659 761
9% 9%
25%
36%
30%20%
32%
38%
H1 2011 CAPEX (€m) up 15% vs. H1 2010
More CAPEX allocated to Carrefour Planet in Europe and IT in France
H1 2010 H1 2011
659 761
IT
H1 2010 H1 2011

31
Net debt reduced by €770m
(1) Restated in accordance with IAS 8 for Brazil
Opening net debt (11,424)
Gross Cash flow 3,405
Change in WCR and others (363)
Expansion capex (629)
Free cash flow 1,108
Acquisitions (178)
Disposals 222
Thailand cash‐in 808
Dividends & Treasury shares (2) (895)
Net debt at close (10,654)
Consumer credit impact (98)
(2) Including €778m share buy‐back
(€m) 12 months to June 2011 (1)
Remodelling and maintenance capex (1,306)
Operating Free cash flow 1,736
Others (197)

32
Key cash flow figures proforma ex‐DIA
Reported Proforma ex‐DIA12 months to June 2011 (€m)
Operating free cash flow 1,736 1,573
Gross cash Flow 3,405 2,974
Free cash flow 1,108 944
Net debt at close 10,654 9,798

33
Sound financial structure
EBITDA / Interest expenses 9.1x 8.5x
Rating agenciesS&PMoodysFitch
A stable outlookA3 negative outlookA‐ stable outlook
BBB+ stable outlookBaa1 negative outlookBBB+ negative outlook
Net debt at close 11,424 9,798
Gross cash flow / net debt at close 29.1% 30.4%
12 months to 30 June 2010(with Dia)
12 months to 30 June 2011(excl. Dia)
Net debt at close / EBITDA 2.4x 2.3x
Gearing 103.6% 110.7%
34
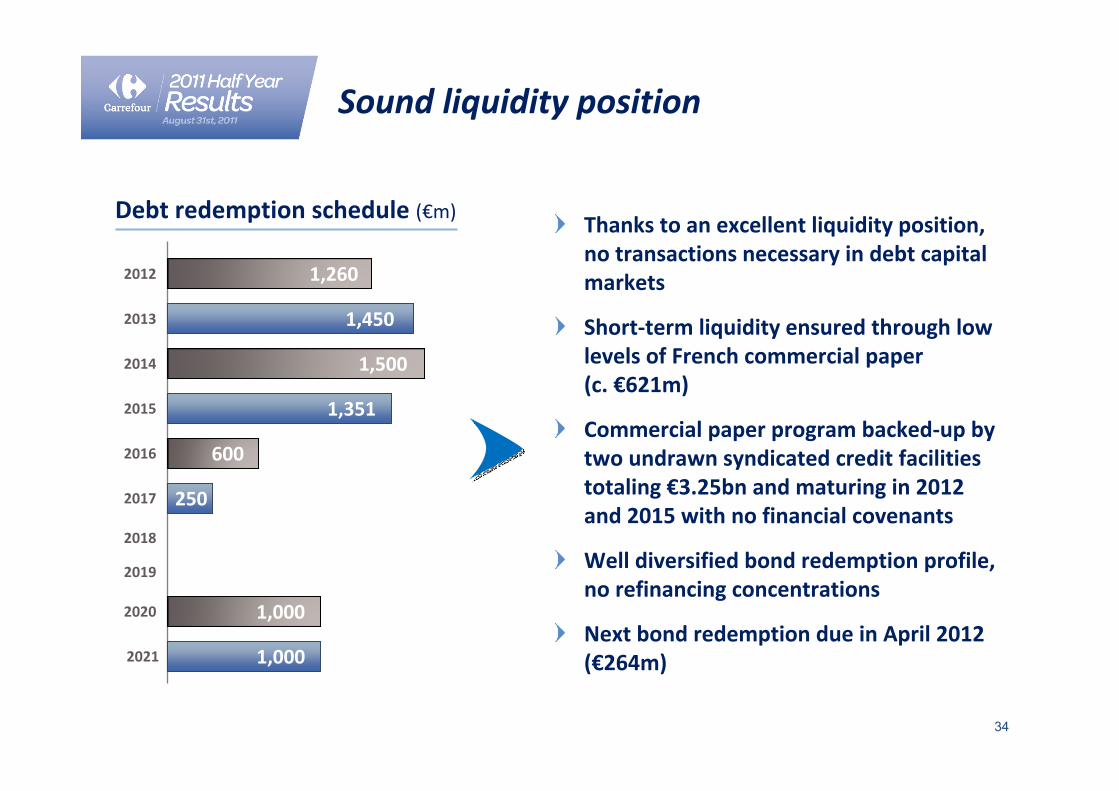
Sound liquidity position
Thanks to an excellent liquidity position, no transactions necessary in debt capital markets
Short‐term liquidity ensured through low levels of French commercial paper (c. €621m)
Commercial paper program backed‐up by two undrawn syndicated credit facilities totaling €3.25bn and maturing in 2012 and 2015 with no financial covenants
Well diversified bond redemption profile, no refinancing concentrations
Next bond redemption due in April 2012 (€264m)
2012 1,260
Debt redemption schedule (€m)
1,4502013
1,5002014
1,3512015
6002016
2502017
2018
2019
1,0002020
1,0002021

35
New game plan,pursuing strategic priorities
Lars Olofsson

36
France ‘‘Reset’’: New commercial strategy and action plan
Lars Olofsson – Noël Prioux

37
Diagnosis: Too much, too quickly
Change in category and pricing management
Change in commercial dynamics
New IT systems for stores and merchandise
Head‐office move and rationalization
Planet concept launch and implementation
France
Unwanted side‐effectsUnsatisfactory execution
Many critical steps in our Transformation…

38
3.Accelerate
2.Rebuild
• Hypermarket commercial mix (price ‐ promotion ‐loyalty)
• Carrefour branded products
• Expansion / Carrefour Drive
• E‐commerce
• Cost savings
1.Adjust
• Organization and IT Systems
• Out‐of‐stocks
• Planet deployment
Our 3‐pillar action plan to rebuild momentum
France

39
Simplify head office systems and processes
Intensify focus on non‐food assortment &
profitability
Adjust Hypermarket organization
Differentiated organization depending on store size and requirements.
More responsibility for the store manager
Creation of a dedicated non‐food merchandise department
Focus on merchandise and supply chain
Simplified interaction between head‐office and stores
France 1 ‐ Adjust organization

40
Objectives
Excessive level of out‐of‐stocks•7% in food•18% in non food
Diagnosis
Dedicated task force•Reduce in‐store IT glitches•Improve inventory management in intermediate warehouses
•Better coordination between merchandise and store management
Action Plan
30% decrease in out‐of‐stocks by September 201150% decrease in out‐of‐stocks by end 2011
France 1 ‐ Adjust out‐of‐stocks

41
• Significant outperformance compared to non converted stores…
• …despite suboptimal execution
• Concept not fully implemented
• Absence of specific commercial program
• Overly drastic reduction in some product categories
• Priority in H1 to IT deployment before store rollout
Diagnosis
Improved execution, new timeline
•Full deployment by 2013 as planned
•First wave moved from June to September to benefit from adjustments
•26 stores instead of 40 initially planned in 2011, 14 moved back to early 2012
•Specific Carrefour Planet event and seasonal commercial program
Action Plan
France 1 ‐ Adjust Planet deployment
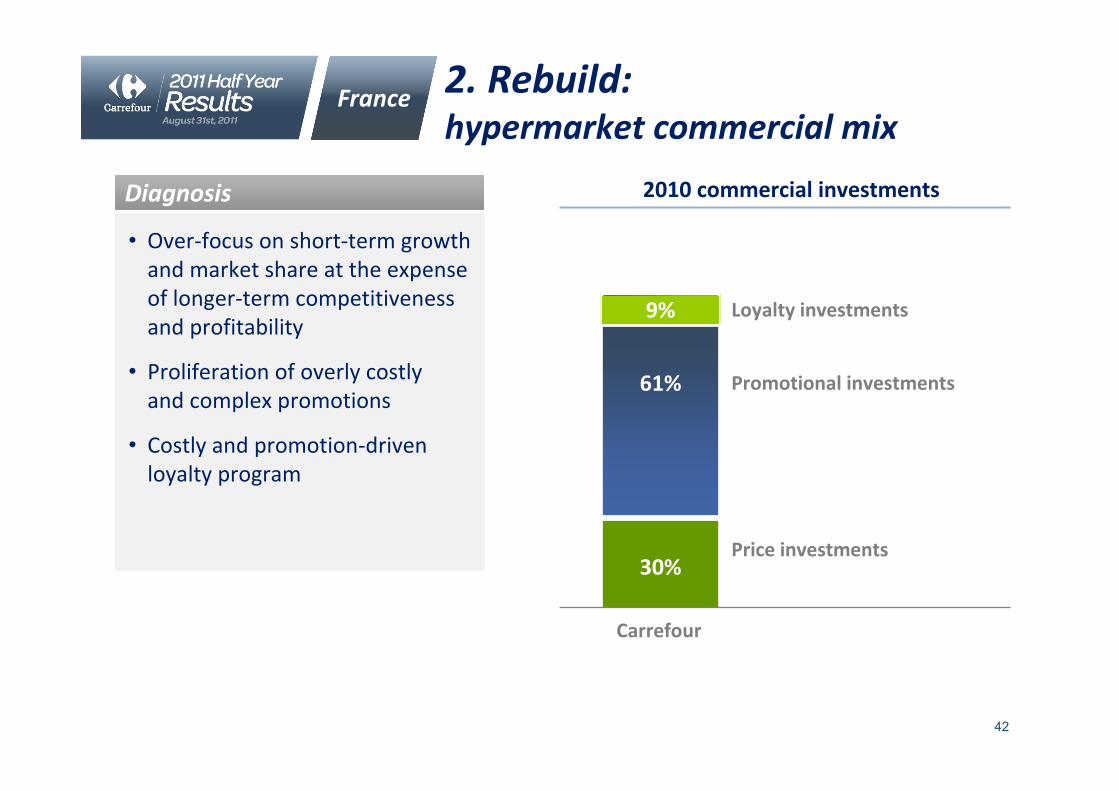
42
• Over‐focus on short‐term growth and market share at the expense of longer‐term competitiveness and profitability
• Proliferation of overly costly and complex promotions
• Costly and promotion‐driven loyalty program
Diagnosis
France
2010 commercial investments
Carrefour
Loyalty investments
Promotional investments
Price investments
2. Rebuild: hypermarket commercial mix
9%
61%
30%

43
A step change in execution
•Targeted price investment to improve price competitiveness in dry grocery
•Drive Carrefour branded growth
•Reinforce customer communication
• Price • Carrefour brand
•Financed by • rebuilt loyalty program• fewer but more impactful promotions• gains on non‐food
Short term negative impact on sales to gain a sustainable profitable growthplatform
Action Plan
France 2. Rebuild: hypermarket commercial mix
Non food
Promotions
Food pricing
Targetedloyalty
Carrefour brand
Source Investment

44
France 2. Rebuild: hypermarket commercial mix

45
France2. Rebuild: hypermarket commercial mix

46
France3. Accelerate: Carrefour‐branded products
• Carrefour brand relaunch beginning in September 2011
• Innovations• Renovations• Price realignment• New visual identity
• Specific communication plan
• Targeting 40% Carrefour brand participation (vs. 25% in 2011)
Action Plan

47
3. Accelerate: Expansion, Drive, Internet
France
• Expansion:
• Boost smaller formats’ expansion• Grow selling space in line with market mainly through franchise and convenience
• Drives at year‐end:
• 22 hypermarkets • 24 supermarkets
• Internet:
• Launch of the Carrefour/Pixmania website in November
Action Plan

48
Conclusion
•A decisive step change:Consistent implementation of new commercial strategy
Priority to rigorous execution over speed
•A comprehensive action plan to:
Unleash the full potential of Carrefour Planet
Reap benefits of Non‐Food strategy implementation
Simplify processes and systems
Enhance competitiveness
Regain lost ground on drives and e‐business
Short term negative sales impact on the way to profitable growth
France
France ‘Reset’

49
Planet deployment update

50
Sinceopening
H1 2011
Sales growth Traffic evolution Market share evolution
Sharply improved performance in the 4 Planet model stores
17%
18.8%
+180bp
10.9%
14.3%
Since opening
H1 2011
+9.7%
13.3%
Strong sales and traffic growth in four model stores*
• Encouraging profitability improvement driven by:Volume growthLower labor costs as a % of sales despite additional services
• Further upside through: Non‐food gains New store operating model
Planet
Before opening After opening
* Four model stores FRANCE ‐ Venissieux – SPAIN ‐ El Pinar – Mostolles – BELGIUM ‐ Mont St Jean.

51
Rollout of Carrefour Planet: slight adjustment in phasing
Fine tuning and optimization of the concept
Rollout from April
2010 2011
98 Carrefour Planet in G4 and Greece
82 Carrefour Planet: 27 in France – 43 in Spain –9 in Belgium‐ 2 in Italy –1 in Greece
6 Carrefour Planet pilot stores in G3
4 model stores
Initial plan
Upd
ated
plan
Planet

52
CompletionCompletion
2010 2011
98 Carrefour Planet in G4 and Greece
82 Carrefour Planet: 27 in France – 43 in Spain –9 in Belgium‐ 2 in Italy –1 in Greece
6 Carrefour Planet pilot stores in G3
4 model stores
Initial plan
Upd
ated
plan
2013
Total 503 hypermarkets:241 Carrefour Planet262 renovated hypermarkets
Total 464 hypermarkets:221 Carrefour Planet243 renovated hypermarkets
Completion
Planet
Fine tuning and optimization of the concept
Rollout from April
Carrefour Planet rollout: pragmatic adjustments

53
Adapting to newcontext: Southern Europe

54
Adapting to new context
•Greece:Conversion of remaining DIA stores to Carrefour banner
Freeze on further expansion
Capex reduction with conversion of 10 Planet (vs. 14 initially planned) and no investment in remodelling (vs. 23 initially planned) by 2013
• Italy:Adapted commercial strategy, price repositioning underway
Ongoing banner conversion for convenience
Capex reduction with 43 hypermarkets converted/ remodelled (vs 53 initially planned) by 2013
• Spain:Ongoing cost optimization
Capex optimization with 103 stores remodelled rather than converted to Planet (vs 89 initially planned) by 2013
Southern Europe

55
Pursuing our leadership ambition in Growth Markets

56
Reinforcing leadership in key countries
•Reinforcing leadership in growth markets with:
475 new stores to be opened in 2011, for total of c. 583 000 new gross sqm
Planned FY Capex of €900m, up 20% vs. 2010
Development of new formats (e‐commerce, Carrefour Express)
Expand Atacadao throughout Latin America
Growth Markets
New stores under banners 2011 Hypers Atacadao Supers Convenience Cash & Carry Total
Latin America 2 22 3 69 96
Asia 31 1 32
Eastern Europe 9 58 246 313
Franchise (ME, Dom Tom) 9 20 3 2 34
Total 51 22 81 318 3 475

57
Brazil: Strong commitment, strong performance
• 2nd largest country for the Group, representing 14% of Group sales
• Carrefour No1 food retailer
• Continued strong growth at AtacadaoNear double digit LfL growth in H1 2011
17 new stores planned in 2011
• Positive results from hypermarket turnaround plan
Growth Markets
Net sales (€m)
4,6955,455
+16.2%
Current Operating Income (€m)
+48.2% (+60bp)
H1 2010 H1 2011 H1 2010 H1 2011

58
Brazil : A positive turnaround in hypermarkets
•Return to Lfl growth thanks to:Commercial dynamicsStore renovationsFixing the basics
• Strong rebound in profitability thanks to:Head‐office downsizingNew store operating modelPurchasing improvementsStore closures & Transformations to Atacadao
Growth Markets
Hypermarket turnaround plan drives sales and profit growth in 2011

59
2,044
2,251
+10.1%
Growth Markets China: Consolidate our leadership
• 5th‐largest country for the Group, representing 6% of Group sales
•No1 international banner
• Solid growth in H1 2011 supported by ongoing expansion
• Simplified partnership structure
• Pursuing sustained and profitable expansion: 23 new stores in 2011
• Inflationary pressure on consumption likely to continue in H2
Net sales (€m)
H1 2010 H1 2011
60

61
New game plan to rebuild momentum
• Implementing a new game plan…
France “Reset”
Adapting to the new context in Europe
• …While pursuing our strategic priorities
Pursue Transformation Plan
Focus on growth levers: Emerging Markets, Planet, Carrefour brand
“Biting the bullet” in 2011: Group Current Operating Income ‐15% ex DIA
Rebuilding momentum in 2012 to deliver long term sustainable profitable growth

62
APPENDICES

63
Restatement of HY 2010 Current Operating Income
(98)
989
20
Reported H1 2010 Current
Op.Income
H1 2010Brazil
restatem.
Thailandrestatem.
Hard discount restatem.
Restated H1 2010 Current
Op.Income
1,096
(28)
(€m)

64
Summary income statement
€m H1 2011 H1 2010 Change
Sales excl. VAT 39,607 38,710 2.3%
Loyalty impact (451) (377) 19.5%
Sales excl. VAT without fidelity impact 39,156 38,333 2.1%
Other income 1,100 1,020
Cost of goods sold (31,763) (30,925)
Gross margin from current operations 8,494 8,428 0.8%
S&GA (6,869) (6,605)
Current Operating Income before D&A and provis. 1,625 1,823 (10.9)%
Current Operating Income 772 989 (22.0)%
Current Operating Income as a % of sales excl.VAT 1.9% 2.6%
Non‐recurring income (expenses) (884) (353)
Operating income (112) 636
Financial expense (342) (349)
Income Tax (490) (238)
Net income from recurring operations – Group share (927) 63
Impact of discontinued operations– Group share 679 84
Net income – Group share (249) 97

65
Key operating ratios
€m H1 2011 H1 2010 Change
Sales excl. VAT 39,607 38,710 2.3%
Other income 1,100 1,020 7.9%
Gross margin from current operations as a % of sales
21.4% 21.8%
SG&A as a % of sales (17.3%) (17.1%)
D&A / provisions as a % of sales (2.2%) (2.2%)
Current Operating Incomeas a % of sales
1.9% 2.6%
Operating Income as a % of sales (0.3)% 1.6%
Actual tax rate (108.0)% 82.9%
Current Operating Income before D&A andprovisions as a % of sales
4.1% 4.7%

66
Summary cash flow statement
€m 30 June 2010 (12 months)
Net debt, beginning of period (11,424)
Gross cash flow from operating activities 3,405
Change in working capital (272)
Others and Impact of discontinued operations 57
Cash flow from operating activities 3,190
Capital expenditures (1,935)(148)
Free cash flow 1,108
Financial investments (178)Disposals 222
297
Cash flow after investing activities 1,450
Dividends (117)Treasury shares (778)
(98)
Net debt, end of period (10,654)
313
Consumer credit companies
Others and Impact of discontinued operations
Others and Impact of discontinued operations
Others and Impact of discontinued operations

67
Current Operating Incomeper region
H1 2010 % changeH1 2011€m
FranceAC margin
3021.8%
5033.0%
(40.0)%
EuropeAC margin
1421.2%
2131.8%
(33.3)%
Latin AmericaAC margin
1932.6%
1522.3%
27.4%
AsiaAC margin
1353.6%
1223.5%
10.8%
TotalAC margin
7721.9%
9892.6%
(22.0)%

68
Growth in sales, EBITDA, and Current Operating Income
% growth – H1 2011 vs. H1 2010 Sales EBITDA Current Operating Income
France 1.6% (21.2)% (40.0)%
Europe excl. France (3.9)% (18.5)% (33.3)%
Latin America 12.9% 17.0% 27.4%
Asia 7.7% 7.3% 10.8%
Total 2.3% (10.9)% (22.0)%

69
EPS calculation
H1 2010 EPS H1 2011 EPS
EPS before discontinued activities
EPS from discontinued activities
EPS including discontinued activities
EPS is based on the net result before discontinued activities (group share)
To calculate EPS, we have used the weighted average number of shares: 684,200,616 in H1 2010 and 659,181,759 in H1 2011
0.02
0.12
0.14
(1.41)
1.03
(0.38)
€

70
Consolidated store network June 2011
CONVENIENCE CASH & CARRY TOTAL
205 573 6 784166 108 8 28246 41 8739 227 224 49058 215 166 12 45184 186 27027 212 23923 35 58
443 1,024 398 12 1,877
72 109 227187 49 8 24473 77332 158 58 548
185 18560 3 6367 14 8124 242 2
1338 17 0 356
1,318 1,772 456 19 3,565
FRANCESpain
BelgiumGreece + CyprusItalyPolandTurkeyRomania
EUROPE
ArgentinaBrazilColombiaLATIN AMERICA
ChinaTaiwanIndonesia
MalaysiaSingapore
ASIA
TOTAL
HYPER SUPER
46
India 1
1
4

71
Stores under Group banners (incl. franchisees and partners) June 2011
15
HYPER SUPER CONVENIENCE CASH & CARRY TOTAL
FRANCE 232 974 3,244 137 4,587Spain 172 113 42 327Belgium 46 439 213 698Greece + Cyprus 39 255 572 866Italy 61 433 812 13 1,319Poland 84 186 97 367
Turkey 27 212 229Romania 23 35 58Others 61 127 68 256
EUROPE 513 1,800 1,804 4,132
Argentina 72 109 227Brazil 187 49 8 244Colombia 73 77LATIN AMERICA 332 158 58 548
China 185 185Taiwan 60 3 63Indonesia 67 14 91
Malaysia 24 32Singapore 2 2
ASIA 338 17 8 364
TOTAL 1,415 2,949 5,114 153 9,631
46
8
India 11
1
2
4

72