carrier perspective on refrigerated shipping...global market 2013- reefer cargo source: drewry...
TRANSCRIPT
AgTC Annual Meeting, June 26, 2014 William C. Duggan, Jr, Maersk Line North American Refrigerated Services
Carrier perspective on Refrigerated Shipping
Insert department name via
‘View/Header and Footer…’
Agenda
� Key Messages
� The Global and USA Reefer Market
� The Reefer Container Challenge
� The Reefer Rate
� Japan & China 24 Hour Rule
� The Future
� Questions
Insert department name via
‘View/Header and Footer…’
My key messages today
THE SHIPPING INDUSTRY IS STILL FACING SIGNIFICANT CHALLENGES
MAERSK LINE REMAINS COMMITTED TO THE REEFER BUSINESS
PARTNERSHIPS AND SERVICE INNOVATION WILL BE FUTURE VALUE DRIVERS
Insert department name via
‘View/Header and Footer…’
SECTION 4: GLOBAL & US REEFER MARKET
Insert department name via
‘View/Header and Footer…’
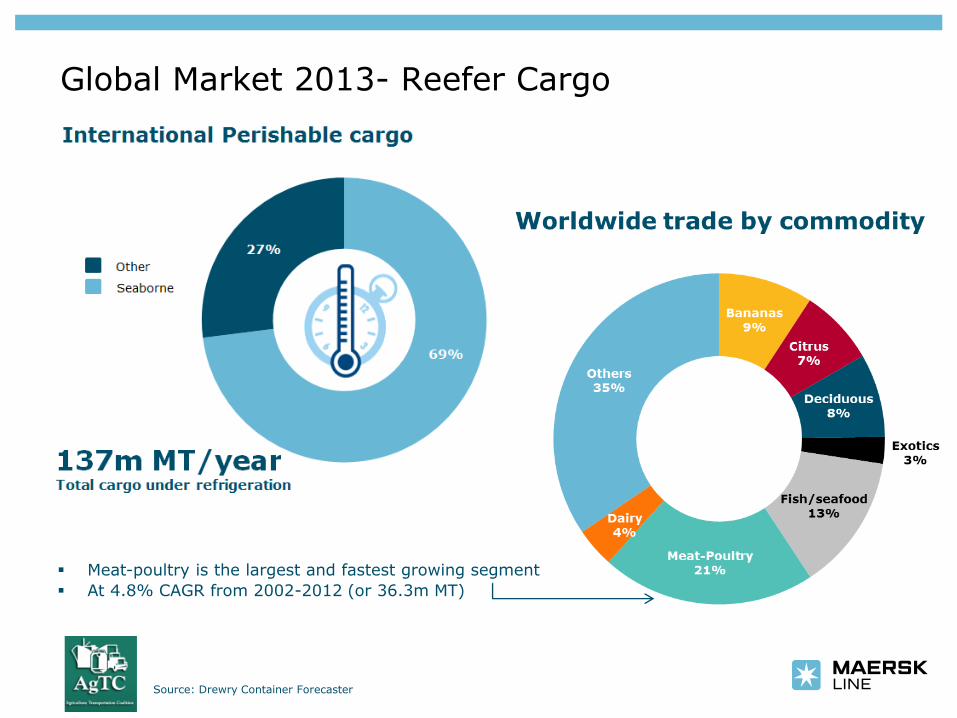
Global Market 2013- Reefer Cargo
Source: Drewry Container Forecaster
� Meat-poultry is the largest and fastest growing segment
� At 4.8% CAGR from 2002-2012 (or 36.3m MT)
Insert department name via
‘View/Header and Footer…’
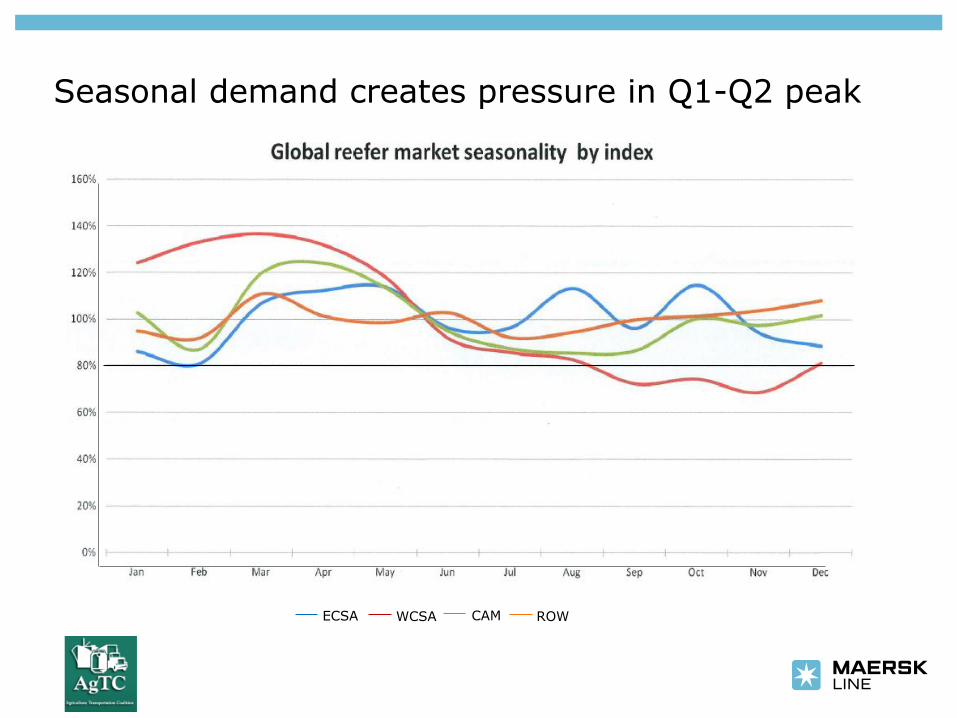
Seasonal demand creates pressure in Q1-Q2 peak
ECSA WCSA CAM ROW
Insert department name via
‘View/Header and Footer…’
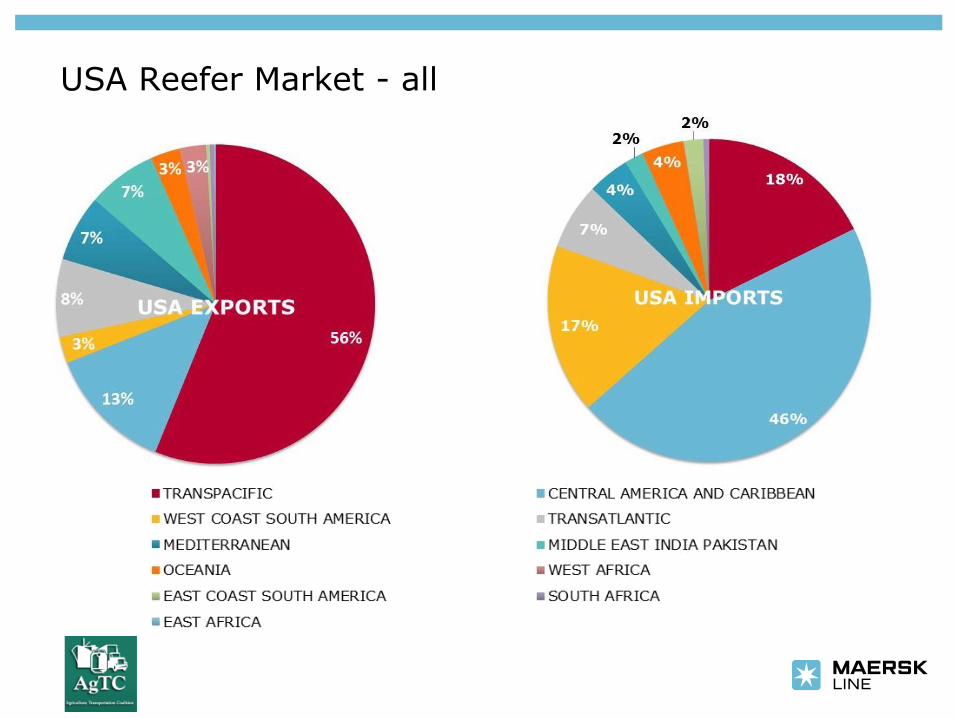
USA Reefer Market - all
Insert department name via
‘View/Header and Footer…’
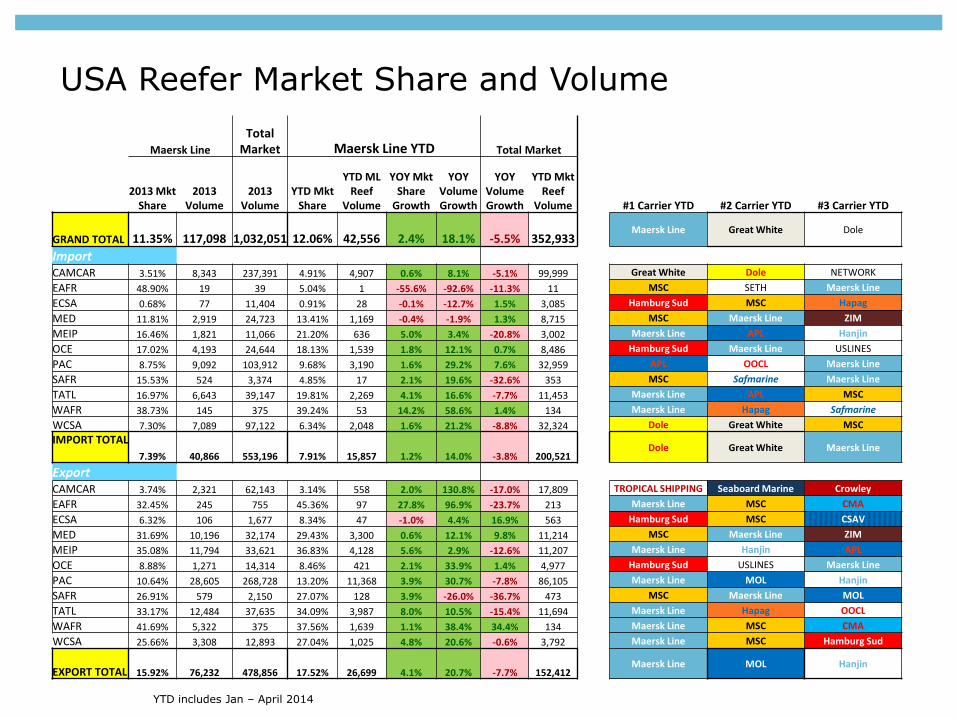
USA Reefer Market Share and Volume
Total Market
Total Market Maersk Line Maersk Line YTD
2013 Mkt Share
2013 Volume
2013 Volume
YTD Mkt Share
YTD ML Reef
Volume
YOY Mkt Share
Growth
YOY Volume Growth
YOY Volume Growth
YTD Mkt Reef
Volume #1 Carrier YTD #2 Carrier YTD #3 Carrier YTD
GRAND TOTAL 11.35% 117,098 1,032,051 12.06% 42,556 2.4% 18.1% -5.5% 352,933 Maersk Line Great White Dole
Import CAMCAR 3.51% 8,343 237,391 4.91% 4,907 0.6% 8.1% -5.1% 99,999 Great White Dole NETWORK EAFR 48.90% 19 39 5.04% 1 -55.6% -92.6% -11.3% 11 MSC SETH Maersk Line ECSA 0.68% 77 11,404 0.91% 28 -0.1% -12.7% 1.5% 3,085 Hamburg Sud MSC Hapag MED 11.81% 2,919 24,723 13.41% 1,169 -0.4% -1.9% 1.3% 8,715 MSC Maersk Line ZIM MEIP 16.46% 1,821 11,066 21.20% 636 5.0% 3.4% -20.8% 3,002 Maersk Line APL Hanjin OCE 17.02% 4,193 24,644 18.13% 1,539 1.8% 12.1% 0.7% 8,486 Hamburg Sud Maersk Line USLINES PAC 8.75% 9,092 103,912 9.68% 3,190 1.6% 29.2% 7.6% 32,959 APL OOCL Maersk Line SAFR 15.53% 524 3,374 4.85% 17 2.1% 19.6% -32.6% 353 MSC Safmarine Maersk Line TATL 16.97% 6,643 39,147 19.81% 2,269 4.1% 16.6% -7.7% 11,453 Maersk Line APL MSC WAFR 38.73% 145 375 39.24% 53 14.2% 58.6% 1.4% 134 Maersk Line Hapag Safmarine WCSA 7.30% 7,089 97,122 6.34% 2,048 1.6% 21.2% -8.8% 32,324 Dole Great White MSC IMPORT TOTAL
7.39% 40,866 553,196 7.91% 15,857 1.2% 14.0% -3.8% 200,521 Dole Great White Maersk Line
Export
CAMCAR 3.74% 2,321 62,143 3.14% 558 2.0% 130.8% -17.0% 17,809 TROPICAL SHIPPING Seaboard Marine Crowley EAFR 32.45% 245 755 45.36% 97 27.8% 96.9% -23.7% 213 Maersk Line MSC CMA ECSA 6.32% 106 1,677 8.34% 47 -1.0% 4.4% 16.9% 563 Hamburg Sud MSC CSAV MED 31.69% 10,196 32,174 29.43% 3,300 0.6% 12.1% 9.8% 11,214 MSC Maersk Line ZIM MEIP 35.08% 11,794 33,621 36.83% 4,128 5.6% 2.9% -12.6% 11,207 Maersk Line Hanjin APL OCE 8.88% 1,271 14,314 8.46% 421 2.1% 33.9% 1.4% 4,977 Hamburg Sud USLINES Maersk Line PAC 10.64% 28,605 268,728 13.20% 11,368 3.9% 30.7% -7.8% 86,105 Maersk Line MOL Hanjin SAFR 26.91% 579 2,150 27.07% 128 3.9% -26.0% -36.7% 473 MSC Maersk Line MOL TATL 33.17% 12,484 37,635 34.09% 3,987 8.0% 10.5% -15.4% 11,694 Maersk Line Hapag OOCL WAFR 41.69% 5,322 375 37.56% 1,639 1.1% 38.4% 34.4% 134 Maersk Line MSC CMA WCSA 25.66% 3,308 12,893 27.04% 1,025 4.8% 20.6% -0.6% 3,792 Maersk Line MSC Hamburg Sud
EXPORT TOTAL 15.92% 76,232 478,856 17.52% 26,699 4.1% 20.7% -7.7% 152,412 Maersk Line MOL Hanjin
YTD includes Jan – April 2014
Insert department name via
‘View/Header and Footer…’
SECTION 5: CONTAINER CHALLENGE
Insert department name via
‘View/Header and Footer…’
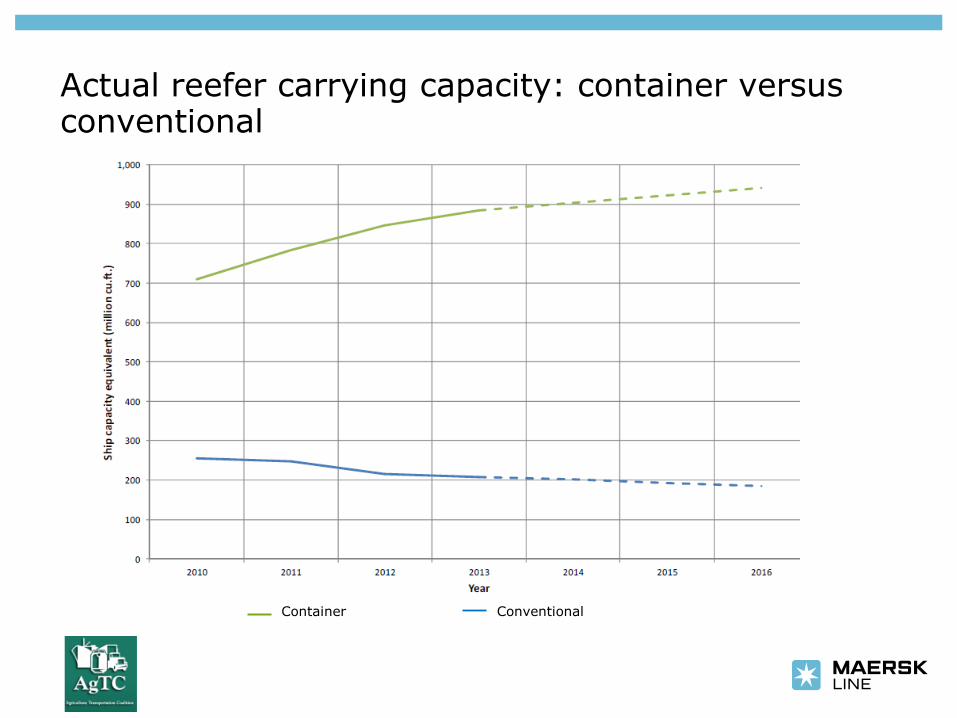
Actual reefer carrying capacity: container versus
conventional
Container Conventional
Insert department name via
‘View/Header and Footer…’
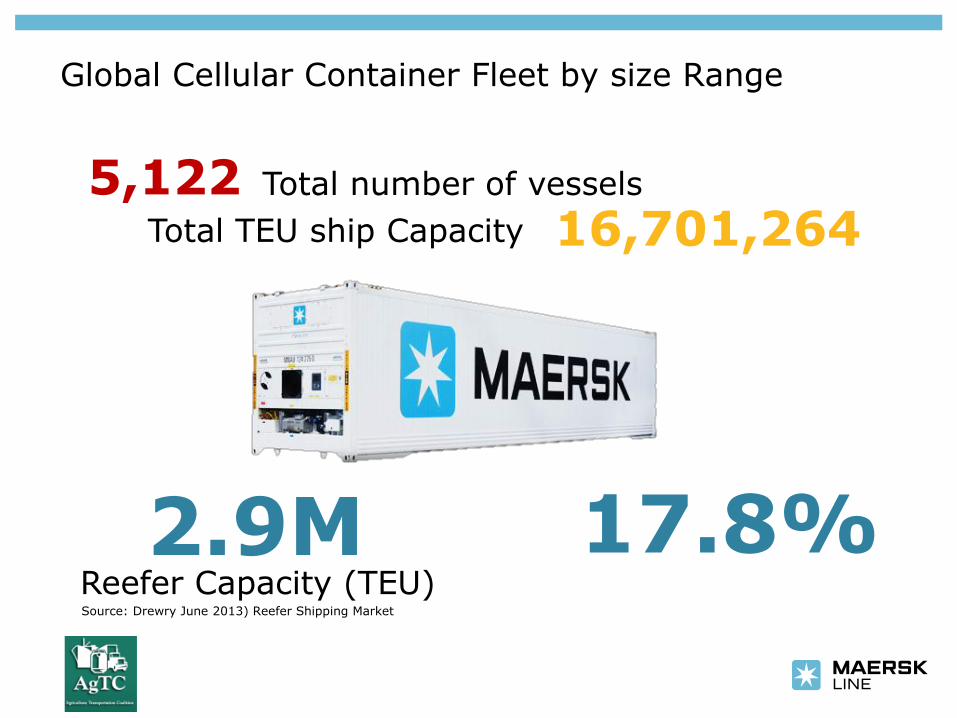
Global Cellular Container Fleet by size Range
Source: Drewry June 2013) Reefer Shipping Market
5,122 Total number of vessels
Reefer Capacity (TEU)
2.9M
Total TEU ship Capacity 16,701,264
17.8%
Insert department name via
‘View/Header and Footer…’
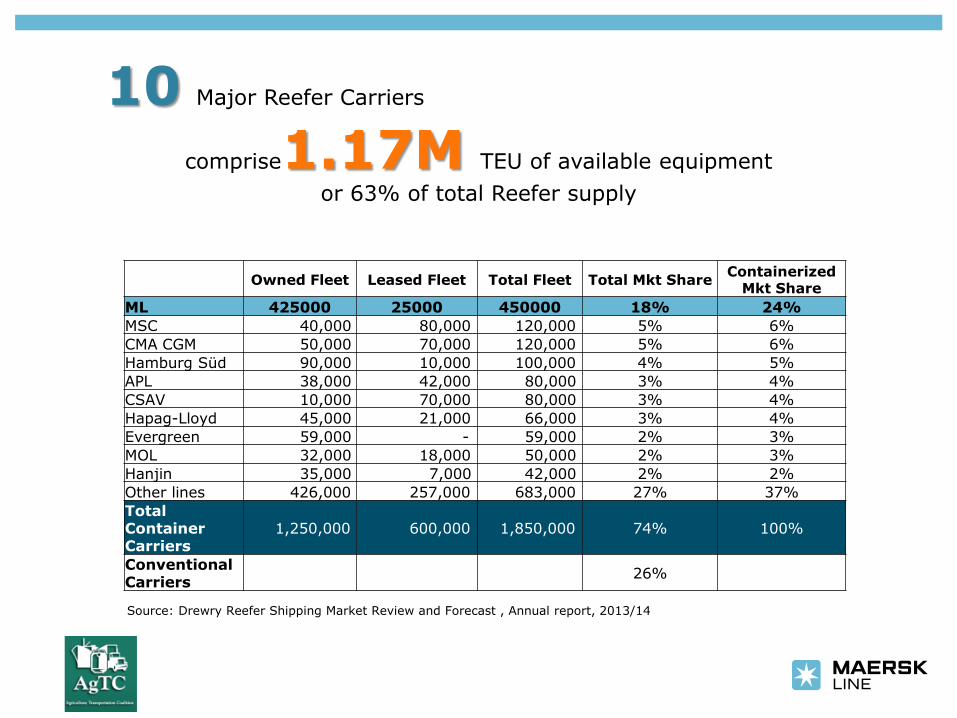
10 Major Reefer Carriers
comprise1.17M TEU of available equipment
or 63% of total Reefer supply
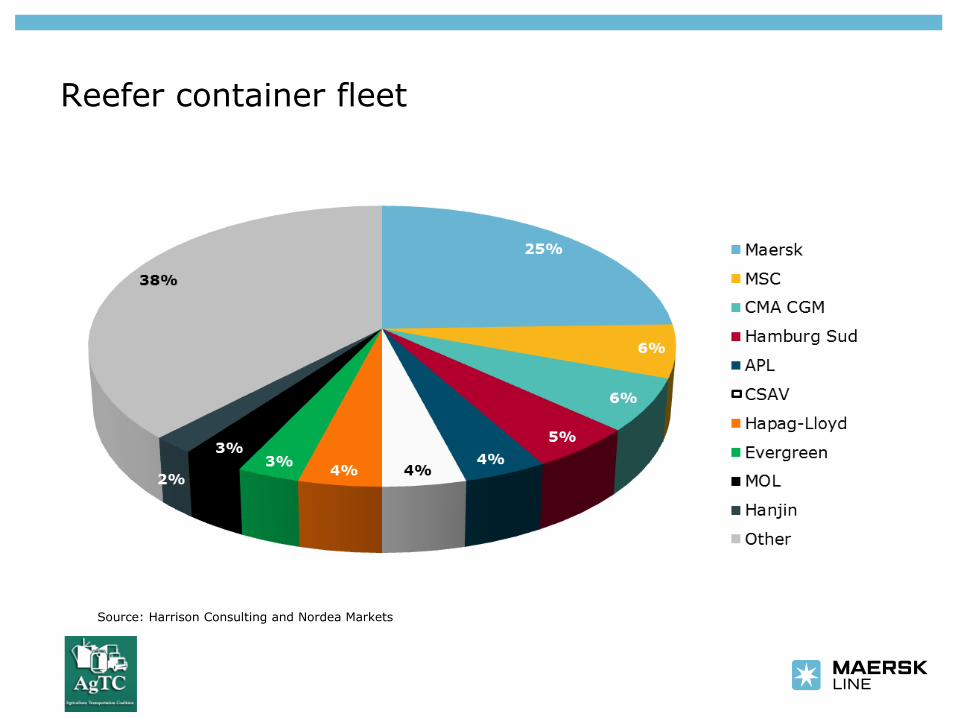
Owned Fleet Leased Fleet Total Fleet Total Mkt Share Containerized Mkt Share
ML 425000 25000 450000 18% 24% MSC 40,000 80,000 120,000 5% 6%
CMA CGM 50,000 70,000 120,000 5% 6%
Hamburg Süd 90,000 10,000 100,000 4% 5%
APL 38,000 42,000 80,000 3% 4%
CSAV 10,000 70,000 80,000 3% 4%
Hapag-Lloyd 45,000 21,000 66,000 3% 4%
Evergreen 59,000 - 59,000 2% 3%
MOL 32,000 18,000 50,000 2% 3%
Hanjin 35,000 7,000 42,000 2% 2%
Other lines 426,000 257,000 683,000 27% 37%
Total Container Carriers
1,250,000 600,000 1,850,000 74% 100%
Conventional Carriers 26%
Source: Drewry Reefer Shipping Market Review and Forecast , Annual report, 2013/14
Insert department name via
‘View/Header and Footer…’
Reefer container fleet
Source: Harrison Consulting and Nordea Markets
Insert department name via
‘View/Header and Footer…’
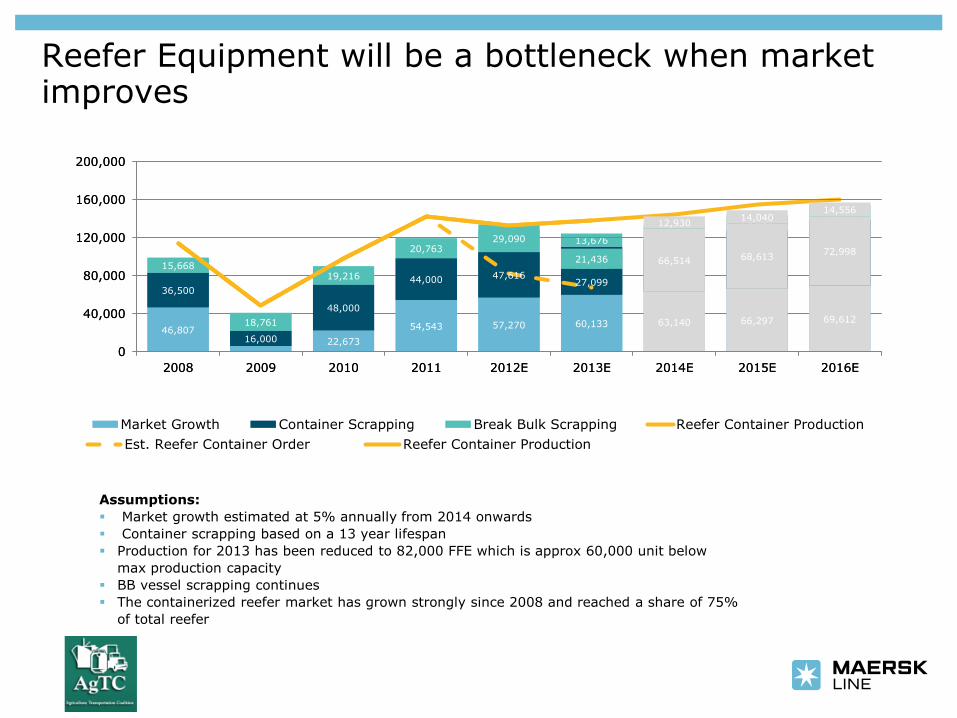
Reefer Equipment will be a bottleneck when market
improves
46,807
22,673
54,545 57,270 60,133 63,140 66,297 69,612
36,500
16,000
48,000
44,000 47,616
50,702 55,432
61,683 69,300
15,668
18,761
19,216
20,763 23,595 13,676
14,430 15,487
15,875
0
40,000
80,000
120,000
160,000
200,000
2008 2009 2010 2011 2012E 2013E 2014E 2015E 2016E
Market Growth Container Scrapping Break Bulk Scrapping Reefer Container Production
Assumptions: � Market growth estimated at 5% annually from 2014 onwards
� Container scrapping based on a 13 year lifespan
� Production for 2013 has been reduced to 82,000 FFE which is approx 60,000 unit below
max production capacity
� BB vessel scrapping continues
� The containerized reefer market has grown strongly since 2008 and reached a share of 75%
of total reefer
46,807
22,673
54,543 57,270 60,133 63,140 66,297 69,612
36,500
16,000
48,000
44,000 47,616
27,099
66,514 68,613 72,998
15,668
18,761
19,216
20,763 29,090
21,436
12,930 14,040
14,556
0
40,000
80,000
120,000
160,000
200,000
2008 2009 2010 2011 2012E 2013E 2014E 2015E 2016E
Market Growth Container Scrapping Break Bulk Scrapping
Est. Reefer Container Order Reefer Container Production
Insert department name via
‘View/Header and Footer…’
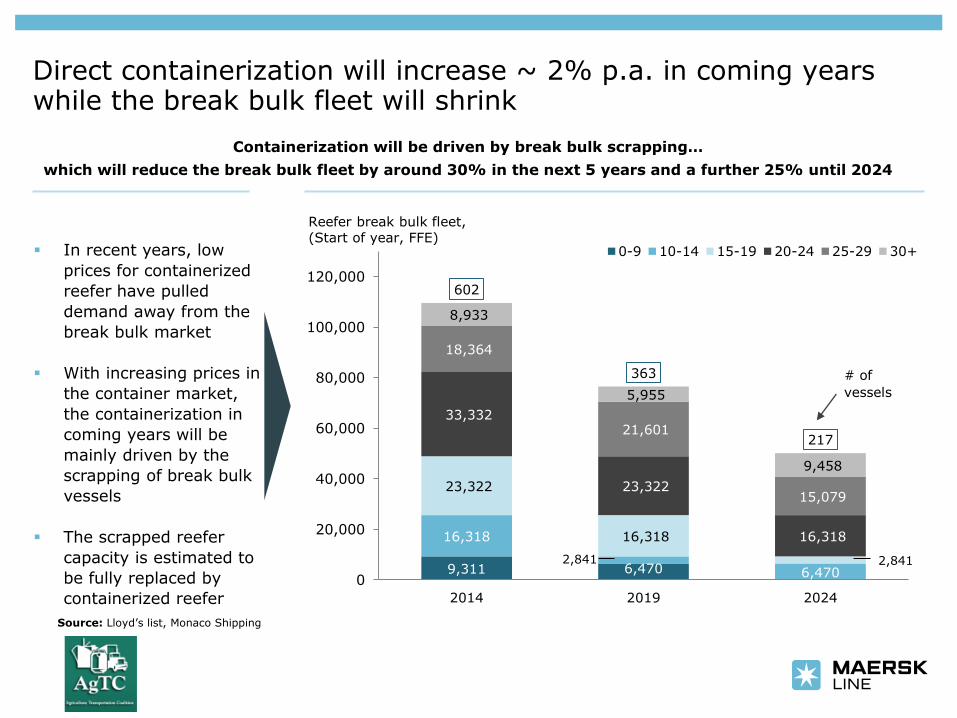
Containerization will be driven by break bulk scrapping… which will reduce the break bulk fleet by around 30% in the next 5 years and a further 25% until 2024
Direct containerization will increase ~ 2% p.a. in coming years
while the break bulk fleet will shrink
Source: Lloyd’s list, Monaco Shipping
9,311 6,470
16,318
2,841
6,470
23,322
16,318
2,841
33,332
23,322
16,318
18,364
21,601
15,079
8,933
5,955
9,458
602
363
217
0
20,000
40,000
60,000
80,000
100,000
120,000
2014 2019 2024
0-9 10-14 15-19 20-24 25-29 30+
Reefer break bulk fleet,
(Start of year, FFE) � In recent years, low
prices for containerized
reefer have pulled
demand away from the
break bulk market
� With increasing prices in
the container market,
the containerization in
coming years will be
mainly driven by the
scrapping of break bulk
vessels
� The scrapped reefer
capacity is estimated to
be fully replaced by
containerized reefer
# of
vessels
Insert department name via
‘View/Header and Footer…’
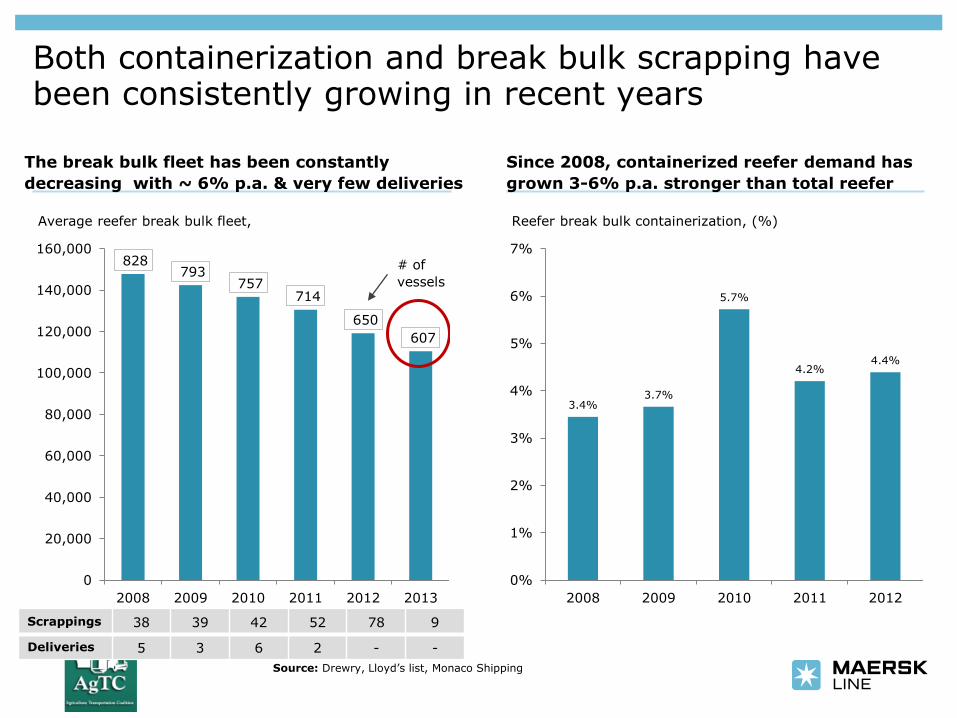
Both containerization and break bulk scrapping have
been consistently growing in recent years
Since 2008, containerized reefer demand has grown 3-6% p.a. stronger than total reefer
The break bulk fleet has been constantly decreasing with ~ 6% p.a. & very few deliveries
3.4% 3.7%
5.7%
4.2% 4.4%
0%
1%
2%
3%
4%
5%
6%
7%
2008 2009 2010 2011 2012
Reefer break bulk containerization, (%)
828 793
757 714
650
607
0
20,000
40,000
60,000
80,000
100,000
120,000
140,000
160,000
2008 2009 2010 2011 2012 2013
Average reefer break bulk fleet,
Scrappings 38 39 42 52 78 9
Deliveries 5 3 6 2 - -
# of
vessels
Source: Drewry, Lloyd’s list, Monaco Shipping
Insert department name via
‘View/Header and Footer…’
Slide 17
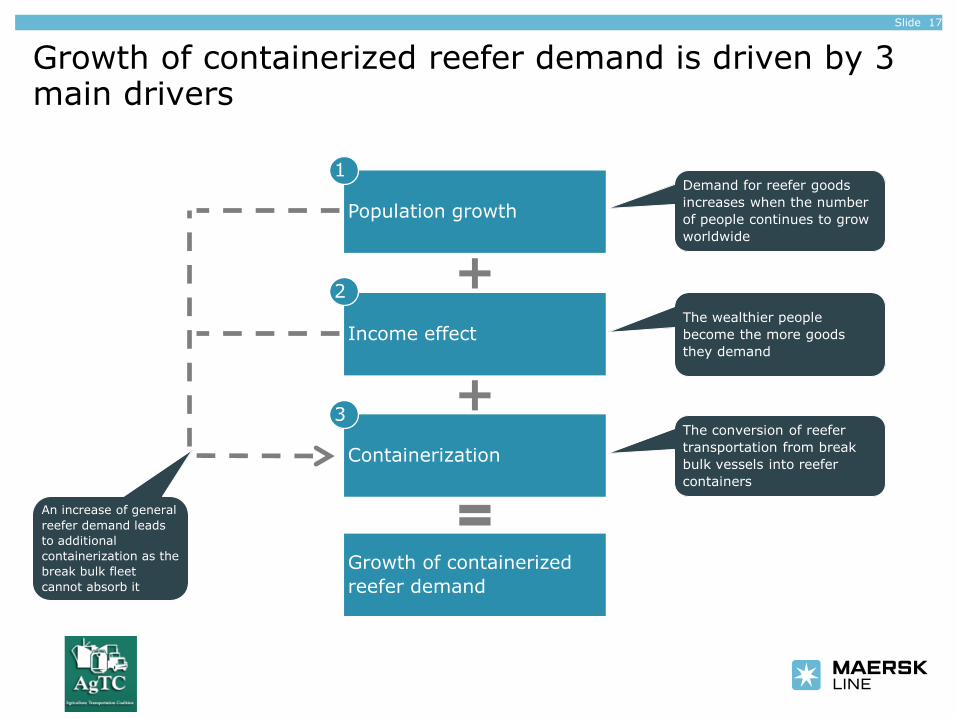
Growth of containerized reefer demand is driven by 3
main drivers
Population growth
1
Income effect
2
Containerization
3
Demand for reefer goods
increases when the number
of people continues to grow
worldwide
The conversion of reefer
transportation from break
bulk vessels into reefer
containers
The wealthier people
become the more goods
they demand
Growth of containerized
reefer demand
An increase of general
reefer demand leads
to additional
containerization as the
break bulk fleet
cannot absorb it
Insert department name via
‘View/Header and Footer…’
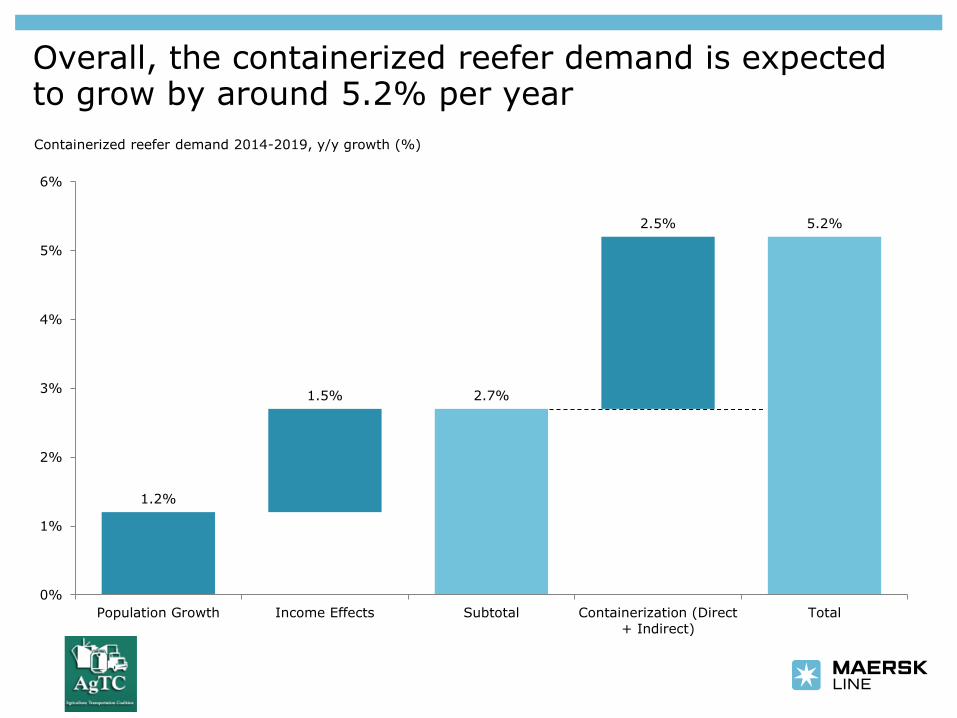
Overall, the containerized reefer demand is expected
to grow by around 5.2% per year
1.2%
1.5% 2.7%
2.5% 5.2%
Population Growth Income Effects Subtotal Containerization (Direct
+ Indirect)
Total
0%
1%
2%
3%
4%
5%
6%
Containerized reefer demand 2014-2019, y/y growth (%)
Insert department name via
‘View/Header and Footer…’
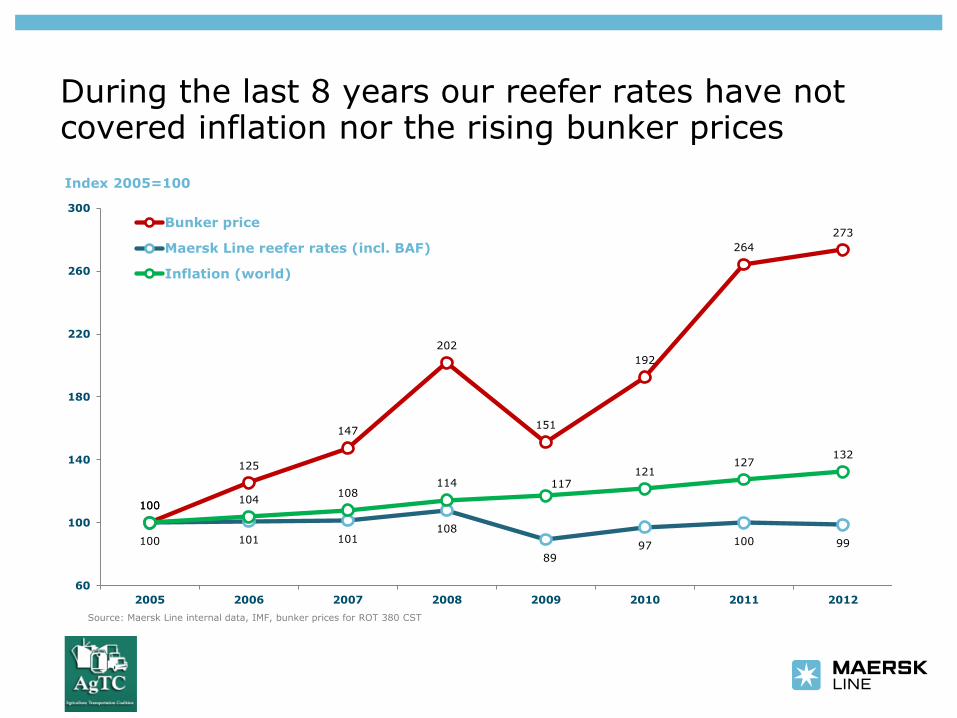
Source: Maersk Line internal data, IMF, bunker prices for ROT 380 CST
During the last 8 years our reefer rates have not
covered inflation nor the rising bunker prices
100
125
147
202
151
192
264
273
100 101 101 108
89
97 100 99
100 104
108 114 117
121 127
132
60
100
140
180
220
260
300
2005 2006 2007 2008 2009 2010 2011 2012
Bunker price
Maersk Line reefer rates (incl. BAF)
Inflation (world)
Index 2005=100
Insert department name via
‘View/Header and Footer…’
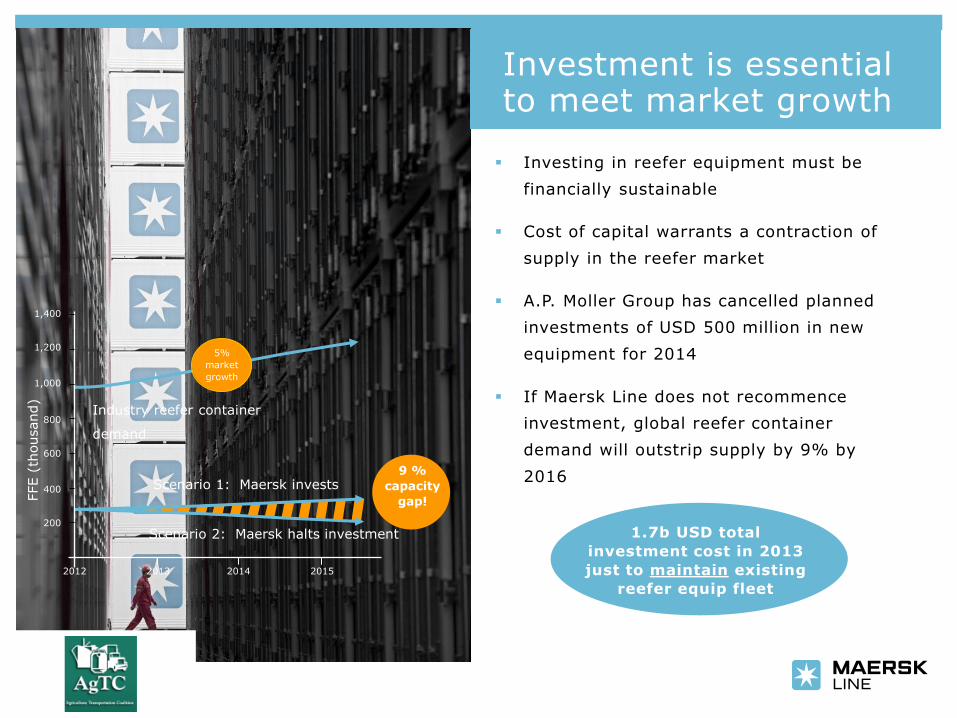
Investment is essential
to meet market growth
� Investing in reefer equipment must be
financially sustainable
� Cost of capital warrants a contraction of
supply in the reefer market
� A.P. Moller Group has cancelled planned
investments of USD 500 million in new
equipment for 2014
� If Maersk Line does not recommence
investment, global reefer container
demand will outstrip supply by 9% by
2016
1.7b USD total
investment cost in 2013 just to maintain existing
reefer equip fleet
9 % capacity
gap!
2012
Scenario 2: Maersk halts investment
Industry reefer container
demand
Scenario 1: Maersk invests
2013 2014 2015
FFE (
thousand)
200
400
600
800
1,000
1,200
1,400
5%
market
growth
Insert department name via
‘View/Header and Footer…’
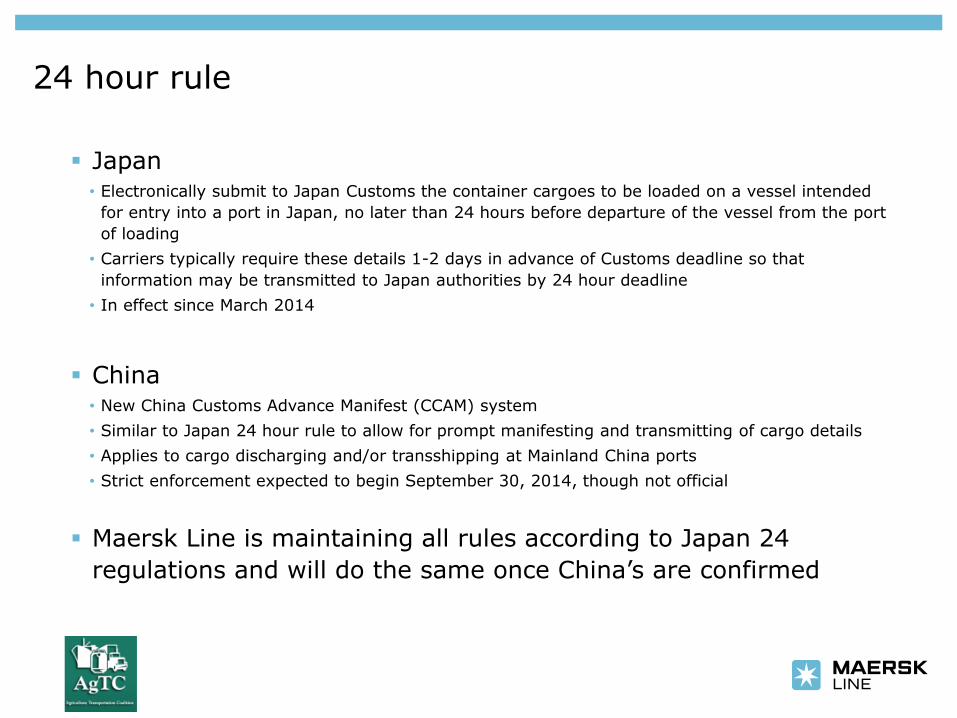
24 hour rule
� Japan
• Electronically submit to Japan Customs the container cargoes to be loaded on a vessel intended
for entry into a port in Japan, no later than 24 hours before departure of the vessel from the port
of loading
• Carriers typically require these details 1-2 days in advance of Customs deadline so that
information may be transmitted to Japan authorities by 24 hour deadline
• In effect since March 2014
� China
• New China Customs Advance Manifest (CCAM) system
• Similar to Japan 24 hour rule to allow for prompt manifesting and transmitting of cargo details
• Applies to cargo discharging and/or transshipping at Mainland China ports
• Strict enforcement expected to begin September 30, 2014, though not official
� Maersk Line is maintaining all rules according to Japan 24
regulations and will do the same once China’s are confirmed
Insert department name via
‘View/Header and Footer…’
FUTURE Where is the reefer business heading?
Insert department name via
‘View/Header and Footer…’
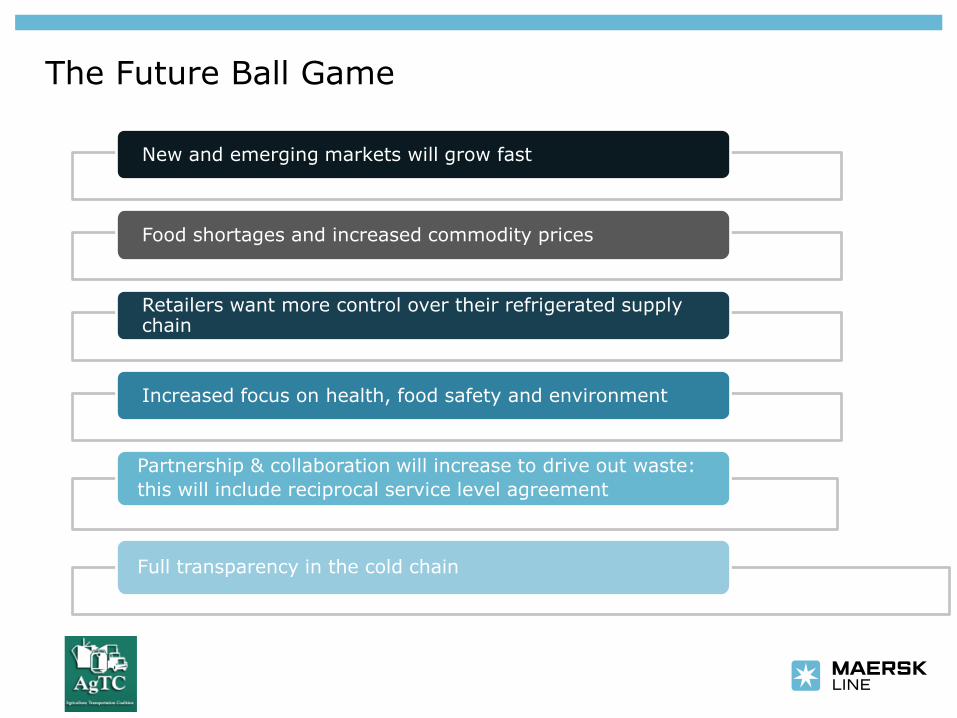
The Future Ball Game
New and emerging markets will grow fast
Food shortages and increased commodity prices
Retailers want more control over their refrigerated supply chain
Increased focus on health, food safety and environment
Full transparency in the cold chain
Partnership & collaboration will increase to drive out waste:
this will include reciprocal service level agreement
Insert department name via
‘View/Header and Footer…’
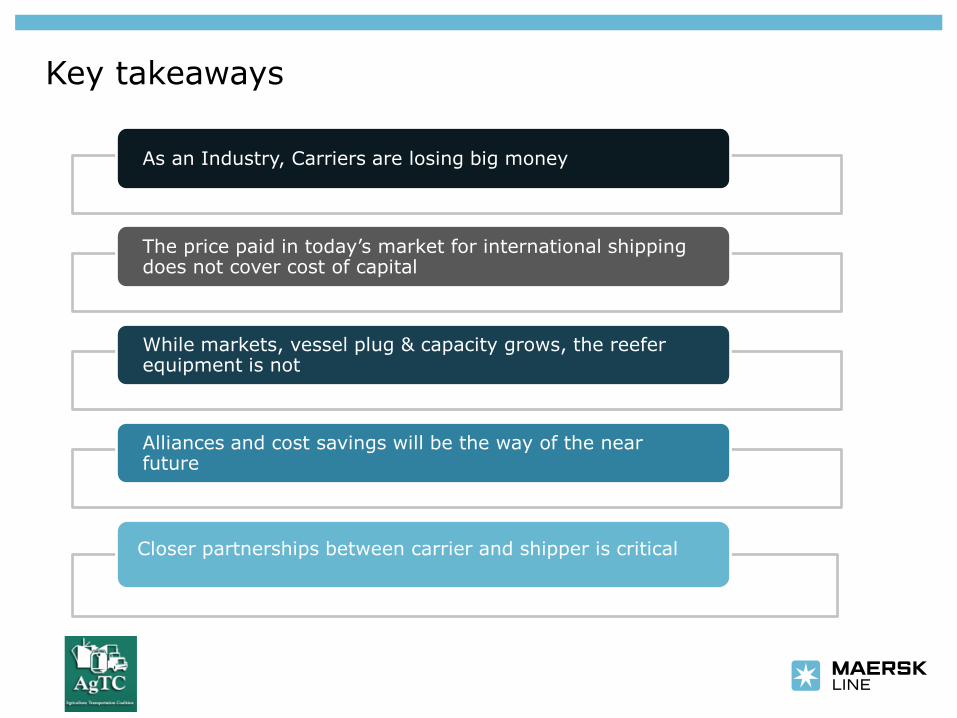
Key takeaways
As an Industry, Carriers are losing big money
The price paid in today’s market for international shipping does not cover cost of capital
While markets, vessel plug & capacity grows, the reefer equipment is not
Alliances and cost savings will be the way of the near future
Closer partnerships between carrier and shipper is critical
Insert department name via
‘View/Header and Footer…’
Questions?