carrizo oil & gas, inc. - s22.q4cdn.com · provides a deep inventory of de -risked drilling...
TRANSCRIPT

CRZO
CARRIZO OIL & GAS, INC. EXL ACQUISITION PRESENTATION June 28, 2017
CRZO 2 CRZO 2 2 CRZO 2
Free Writing Prospectus Legend
The issuer has filed a registration statement (No. 333-198459) (including a prospectus) with the Securities and Exchange Commission(“SEC”) for the offering to which this communication relates. Before you invest, you should read the prospectus in that registration statement and other documents the issuer has filed with the SEC for more complete information about the issuer and this offering. You may get these documents for free by visiting EDGAR on the SEC Web site at www.sec.gov. Alternatively, the issuer, any underwriter or any dealer participating in the offering will arrange for you to get the prospectus if you request it by calling Goldman Sachs & Co. LLC at 1-866-471-2526 or Wells Fargo Securities, LLC at 1-800-326-5897.
CRZO 3 3
Forward Looking Statements / Note Regarding Reserves
This presentation contains statements concerning the Company’s intentions, expectations, beliefs, projections, assessments of risks, estimations, plans or predictions for the future, objectives, goals, strategies, future events or performance and underlying assumptions and other statements that are not historical facts. These statements are “forward-looking statements” within the meaning of the Private Securities Litigation Reform Act of 1995. The forward-looking statements in this presentation include, but are not limited to, statements relating to the Company’s business and financial outlook, cost and risk profile of oil and gas exploration and development activities, strategic initiatives, quality and risk profile of Company’s assets, liquidity and the ability to finance exploration and development activities, including accessibility of borrowings under the Company’s revolving credit facility, guidance, asset dispositions, commodity price risk management activities and the impact of our average realized prices, growth strategies, ability to explore for and develop oil and gas resources successfully and economically, estimates and forecasts of the timing, number, profitability and other results of wells we expect to drill and other exploration activities, drilling inventory, downspacing, infill drilling and completion optimization results, estimates regarding timing and levels of production or reserves, estimated ultimate recovery, the Company’s capital expenditure plan and allocation by area, cost reductions and savings, efficiency of capital, the price of oil and gas at which projects break-even, future market conditions in the oil and gas industry, ability to make, integrate and develop acquisitions and realize any expected benefits or effects of completed acquisitions, midstream arrangements and agreements, gas marketing strategy, lease terms, expected working or net revenue interests, the ability to adhere to our drilling schedule, acquisitions and divestitures of acreage, including number, timing and size of projects and effects on our cash flows, planned evaluation of prospects, probability of prospects having oil and gas, working capital requirements, liquids weighting, rates of return, net present value, exploration and development plans, any other statements regarding future operations, financial results, business plans and cash needs and all other statements that are not historical facts. Statements in this presentation regarding availability under our revolving credit facility are based solely on the current borrowing base commitment amount and amounts outstanding on such date. The amounts we are able to borrow under the revolving credit facility are subject to, and may be less due to, compliance with financial covenants and other provisions of the credit agreement governing our revolving credit facility. You generally can identify forward-looking statements by the words “anticipate,” “believe,” budgeted,” “continue,” “could,” “estimate,” “expect,” “forecast,” “goal,” “intend,” “may,” “objective,” “plan,” “potential,” “predict,” “projection,” “possible,” “scheduled,” “should,” “guidance,” or other similar words. Such statements rely on assumptions and involve risks and uncertainties, many of which are beyond our control, including, but not limited to, those relating to a worldwide economic downturn, availability of financing, the Company’s dependence on its exploratory drilling activities, the volatility of and changes in oil and gas prices, the need to replace reserves depleted by production, operating risks of oil and gas operations, the Company’s dependence on key personnel, factors that affect the Company’s ability to manage its growth and achieve its business strategy, results, delays and uncertainties that may be encountered in drilling, development or production, interpretations and impact of oil and gas reserve estimation and disclosure requirements, activities and approvals of our partners and parties with whom we have alliances, technological changes, capital requirements, the timing and amount of borrowing base determinations (including determinations by lenders) and availability under our revolving credit facility, evaluations of us by lenders under our revolving credit facility, waivers or amendments under the Company’s revolving credit facility in connection with acquisitions, including the acquisition from ExL Petroleum Management, LLC (the “ExL Acquisition”), other actions by lenders and holders of the Company’s capital stock, the potential impact of government regulations, including current and proposed legislation and regulations related to hydraulic fracturing, oil and natural gas drilling, air emissions and climate change, regulatory determinations, litigation, competition, the uncertainty of reserve information and future net revenue estimates, integration and other acquisition risks, failure to enter into any agreements for such asset sales or to consummate such transactions, the Company’s inability to sell certain assets, availability of equipment and crews, actions by midstream and other industry participants, weather, our ability to obtain permits and licenses, the results of audits and assessments, the failure to obtain certain bank and lease consents, the existence and resolution of title defects, new taxes and impact fees, delays, costs and difficulties relating to our joint ventures, failure of the ExL Acquisition, market conditions and other factors affecting the Company’s ability to complete the Company’s strategic initiatives, financing of the ExL Acquisition, actions by joint venture parties, results of exploration activities, the availability, market conditions, and completion of land acquisitions and dispositions, cost of oilfield services and equipment, completion and connection of wells, and other factors detailed in the “Risk Factors” and other sections of the Company’s Annual Report on Form 10-K for the year ended December 31, 2016 and other filings with the SEC. Should one or more of these risks or uncertainties materialize, or should underlying assumptions prove incorrect, actual outcomes may vary materially from those indicated. Each forward-looking statement speaks only as of the date of the particular statement or, if not stated, the date printed on the cover of the presentation. When used in this presentation, the word “current” and similar expressions refer to the date printed on the cover of the presentation. Each forward-looking statement is expressly qualified by this cautionary statement, and the Company undertakes no obligation to update or revise any forward-looking statement, whether as a result of new information, future events or otherwise. All subsequent written and oral forward-looking statements attributable to us or persons acting on our behalf are expressly qualified in their entirety by reference to these risks and uncertainties. You should not place undue reliance on forward-looking statements. The information contained in this presentation does not purport to be all-inclusive or to contain all information that potential investors may require. We may use certain terms such as “EUR”, “Resource Potential”, “Net Undrilled Resource Potential” and “Net Unbooked Reserve Potential” that the SEC’s guidelines strictly prohibit us from including in filings with the SEC. Our Probable (2P) and Possible (3P) reserves do not meet SEC rules and guidelines (including those relating to pricing) for such reserves. These terms include reserves with substantially less certainty, and no discount or other adjustment is included in the presentation of such reserve numbers. U.S. investors are urged to consider closely the disclosure in our Form 10-K for the year ended December 31, 2016, File No. 000-29187-87, and in our other filings with the SEC, available from us at 500 Dallas, Suite 2300, Houston, Texas, 77002. These forms can also be obtained from the SEC by calling 1-800-SEC-0330

CRZO 4
The New Carrizo Strategic Initiatives to High-Grade Portfolio for Long-Term Profitability
2017 Strategic Initiatives
High quality asset positions of scale, concentrated in the core of the Eagle Ford Shale (~103k net acres) and Delaware Basin (~43k net acres)
Acquire 16,488 highly contiguous net acres in the heart of the Delaware Basin for $648 million(1)
Current production of ~8,000 net Boe/d (48% oil / 67% liquids)
Potential for decades of drilling locations across multiple stacked pay horizons
Monetize non-core assets through an ongoing divestiture program to streamline operations across two assets
Execute on pro-forma drilling program in top-tier oil plays with high IRRs designed to deliver substantial growth and long-term profitability
(1) Excludes additional contingent purchase consideration (up to $125 million total) payable in 2018, 2019, 2020 and 2021 based on annual average WTI price over $50/bbl.

CRZO 5 5
Acquisition Meets Selective Carrizo Criteria
Criteria Benchmark
Superior Rock Quality Core positions likely remain on the low end of the cost curve
Favorable liquids mix
Strong Well Control / Multiple De-risked Zones
Provides a meaningful base of production and cash flow
Provides a deep inventory of de-risked drilling locations that can support a large-scale development
Multiple Upside Zones / Inventory Expansion
Opportunities
Upside targets have the potential to add decades of drilling inventory to the portfolio
Contiguous Acreage Blocky acreage position that allows for efficient development
Enhanced economics from long-laterals
High Rate-of-Return Inventory
Competes with current Carrizo inventory economics
Additional upside potential through completion optimization and drilling efficiencies

CRZO 6
Acquisition Overview Transformative Acquisition in the Heart of the Delaware Basin
Highly contiguous acreage position in the core of the Delaware Basin
Impressive well results both on-lease and from offset operators
Blocky acreage supports efficient and economically-enhanced long-lateral development
Offset by high-quality operators including APC, CDEV, CXO, DVN, NBL, OXY, and PDCE
Substantial near-term production growth
11 operated horizontal wells currently producing with 7 additional horizontal wells in progress
Development plan assumes 3 operated rigs on acquired properties
More than 3,800 feet of stacked pay targeting up to 10 zones
Initial development has focused on the Wolfcamp A, Upper Wolfcamp B, and Lower Wolfcamp B
Future targets include the Avalon, 1st Bone Spring, 2nd Bone Spring, 3rd Bone Spring, Wolfcamp X/Y, Wolfcamp C, and Wolfcamp D
Significant inventory of highly economic drilling locations
Potential for decades of drilling locations across multiple stacked pay horizons
Projected weighted-average single well EURs of ~1,300 – 1,500 Mboe and IRRs that compete with Carrizo’s existing inventory
Acquisition Overview Gross Acres 23,656
Net Acres 16,488
% Operated ~95%
% Average Working Interest ~70%
Current Production (boe/d) ~8,000
Current Production % Oil / % Liquids 48% / 67%

CRZO 7 7
$20.9k
$22.3k
$27.5k
$30.2k
$34.0k
$34.9k
$40.6k
$45.7k
G
Carrizo / ExL
F
E
D
C
B
A
Attractive Valuation for Core Delaware Basin Acreage $ / Adjusted Net Acre(1)
Source: Company investor presentations, press releases, and public filings. (1) Transaction values adjusted for $35,000 per flowing boepd acquired for comparative purposes. (2) Acquisition value does not include contingent payments.
CPE / Ameredev FANG / Brigham Oxy / J. Cleo RSPP / Silver Hill Silver Run / Centennial WPX / Panther Centennial/Silverback Carrizo / ExL
(2)

CRZO 8
Significant Multi-Zone Potential High-Quality Stacked Pay with Large Inventory Upside
*Formations not drawn to scale.
Acreage contains up to 10 potential targets across a 3,800-ft. section from the Avalon through the Wolfcamp D
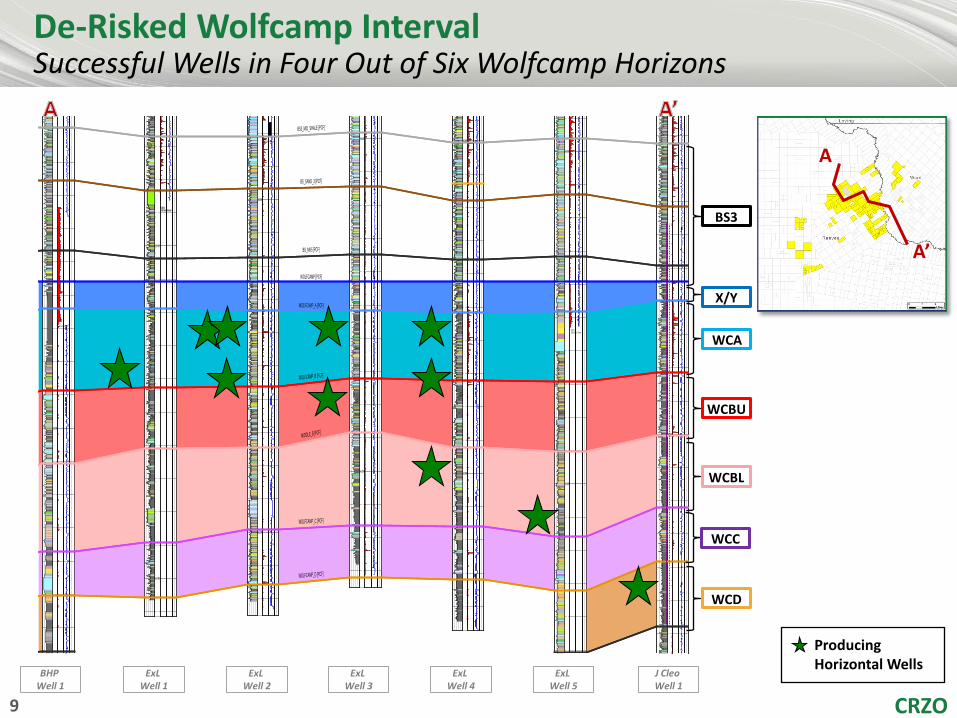
4 of 6 target Wolfcamp horizons have been successfully tested with horizontal drilling on the acquired assets
Offset production has been established in the 3rd Bone Spring and Wolfcamp C
More than 350 net potential locations identified across the 3 de-risked zones with the most well control
Inventory count assumes 8 wells per section (660 ft. spacing) in the Wolfcamp A, Upper Wolfcamp B, and Lower Wolfcamp B
Significant inventory upside potential exists from additional zones and future downspacing Producing Horizon
Upside Horizon
1st Bone Spring
2nd Bone Spring
3rd Bone Spring
Wolfcamp X/Y
Wolfcamp A
Upper Wolfcamp B
Wolfcamp C
Wolfcamp D
Lower Wolfcamp B
Avalon
70 - 120
200 - 225
190 - 230
200 - 260
150 - 170
225 - 300
Gross Section Thickness
(ft.)
550 - 600
600 - 700
350 - 450
650 - 750
CRZO 9
A
A’
11000
10000
11000
10000
11000
10000
11000
10000
11000
10000
11000
11000
BS3_MID_SHALE [PCF]
BS_SAND_3 [PCF]
BS_MK5 [PCF]
WOLFCAMP [PCF]
WOLFCAMP_A [PCF]
WOLFCAMP_B [PCF]
MIDDLE_B [PCF]
WOLFCAMP_C [PCF]
WOLFCAMP_D [PCF]
7 IN615 Sacks of Cement
9 5/8 IN2060 Sacks of Cement9 5/8 IN2060 Sacks of Cement
9 5/8 IN2100 Sacks of Cement
9 5/8 IN2585 Sacks of Cement
De-Risked Wolfcamp Interval Successful Wells in Four Out of Six Wolfcamp Horizons
BHP Well 1
ExL Well 1
ExL Well 2
ExL Well 3
ExL Well 4
ExL Well 5
J Cleo Well 1
WCA
WCBU
WCBL
WCC
WCD
BS3
X/Y
Producing Horizontal Wells

CRZO 10
Source: Company investor presentations, press releases, and public filings. Note: DSU = Drill Site Unit
Material Inventory Expansion Opportunities Offset Operators are Targeting Multiple Horizons
APC CDEV CXO DVN EGN FANG JAG NBL OXY PDCE
Brushy Canyon P P Y
Avalon Shale Y P P P
P P
1st Bone Spring Sand P Y
P
P P P
2nd Bone Spring Shale Y Y Y P P
2nd Bone Spring Sand P P Y
3rd Bone Spring Carb Y
P Y Y Y Y Y P
3rd Bone Spring Sand Y Y
Upper (XY) / Wolfcamp A
Y
Y
Y
Y
Y Y
Y
Y
Y Y
Middle Wolfcamp A Y P
Lower Wolfcamp A Y P Y
Upper Wolfcamp B Y Y P Y Y Y Y Y
Lower Wolfcamp B Y
Wolfcamp C Y Y P
P Y Y
Wolfcamp D / Cline P
Development Zones 3 3 5 6 3 4 4 4 4 4 3
Total Potential Zones 10 9 5 7 6 9 6 8 6
Potential Wells/DSU 24+ 26+ 30+ 25+ 25+ 29+ 36 28+
Current Development Zone Potential Zone

CRZO 11
Acreage Located in an Excellent Neighborhood Strong Well Results Announced by ExL and Offset Operators
Source: Company investor presentations, press releases, public filings and Drilling Info. Note: Production shown is 2-stream.
PDC Argentine 30-day rate: 1,222 Boe/d
(72% oil)
CDEV Parker 30-day rate: 1,411 Boe/d
(75% Oil)
EOG State Firefly 30-day rate: 1,794 Boe/d
(55% oil)
CDEV Pop 30-day rate: 2,463 Boe/d
(49% Oil)
CDEV Admiral 30-day rate: 1,502 Boe/d
(61% Oil)
ExL Fox 30-day rate: 1,647 Boe/d
(57% oil)
ExL State CVX 30-day rate: 1,494 Boe/d
(48% oil)
ExL Womac 15-day rate: 1,606 Boe/d
(66% oil)
CDEV Iceman IP: 1,411 Boe/d
(75% oil)
APC Nancy Couch 30-day rate: 1,329 Boe/d
(72% oil)
APC Ruck 30-day rate: 1,357 Boe/d
(70% oil)
APC Irene 30-day rate: 1,229 Boe/d
(68% oil)
ExL Woodson 30-day rate: 1,725 Boe/d
(62% oil)
ExL Zeman 15-day rate: 1,725 Boe/d
(64% oil)
PDC Keyhole 30-day rate: 1,522 Boe/d
(69% oil)
CDEV Folk Rolwing 30-day rate: 1,464 Boe/d
(38% Oil)
ExL Grady State 30-day rate: 1,657 Boe/d
(60% oil)
Producing Horizontal Well

CRZO 12 CRZO 12 12 CRZO 12
0
30,000
60,000
90,000
120,000
150,000
0 3 6 9 12 15 18 21 24 27 30 33 36 39 42 45 48
Cum
ulat
ive
Prod
uctio
n (B
oe)
Months on Production
2013 2014 2015 2016
Improving Well Results Over Time
Source: IHS. Note: Well results normalized to 7,000 ft. effective lateral length, and exclude downtime months.
More recent wells yielding substantially higher recoveries through drilling and completion optimization
Increased proppant loading
Shorter frac intervals
Increased slickwater design
Refined understanding of landing zones
Incorporation of seismic data
Location of Wells Drilled by Year
Cumulative Production Performance by Year
53% Uplift 51% Uplift
48% Uplift

CRZO 13 13
Acquisition Type Curves & Well Economics
(1) Economics are three stream and based on NYMEX prices and include $3.00/Mcf gas price, $3.00/Bbl deduct for oil, $0.25/Mcf deduct for gas, NGL pricing 43% of oil price.
(2) Water disposal is assumed to be $0.75/bbl. (3) Total well cost includes ~$450K for allocated infrastructure.
Type Curve Wtd. Avg. WCA
Wtd. Avg. WCB
Total Well Cost $8.1 MM $8.1 MM
Frac Stages 42 42
Lateral Length 7,000 ft. 7,000 ft.
EUR
Gross 1,539 Mboe 1,272 Mboe
Oil Only 833 Mbo 648 Mbo
Net 1,154 Mboe 954 Mboe
F&D Cost $7.02 / Boe $8.49 / Boe
IRR &
NPV (1)
$65 Oil IRR >150% 94%
NPV $14.7 MM $10.4 MM
$55 Oil IRR 86% 58%
NPV $10.9 MM $7.3 MM
$45 Oil IRR 50% 33%
NPV $7.0 MM $4.1 MM
NYMEX NPV10 Breakeven $27 $32
0
200
400
600
800
1,000
1,200
1,400
1,600
1,800
2,000
0
500
1,000
1,500
2,000
2,500
3,000
3,500
4,000
4,500
5,000
0 2 4 6 8 10 12 14 16 18 20 22 24
Cum
ulat
ive
Wet
Gas
-M
MCF
Wet
Gas
-M
CFD
Producing Months
WCA Daily Wet Gas WCB Daily Wet GasWCA Cumulative Wet Gas WCB Cumulative Wet Gas
0
50
100
150
200
250
300
350
0
200
400
600
800
1,000
1,200
1,400
0 2 4 6 8 10 12 14 16 18 20 22 24
Cum
ulat
ive
Oil
-MBO
Oil
-BO
PD
Producing Months
WCA Daily Oil WCB Daily OilWCA Cumulative Oil WCB Cumulative Oil

CRZO 14 14
91
6
75
17
Eagle Ford Shale Delaware Basin
85
5
84
17
Eagle Ford Shale Delaware Basin
2017 Development Program Update
Note: Delaware Basin includes Carrizo’s legacy position plus ExL acquisition. Updated guidance pro forma for ExL acquisition (anticipated closing in mid-August); does not assume any asset sales. (1) 2017 DC&I capital update represents midpoint of guidance range of $620-$640 million. (2) Prior Q2 2017 and FY 2017 guidance provided on May 9, 2017.
Net
Wel
ls D
rille
d N
et W
ells
Fra
c’d
2017 DC&I Capital Update (1)(2)
($ millions) Prior Updated
Eagle Ford D&C $410 $395
Delaware Basin D&C $45 $150
Other D&C $30 $25
Pipeline & Infrastructure $55 $60
Total DC&I $540 $630
2017 Production Update (2)
Prior Guidance (2) Updated Guidance
Q2 2017 FY 2017 Q2 2017 FY 2017
Crude Oil (Bbls/d)
31,800-32,200 32,400-32,700 33,600-33,700 35,700-36,000
NGLs (Bbls/d)
4,800-5,000 5,300-5,500 4,700-4,800 5,900-6,100
Natural Gas (Mcf/d)
67,000-71,000 71,000-75,000 71,000-73,000 80,000-84,000
Total Equivalent (Boe/d)
47,767-49,033 49,533-50,700 50,133-50,667 54,933-56,100
~90% Drilling &
Completion
Prior Updated
Prior Updated