carrots: an economic assessment of the feasibility of ... · of providing multiple-peril crop...
TRANSCRIPT

Carrots: An Economic Assessment of the Feasibilityof Providing Multiple-Peril Crop Insurance
Prepared by the Economic Research Service, USDAin cooperation with the University of California
for the Federal Crop Insurance Corporation
June 27, 1994
Contributors: Diane Bertelsen (202) 219-0883Robert Dismukes (202) 219-0840Joy Harwood (202) 219-0840Fred Hoff (202) 219-0883Hyunok Lee (916) 752-3508Agapi Somwaru (202) 219-0812Glenn Zepp (202) 219-0883Annette Clauson, coordinator (202) 219-0883

Table of Contents
Executive Summary . . . . . . . . . . . . . . . . . . . . 4
Introduction . . . . . . . . . . . . . . . . . . . . . . 6
The Carrot Market . . . . . . . . . . . . . . . . . . . . 6Supply . . . . . . . . . . . . . . . . . . . . . . . 6Demand . . . . . . . . . . . . . . . . . . . . . . . 10Prices . . . . . . . . . . . . . . . . . . . . . . . 12
Industry Characteristics . . . . . . . . . . . . . . . . 12Carrot Farms . . . . . . . . . . . . . . . . . . . . 16Income Diversification on Carrot Farms . . . . . . . 16
Cultivation and Management Practices . . . . . . . . . . 22Climate . . . . . . . . . . . . . . . . . . . . . . 22Soils . . . . . . . . . . . . . . . . . . . . . . . 22Cultural Practices . . . . . . . . . . . . . . . . . 22
Harvesting and Packing . . . . . . . . . . . . . . . . . 25
Marketing . . . . . . . . . . . . . . . . . . . . . . . . 27
Production Costs . . . . . . . . . . . . . . . . . . . . 28
Production Perils . . . . . . . . . . . . . . . . . . . . 28Freeze . . . . . . . . . . . . . . . . . . . . . . . 28Excessive Rain . . . . . . . . . . . . . . . . . . . 28Hail . . . . . . . . . . . . . . . . . . . . . . . . 32Excessive Heat . . . . . . . . . . . . . . . . . . . 32Drought . . . . . . . . . . . . . . . . . . . . . . 32Wind . . . . . . . . . . . . . . . . . . . . . . . . 32Nematodes . . . . . . . . . . . . . . . . . . . . . 32Insects . . . . . . . . . . . . . . . . . . . . . . 33Diseases . . . . . . . . . . . . . . . . . . . . . . 33Weeds . . . . . . . . . . . . . . . . . . . . . . . 33
State Analyses . . . . . . . . . . . . . . . . . . . . . 33Arizona . . . . . . . . . . . . . . . . . . . . . . 33California . . . . . . . . . . . . . . . . . . . . . 34Colorado . . . . . . . . . . . . . . . . . . . . . . 41Florida . . . . . . . . . . . . . . . . . . . . . . 41Michigan . . . . . . . . . . . . . . . . . . . . . . 42Minnesota . . . . . . . . . . . . . . . . . . . . . 44New York . . . . . . . . . . . . . . . . . . . . . . 46New Jersey . . . . . . . . . . . . . . . . . . . . . 46Oregon . . . . . . . . . . . . . . . . . . . . . . . 46Texas . . . . . . . . . . . . . . . . . . . . . . . 46

Washington . . . . . . . . . . . . . . . . . . . . . 47Wisconsin . . . . . . . . . . . . . . . . . . . . . 48
Ad Hoc Disaster Assistance for Carrots . . . . . . . . . 50
Carrot Insurance Implementation Issues . . . . . . . . . 52Crop Abandonment . . . . . . . . . . . . . . . . . . 52Setting Reference Prices . . . . . . . . . . . . . . 54Multiple Harvests on a Unit . . . . . . . . . . . . 54Estimating "Appraised Production" . . . . . . . . . 55Moral Hazard . . . . . . . . . . . . . . . . . . . 55Individual Yield Data . . . . . . . . . . . . . . . 55Quality Losses and Indemnity Payments . . . . . . . 56Demand for Insurance . . . . . . . . . . . . . . . . 56
References . . . . . . . . . . . . . . . . . . . . . . . 57

4
Executive Summary
Carrots are grown year-round in the United States, with California accountingfor 58 percent of production in 1993. Although far distant in magnitude toCalifornia, other states reporting sizeable carrot production includeWashington, Michigan, Wisconsin, Texas, Florida, and Colorado.
The total value of the U.S. carrot crop in 1993 was approximately $292million. About 10 percent of that total represents processed carrots; theremainder is the value of fresh carrots. Carrots are machine-harvested, andcan be stored for several weeks after harvest.
Carrot production for both the fresh and processing markets increased duringthe 1970's and 1980's and has generally increased during the 1990's. Withapproximately one-third of the market for processed carrots and two-thirds forfresh carrots, 1992 production was at a record high of 3,324.1 million pounds. Production for 1993 was estimated at 3,223.1 and 1994 production is forecastat a lower 3,110 million pounds.
Most carrots are produced for the U.S. domestic market. Slightly more carrotsare exported than are imported, with most of the trade taking place withCanada and Mexico. Because carrots can be stored for up to four or six monthsfor fresh use, the supply of carrots is less weather sensitive than that ofother perishable vegetables, such as lettuce.
Different varieties of carrots are usually planted depending on their expecteduse in either the fresh or processing markets. However, carrots which fail tomeet fresh market standards may occasionally be diverted for processing use. Processing carrots tend to have higher per acre yields than those destined forfresh market use because all carrots, including the cull carrots, areacceptable for processing. However, processing carrot prices are generallyabout one-third fresh-market carrot prices.
Carrots are a cool-season crop and can be grown virtually anywhere providedthe growing season remains relatively cool. The optimum temperature range is60 to 70 degrees F. When the air temperature rises above 82 degrees F, plantemergence is poor, top growth is reduced, yields are depressed, and the rootsmay become strong-flavored. Also, high temperatures increase the woodycharacter and coarseness of the root flesh. Conversely, if the airtemperature during the early vegetative period falls below the optimum, longslender roots of much lighter color than typical and unwanted flower stalks(bolters) will appear.
The natural perils that are most likely to result in yield losses vary fromarea to area and depend partly on the time of year that the production andharvesting activities are occurring. The greatest perils in many states arenematodes and diseases. In the northern carrot-growing states, freeze damageat planting or harvesting and lack of water in the nonirrigated areas are

5
major concerns. Other natural hazards in carrot production include insectdamage, physiological disorders, and fungus-induced forking of the root.
Overall, contacts in carrot-growing areas indicated that the natural perilsconfronting carrots are not generally as severe as for lettuce, celery, andcertain other vegetable crops. Because carrots can be at times "stored in theground" for several weeks upon maturity, timely harvesting is not as great aconcern. Further, carrots are storable over fairly lengthy periods afterharvest. Because of their storability, price risks and price variability arenot as important to the grower as for lettuce and celery.
Ad hoc disaster data can be used to indicate which carrot-producing areas havereceived large payments relative to their production. For example, Californiaaccounted for about 57 percent of total U.S. carrot harvested acreage between1988-93, but received only 4 percent of the payments made for carrots overthat period. Similarly, Florida accounted for an average 9 percent ofharvested acreage, and received virtually no carrot disaster assistancepayments over the same period.
In contrast, Michigan and Ohio collected a high proportion of paymentsrelative to production. Michigan accounted for 7 percent of U.S. harvestedarea over the years 1988-93, and received 31 percent of total carrot payments. Likewise, Ohio had a very small harvested area, and collected 11 percent ofcarrot disaster payments. Payments were made to at least one Michigan carrotgrower in each of the 6 years. The maximum collected in any year in Michiganwas $1.1 million (in 1989). In four of the six years, over $350,000 was paidin that state.
These data suggest that, under a potential carrot policy, the probability ofyield losses for carrots in the Michigan-Ohio is considerably greater than inCalifornia and Florida. Extension contacts in Michigan indicate that, inrecent years, either too much or too little rain has been a serious problemresulting in yield losses.
Insurance issues addressed in this report include the possibility of multipleharvests on a unit in several states, and the potential demand for insurance. Demand for insurance may be strongest, as a percent of total carrot acres andof carrot growers, in the northern Midwest area. In this area, not all acresare irrigated, and growers tend to be smaller and less diversified than inCalifornia and other major carrot production states.

6
Carrots: An Economic Assessment of the Feasibility of Providing Multiple-Peril Crop Insurance
Introduction
Carrots are grown year-round in the United States, with California accountingfor 58 percent of production in 1993 (USDA, NASS). Although far distant inmagnitude to California, other states reporting sizeable carrot productioninclude Washington, Michigan, Wisconsin, Texas, Florida, and Colorado.
The total value of the U.S. carrot crop in 1993 was approximately $292million. About 10 percent of that total represents processed carrots; theremainder is the value of fresh carrots. Carrots are machine-harvested, andcan be stored for several weeks.
This report examines those aspects of the industry that relate to the demandfor crop insurance and the feasibility of developing a carrot insurancepolicy. Insurance issues include: quality loss considerations, thepossibility of multiple harvests on a unit in several states, and thepotential demand for insurance.
The Carrot Market
Supply
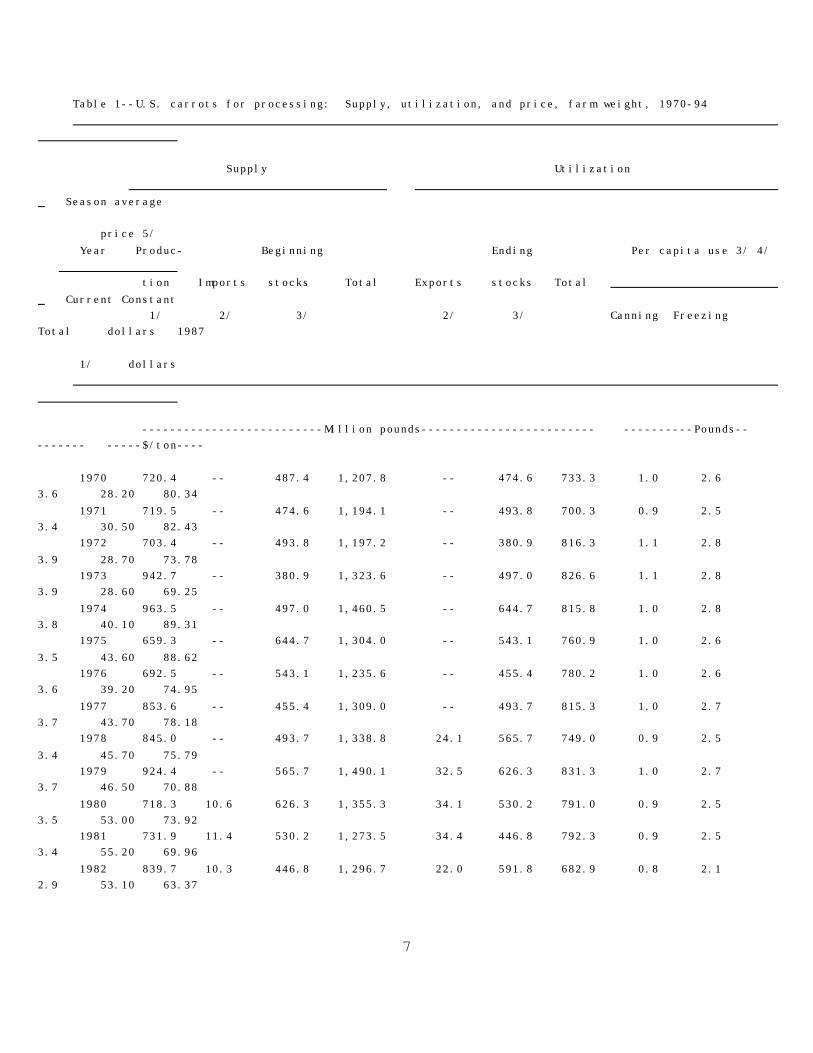
Carrot production for both the fresh and processing markets increased duringthe 1970's and 1980's and has generally increased during the 1990's. Withapproximately one-third of the market for processed carrots (Table 1) and two-thirds for fresh carrots (Table 2), 1992 production was at a record high of3,324.1 million pounds. Production for 1993 was estimated at 3,223.1 and 1994production is forecast at a lower 3,110 million pounds.
Most carrots are produced for the U.S. domestic market. Slightly more carrotsare exported than are imported, with most of the trade taking place withCanada and Mexico. Because carrots can be stored for up to four or six monthsfor fresh use, the supply of carrots is less weather sensitive than that ofother perishable vegetables, such as lettuce.
California is by far the major carrot producing state (Table 3). The NationalAgricultural Statistics Service (NASS) collects data for 13 carrot producingstates, with California accounting for 58 percent of production in 1993. California has many climatic zones that provide near optimal conditions forcarrot production in one district or another throughout the year. Unlikeother states, California produces carrots in roughly equal quantities everymonth of the year.
7
Table 1--U.S. carrots for processing: Supply, utilization, and price, farm weight, 1970-94
Supply Utilization Season average price 5/ Year Produc- Beginning Ending Per capita use 3/ 4/ tion Imports stocks Total Exports stocks Total Current Constant 1/ 2/ 3/ 2/ 3/ Canning Freezing Total dollars 1987 1/ dollars
--------------------------Million pounds------------------------- ----------Pounds--------- -----$/ton----
1970 720.4 -- 487.4 1,207.8 -- 474.6 733.3 1.0 2.6 3.6 28.20 80.34 1971 719.5 -- 474.6 1,194.1 -- 493.8 700.3 0.9 2.5 3.4 30.50 82.43 1972 703.4 -- 493.8 1,197.2 -- 380.9 816.3 1.1 2.8 3.9 28.70 73.78 1973 942.7 -- 380.9 1,323.6 -- 497.0 826.6 1.1 2.8 3.9 28.60 69.25 1974 963.5 -- 497.0 1,460.5 -- 644.7 815.8 1.0 2.8 3.8 40.10 89.31 1975 659.3 -- 644.7 1,304.0 -- 543.1 760.9 1.0 2.6 3.5 43.60 88.62 1976 692.5 -- 543.1 1,235.6 -- 455.4 780.2 1.0 2.6 3.6 39.20 74.95 1977 853.6 -- 455.4 1,309.0 -- 493.7 815.3 1.0 2.7 3.7 43.70 78.18 1978 845.0 -- 493.7 1,338.8 24.1 565.7 749.0 0.9 2.5 3.4 45.70 75.79 1979 924.4 -- 565.7 1,490.1 32.5 626.3 831.3 1.0 2.7 3.7 46.50 70.88 1980 718.3 10.6 626.3 1,355.3 34.1 530.2 791.0 0.9 2.5 3.5 53.00 73.92 1981 731.9 11.4 530.2 1,273.5 34.4 446.8 792.3 0.9 2.5 3.4 55.20 69.96 1982 839.7 10.3 446.8 1,296.7 22.0 591.8 682.9 0.8 2.1 2.9 53.10 63.37

8
1983 787.1 11.9 591.8 1,390.8 12.1 664.4 714.3 0.8 2.2 3.0 57.40 65.83 1984 799.0 13.2 664.4 1,476.7 15.0 521.0 940.7 1.1 2.9 4.0 61.90 68.02 1985 742.7 16.3 521.0 1,280.1 10.1 514.0 756.1 0.9 2.3 3.2 63.70 67.48 1986 747.9 19.3 514.0 1,281.2 11.0 552.7 717.5 0.8 2.2 3.0 61.30 63.26 1987 782.4 15.4 552.7 1,350.6 15.2 576.7 758.7 0.8 2.3 3.1 58.20 58.20 1988 763.2 14.4 576.7 1,354.3 32.9 473.9 847.4 0.9 2.5 3.5 65.20 62.75 1989 917.4 21.6 473.9 1,413.0 2.8 533.0 877.1 1.0 2.6 3.5 60.30 55.58 1990 883.2 21.3 533.0 1,437.5 7.2 603.2 827.1 0.9 2.4 3.3 64.90 57.28 1991 860.0 15.4 603.2 1,478.7 9.3 550.4 919.0 1.0 2.7 3.6 64.20 54.55 1992 1,076.8 22.9 550.4 1,650.1 4.5 736.5 909.1 1.0 2.6 3.6 69.30 57.23 1993 986.5 21.2 736.5 1,744.3 7.3 659.0 1,078.0 1.1 3.0 4.2 71.70 57.73 1994f 975.0 20.0 659.0 1,654.0 7.0 647.4 999.6 1.0 2.8 3.8 -- -- -- = Not available. f = ERS forecast. 1/ Source: USDA, National Agricultural Statistics Service. 2/ U.S. Dept. of Commerce, Bureau ofthe Census. All product-weight data was converted to a fresh weight basis--canned factoris 1.333 and frozen factor is 1.82. 3/ Source: Based on data from the National Food ProcessorsAssociation and USDA, NASS. 4/ Total utilization is allocated between canning and freezingbased on distributions estimated by ERS. 5/ Constant dollar prices for processing carrots were calculated using the GDP implicit price deflator, 1987=100.

9
Table 2--U.S. fresh carrots: Supply, utilization, and price, farm weight, 1970-94
Supply Utilization Season average price 3/ Year Produc- Per
tion Imports Total Exports Total capita Current Constant 1/ 2/ 2/ use dollars 1987 1/ dollars
-----------------------Million pounds-------------------- Pounds ------$/cwt------ 1970 1,218.2 56.2 1,274.4 50.6 1,223.8 6.0 7.18 20.46 1971 1,287.1 52.6 1,339.7 69.6 1,270.1 6.1 7.21 19.49 1972 1,402.1 51.0 1,453.1 80.2 1,372.9 6.5 7.20 18.51 1973 1,435.7 48.0 1,483.7 63.3 1,420.5 6.7 7.66 18.55 1974 1,473.9 70.1 1,544.0 65.9 1,478.1 6.9 9.38 20.89 1975 1,423.9 60.8 1,484.7 93.0 1,391.7 6.4 8.08 16.42 1976 1,399.7 67.3 1,467.0 69.3 1,397.7 6.4 11.20 21.41 1977 1,216.3 72.6 1,288.9 119.4 1,169.5 5.3 10.00 17.89 1978 1,213.1 72.3 1,285.4 103.4 1,182.0 5.3 10.60 17.58 1979 1,330.8 94.8 1,425.6 100.5 1,325.1 5.9 11.30 17.23 1980 1,393.2 108.7 1,501.9 101.2 1,400.7 6.2 12.30 17.15 1981 1,463.2 87.9 1,551.1 144.0 1,407.1 6.1 11.70 14.83 1982 1,568.5 105.1 1,673.6 140.4 1,533.2 6.6 12.70 15.16 1983 1,523.4 126.7 1,650.1 129.5 1,520.6 6.5 14.40 16.51 1984 1,561.6 161.5 1,723.1 143.3 1,579.8 6.7 11.90 13.08 1985 1,534.5 147.8 1,682.3 134.4 1,547.9 6.5 13.20 13.98 1986 1,606.0 115.0 1,721.0 160.6 1,560.4 6.5 8.65 8.93 1987 2,089.6 98.8 2,188.4 174.1 2,014.3 8.3 10.80 10.80 1988 1,823.5 117.4 1,940.9 164.8 1,776.1 7.2 13.30 12.80 1989 1,981.3 123.6 2,104.9 162.3 1,942.6 7.9 13.60 12.53 1990 2,040.5 122.1 2,162.6 158.7 2,003.9 8.0 12.00 10.59 1991 1,928.8 137.0 2,065.8 179.1 1,886.7 7.5 14.60 12.40 1992 2,247.3 134.3 2,381.6 174.5 2,207.2 8.6 14.50 11.97 1993 2,236.6 121.4 2,358.0 186.5 2,171.5 8.4 11.90 9.58 1994f 2,135.0 130.0 2,265.0 180.0 2,085.0 8.0 -- --
-- = Not available. f = forecast. 1/ Source: USDA, National Agricultural Statistics Service. Production was adjusted by ERS for 1970-81 to account for States not included in NASS surveys. 2/ Source: U.S. Dept. ofCommmerce, Bureau of the Census. From 1978-89, exports were adjusted using Canadian import data. 3/ Constant dollar prices were calculated using the GDP implicit price deflator, 1987=100.

10
Note: Beginning with 1982, production is no longer adjusted since NASS acreage covers the Census of Agriculture area.

11
Table 3--Carrot acreage, production, and yield, 1991-93 1/
Area harvested Production Yield State 1991 1992 1993 1991 1992 1993 1991 1992 1993 ---------Acres---------- --------1,000 cwt------- --------Cwt--------
Arizona 1,000 1,500 1,400 160 233 238 160 155 170 California 56,000 60,000 58,000 15,680 18,000 18,560 280 300 320 Colorado 1,600 2,600 2,800 600 949 1,064 375 365 380 Florida 9,000 9,000 7,800 1,035 1,305 1,092 115 145 140
Michigan 6,800 6,700 7,200 1,700 2,278 2,016 250 335 280 Minnesota 1,800 2,200 1,400 549 748 308 305 340 220 New York 1,200 1,300 1,300 516 507 507 430 390 390 Oregon 1,800 2,100 1,400 918 1,113 728 510 530 520
Texas 6,300 6,800 6,500 1,260 1,190 1,138 200 175 175 Washington 6,800 7,400 7,600 3,400 4,218 4,408 500 570 580 Wisconsin 2900 3700 3,900 1,276 1,795 1,404 440 485 360 New Jersey and Ohio 2,300 1,900 2,400 794 905 768 345 476 320
U.S. 97,500 105,200 101,700 27,888 33,241 32,231 286 316 317
Source: 1993 Vegetable Summary. USDA, NASS. February 1994. 1/ Includes carrots for fresh market and processing.

12
Different varieties of carrots are usually planted depending on their expecteduse in either the fresh or processing markets. However, carrots which fail tomeet fresh market standards may occasionally be diverted for processing use. Processing carrots tend to have higher per acre yields than those destined forfresh market use because all carrots, including the cull carrots, areacceptable for processing. However, processing carrot prices are generallyabout one-third fresh-market carrot prices.
Fresh-market carrots are available year-round with no distinct peak inmarketings. The lowest volume is likely to be in the early summer. Carrotsfor the fresh market are usually sold topped, with the greenery removed. Asmall quantity is sold as bunched carrots, with their tops. Carrots sold withthe tops are more perishable and may be stored for only two weeks, whilecarrots for the fresh market can be kept for 4 to 6 months, under the righttemperature and humidity conditions.
Baby (or shortcut) carrots are a relatively new product. Although officialfigures are not available, sales have reportedly been successful. Babycarrots are either produced through dense planting and early harvest beforethey reach full size, or by cutting larger carrots to a smaller size. AMichigan processing plant obtains mature carrots from as far away asCalifornia for cutting into baby carrots. There is an increasing demand forbaby carrots in the processing market as well as the fresh market.
Most of the states growing carrots sell to both the fresh and processingmarkets (Table 4). States that sell only fresh market carrots includeArizona, Colorado, and Florida. States producing both fresh-market andprocessing carrots include California, Michigan, Minnesota, New Jersey, NewYork, Ohio, Oregon, Texas, Washington, and Wisconsin.
California is the largest shipper of fresh market carrots each month, with thelargest volume of shipments during May, June, and July. During these earlysummer months, certain other states have depleted their stored carrots fromthe previous fall harvest. At the same time, harvesting of carrots has notyet started, or is just beginning, in Colorado, Michigan, Minnesota, NewJersey, New York, Ohio, Oregon, and Washington.
Imported carrots are brought in throughout the year from Canada and Mexico. The heaviest Canadian shipments are from August through February and thelargest Mexican shipments occur from January through June. Small quantitiesof fresh carrots are also imported from Belgium, Israel, and Panama.
Demand
Carrots are a versatile vegetable and may be consumed raw, cooked, and incombination with other vegetables and meats in salads, fresh prepared foods,and frozen prepared foods. In 1992, the per capita consumption of freshcarrots in the U.S. was 8.6 pounds. Processed carrot consumption was 3.6pounds per person (Tables 1 and 2). While per capita consumption of processed

13
Table 4--Production and market value of sales on farms producing carrots, selected states, 1993 All principal Carrots, State Production Value Carrots, vegetables, percent ofprincipal total value total value vegetablesales Fresh market
1,000 cwt $ per cwt ---------1,000 dollars------- Percent
Arizona 238 11.30 2,689 382,467 1 California 16,560 11.20 185,472 3,186,224 6 Colorado 1,064 8.60 9,150 133,381 7 Florida 1,092 16.90 18,455 1,269,611 1 Michigan 1,275 12.30 15,683 134,268 12 Minnesota 66 10.00 660 2,252 29 New York 227 16.00 3,632 177,168 2 Oregon 304 23.10 7,022 145,343 5 Texas 618 14.60 9,023 270,048 3 Washington 808 13.60 10,989 155,129 7 New Jersey, Ohio, Wisconsin 114 21.70
U.S. 22,366 11.90 262,775 5,855,891 4
Processing market
Tons $ per ton ---------1,000 dollars------- Percent
California 100,000 97.00 9,700 557,089 2 Michigan 37,050 50.50 1,871 49,352 4 Minnesota 12,120 55.10 668 44,542 1 New York 14,000 52.00 728 41,088 2 Oregon 21,200 61.40 1,302 73,954 2 Texas 26,000 82.30 2,140 20,686 10 Washington 180,000 69.00 12,420 73,201 17 New Jersey, Ohio, Wisconsin 102,890 63.70 U.S. 493,260 71.70 28,829 859,912 3
Source: 1993 Vegetable Summary. USDA, NASS. February 1994.

14
carrots has remained steady since 1970, utilization of fresh carrots increased2.6 pounds per capita between 1970 and 1992.
Carrots are a good source of beta-carotene, which the body converts intovitamin A, as well as a source of calcium and phosphorus. Because of theirversatility, they can be eaten as an accompanying vegetable with almost anymeal or alone as a snack.
Statistical studies (both farm-gate and retail) of the demand relationshipbetween vegetable prices and quantities imply that the farm price for freshvegetables will rise (fall) by 2.2 to 2.3 percent when farm quantity falls(increases) by 1 percent (Wohlgenant). This may be a credible estimate forthe relationship between prices and quantities for carrots because they havecharacteristics comparable to a number of other fresh vegetables.
Prices
Even though price variability can be substantial, fresh-market carrot pricesare generally less variable than lettuce or celery prices. This is becausecarrots can be stored for longer periods of time and can be marketedthroughout the year.
Table 5 shows the monthly variability in grower prices for fresh marketcarrots for various years. Prices are highest during the late winter months,averaging $13 to $18 per hundredweight, when the supply of stored carrots fromthe fall harvest are depleted. They are generally lowest during the springand fall.
The market floor price in California is about $8 per hundredweight, based onestimated harvesting costs of $4 for a 50 pound container. Returns are lowerthan harvesting and marketing costs at prices lower than about $8.00 perhundredweight, and selling to the fresh market is unprofitable. The f.o.b.price hit the $8.00 floor in May 1990.
Between 1981 and 1992 the prices received by growers for carrots averagedlowest during April and October and highest during January. The wide bandencompassing one standard deviation on either side of the mean indicates thatthere is a lot of variation from year to year in seasonal prices, and thatprice peaks or price valleys may occur almost any month of the year.
Industry Characteristics
Those characteristics of the carrot industry which hold particularsignificance with respect to determining the potential demand for cropinsurance are: 1) a moderate degree of diversification between carrots andother farm enterprises, especially other vegetables, 2) limited incomediversification between farm and off-farm employment, and 3) widespread use ofirrigation in many states as a protection against drought. The primary source

15
Table 5--Carrots: U.S. f.o.b. prices received by growers for fresh market, monthlyaverages, 1989-93 Month 1989 1990 1991 1992 1993 ------------------------$/cwt------------------------
January 12.20 11.70 21.00 18.90 18.00February 13.00 12.80 13.70 17.10 13.10March 12.70 14.20 16.30 13.20 11.10April 15.10 9.80 13.80 12.80 12.60May 18.20 8.00 13.90 11.70 11.10June 18.60 10.20 11.10 10.80 10.20July 20.40 8.70 9.80 16.90 9.00August 11.00 9.00 10.60 16.60 10.00September 10.30 10.50 10.90 14.40 10.10October 10.20 9.90 11.40 12.80 10.20November 9.10 16.00 19.20 12.00 11.00December 10.60 16.60 17.80 13.80 11.10
Season 13.45 11.44 14.12 14.25 11.46
Source: USDA, NASS.

Results for the 1992 Census of Agriculture will become available inSeptember 1994.
16
of available information on farms producing carrots is the 1987 Census ofAgriculture.1
Carrot Farms
The U.S. Census of Agriculture reported 1,580 farms with sales of carrots in1987 (Appendix table 1). California had 16 percent of the farms and 42percent of the U.S. harvested carrot acreage in 1987. Florida had only 1.5percent of the farms but 12 percent of the acreage. Michigan, Texas, andWashington each had about 8 percent of the farms and 9 percent, 12 percent,and 6 percent of harvested acreage, respectively.
Many farms growing carrots in 1987 were large operations, with 41 percent(about 641) having total crop sales of $100,000 or more (Appendix table 2). In California, about half the farms with carrots reported crop sales of$500,000 or more, while only 20 percent had sales of less than $25,000. InTexas, 25 percent of the farms with carrots reported total crop sales of$500,000 or more and 69 percent had sales of $100,000 or more. States thathad the majority of their growers reporting crop sales of less than $25,000included Colorado, Minnesota, New York, and Washington.
The most common type of ownership of farms growing carrots was individual orfamily ownership (Appendix table 3). In most states, partnerships orcorporate arrangements (either family-held or other) were more common amongthe larger farms. Fifty-nine percent of the farms with sales of $100,000 ormore reported a partnership or corporate-type ownership.
Seventy-eight percent of the operators on all farms growing carrots reportedthat farming was their main occupation in 1987 (Appendix table 4). However,of operators on mid-sized farms, with sales between $25,000 to $100,000, onlyabout 14 percent indicated that farming was their main occupation. Incontrast, twenty-five percent of operators on small farms, reporting less than$25,000 in crop sales, indicated that farming was their main occupation. About forty percent of all farms reported an operator working off the farm atleast 1 day during the year.
In most states, the dollar value of carrot sales is a small percentage of thetotal dollar value of all principal vegetables (Table 4). In California,fresh market carrot sales account for only 6 percent of all principalvegetable sales and 2 percent of processing market sales. In Minnesota, wherefewer vegetables are grown because of a shorter growing season, carrot saleswere 29 percent of all fresh market vegetable sales in 1993.
Income Diversification on Carrot Farms
Diversification enhances the ability of carrot producers to manage risk. Themore diversified producers are between carrots and other enterprises, the
17
greater their ability to recover from a loss of carrot income with returnsfrom other crops.
Market sales for carrot growers are often diversified among carrots and othercrops, especially other vegetable crops. Of the $827.6 million in crop salesreported by farms growing carrots in the 1987 Census of Agriculture, $583.2million or 70 percent were from vegetable crops and melons, including carrots(Table 6). The Census does not report the sales of carrots or othervegetables separately. Therefore, the USDA's National Agricultural StatisticsService (NASS) estimate of the 1987 value of carrot production was used. TheNASS value of 1987 carrot production was $248.3 million or 30 percent of thetotal crop sales of farms growing carrots reported in the Census.
A more recent survey that included carrot growers also gives an indication ofcrop diversity on farms producing carrots. Carrot and vegetable growers in 10states took part in USDA's 1992 Vegetable Chemical Use Survey. In California,75 percent of the surveyed farms with carrots also grew other vegetables, andcarrots accounted for 39 percent of their total vegetable acreage (Table 7).
The Chemical Use Survey data were examined to assess the likelihood thatcarrot growers would be familiar with crop insurance. The variety of FCICinsurable crops grown by farms producing carrots may indicate carrot growers'familiarity with crop insurance. According to the Vegetable Chemical UseSurvey, 26 percent of the California farms growing carrots also grew onions,19 percent grew fresh market sweet corn, 15 percent grew sweet corn forprocessing, 7 percent grew fresh market tomatoes, and 20 percent grew tomatoesfor processing (Table 8).
These statistics do not provide any conclusive evidence of familiarity withcrop insurance, however, because the FCIC data show a participation rate ofjust one percent for fresh tomatoes in California, and 22 percent forprocessed tomatoes (Table 9). Furthermore, the data do not indicate whetheror not the insured tomato growers were the ones also growing carrots.
The practice of larger carrot producers, especially in California and Texaswhere carrots are planted and harvested throughout the year, of schedulingplanting and harvesting over a period of weeks or months effectively serves asa risk management technique. Insurable events, such as flooding and excessrain, usually destroy only that part of the crop in the field at the point intime when the event occurs. Losses, consequently, may represent only a smallpart of the grower's expected carrot sales for the year.
Drought is a risk on nonirrigated carrot acreage. The Census of Agricultureindicated 100 percent of the acreage in California, Colorado, Florida and NewMexico was irrigated in 1987, while more than 50 percent of the acreage wasirrigated in Michigan, New Jersey, Oregon, Texas, and Washington. Less than50 percent of the acreage was irrigated in Minnesota, New York, Ohio, andWisconsin (Appendix table 1). In certain states, such as Michigan, contactswith extension agents indicate that the use of irrigation on carrot acreagehas increased somewhat in recent years.

18
Table 6--Market value of sales on farms producing carrots, 1987
Value of sales State All All Vegetables products 1/ crops 1/ & melons 1/ Carrots 2/
----------------------Million dollars---------------------
Arizona 19.1 16.9 15.7 4.2California 443.5 438.6 306.0 160.8Colorado 6.4 6.3 5.6 3.4Florida 54.1 52.2 49.2 11.5Michigan 44.7 42.9 33.7 14.2Minnesota 11.8 11.5 7.5 3.2New York 16.2 14.9 10.3 5.6Oregon NR NR NR 3.4Texas 90.3 87.6 71.8 18.5Washington 34.3 30.8 21.0 10.8Wisconsin 24.2 23.3 16.3 10.5
U.S. 827.6 794.2 583.2 248.3
NR = not reported.
1/ U.S. Department of Commerce, Census of Agriculture, 1987.2/ 1989 Vegetable Summary. USDA, NASS. June 1990.

19
Table 7--Enterprise diversification on farms growing carrots, 1992 Farms Carrot farms growing Carrots, percent ofState sampled other vegetables total vegetable acreage
---Number--- ---Percent--- ---Percent---
Arizona 9 100 9California 89 75 39Florida 7 86 32Michigan 46 85 32New Jersey 16 100 36
New York 32 100 9Oregon 19 95 98Texas 26 81 22Washington 24 92 46Wisconsin 20 100 34
Source: USDA, Vegetable Chemical Use Survey, 1992.

20
Table 8--Insurable crops on farms producing carrots, 1992
Farms growing Farms State sampled Onions ---Sweet Corn--- ----Tomatoes---- Fresh Processed Fresh Processed Number -----------------------Percent--------------------
Arizona 9 89 0 0 0 0California 89 26 19 15 7 20Florida 7 0 86 0 0 0Michigan 46 41 22 15 2 17New Jersey 16 0 69 75 13 88New York 32 47 59 50 72 0Oregon 19 5 26 21 0 0Texas 26 46 15 38 12 27Washington 24 13 29 33 0 0Wisconsin 20 80 25 25 0 0 Source: USDA, Vegetable Chemical Use Survey, 1992.

21
Table 9--Crop insurance participation rates, 1992 Farms growing
State Onions ---Sweet Corn--- ----Tomatoes---- Fresh Processed Fresh Processed ----------------Percent of insured acres----------------
Arizona -- -- -- -- --California -- -- -- 1 22Florida -- 39 -- 15 --Michigan 9 -- -- -- 51
Minnesota -- -- 53 -- --New Jersey -- -- -- -- 8New York 19 -- 3 -- 10
Oregon 5 -- -- -- --Texas -- -- -- -- --Washington 9 -- 6 -- --Wisconsin -- -- 12 -- -- Source: USDA, FCIC. Special participation analyses.No data indicates insurance not offered or none sold.

22
Cultivation and Management Practices
Recommended cultivation and management practices provide backgroundinformation on the growing conditions and production techniques necessary tomaintain high carrot yields. Care requirements also provide an indicator ofthe potential for moral hazard as a problem in offering insurance.
Climate
Carrots are a cool-season crop and can be grown virtually anywhere providedthe growing season remains relatively cool. The optimum temperature range is60 to 70 degrees F. When the air temperature rises above 82 degrees F, plantemergence is poor, top growth is reduced, yields are depressed, and the rootsmay become strong-flavored. Also, high temperatures increase the woodycharacter and coarseness of the root flesh. Conversely, if the airtemperature during the early vegetative period falls below the optimum, longslender roots of much lighter color than typical and unwanted flower stalks(bolters) will appear. The roots are not damaged by mild frosts, but the topsare frost-tender.
Soils
Carrots can be grown on a variety of soil types, but deep, well-drained, sandyloams or organic soils such as muck or peat are the most desirable. Ingeneral, light mineral soils and organic soils produce a crop with moreuniform, smooth roots and are preferred for fresh-market carrots. Silt loamsand clay loams can be used to grow carrots for processing, because shape andsmoothness are not so critical as for fresh market carrots. These heaviersoils have higher water-holding capacity and usually greater fertility,generally giving higher yields of carrots grown for processing. Nevertheless,carrots will grow well in most soils, provided adequate preparation removesclods, hard lumps, and stones. Poorly drained soils tend to increase theincidence of "hairy roots." Carrots are a moderately salt-tolerant crop.
Carrots require an evenly distributed and abundant supply of moisture over thegrowing season. They require much higher soil moisture for good emergencethan most other vegetables. Even in the areas where irrigation is not usuallynecessary, supplemental sprinkler irrigation at the correct time can promoteseedling emergence, reduce wind erosion, decrease freezing damage, preventburnoff of young seedlings during extreme heat, and will often increase yieldsand improve quality.
Cultural Practices
In the West, Southwest, and other areas where irrigation is needed, carrotsare planted on raised beds similar to those used for other vegetable crops. The beds are 4 to 8 inches high after smoothing, 40 to 42 inches from centerto center, and 18 to 20 inches across the top. The most commonly used seedplanters in the irrigated areas produce a band of three or four rows of plants

23
3 to 6 inches wide. This planting method dispenses with the need to thin, yetproduces heavy yields with a minimum of twisted, misshapen roots.
In the East and Middle West, standard spacing is 16 inches between rows forboth fresh-market and processing carrots. While the ideal spacing may becloser, 16 inches is a minimum for present-day harvesters.
Carrot seeds are normally covered to a depth of one-eighth to one-half inch,depending on soil type and moisture availability. Carrot seeds are smallcompared with other vegetable seeds and are generally graded into large andmedium. For crop uniformity, growers are encouraged to use sized seed. Forfresh market carrots, the seeding rate varies from 2-1/2 to 5 pounds per acre,depending on the season, soil condition, type of planter, and rowconfiguration. For example, in the Salinas Valley of California, 30 to 40plants per foot of bed are optimal at a seeding rate of 3 pounds of seed peracre, for highest yield of the carrot variety, Imperator.
Planting Dates. Planting dates are usually used as reference time points inspecifying insurance sign-up dates and policy closing dates. Most plantingdates vary from 2 to 4 months for a planting season for each state (Table 10). By planting and harvesting all year round, California and Texas can extendtheir marketing period over most of the year. Arizona and Florida producecarrots in spring and winter, and most other states in summer and fall.
Carrots require between 65 and 85 days from planting to maturity, depending onthe planting date. For some hybrid varieties, the time from planting toharvest is much shorter than for comparable open-pollinated varieties. Germination requires 6 to 8 days at 68 to 95 degrees F, whereas 10 to 17 daysare required at 50 to 59 degrees F.
Thinning. Since hand thinning of carrots is not economically feasible,modified seed planters are used to assure proper seed distribution. Therefore, carrot seed is usually planted to stand with thinning unnecessary.
Fertilization. Carrots require various amounts of nitrogen, phosphorous, andpotash, depending on the specific soil type. The normal requirement of mixedfertilizer for organic soils should be low in nitrogen (N), medium inphosphorus (P), and medium-to-high in potash (K). Most mixtures are dependenton the anticipated nitrogen deficit in the soil and whether carrots are grownfor processing (where the amounts would be increased) or for the fresh market.
For example, a California grower might apply 64 pounds of N, 57 pounds of P,and 27 pounds of K per acre; a Texas grower might apply 48 pounds of N, 55pounds of P, and 14 pounds of K; and a Florida grower might apply 38 pounds ofN, 102 pounds of P, and 148 pounds of K. Organic soils are often deficient inmicronutrients important in carrot production including manganese, boron, andcopper. These are either included when the N,P,K is applied or at a latertime in a foliar spray.

24
Table 10--Carrots: Usual planting and harvesting dates, by state Usual harvest date State/ Planting Season date Begins Most active Ends Arizona Winter Aug. 20 - Nov. 31 Oct. 10 Jan. 1 - Mar. 31 Mar. 31 Spring Dec. 1 - Mar. 1 Mar. 15 Apr. 1 - June 30 July 30
California ----------------------------------See Table 15-------------------------------
Colorado Apr. 1 - July 5 Aug. 1 Aug. 15 - Nov. 30 Dec. 5
Florida Spring Dec. 1 - Mar. 1 Mar. 15 Apr. 1 - June 30 June 30 Winter Aug. 1 - Nov. 31 Oct. 10 Nov. 1 - Mar. 31 Mar. 31
Michigan Summer Apr. 15 - June 20 July 10 Aug. 5 - Sept. 30 Sept. 30 Fall June 10 - July 10 Oct. 1 Oct. 1 - Nov. 15 Nov. 25
Minnesota Fall-East Central May 1 - June 25 Aug. 5 Aug. 15 - Oct. 15 Oct. 20 Fall-South Central May 1 - May 20 Sept. 25 Sept. 30 - Oct. 31 Nov. 20
New York Mar. 25 - June 30 July 15 Aug. 1 - Nov. 30 Dec. 10
Oregon Apr. 1 - July 20 July 1 Oct. 1 - Dec. 31 Feb. 28
Texas Winter Aug. 1 - Sept. 30 Nov. 1 Jan. 15 - Feb. 28 Mar. 31 Spring Nov. 1 - Dec. 31 Mar. 15 Apr. 1 - Apr. 30 June 15 Summer Mar. 15 - Apr. 30 July 15 Sept. 15 - Sept. 30 Sept. 30 Fall July 1 - July 31 Oct. 1 Nov. 15 - Dec. 15 Dec. 31
Washington Summer Mar. 15 - Apr. 30 July 30 Sept. 1 - Oct. 1 Oct. 10 Fall June 15 - July 30 Oct. 1 Dec. 1 Dec. 31
Wisconsin Summer Mar. 15 - Apr. 30 July 30 Sept. 1 - Oct. 1 Oct. 10 Fall May 15 - June 30 Aug. 15 Aug. 28 - Oct. 5 Nov. 15

25
Source: USDA, NASS.

26
Weed control. Carrots are well-adapted to the use of standard chemicals forweed control. Chemical weed control is not a substitute for preplantingirrigation to control weeds or precision cultivation to kill late emergingweeds. Herbicides and some cultivation are necessary to destroy late-emergingweeds and to mulch over soil cracks to prevent weed emergence. Cultivationmust be done carefully so that the upper part of the roots is not exposed ordamaged.
Irrigation. Carrots require an evenly distributed and abundant supply ofmoisture over the growing season. In areas where carrots are irrigated, theyare sprinkler-irrigated for stand establishment. Since carrots germinateslowly, the beds must be kept moist to prevent crusting. After sprinkling,carrots are normally furrow-irrigated for the remainder of the season.
The total amount of water (rain and irrigation) needed after planting averages1-1/2 to 3 acre-feet with additional amounts applied as needed, averaging 1-1/2 to 2 acre-feet in cooler areas and 2-1/2 to 3 acre-feet in warmer anddryer areas.
In the Desert Valley area of California, irrigation is applied between 10 to12 times during the season, and at 7 to 10 day intervals. In the coastalareas of California, 3 to 4 acre-inches are applied at 10 day intervals. Plants stressed for water have small roots, whereas an uneven water supply cancause roots to crack and become malformed. There is also a danger from over-irrigating, particularly during cool weather. Excessive water may cause theorange-red roots to fade or even more seriously, may lead to disease problems.
Rotations. Carrots and other cool-season crops are best grown in rotationwith alfalfa and such legume cover crops as sour clover. Other crops that canbe used in rotation with carrots are the small grain cereals (barley, wheat,oats), grain sorghum, and some vegetables such as spinach, onions, and sweetcorn.
Vegetable crops such as celery, parsley, and beets should be avoided becausethey aggravate disease problems by encouraging a buildup of the same soilpathogens that are damaging to carrots. However, in some areas carrots can becultivated continuously on the same land if the soil is fumigated, usually inalternate years. Many of the fumigants that were once used for carrots andother food crops have been banned or restricted.
Harvesting and Packing
Nearly all carrots for both fresh market and processing are machine harvested. A few markets prefer carrots with the tops intact, which are hand harvested,but the labor costs for hand harvesting are not competitive with those formachine-harvested carrots. Most carrots are now shipped without tops becauseit was found that the tops drew moisture from the roots and hastenedshrivelling.

27
Carrots harvested by machine are first loosened under the row by a lifterdevice. Then they are elevated out of the soil with belts, which grasp thecarrot tops, mechanically cut the tops, and elevate the roots to trucks forbulk transportation. Carrots can also be harvested with a digging harvester.
The roots are loaded in bulk and transported to the packingshed, then washed,sorted, and packed for shipment. The type of shipping container used dependsupon the requirements of the receiver. Most of the carrots prepackaged inconsumer-unit film bags are shipped in boxes, but some are shipped in 50-poundmesh and polyethylene master bags. Carrots are also shipped in bulk in burlapbags and in bulk-bin boxes. Carrots are hydrocooled upon packaging and thenshipped in mechanically-refrigerated trucks or rail cars.
Before carrots are shipped, they are sorted into three sizes: small-to-medium, medium-to-large, and jumbo. Carrots of the small-to-medium size andmedium-to-large size must be at least 6 inches long. Sized carrots are thengraded to remove culls (carrots that do not meet the size requirements) andconveyed onto a recirculating packing belt. Small-to-medium and medium-to-large sized carrots are commonly packed into one-pound consumer poly bags,while jumbo sized carrots are conveyed into 48 pound bags for institutionalmarkets.
One pound film bags of carrots are usually packed 48 to a master containerwhile two pound bags are packed 24 to a master container. Carrots for sale toinstitutions (usually the larger sizes) are often packed loose in largepolyethylene, mesh, or burlap bags. Topped carrots, with or without sizing,may also be packed loose in burlap bags for shipment to packagers.
A few states have restricted the use of orange mesh line on polyethylene bagsof carrots for retail use because the lines alter the appearance of the carrotcolor. The United Fresh Fruit and Vegetable Association's Fresh CarrotMarketing Committee has agreed upon a carrot bag with a clear window on theback for maximum visibility. Texas shippers are using paper baler bags aswell as polyethylene and woven polyolefin ribbon fabric bags for mastercontainers. These all hold 48 one-pound bags, 24 two-pound bags, or 50 poundsof bulk carrots.
Michigan shippers are primarily using the woven plastic mesh bag as well asmulti-wall paper baler bags, with the use of cartons as master containersincreasing. Some Florida shippers use woven plastic mesh bags as mastercontainers for regular sized carrots. "Carrettes", or short carrots, arepacked in a carton which contains 20 twelve-ounce bags.
The storage life of carrots depends on whether the tops are on or off, whetherthe roots have fully developed, and storage conditions. Bunched carrots keeponly as long as their tops, which is about 3 weeks. Roots harvested beforefull maturation, the kind most generally marketed fresh, store well for atleast 1 month if held near 0 degrees C. Near 5 degrees C, the storage lifewill only be 2 to 3 weeks. Since carrots differ in their susceptibility todecay, some lots may keep twice as long as others under the same conditions.

28
Fully mature carrots have the longest storage life. Deterioration is minimalafter 9 months near 0 degrees C and at high relative humidity (RH). Undermost commonly found conditions, between 0 degrees and 5 degrees C and 90 to 95percent RH, 4 to 6 months is a more realistic expectation. Bitterness can beavoided by low temperatures; however, carrots must still be stored separatelyfrom crops that emit ethylene, such as apples or pears. Large quantities ofcarrots are harvested in the autumn in the northern states for winter storage. These storage supplies are used extensively by food processors.
Carrot breeding research is intended to improve the quality of both the freshmarket and the processed product by developing cultivars with uniform internalcolor, the absence of green shoulders, good flavor, and high sugar and highnutrient content.
Marketing
Most carrots are grown for the fresh market, but a substantial amount is alsoprocessed as frozen and canned carrots or used in prepared foods such assoups, juices, and convenience dinners. USDA statistics indicate thatapproximately two-thirds of total U.S. production is sold for the freshmarket, with the remaining one-third sold for processing.
The major varieties of carrots are planted with the intention of either freshor processing market usage. Since carrots are a dual usage crop, carrots thatcannot meet the grade requirements for the fresh market can be sold forprocessing, but at a loss of revenue. The 1993 season-average price growersreceived for processing carrots was $71.70 per ton or $3.59 per hundredweight,compared with $238 per ton or $11.90 per hundredweight for fresh marketcarrots.
While the price for processing carrots is considerably lower, the yields arehigher because of fewer size and quality restrictions. USDA yields are notseparately available for fresh and processing carrots. The 1993 fresh andprocessing market carrot crop was estimated at $292 million, withapproximately 90 percent of the value from the fresh market and 10 percentfrom the processing market.
Producers in some cases pack their own carrots and deliver them to a shipperwho acts as the sales agent. In other cases, the grower contracts with apacker-shipper for packing services in a piece-rate agreement, or enters intoa joint risk-sharing venture. A number of larger producers, however, act astheir own shipper and sales agent. Some large scale growers are completelyintegrated--they both grow and ship.
The primary customers for fresh carrots are chain stores and other retailer-wholesalers, terminal market brokers, wholesale handlers, and the military andother institutions. The major buyers generally have field people in theproduction areas monitoring quality and the availability of carrot supplies.

29
Production Costs
Cost of production information is pertinent in assessing the feasibility ofcrop insurance because the timing of expenditures provides an indication ofthe magnitude of losses associated with an insurable event occurring atdifferent stages in the growing cycle.
By the time carrots are planted, growers have incurred a substantial amount ofpreharvest expenses. Some of the preharvest expenses for operations such aspest control, supplemental fertilization, and other cultural practices,however, are incurred throughout the growing period and may not have beenincurred if an insurable loss occurs early in the growing season (see Tables11-13; see Appendix table 6 for detailed California costs).
Preharvest production costs are higher for fresh market carrots than forprocessing carrots because of increased ground preparation and field care. Harvesting and marketing expenses typically amount to less than half of totalproduction costs, but these expenses usually are not incurred if an insurableloss occurs.
Production Perils
The natural perils that are most likely to result in yield losses vary fromarea to area and depend partly on the time of year that the production andharvesting activities are occurring. The greatest perils in many states arenematodes and diseases. In the northern carrot-growing states, freeze damageat planting or harvesting and lack of water in the nonirrigated areas aremajor concerns. Other natural hazards in carrot production include insectdamage and physiological disorders.
Freeze
Carrots are a cool-weather crop and relatively cold weather resistant. Sincethe roots are below the ground's surface, air temperatures have to remain lowfor an extended time before carrots are permanently damaged. Low temperaturestend to produce long, slender roots of much lighter color than typical. Extended low temperatures subject the plant to bolting and make the plant moresusceptible to diseases.
Excessive Rain
Too much rain can lead to root deterioration and a build-up of root-bornediseases and physiological disorders. Excessive moisture can also result inpoor quality if wet fields prevent the grower from harvesting on a timelybasis. This is not as much of a problem for carrots as some other cropsbecause mature carrots, under optimal conditions, can remain in the ground 4weeks or longer.

30
Table 11--Carrots: Estimates of production costs for Michigan and south Texas
Texas Michigan 1/ South District (1989) (1993)
---------Containers/acre 2/--------
Yield 500 350
-------------Dollars/acre----------
Land preparation 250 NA
Expenses during 532 457growing period
Pre-harvest costs 782 457
Harvest 1,482 1,365
Overhead costs 532 88
Total 2,796 1,910
----------Dollars/container--------
Per unit costs 5.59 5.46
NA = not available.
1/ 85 percent fresh market; 15 percent processing market.2/ A container or bag holds 50 pounds.
Source: Michigan State University and Texas A&M University CooperativeExtension Service budgets.

31
Table 12--Carrots: Minnesota, Oregon, and Washington regional estimates of production costs Minnesota 1/ Minnesota 2/ Oregon Oregon Washington 3/ Washington 4/ N.C. Region Willamette ColumbiaBasin Columbia Basin Valley 1992 1992 1990 1990 1993 1993 -----------------------------------------Tons/acres---------------------------------------
Yield 15 30 25 30 30 40
----------------------------------------Dollars/acre--------------------------------------
Land preparation 20 20 382 157 263 447
Expenses during 379 322 611 398 655 838 growing season
Pre-harvest costs 399 342 993 555 918 1,285
Harvesting and marketing 341 230 227 124 703 508
Overhead costs NA NA 123 NA 237 309
Total 740 572 1,343 679 1,858 2,102
----------------------------------------Dollars/ton---------------------------------------
Per ton costs 49.33 19.07 53.72 22.63 61.93 52.55 1/ Fresh pack market.

32
2/ Processing market.3/ Chanteney variety, processing market.4/ Imperator variety, fresh and processing market.
Sources: University of Minnesota Southern Experiment Station, Oregon State UniversityExtension Service, andWashington State University Cooperative Extension.

33
Table 13--Carrots: County estimates of production costs for California
California counties Kern Imperial (1987) (1992)
-----------Containers/acre--------
Yield 800 800
------------Dollars/acre----------
Land preparation 280.25 427.25
Expenses during 908.45 608.78growing period
Pre-harvest costs 1188.70 1036.03
Harvest 2720.00 3200.00 (per container contract rate) @ $3.40 @ $4.00
Overhead costs 41.73 376.32
Total 3950.43 4612.35
---------Dollars/container-------
Per unit costs 4.94 5.76
Note: A container or bag holds 50 pounds. For Kern county, overheadcosts are, for the most part, included in each specified item. Harvest costsinclude marketing and selling costs; these costs are not included in the other costof production tables presented here.
Source: University of California Cooperative Extension Service budgets.

34
Hail
Hail is not as damaging to carrots as it might be for crops whose salableparts are above ground. If hail is excessive, the carrot tops can be damagedor removed, requiring that the carrots be dug and either marketed before theyreach full size or be destroyed. Hail damage can reduce crop value by forcingthe grower to market carrots before they mature, and by requiring the growerto sell to the lower-priced processing market rather than for fresh marketuse.
Excessive Heat
High temperatures at the seedling stage can result in poor emergence and ahigh incidence of misshapen and unmarketable roots. Prolonged hightemperatures during later development of the carrot root not only retardgrowth and depress yields, but can cause undesirable flavors. Also, hightemperatures increase the woody character and coarseness of the root flesh.
In general, planting and harvesting at extreme temperatures are not considereddesirable and should be avoided if possible. High temperatures at harvestmake marketing of a high-quality product difficult because the roots do noteasily regain turgidity after prolonged dehydration, and more cooling isneeded to bring them to desirable postharvest temperatures.
Drought
If carrots become too dry and are then irrigated or rain occurs, there can besignificant splitting of the roots. Dryness tends to cause the cells toharden and lose elasticity. When water is applied, the carrot core tends toexpand while the outer layers do not. The result is splitting, which makesthe carrots unmarketable in the fresh market.
Wind
Excessive wind is a minor peril because most of the plant is below the ground. Wind can be a problem while plants are small and emerging, before the rootsare established.
Nematodes
Nematodes, small soil-borne plant parasites, are a serious problem in carrotproduction. They attack the roots, slowing the growth and reducing the sizeof the mature roots. Although several different plants host nematodes,rotating crops helps reduce infestation. In Florida, the principal method forcontrol is pre-plant flooding. Growers in many areas are concerned thatrestricted chemical use will impede their ability to control nematodes.

35
Insects
A number of different insects, if not properly controlled, can cause carrotyield losses. The insects of economic significance for one production areamay be different from those which are a threat in other areas. Damage frommost insects can be held below an economic threshold with available productionpractices and insecticides. The insects of greatest economic significance inthe major production areas are discussed in the state-specific sections.
Diseases
Carrots are susceptible to a number of plant diseases, caused by viruses,fungi, bacteria, nematodes, or nonpathogenic sources. Some are seedborne andothers are soil-borne. Storage and transit diseases can also be a problem. Some diseases are transmitted by insects or microorganisms, others are carriedby the wind, irrigation water, or the movement of contaminated soil andequipment.
Eradication of a pathogen once it has invaded the plant is always difficultand usually impossible. Prevention, consequently, is the key in diseasecontrol. Plants may be protected by means of chemical treatments applied tothe soil, seed, or foliage; by use of disease-free seed or disease resistantvarieties; and by weed control.
Weeds
Effective weed control is essential to quality carrot production. Controlmethods consist of using chemical herbicides, mechanical cultivation, and off-season flooding.
State Analyses
Although there are similarities among production areas in the way carrots aregrown, production practices and the perils faced by carrot growers may varyacross regions. The following sections analyze the production practices andperils that pertain to the feasibility of offering crop insurance in the majorcarrot-growing regions.
Arizona
Arizona produces carrots for the fresh market only, selling 238,000 cwt. in1993, only about 1 percent of U.S. fresh market production. A total of 1,400acres were harvested, with a yield of 170 cwt. per acre. The total marketvalue for Arizona fresh market carrots was $2.7 million. The 1987 Census didnot list Arizona as a carrot production state.

This section uses California NASS and County Agriculture Commissioners' data, whichare not necessarily consistent with the state data presented elsewhere in this report. However, the county-level data presented in Appendix table 5, and reported in this section,offer considerably greater detail for recent years than is available from other sources.
36
California
California has numerous climatic zones that provide suitable conditions forcarrot production in different districts at different times of the year. California supplies carrots mostly to the fresh market. The followingdiscussion, consequently, pertains mainly to fresh-market carrots.
Carrot Production in California
California contributed 53 percent of the nation's carrot output in 1992,producing nearly 1.3 million tons (fresh and processed) from over 67,000acres2 and generating $208 million in revenue (Table 14). Carrots rankedfifth in value among the 26 principal vegetables grown in the state, andnineteenth in value among all California agricultural commodities (CaliforniaAgricultural Statistical Review, 1992).
California carrots are supplied both to fresh and processing markets. During1992, fresh carrots account for about 86 percent of total California carrotproduction. California growers harvest throughout the year in one or anotherareas of the state. Carrot harvesting in California is fairly evenlydistributed over the year.
California has shown exceptional growth in carrot production between 1980 and1992. Output increased four-fold over that period, due to a large increase inacreage and a modest increase in per-acre yield (Table 14). Both fresh carrotand processing carrot acreages have increased substantially.
Production Regions
Kern and Imperial counties are by far the most important carrot-producingregions in California. Kern county alone produces almost 70 percent ofCalifornia's fresh carrots (Appendix table 5). The combined production ofKern and Imperial counties accounts for more than 90 percent of the state'sfresh carrots.
Other fresh-carrot areas include Monterey county, which produces about 3percent of California's fresh carrots, and San Luis Obispo, Riverside, andFresno counties.
Processing carrots are mostly produced in Santa Barbara, Monterey, and SanLuis Obispo counties. As mentioned earlier, processing carrots produce higheryields on a per acre basis, but generate much lower value than fresh carrots.

37
Table 14--Historical carrot production in California Harvested Year Acreage Yield/Acre Production
---tons--- ---tons--- ALL CARROTS (FRESH & PROCESSING) 1980 24,761 23.95 307,907 1981 25,348 27.00 392,071 1982 25,368 28.25 424,890 1983 25,971 21.15 378,319 1984 27,932 24.33 471,326 1985 26,159 24.28 551,745 1986 29,650 25.45 862,235 1987 39,593 26.90 1,069,126 1988 44,158 28.73 1,179,808 1989 50,371 29.56 1,284,802 1990 50,150 26.58 1,290,630 1991 51,519 27.55 981,340 1992 67,185 26.23 1,274,053
FRESH CARROTS 1/ 1984 25,962 18.07 411,121 1985 24,709 18.77 508,525 1986 27,595 25.80 810,685 1987 37,948 23.40 1,019,071 1988 39,010 23.15 1,002,715 1989 45,168 21.63 1,091,084 1990 45,965 22.15 1,158,151 1991 46,890 19.95 816,204 1992 61,922 18.25 1,089,938
PROCESSING CARROTS 1984 1,970 30.60 60,205 1985 1,450 29.80 43,220 1986 2,055 25.10 51,550 1987 1,645 30.40 50,055 1988 5,148 34.30 177,093 1989 5,203 37.50 193,718 1990 4,185 31.00 132,479 1991 4,629 35.15 165,136 1992 5,263 34.20 184,115 1/ Data for fresh and processing carrots are not available separately prior to 1984. Source: County Agricultural Commissioners' Reports, California Agricultural Statistics Service.

38
Kern county showed a strong growth trend in production between 1980-92, withnearly a six-fold increase in output over the period. However, in Imperialcounty, the increase in production was most pronounced during the 1980's, andhas since leveled off.
Planting and Harvesting Dates
Carrots are produced year-round in California in one production region oranother (Table 15). Growers follow a precise schedule of planting to havecarrots maturing each week for a continuous flow of product to market.
Production Perils
Weather. Carrots are relatively resistant to cold weather. Carrots are oneof a few vegetable crops which can be planted and harvested throughout thewinter in the Central Coast area. However, the carrot plant will bolt ifsubjected to cold for an extended time. At the other extreme, hightemperatures can at times result in poor emergence, misshapen and coarseroots, and generally low yields.
Generally, weather problems mostly cause slow and weak growth of the crop. When plant growth is not vigorous, carrots become vulnerable to disease andinsect attacks. A serious concern caused by unusually cool and damp weatheris the development of fungus diseases.
Diseases. Among carrot diseases, cercospora blight, alternaria blight, blackrot, and motley dwarf (in the Salinas area) are found to be economicallydamaging. Root rots are usually absent under good cultural practices (GregBrowne; UC Cooperative Extension). The following are the more serious diseaseperils in growing carrots in California:
Alternaria Blight-also known as late blight, is caused by a fungus. It maycause damping-off of seedlings and blight of seedstalks, but fleshy roots arenot affected. The fungus is spread in contaminated seed. It can be alsospread by wind, water, splashing rains, and tools. The fungus may live overthe winter in infected plant debris. Fall plowing and fungicide treatmentsare used to control this disease.
Cercospora Blight-also known as early blight, is caused by a fungus and occurscommonly with Alternaria blight. Like Alternaria, Cercospora may attack anysurface part of the plant, but does not attack the fleshy root. The diseaseis favored by moist weather. Splashing water from rainfall or sprinklers mayspread the disease. If floral parts are infected, the fungus may enter theseed and become a threat to next year's crop. Practical controls are the sameas those for alternaria blight.
Black rot-is a seed-borne disease. This disease is mainly a root pathogen butcan also cause leaf blight. It may attack the root in the field as well asstored carrots. Black, scablike spots appear in the root and eventually theroot decays. Seed treatment is the most effective control method.

39
Table 15--Dates for carrot planting and harvesting in California
District Typical planting dates Typical harvesting dates
Cuyama Valley March - May August - mid November
Imperial Valley mid September - October March 1 - May 30
Eastern Sierra/ Bishop May October
South San Joaquin Valley November - March 1 May 30 - July 30
July - September 1 November (end) - March1
Huron (southwest of Fresno) March July 30 - August
Shandon (East of San Luis Obispo) March - May August 1 - mid November
Salinas (Monterey county) February Summer
Note: These schedules are typical but may vary.
Source: G.T. Browne.
40
Motley dwarf disease-is caused by a virus. Infected carrots have a stuntedappearance with small and distorted leaflets. Aphids can transmit the virus. Control includes delay in planting until aphid populations are reduced and useof insecticides. This disease is a serious problem in the Salinas Valley butnot in southern California (Greg Browne).
Aster yellows-is spread by leafhoppers (mainly the six-spotted leafhopper). The first symptom is yellowing of young leaves at the center of the crown. The petioles of older leaves eventually break and mechanical harvestingbecomes difficult. Yellows reduce the size and quality of the root. Controlhas been possible by insecticide control of leafhopper vectors and removal ofoverwintering weed and ornamental host reservoirs along roadways.
Root rots-usually attack stored carrots. They are fungus-caused and includebacterial soft rot, cottony soft rot, gray mold rot, crator rot, fusarium dryrot, and licorice rot. These storage rots usually occur during thetransportation or storage period.
Disorders. While diseases are relatively controllable, forking of the roothas been prevalent in carrot production, and occurs whenever the taproot isdamaged. The damage can be inflicted by various agents or conditionsincluding nematodes, fungi (Pythium-induced forking), excessive nitrogen, andcompact soil. Control methods vary depending on the source of the damage.
According to Greg Browne, farm advisor in Kern County, forking is a seriousproblem to carrot growers, and occurs in almost all carrot production to someextent. When it occurs, carrots are not marketable. The average loss perfarm is around one to two percent. However, forking can occur on a wide scaleand can result in a serious loss.
Insects. Crickets, grasshoppers, striped flea beetle larvae, and cutworms canbe a problem when seedlings emerge. Later, aphids, whiteflies, and spidermites may attack the leaves. Cutworms may attack crowns and have been a majorproblem in recent years (UC Cooperative Extension). Seed, soil, orinsecticide treatment often averts serious insect attacks although localizedinfestations may occur.
Nematodes. Nematodes are controlled by fumigation or chemicals to preventcarrots from forking. In addition to forking, root-knot nematodes can causeconsiderable damage. The roots attacked by root-knot nematodes have galls ofvarying sizes on the tap root. Roots severely infected with root-knotnematodes are often completely decomposed by secondary organisms such as fungior bacteria. Chemical use restrictions have made nematode control moredifficult for growers.
Irrigation Failure. If carrots become too dry and are then irrigated, theremay be significant splitting of the roots (UC Cooperative Extension). Drynesscauses the cells to harden and lose elasticity. When water is applied, thecarrot core tends to expand, while the outer layers do not, resulting insplitting. However, the probability of irrigation failure is very small.

41
Irrigation Water Issues in California
The continued availability of water for irrigation is a concern in some areasof California. Currently, water costs comprise a small share of totalexpenses in vegetable production. However, the overall trend is forirrigation water to become less available and more expensive. Irrigationwater deliveries to farmers from state and Federal water projects have beencut back in recent years, particularly in the west side of the San JoaquinValley.
Because carrots are a relatively high-value crop, however, growers areunlikely to withhold water because of a shortage. They would divert water,instead, from lower-value crops such as alfalfa and cotton to carrots in caseof water shortages.
Grower-Shipper Arrangements
California's carrot industry is characterized by a high degree of verticalintegration. Some large-scale growers are completely integrated. Largegrowers both grow and ship and are referred to as grower-shippers. They alsocontract with individual farmers to grow carrots for them to pack and ship. Most medium- or small-size farms have a joint venture with shippers at a fixedrate or by sharing the output on a pre-negotiated term.
In California, carrot operations fall into one of the three broadly definedcategories: grower/shipper marketing companies, contract farming, and non-contract farming:
Grower/Shipper Marketing Companies. Grower-shipper operations, which combinethe farming and shipping functions, generally manage thousands of acres. Their operations are either diversified into various vegetables or specializedin a single vegetable crop.
In the state as a whole, the manager of the California Fresh Carrot AdvisoryBoard indicated that the 3 largest California carrot growers (Bolthouse Farms,Grimmway Farms, and Yurosek and Sons) currently produce about 70-75 percent ofthe state's carrot crop. These grower-shippers produce about 50 percent oftheir output on their own acreage; the other 50 percent is under contract withsmaller growers. Several of the very large California growers produce onlycarrots, or carrots account for a very large part of their business.
Conversations with a farm manager at Grimmway Farms, one of the three largestCalifornia packer-shippers, indicated that his firm produced carrots in threelocations in California, moving equipment around during the year with thedifferent growing seasons. Their main location is in Kern county, where theyhave two carrot harvests, one in mid-summer and one in early winter. Theirwinter production is mainly in the Imperial Valley. Recently, they have begunsummer production in the cooler mountain areas east and west of Kern county.

42
Grimmway Farms has about 90 percent of its acreage in carrots, and 10 percentin green beans. Their main product, which accounts for about 70 percent oftheir production, is fresh "baby carrots." The firm has its own equipment forcutting and packaging, and also does packing and shipping for other growers inthe Kern county area.
The Grimmway Farms manager indicated that he didn't think that their farmwould need crop insurance. Carrot production is not as risky as production ofsome other vegetables, such as lettuce and broccoli, and he indicated thatnatural perils can be managed. He said that their biggest perils werenematodes and fungal diseases.
Nematodes are controlled by crop rotation and soil fumigation. Grimmway Farmsrotates carrots about every three years. They use clover and wheat asrotation crops, but may leave the fields fallow instead.
The owner-manager of Bolthouse Farms in Kern county, another of the threelargest California carrot producers, indicated that the greatest risks totheir firm included pesticide regulation and the availability of irrigationwater. Restrictions on the use of methyl bromide, vipam, and other chemicalswas of particular concern. He indicated that they did not need crop insuranceif water is available and pesticide use is not restricted further.
Contract Farming. Contract arrangements between individual farmers andgrower/shipper companies can take various forms. The company sometimes leasesout farmland to individual farmers, shares input expenses (or providesinputs), and supervises management decisions, depending on the individualfarmer's land ownership status, financial conditions, and farming experience. However, in most cases, farm output is shared at a pre-negotiated rate.
There are usually two ways to share output. Upon harvest and sales, theshipper often keeps harvesting expenses at the pre-negotiated price and splitsthe rest as was specified in the contract, either using a predetermined price(at the time of contract) or using the actual sales price. The latter isreferred to as an open price contract. The open price contract provides anopportunity to share production as well as market risks.
The open-price, output-sharing contract resembles the typical payment-in-kind,output-sharing contract between the renter and landlord. However, in the caseof the grower and shipper, the shipper's role includes harvesting andmarketing (not at the retail level but at the shipping point).
According to Greg Browne, about half of the growers in Kern county producecarrots under contracts with grower/shipper companies. Carrot acreage managedby these companies (including land under contract production and their own)amounts to 35,000 to 40,000 acres, which is about 78 to 89 percent of totalcounty carrot acreage.
Independent Farming. This category includes individual farmers who are notengaged in contract farming. These farmers make their own management

43
decisions and finance their own inputs. However, harvest and marketing areusually done either through a cooperative (if the farmer is a member) or on acontract with a shipper.
For many California carrot producers, it is difficult to accurately separatethe risk borne by producers versus that borne by handlers. Although combininggrowing and shipping could increase overall business risk, these marketingcompanies are sometimes large enough to absorb market shocks. Further, theyare also often diversified across crops and across geographical growinglocations, diffusing price risk and production risk.
Colorado
Colorado produces carrots for the fresh market only, selling 1.064 millioncwt. in 1993, about 5 percent of the U.S. fresh market. A total of 2,800acres were harvested, yielding 380 cwt. per acre. The total market value forColorado fresh-market carrots was $9.1 million. The 1987 Census indicatesthat there were 28 growers, with seven of those growers operating in Weldcounty. All of the carrot acreage in Colorado is irrigated.
Florida
Florida produces carrots only for the fresh market. In 1993, Florida produced5 percent or 1.092 million cwt. of U.S. fresh market carrot output, about 5percent of the U.S. total. A total of 7,800 acres were harvested in 1993,yielding 140 cwt. per acre. The total market value for Florida fresh marketcarrots in 1993 was $18.5 million.
Florida has a spring and winter crop, with active harvesting in the springrunning from April 1 through June 30, and active winter harvesting extendingfrom November 1 through March 31st.
In Florida, carrots are grown on the organic soils around the southern tip ofLake Okeechobee and near Zellwood in central Florida. The 1987 Censusindicated that there were 25 growers, with one-half those growers located inOrange and Lake counties (central Florida). Of those growers, there are 3 or4 large grower-packers who market most of the carrots. These producers grow avariety of vegetables and other crops, marketing several vegetables as a mix.
Production Practices
Carrots are usually planted December 1 through March 1 for the spring crop andAugust 1 through November 31 for the winter crop. Florida's carrots areusually grown on muck soils, where flooding is an important measure forcontrol of nematodes, soil-borne diseases, and insects. Florida is one of thefew carrot producing states that produces "real" baby carrots from seed,rather than cutting larger carrots into baby carrot sizes.

44
Harvesting and Marketing
Most carrots are machine harvested, with growers harvesting most of their ownacreage and trucking the carrots to the packer-shipper. Florida carrots areharvested by pulling the tops rather than by use of the digging method. Individual growers usually do not have formal contracts, but typically sell tothe packer-shipper that they have supplied in previous years.
Production Perils
Excessive rainfall and severe cold are the major natural perils to carrotproduction in Florida. Excessive rainfall can lead to a buildup of root-bornediseases. Carrots are a cool weather crop and can withstand light frosts. However, freezes can damage the green top and stunt carrot growth, causingproblems at harvest if the tops have deteriorated.
Hail is usually not considered to be a production peril for carrots inFlorida. Wind damage to small plants is a minor nuisance.
Insects and Diseases
Nematodes are a problem in muck soils, but can be controlled by flooding thefield before carrots are planted. In the Everglades area, some growers rotatecarrots with rice so that the nematodes are controlled when the rice fieldsare flooded. Growers can help prevent or control diseases by using treatedseed, and using field applications of fungicides when a problem is detected.
Demand for Insurance
There may be less demand for carrot crop insurance from growers in Floridathan from those in more northern states. Growers in Florida are larger andmore diversified into other vegetables and crops. Florida vegetable producersmay at times lose money on one or two of the vegetables sold as a freshmixture, but continue to grow and market a variety of vegetables to satisfytheir markets.
Michigan
In 1993, Michigan was ranked the second-largest state in fresh-market carrotoutput, producing 1.275 million cwt. of carrots. It was ranked fourth-largestin processing carrot output, producing 37,000 tons of carrots. A total of7,200 acres were harvested in 1993, yielding 280 cwt. per acre. The marketvalue of Michigan's fresh market carrots in 1993 was $15.7 million, and forprocessing carrots, $1.9 million.
Michigan has a summer and a fall crop, with active harvesting in the summerrunning from August 5 through September 30. Active fall harvesting extendsfrom October 1 through November 15th. Most of the fresh market carrots aregrown in the southwest part of the state. Processing carrots are grown in thesouthwest part of the state, as well as in counties further north. The 1987

45
Census indicated that there were 133 growers in 6 principal counties. Ofthose growers, there is at least one large producer-packer that also growscarrots in California, Florida, Georgia, and Texas.
Production Practices
Carrots are usually planted April 15 through June 20 for the summer crop andJune 10 through July 10 for the fall crop. While carrots have usually beengrown on muck soils in Michigan, more production is moving to upland loamsoils because of the high costs--of both owning and renting--on muck soils. Carrots grown on loam soils usually require irrigation, but the savings in theland cost more than pay for the added irrigation expense.
Harvesting and Marketing
Most carrots are machine harvested, with growers harvesting most of their ownacreage and trucking the carrots to a packer-shipper or processor. Oncecarrots reach maturity, growers are not concerned with deterioration of thetops due to weather because they harvest the carrots by digging rather than bypulling them.
The majority of Michigan carrots go for the fresh market. Michigan has alsoentered the baby carrot market and has several facilities that cut the largercarrots into baby carrot sizes. In some cases, carrots are shipped by railfrom California for cutting into baby carrots at Michigan facilities.
Fresh-market carrots are packed in 1- or 2-pound packages for the retailmarket, while cull and processing carrots are usually shipped in 50 poundbags.
The amount of carrots being shipped by handlers in California appears to bethe major factor in determining prices in Michigan. Most producers havecontracts with packer-shippers before planting, with a minimum priceguaranteed for a certain yield and quality. Some of the smaller growers havestarted their own packingsheds but rely on a shipper to do the selling.
Crop abandonment for Michigan carrots doesn't seem to be a problem. Mostpeople feel that there are enough local markets--for fresh, feed, orprocessing--that carrots would not be abandoned unless prices were extremelylow. In some areas, growers have diversified their carrot acreage withcauliflower and broccoli.
Production Perils
Excessive rainfall is considered one of the most serious production perils inMichigan because of the lack of good drainage in some areas. Bacterial rot orother diseases can become established and the plants eventually die.
Other major production perils in Michigan include high summer temperatures,excessive cold, and drought. Carrots can become bitter tasting and woody if

46
they are subjected to excessively high temperatures without adequate moisture. Cold temperatures in the spring can reduce emergence and stunt plant growth.
Hail is usually not considered to be a production peril for carrots because,even if the tops are damaged, carrot growth can often continue. Since carrotsare harvested by digging in Michigan, the tops are not necessary for pullingat harvest.
Insects and Diseases
Nematodes are a problem on muck soils. Alternaria leaf blight and Cercosporaleaf blight, as well as aster yellows, are serious problems in Michigan.Growers can help prevent or control diseases by using treated seed and fieldapplications of fungicides when a problem is detected.
Demand for Insurance
There may be more potential demand for carrot crop insurance from growers inMichigan than from those in California and Florida. Growers in Michigan aresmaller, less diversified, and somewhat less likely to irrigate. As a result,income losses if the carrot crop is damaged may represent a larger portion ofa Michigan grower's income for the year than in California and Florida.
Minnesota
Minnesota is a small production state in both the fresh-carrot and processing-carrot markets. In 1993, Minnesota accounted for less than 1 percent of U.S.fresh market production, and only 2 percent of U.S. processing marketproduction. A total of 1,400 acres were harvested in 1993, yielding 220 cwt.per acre. The total market value for Minnesota fresh market carrots in 1993was $660,000 and for processing carrots, was $668,000.
Minnesota has only a summer crop, with active harvesting in the summer runningfrom August 15 through October 31. Most of the state's fresh market carrotsare grown in the southern part of the state. The 1987 Census indicated thatthere were 63 growers in Minnesota.
Production Practices
Carrots are usually planted May 1 through June 25 for the summer crop. Mostcarrots are grown on organic loam soils, with only about a third of the farmsgrowing carrots on irrigated land.
Harvesting and Marketing
Most carrots are machine harvested, with growers harvesting most of their ownacreage and trucking the carrots to a packer-shipper or processor. Oncecarrots reach maturity, growers are not concerned with deterioration of thetops due to weather because they harvest the carrots by digging rather than bypulling.

47
The majority of Minnesota carrots go for the processing market, including thedehydration market. There are several large vegetable processing facilitiesin Minnesota which contract for the majority of the state's carrot acreage.
Minnesota producers are "price takers" for both their fresh and processingcarrots. California is the major supplier in the U.S. market and the amountof carrots being shipped by handlers in California appears to be the majorfactor in determining prices in Minnesota. Most producers have contracts withprocessors before planting, with a minimum price guaranteed for a certainyield and quality.
In some areas, growers have diversified their carrot acreage with otherprocessing vegetables, such as peas, corn, and beans.
Although vegetable production in Minnesota is grown on a small percentage ofthe state's crop acreage, Minnesota has a state fruit and vegetable grower'sassociation that promotes and monitors the vegetable industry.
Production Perils
Excessive rainfall, high summer temperatures, excessive cold during thespring, and drought are the major production perils in Minnesota. Excessiverainfall is a serious production peril where drainage is a problem, andbacterial rot and other diseases can become established.
If carrots are subjected to excessively high temperatures without adequatemoisture, they can become bitter tasting and woody. Cold temperatures in thespring can damage emergence and stunt plant growth. Hail is usually notconsidered to be a production peril for carrots.
Insects and Diseases
Alternaria leaf blight, Cercospora leaf blight, and aster yellows are seriousproblems in Minnesota. Growers use treated seed to help control asteryellows. Field applications of fungicides can be used to control leaf blightinfections.
Demand for Insurance
There may be more potential demand for carrot crop insurance from growers inMinnesota than from those in California and Florida. Growers in Minnesota aresmaller and less diversified with other vegetables, and they irrigate to alesser extent. Income losses from crop damage may represent a large portionof a Minnesota grower's income for the year.

48
New York
New York produces carrots for both fresh and processing markets. New Yorkaccounted for 227,000 cwt., or about 1 percent of U.S. fresh market carrots in1993, and 14,000 tons, or about 3 percent of the U.S. processing market. Atotal of 1,300 acres were harvested, yielding 390 cwt. per acre. The totalmarket value for fresh and processing market carrots in New York was $4.4million.
The 1987 Census indicated that there were 118 carrot growers in New York. Only about one-third of the carrot acreage in New York was irrigated in 1987.
New Jersey
New Jersey produces carrots for both the fresh and processing market. BecauseNew Jersey accounts for less than 1 percent of U.S. carrot production, USDAdoes not publish any production, yield, acreage, and value data for that statealone. The 1987 Census indicated that there were 28 growers in New Jersey,and that about 80 percent of the carrot acreage was irrigated.
Oregon
Oregon produces carrots for both the fresh and processing markets. The stateaccounted for 304,000 cwt. (about 1 percent) of U.S. fresh market carrotproduction in 1993, and 21,200 tons (or 4 percent) of U.S. processing carrotproduction. A total of 1,400 acres were harvested, yielding 520 cwt. peracre. The total market value for Oregon fresh market carrots was $7.0million, and for processing carrots, it was $1.3 million. The 1987 Censusindicated that there were 71 growers in 3 principal counties. About 80percent of the carrot acreage was irrigated in Oregon in 1987.
Texas
Texas produces carrots for the fresh and processing markets, accounting for 3percent or 618,000 cwt. of U.S. fresh market carrots in 1993, and 5 percent or26,000 tons of U.S. processing market production. A total of 6,500 acres wereharvested in 1993, yielding 175 cwt. per acre. The total market value forTexas fresh market carrots in 1993 was $9.0 million, and for processingcarrots, it was $2.1 million.
Texas and California are the only two states that market carrots throughoutthe year. There are four time periods when planting usually occurs in Texas: August-September, November-December, March-April, and July. Harvesting occursapproximately 80 days later. Carrots are grown in the same area as celery, inthe lower Rio Grande Valley (70 percent) and the San Antonio-Winter Gardenarea (30 percent).
The 1987 Census of Agriculture indicated that there were 138 growers in 5principal counties. Most of the carrot acreage is irrigated, with a smallamount of processing carrots grown on nonirrigated land.

49
Harvesting and Marketing
Most carrots in Texas are machine harvested, with growers harvesting most oftheir own acreage and trucking the carrots to a packer-shipper. Texas carrotsare harvested by pulling the tops rather than by the digging method.
Fresh-market carrots are usually packed in 1-pound packages for the retailmarket, while cull and processing carrots are usually shipped in 50 poundbags.
Production Perils
Excessive rainfall, and to a lesser extent, freeze damage, are the majornatural perils for carrot production in Texas. Hurricanes and thunderstormscreate the most serious threat from flooding. Excessive water in the fieldscan lead to a buildup of root-borne diseases and can induce root fading. Carrots are a cool-weather crop and can withstand light frosts. However,freezes can damage the top and stunt growth, causing problems at harvest.
Blowing sand and hot winds were identified as a minor nuisance. Although hailis usually not considered to be a production peril for carrots in Texas, somelosses can occur if the tops are severely damaged.
Insects and Diseases
The major insects affecting Texas carrot production are carrot weevils, wireworms, white grubs, aphids, leafhoppers, spider mites, flee beetles, and beetarmyworm. The major diseases are Alternaria, Cercospora, powdery mildew, andcotton root. Nematodes are also a problem in some areas of Texas.
Demand for Insurance
There may be less demand for carrot crop insurance from growers in Texas thanfrom those in the more northern states. Growers in Texas are larger and morediversified than growers in northern states. Crop losses affecting carrots,consequently, can better be offset by returns from other crops.
Washington
Washington produces fresh and processing carrots. The state accounted for808,000 cwt. or 4 percent, of U.S. fresh market carrots in 1993, and 180,000tons, or 36 percent of U.S. processing carrot production. Washington is thelargest carrot processing state. Acres for harvest in the state totalled7,600 in 1993, with a yield of 580 cwt. per acre. The total market value ofWashington fresh carrots in 1993 was $11.0 million, and $12.4 million forprocessing carrots.

50
The 1987 Census of Agriculture indicated that there were 123 growers in 4principal counties. Most of the carrot acreage is irrigated, with a smallamount of processing carrots grown on nonirrigated land.
Harvesting and Marketing
Washington carrots are machine harvested, with most of the harvesting done byprocessor-owned harvesters. Hauling from the fields to the processingfacility is done by custom haulers. Carrots are harvested by digging, afterthe tops are crowned (the tops cut off). Sometimes, sugarbeet harvesters areused. Although harvesting usually ends in November, harvesting can continueinto December or January, if the weather permits.
The majority of Washington carrots go to the processing market, with a smallamount of fresh carrots cut into baby carrots. Diced carrots are the majorprocessing product. There are 6 to 7 major processors in Washington whocontract for carrot acreage, guaranteeing growers a minimum price for a givenquality and tonnage.
Production Perils
Production perils in Washington are generally minor. Although carrots aregrown in a variety of areas throughout the state, irrigation water anddrainage is usually adequate. During the growing season, extreme temperaturesare uncommon and very little damaging hail and wind generally occurs. Sincecarrots are harvested by digging in Washington, the tops are not necessary forpulling at harvest.
Insects and Diseases
Nematodes are a problem in some areas, but if they are detected before thecarrots are planted, the ground is fumigated. There are some areas that havecutworms, aster yellows, alternaria leaf blight, and soft rot, but most can becontrolled when the problem is identified.
Demand for Insurance
There may be less demand for carrot crop insurance from growers in Washingtonthan in other states because production perils are perceived as minor andbecause most of the market is for processing carrots.
Wisconsin
In 1993, Wisconsin produced a small amount of fresh market and processingcarrots, accounting for less than 1 percent of U.S. production. About 3,900acres were harvested, with a yield of 360 cwt. per acre. The total marketvalue for Wisconsin carrots was not available in 1993 because Wisconsinproduction was combined with New Jersey and Ohio.

51
Wisconsin has a summer and a fall crop, with harvesting of the summer croprunning from August through early October, and the fall harvest extending intoNovember. The 1987 Census indicated that there were 92 growers in 3 principalcounties. Of those growers, most have small acreages, with about 40 percentof the acreage irrigated.
Production Practices
Carrots are usually planted March 15 through April 30 for the summer crop andMay 15 through June 30 for the fall crop. Carrots are usually grown on muckand organic loam soils.
Harvesting and Marketing
Most carrots are machine harvested in Wisconsin, with growers harvesting mostof their fresh market acreage first and the processing acreage later. WhileWisconsin growers used to crown (cut off the tops) and dig their carrots, theynow also use harvesters that pull the carrots with the tops intact.
While the majority of Wisconsin carrots are used for processing, they alsosupply peeled baby carrots to the fresh market. Approximately 30 percent ofWisconsin's fresh market carrots are cut into baby carrots. Growers inWisconsin supply the jumbo market with the remainder of their fresh marketcarrots.
California is the major supplier in the U.S. market and the amount of carrotsbeing shipped by handlers in California appears to be the major factor indetermining prices in Wisconsin. Most producers contract with packer-shippersbefore planting, with a minimum price guaranteed for a certain yield andquality. Growers who market processing carrots pay a voluntary contributionfor promotion.
Production Perils
The major production perils in Wisconsin are excessive rainfall, high summertemperatures, excessive cold during the spring, and drought. Excessiverainfall, where good drainage is a problem, can result in bacterial rot orother diseases. Excessively high temperatures without adequate moisture canresult in bitter-tasting, woody carrots. Cold temperatures in the spring candamage emergence and stunt plant growth.
Hail is usually not considered to be a production peril for carrots inWisconsin, even though they are harvested by pulling the tops. If the topsare damaged beyond harvesting by this method, most growers would be able toobtain a dig harvester. Wind can be a problem when the plants are small. Freezing temperatures are not usually a problem because the fresh marketcarrots, for which quality is of highest importance, are harvested before theprocessing carrots, which can withstand some quality loss from freeze damage.

52
Insects and Diseases
Nematodes are a problem on muck soils. Alternaria leaf blight, Cercosporaleaf blight, and aster yellows are serious problems in Wisconsin. Growers usetreated seed to control aster yellows. Field applications of fungicides areused for leaf blight when a problem is detected.
Demand for Insurance
There may be more potential demand for carrot crop insurance from growers inWisconsin than from those in California and Florida. Growers in Wisconsin aresmaller and less diversified into other vegetables. With about 40 percent ofthe carrot acres irrigated, Wisconsin growers rely more on favorable weatherand moisture conditions.
Ad Hoc Disaster Assistance for Carrots
Ad hoc disaster assistance legislation was made available for losses ofcommercially-grown crops in each of the years 1988-93. Ad hoc paymentsprovide an indication of high-loss areas during that period, and may indicatestates and counties that would face relatively high risk under a potentialFCIC carrot policy. These data may also suggest the areas where the demandfor a carrot crop insurance policy would be relatively high.
Under the 1988-93 legislation, payments were made under the categories ofparticipating program crops, nonparticipating program crops, sugar, tobacco,peanuts, soybeans, sunflowers, nonprogram crops, ornamentals, and at times,aquaculture. Producers without crop insurance--the case for carrots--wereeligible for payments for losses greater than 40 percent of expectedproduction. If a producer had no individual yield data to use in calculating"expected production," county-level or other data were used as a proxy. Payment rates for carrots were based on 65 percent of a 5-year average price,dropping the high and low years.
Disaster assistance payments for carrots totalled $10.3 million over the 1988-93 period, and were made in the categories of fresh carrots, carrots forprocessing, baby carrots, and carrots for seed. Payments for carrot lossespeaked at $3.8 million in 1988, and were over $1.3 million in each of theyears 1989, 1991, and 1993. Ad hoc payments made for carrots accounted forabout 0.4 percent of the total payments made for specialty crops over the1988-93 period.
Ad hoc disaster payments for carrots were scattered over a geographicallybroad area. Forty-three states received payments in at least one of the 6years. Idaho, Michigan, Minnesota, New Jersey, Oregon, Texas, Washington, andWisconsin collected payments for carrot losses in all years. Further,payments were reported in a variety of states for which NASS does not collectdata on carrots--including Alaska, Hawaii, and Montana.

53
In total, 246 counties received disaster payments for carrots in at least oneof the six years. When counties are ranked by payments, Grant county inWashington state ranked first, receiving $741,000 in carrot payments over the6-year period. Hardin county, Ohio and Hidalgo county, Texas ranked secondand third, receiving $723,000 and $720,000 in payments, respectively. Amongthe top-10 recipient counties, four were in Michigan, and one each werelocated in Washington, Ohio, Texas, Wisconsin, New Jersey, and Iowa.
Ad hoc disaster data can be used to indicate which carrot-producing areas havereceived large payments relative to their production. For example, Californiaaccounted for about 57 percent of total U.S. carrot harvested acreage between1988-93, but received only 4 percent of the payments made for carrots overthat period (Table 16). Similarly, Florida accounted for an average 9 percentof harvested acreage, and received virtually no carrot disaster assistancepayments over the same period.
In contrast, Michigan and Ohio collected a high proportion of paymentsrelative to production. Michigan accounted for 7 percent of U.S. harvestedarea over the years 1988-93, and received 31 percent of total carrot payments. Likewise, Ohio had a very small harvested area, and collected 11 percent ofcarrot disaster payments. Payments were made to at least one Michigan carrotgrower in each of the 6 years. The maximum collected in any year in Michiganwas $1.1 million (in 1989). In four of the six years, over $350,000 was paidin that state.
These data suggest that, under a potential carrot policy, the probability ofyield losses for carrots in the Michigan-Ohio is considerably greater than inCalifornia and Florida. Extension contacts in Michigan indicate that, inrecent years, either too much or too little rain has been a serious problemresulting in yield losses.
Carrot Insurance Implementation Issues
Crop Abandonment
In the lettuce and celery reports, abandonment and selective harvesting werediscussed as issues. That is, when market prices fall below harvesting andmarketing costs, the crop may be abandoned for economic reasons. Abandonmentoccurs because the grower incurs a smaller loss by abandoning the crop than byharvesting and selling. Abandonment for economic reasons would reduce thegrower's APH, and distort his or her true production potential unless an in-field yield were estimated for the abandoned acres.
A large California carrot grower indicated that economic abandonment may occurin the event of low carrot prices. However, abandonment is uncommon, and of adifferent nature than for lettuce and celery. For lettuce and celery,abandonment is often selective, with the largest heads or stalks harvested andthe remainder left in the field. Since hand labor is generally used forharvesting these two crops, this selectivity is manual.

54
Table 16--Disaster assistance payments for carrots, 1988-93
Average Total carrot Share ofState harvested disaster U.S. carrot acreage, Share of payments, disaster 1988-93 U.S. acreage 1988-93 payments
--Acres-- --Percent-- --Dollars-- --Percent--
Arizona 1,450 2 0 0California 56,417 57 447,097 4Florida 9,100 9 1,633 0Michigan 6,817 7 3,180,343 31 Minnesota 1,750 2 628,198 6New York 1,233 1 123,333 1 Ohio NR 0 1,123,175 11Oregon 1,508 2 69,513 1 Texas 7,467 8 1,503,355 15Washington 6,667 7 1,006,022 10 Wisconsin 3,500 4 963,096 9
U.S. 99,708 100 10,312,279 100
NR = not reported.
Source: ASCS data files, compiled by the General Accounting Office.

55
In contrast, carrots are machine harvested. As a result, a grower must makean all-or-nothing decision as whether to harvest or to abandon the entirefield. As a practical matter, abandonment in carrots is more often due tonematode or disease problems than to economic factors.
Setting Reference Prices
FCIC provides a reference price (price election) for the insured crop whichbecomes the basis for assigning value (the price guarantee) to yield losses. The insured grower elects a price guarantee, normally between 30 and 100percent of the reference price. The reference price needs to be high enoughto provide reasonable protection for insuring farmers, but not so high that itprovides incentive for crop failure (moral hazard).
FCIC would likely want to offer separate reference prices (as well as separatepolicies) for fresh carrots and processing carrots. This is becauseprocessing carrot prices are typically about one-third the amount of freshcarrot prices.
Using one price for all carrots--whether fresh or processing--could result inover-compensation on processing carrots and under-compensation for fresh-market carrots. Fresh-carrot growers would likely have little incentive topurchase crop insurance because of the low expected compensation for losses. In contrast, if the fresh carrot price applied to processing carrots, moralhazard could likely be a problem for processing carrots.
In addition, reference prices would be best set by state or region. This isbecause different states harvest at different times during the year, andconfront different regional price patterns. USDA does not project carrotprices. Such information would need to be projected based on USDA data onsupply and use and contacts with extension agents and the industry.
The discussions in the lettuce and celery reports regarding in-field pricedetermination are also relevant here. However, due to length, they are notrepeated.
Multiple Harvests on a Unit
In many northern production areas, carrot growers generally plant and harvesta single crop within the year. Entire fields are harvested at a time. Insuch areas, the extended (or multiple) harvest situation is not as significantan issue as discussed in the lettuce and celery reports.
In states such as California, however, and in various other states, growersmay produce several carrot crops on one parcel of land. Growers in thissituation may be reluctant to purchase crop insurance which only guaranteesseason-average yields because the severity of losses during an interval withinthe season are concealed by averaging over the season.

56
One method for dealing with this problem would be to define distinct plantingperiods and establish different premium rates for each period. With such aplan, growers would be more likely to qualify for indemnity payments whenlosses occurred to a part of their year's crop because losses for one plantingperiod would not be off-set by normal yields during other periods.
Estimating "Appraised Production"
Carrot yields in the field can be estimated by using a row-sampling procedure. For instance, a sample of perhaps 1/10,0000th of a row could be hand dug, andthe volume of carrots recovered converted to a per-acre yield. NASS uses asimilar procedure for it's objective yield survey for potatoes, except thatthe sample units would be sections of a row, rather than a hill of potatoes.
Moral Hazard
There is the potential for moral hazard in carrot insurance, particularly iflow market prices result in an indemnity payment producing a higher net returnthan that obtained from harvesting a crop. As a practical matter, however,moral hazard does not appear likely to be a major problem. In order for moralhazard to arise, a yield loss would need to occur due to some contributingaction or lack of action (such as neglecting pest control practices) on thepart of the grower.
Yield losses to nematodes and diseases could occur if a grower neglected tofollow prudent pest management practices. It is unlikely that a grower wouldneglect proper pest management in order to collect an insurance indemnity,however, because a pest buildup may be difficult to eradicate and create aperil for future crops when market prices may be higher.
Individual Yield Data
Individual yield data are available from various cooperative organizations andlarge grower-shippers. Many of the large grower-shippers not only farm theirown acreage, but also contract with smaller growers for production, for whomthey may well have production and/or yield data. In addition, organizationssuch as the California Fresh Carrot Advisory Board indicated that data areavailable on acreage and yields for large California growers.
The manager of the California Fresh Carrot Advisory Board indicated that hisorganization collects data for growers who produce 10 million or more poundsof carrots each year, encompassing 10-12 growers and/or packers. The Boardrecently increased the reporting cut-off to 10 million pounds, up from 100,000pounds. This action reduced the number of reporting growers and/or packers byonly two to three. The Board has collected data for several years in order tofund carrot promotion. In 1994, the "check-off" was 2 cents for every 50pounds of carrots produced. Minnesota and Wisconsin also conduct promotionalefforts that may provide a source of yield data.

57
Quality Losses and Indemnity Payments
Although it does not appear common, it is possible for a grower divert carrotsthat have been planted for the fresh market to the processing market if thequality of the carrots turns out to be below fresh market standards. Becausemore carrots in a field can be acceptable in the processing market than in thefresh market, the processing market yield can be higher than the fresh marketyield, although the price for processed carrots is much lower.
That is, a grower's yield could be above the yield guarantee based on freshmarket production, and insurance based on yield alone would not be triggeredeven though the much lower price received for processing carrots would resultin lower per acre revenue. To avoid this situation, a "Dollar Plan"endorsement, similar to that used for fresh market tomatoes, may be offeredfor fresh market carrot production.
Under the fresh market tomato dollar plan endorsement the level of insuranceis the greater of the number of cartons harvested multiplied by a specifiedprice per carton or the actual number of cartons sold multiplied by the pricereceived minus allowable costs. In other words, a dollar amount of revenue isbeing guaranteed rather than a number of pounds or tons of production paid ata price election.
In contrast, processing market policies need not account for potentialdiversion. These policies could easily take the form of the "yield loss"approach used for processing tomatoes and grain crops.
Demand for Insurance
Participation in carrot crop insurance, relative to the state's production, might be higher in Michigan, Ohio, Minnesota and other states that havereceived large disaster payments in recent years than in California.
In general, growers in Michigan, Ohio, and certain other northern producingareas rely less on irrigation than in other areas. In addition, producers inthese areas generally have a lower value of sales and appear to be somewhatless diversified in the sources of their farm receipts than growers inCalifornia and Florida.
Since 1990, FCIC has received requests for carrot insurance from California (5requests), Florida, Iowa, Minnesota, North Dakota, and Ohio. Although it isexpected that smaller growers in California would have an interest in carrotinsurance, the percent of carrot acres in that state that would likely beinsured is fairly small. In contrast, a larger percent of growers (and acres)would be expected to be insured in the upper Midwest.

58
References
Bentley, Nancy L. Window of Opportunity: The Market for Specialties andOrganics. The Food Circle. Minneapolis, MN. 1987.
Bohall, Robert. Pricing Performance in Marketing Fresh Winter Carrots.Marketing Research Report No. 963. U.S. Department of Agriculture, EconomicResearch Service. 1992.
Bolthouse, William. Owner of Bolthouse Farms in California. PersonalCommunication.
Browne, Greg T. Cooperative Extension Agent (Farm Advisor). Kern County, CA. Personal Communication.
California Department of Food and Agriculture. California AgricultureStatistical Review, 1992. Sacramento, California. July 1993.
California Agriculture Statistics Service. County Agricultural Commissioners'Annual Reports. 1980-1992. Department of Food and Agriculture. Sacramento,California.
Capinha, Victor. Manager of Grimmway Farms in California. PersonalCommunication.
Carrot Advisory Board. Annual Report. April 1, 1992 - March 31, 1993.Salinas, CA.
Federal-State Market News Service. Los Angeles Fresh Fruit and VegetableWholesale Market Prices, 1991. U.S. Department of Agriculture. Los Angeles,CA. 1991.
Federal-State Market News Service. San Francisco Fresh Fruit and VegetableWholesale Market Prices, 1991. U.S. Department of Agriculture. SanFrancisco, CA. 1991.
George, P. S. and G. A. King, "Consumer Demand for Food Commodities in theUnited States with Projections 1980." Giannini Foundation Monograph No. 26.March 1976.
Huang, K. and R. C. Haidacher, "Estimation of a Composite Food Demand Systemfor the United States." Journal of Business and Economic Statistics. 1983. pp. 285-91.
Metcalfe, J.P. and P.C. Rickard. "Carrots: Production, Harvesting andPreservation of Quality During Marketing." Report of a study tour inCalifornia. 1982.
Nonnecke, Ib Libner. Vegetable Production. Van Nostrand Reinhold: New York,1989.

59
United Fresh Fruit and Vegetable Association. Fruit and Vegetable Facts andPointers. Washington, D.C. March 1976.
University of California. Cooperative Extension Service. "Sample Costs toProduce Carrots, Kern County, 1987." Kern County, California.
University of California. Cooperative Extension Service. "Carrots: Projected Production Costs, Imperial County, 1992-1993." Imperial County,California.
U.S. Department of Agriculture. Agricultural Research Service. CarrotProduction in the United States. Agriculture Handbook No. 375. WashingtonD.C. 1970.
U.S. Department of Agriculture. Agricultural Research Service. CommercialGrowing of Carrots. Leaflet No. 353. Washington, D.C. 1963.
U.S. Department of Agriculture. Agricultural Stabilization and ConservationService. Disaster Assistance Data Files, 1988-93. Compiled by the GeneralAccounting Office.
U.S. Department of Agriculture. Economic Research Service. Vegetables andSpecialties Situation and Outlook. Various issues.
U.S. Department of Agriculture. Federal Crop Insurance Corporation. Specialparticipation analyses (Dan Orr). 1994.
U.S. Department of Agriculture. National Agricultural Statistics Service. Agricultural Chemical Usage. Vegetables. 1992 Summary. Ag Ch 1(93). June1993.
__________. Vegetables. Annual Summaries.
U.S. Department of Agriculture. Statistical Reporting Service. UsualPlanting and Harvesting Dates for Fresh Market and Processing Vegetables.Agricultural Handbook No. 507. February 1977.
U.S. Department of Commerce. Bureau of the Census. Export and import datafiles. Various years.
U.S. Department of Commerce. Census of Agriculture, 1987. (Including specialruns requested by USDA/ERS.)
Wohlgenant, Michael, "Demand for Farm Output in a Complete System of DemandFunctions." American Journal of Agricultural Economics. Vol. 71, 1989. pp.241-252.
Yamaguchi, M. World Vegetables: Principles, Production and Nutritive Values.University of California. Davis, California. March 1978.

60
Carrot Contacts
California:William Bolthouse FarmsBill Bolthouse or Marvin CurlissBakersfield, CA(805) 366-7205
Grimmway FarmsBob Grimm or Victor CapinhaLaMont, CA(805) 845-9431
Greg BrowneFarm AdvisorKern County, CA(805) 837-8992
Mary Louise FlintDirectorIPM EducationDavis, CA(916) 752-7692
Jerry MunsonManagerCalifornia Fresh Carrot Advisory boardFresno County, CA(209) 591-5675
Vincent RubatzkyCrop SpecialistUniversity of California, Davis(916) 752-1247
Mike Yurosek and Sons FarmsDon Cox or Randy ClarkLaMont, CA(805) 845-3764
Grower-Shipper Vegetable Association of Central CaliforniaSalinas, CA(805) 422-8844
Grower-Shipper Vegettable Association of Santa Barbara andSan Luis Obispo Counties(805) 343-2215
Western Grower AssociationSacramento, CA(916) 446-1435

61
Colorado:James EllsExtension Horticulture Specialist, Vegetable CropsColorado State UniversityFort Collins, CO(303) 491-7018
Florida:Tom BewickExtension Horticulture Specialist, Vegetable CropsUniversity of FloridaGainsville, FL(904) 392-1928
Michigan:Allen ShapleyVegetable Production SpecialistMichigan State UniversityEast Lansing, MI(517) 353-4380
Minnesota:V. A. FritzVegetable Crop Production SpecialistUniversity of MinnesotaSt. Paul, MN(612) 624-3665
New York:Ray EllerbrockVegetable Crop SpecialistCornell UniversityIthaca, NY(607) 255-6553
Oregon:Tim CrossFarm Management SpecialistOregon State UniversityCorvallis, OR(503) 737-2942
Texas:Jeff JohnsonVegetable Crop SpecialistTexas A&M UniversityCollege Station, TX(210) 968-5581

62
Washington:Herb HinmanVegetable SpecialistWashington State UniversityPullman, WA(509) 335-5555
Gary PeltorCounty Extension Vegetable SpecialistGrant County, WA(509) 754-2011
Eric SorensonCounty Extension Vegetable SpecialistFranklin County, WA(509) 545-3511
Wisconsin:Phil SimonVegetable Horticulture SpecialistUniversity of WisconsinMadison, WI(608) 262-1248

63
Appendix table 1--Farms producing carrots and acres harvested and irrigated, 1987 and1982
: 1987 : 1982 State and :
major counties : Number Harvested Irrigated : Number Harvested Irrigated : of Farms Acres Farms Acres : of Farms Acres Farms Acres : : California : 250 37,869 250 37,869 : 221 32,582 221 32,582 Imperial : 29 13,186 29 13,186 : 20 6,343 20 6,343 Kern : 63 13,085 63 13,085 : 44 11,630 44 11,630 Monterey : 53 4,505 53 4,505 : 60 4,832 60 4,832 Riverside : 13 2,058 13 2,058 : 13 4,888 13 4,888 Other : 92 5,035 92 5,035 : 84 4,889 84 4,889 : : Colorado : 28 1,294 28 1,294 : 36 926 36 926 Weld : 7 932 7 932 : 6 549 6 549 Other : 21 362 21 362 : 30 377 30 377 : : Florida : 25 10,397 25 10,397 : 29 10,497 29 10,497 Orange : 10 6,423 10 6,423 : 11 6,191 11 6,191 Lake : 3 (N) 3 (N) : 4 2,988 4 2,988 Other : 12 3,974 12 3,974 : 14 1,318 14 1,318 : : Michigan : 133 7,890 64 4,822 : 161 6,345 58 3,765 Newaygo : 18 1,778 16 1,234 : 25 2,079 15 1,598 Lapeer : 13 1,619 6 916 : 13 1,329 4 408

64
Muskegon : 3 450 3 396 : 3 315 2 (N) Oceana : 9 265 3 (N) : (N) (N) (N) (N) Eaton : 5 261 (N) (N) : (N) (N) (N) (N) Jackson : 3 255 1 (N) : 3 (N) (N) (N) Other : 82 3,262 35 2,276 : 117 2,622 37 1,759 : : Minnesota : 63 2,145 20 (N) : 62 1,857 14 92 Chisago : 3 865 1 (N) : 3 (N) 1 (N) Freeborn : 8 587 1 (N) : 5 (N) (N) (N) Anoka : 6 500 1 (N) : 8 (N) 1 (N) Other : 46 193 17 (N) : 46 (N) 12 (N) : : New Jersey : 28 257 13 201 : 43 765 16 626 : : New Mexico : 10 158 10 158 : 18 10 18 10 : : New York : 118 1,002 36 394 : 136 942 39 251 Yates : 4 331 (N) (N) : 6 214 (N) (N) Other : 114 671 36 394 : 130 728 39 251 : : Ohio : 24 1,747 9 224 : 44 1,257 8 (N) Henry : 5 916 1 (N) : 5 970 1 (N) Hardin : 3 500 1 (N) : (N) (N) (N) (N) (N) Other : 16 331 7 224 : 39 287 8 0 : : Oregon : 71 1,250 65 971 : 118 1,918 107 1,806 Umatilla : 5 302 4 142 : 3 486 3 486 Lane : 14 276 12 252 : 25 508 23 504 Marion : 12 198 12 198 : 14 211 13 211

65
Other : 40 474 37 379 : 76 713 68 605 : : Texas : 138 10,612 122 10,522 : 152 12,961 137 12,181 Hidalgo : 55 6,632 55 6,619 : 67 6,545 67 6,545 Uvalde : 12 792 12 792 : 6 731 6 731 Zavala : 5 237 5 237 : 9 463 9 463 Parmer : 9 232 9 232 : 4 303 4 303 Castro : 5 221 5 221 : 5 637 4 617 Other : 52 2,498 36 2,421 : 61 4,282 47 3,522 : : Washington : 123 5,666 93 5,027 : 153 4,338 103 3,380 Franklin : 12 1,554 12 1,554 : 10 1,023 10 1,023 Grant : 11 1,184 11 1,184 : 17 1,317 17 1,308 Whatcom : 11 767 9 602 : 11 550 5 440 Skagit : 11 599 4 143 : 12 860 1 (N) Other : 78 1,562 57 1,544 : 103 588 70 609

66
Appendix table 1--Farms producing carrots and acres harvested and irrigated, 1987 and1982, continued
: 1987 : 1982 State and :
major counties : Number Harvested Irrigated : Number Harvested Irrigated : of Farms Acres Farms Acres : of Farms Acres Farms Acres : : Wisconsin : 92 4,551 24 1,781 : 89 4,376 17 474 Jefferson : 8 1,005 2 (N) : 6 1,066 4 142 Marquette : 4 607 1 (N) : 6 565 1 (N) Manitowoc : 8 244 (N) (N) : 19 191 1 (N) Other : 72 2,695 21 1,781 : 58 2,554 11 332 : :These States : 1,103 84,838 759 73,660 : 1,262 78,774 803 66,590United States : 1,580 89,393 966 77,561 : 1,939 83,601 1,049 70,564
(N): Indicates "not available" or "not published" to avoid disclosure of individualoperations.1

67
1

68
Appendix table 2--CARROTS: Size distribution of farms, by sales class, 1987 Total value of crop sales State All $500,000 $100,000 $50,000 $25,000 Less farms or to to to than more $499,999 $99,999 $49,999 $25,000
--------------------Number of farms----------------- Arizona 11 6 1 1 0 3 California 250 124 56 8 13 49 Colorado 28 4 6 2 1 15 Florida 25 13 2 2 0 8 Michigan 133 22 45 12 13 41 Minnesota 63 8 10 2 4 39 New York 118 9 19 14 11 65 Texas 138 35 60 4 5 34 Washington 123 19 22 8 11 63 Wisconsin 92 12 16 16 9 39 Other States 599 31 121 59 57 331 United States 1,580 283 358 128 124 687
Source: 1987 Census of Agriculture.
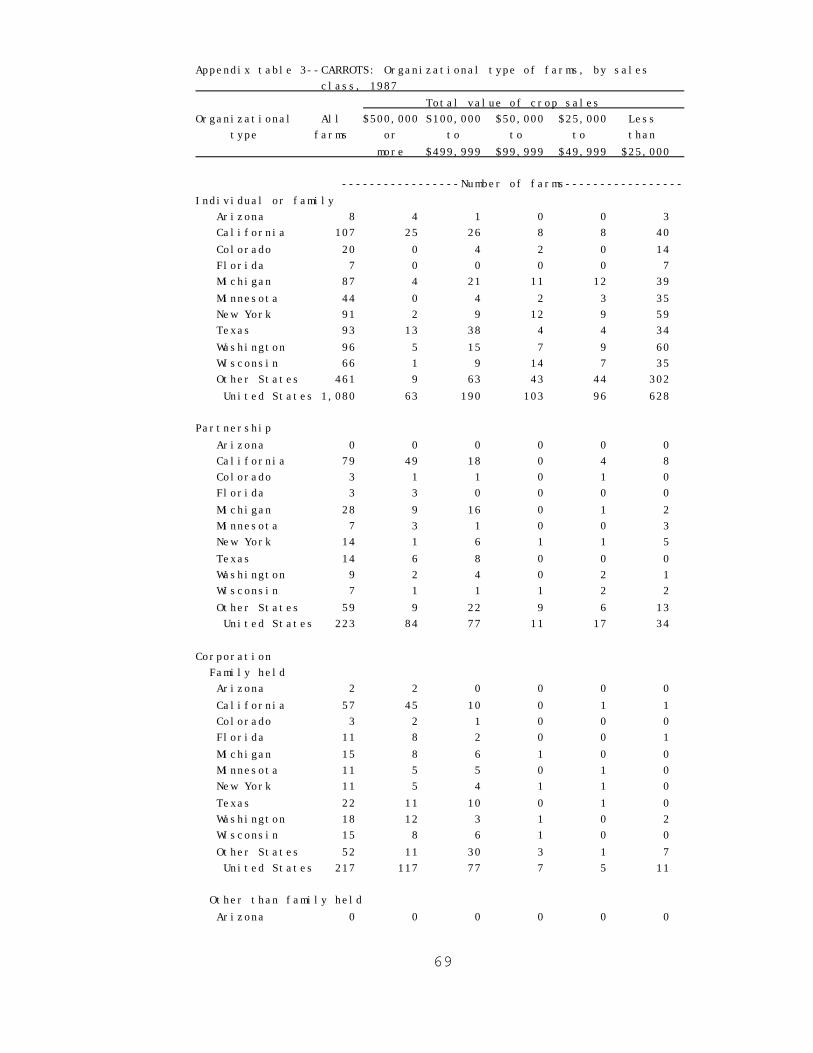
69
Appendix table 3--CARROTS: Organizational type of farms, by sales class, 1987 Total value of crop sales Organizational All $500,000 S100,000 $50,000 $25,000 Less type farms or to to to than more $499,999 $99,999 $49,999 $25,000
-----------------Number of farms----------------- Individual or family Arizona 8 4 1 0 0 3 California 107 25 26 8 8 40 Colorado 20 0 4 2 0 14 Florida 7 0 0 0 0 7 Michigan 87 4 21 11 12 39 Minnesota 44 0 4 2 3 35 New York 91 2 9 12 9 59 Texas 93 13 38 4 4 34 Washington 96 5 15 7 9 60 Wisconsin 66 1 9 14 7 35 Other States 461 9 63 43 44 302 United States 1,080 63 190 103 96 628
Partnership Arizona 0 0 0 0 0 0 California 79 49 18 0 4 8 Colorado 3 1 1 0 1 0 Florida 3 3 0 0 0 0 Michigan 28 9 16 0 1 2 Minnesota 7 3 1 0 0 3 New York 14 1 6 1 1 5 Texas 14 6 8 0 0 0 Washington 9 2 4 0 2 1 Wisconsin 7 1 1 1 2 2 Other States 59 9 22 9 6 13 United States 223 84 77 11 17 34
Corporation Family held Arizona 2 2 0 0 0 0 California 57 45 10 0 1 1 Colorado 3 2 1 0 0 0 Florida 11 8 2 0 0 1 Michigan 15 8 6 1 0 0 Minnesota 11 5 5 0 1 0 New York 11 5 4 1 1 0 Texas 22 11 10 0 1 0 Washington 18 12 3 1 0 2 Wisconsin 15 8 6 1 0 0 Other States 52 11 30 3 1 7 United States 217 117 77 7 5 11
Other than family held Arizona 0 0 0 0 0 0

70
California 6 5 1 0 0 0 Colorado 1 1 0 0 0 0 Florida 2 2 0 0 0 0 Michigan 3 1 2 0 0 0 Minnesota 1 0 0 0 0 1 New York 1 1 0 0 0 0 Texas 4 4 0 0 0 0 Washington 0 0 0 0 0 0 Wisconsin 2 2 0 0 0 0 Other States 13 0 5 0 4 4 United States 33 16 8 0 4 5
Other Arizona 1 0 0 1 0 0 California 1 0 1 0 0 0 Colorado 1 0 0 0 0 1 Florida 2 0 0 2 0 0 Michigan 0 0 0 0 0 0 Minnesota 0 0 0 0 0 0 New York 1 0 0 0 0 1 Texas 5 1 4 0 0 0 Washington 0 0 0 0 0 0 Wisconsin 2 0 0 0 0 2 Other States 14 2 1 4 2 5 United States 27 3 6 7 2 9 Source: 1987 Census of Agriculture.

71
Appendix table 4--CARROTS: Principal occupation of farm operators, by sales class, 1987
Total value of crop sales
Item All $500,000 $100,000 $50,000 $25,000 Less farms or to to to than more $499,999 $99,999 $49,999 $25,000
------------------Number of farms----------------- Farming is main occupation Arizona 7 6 1 0 0 0 California 228 120 52 7 11 38 Colorado 23 4 6 2 1 10 Florida 21 13 2 2 0 4 Michigan 110 21 45 12 9 23 Minnesota 37 7 8 2 3 17 New York 94 9 19 14 10 42 Texas 109 30 57 3 3 16 Washington 88 19 21 8 9 31 Wisconsin 69 11 15 11 6 26 Other States 442 31 116 58 51 186 United States 1,228 271 342 119 103 393
----------------Percent of all farms--------------
Arizona 63.6 54.5 9.1 0.0 0.0 0.0 California 91.2 48.0 20.8 2.8 4.4 15.2 Colorado 82.1 14.3 21.4 7.1 3.6 35.7 Florida 84.0 52.0 8.0 8.0 0.0 16.0 Michigan 82.7 15.8 33.8 9.0 6.8 17.3 Minnesota 58.7 11.1 12.7 3.2 4.8 26.9 New York 79.7 7.6 16.1 11.9 8.5 35.6 Texas 79.0 21.7 41.3 2.2 2.2 11.6 Washington 71.5 15.4 17.1 6.5 7.3 25.2 Wisconsin 75.0 12.0 16.3 12.0 6.5 28.2 Other States 73.8 5.2 19.4 9.7 8.5 31.0 United States 77.7 17.2 21.6 7.5 6.5 24.9
------------------Number of farms----------------- Operator days off-farm None Arizona 6 5 1 0 0 0 California 160 96 34 4 6 20 Colorado 17 4 6 2 1 4 Florida 16 10 2 2 0 2 Michigan 81 20 32 6 8 15 Minnesota 33 5 9 2 1 16 New York 73 4 17 11 8 33

72
Texas 80 20 41 3 2 14 Washington 65 18 16 4 7 20 Wisconsin 48 8 13 8 4 15 Other States 274 28 91 32 17 106 United States 853 218 262 74 54 245
Any Arizona 5 1 0 1 0 3 California 68 20 15 3 6 24 Colorado 11 0 0 0 0 11 Florida 8 2 0 0 0 6 Michigan 42 1 7 4 5 25 Minnesota 29 2 1 0 3 23 New York 40 3 1 3 3 30 Texas 47 9 15 1 3 19 Washington 51 0 4 4 4 39 Wisconsin 34 2 2 6 5 19 Other States 292 2 19 23 36 212 United States 627 42 64 45 65 411
Continued

73
Appendix table 4--CARROTS: Principal occupation of farm operators, by sales class, 1987--Continued
Total value of crop sales
Item All $500,000 $100,000 $50,000 $25,000 Less farms or to to to than more $499,999 $99,999 $49,999 $25,000
------------------Number of farms----------------- 1 to 99 days Arizona 1 0 0 1 0 0 California 24 8 6 1 2 7 Colorado 5 0 0 0 0 5 Florida 0 0 0 0 0 0 Michigan 15 0 3 4 1 7 Minnesota 5 1 0 0 0 4 New York 9 3 1 0 0 5 Texas 16 1 9 0 2 4 Washington 10 0 0 2 1 7 Wisconsin 9 0 1 3 1 4 Other States 111 0 13 14 20 64 United States 205 13 33 25 27 107
100 to 199 days Arizona 1 0 0 0 0 1 California 19 5 2 1 1 10 Colorado 4 0 0 0 0 4 Florida 3 1 0 0 0 2 Michigan 11 0 4 0 2 5 Minnesota 8 0 0 0 0 8 New York 7 0 0 1 1 5 Texas 6 1 0 0 1 4 Washington 16 0 2 1 0 13 Wisconsin 8 0 1 3 1 3 Other States 82 0 3 6 9 64 United States 165 7 12 12 15 119
200 days or more Arizona 3 1 0 0 0 2 California 25 7 7 1 3 7 Colorado 2 0 0 0 0 2 Florida 5 1 0 0 0 4 Michigan 16 1 0 0 2 13 Minnesota 16 1 1 0 3 11 New York 24 0 0 2 2 20 Texas 25 7 6 1 0 11 Washington 25 0 2 1 3 19 Wisconsin 17 2 0 0 3 12 Other States 99 2 3 3 7 84 United States 257 22 19 8 23 185

74
Not reported Arizona 0 0 0 0 0 0 California 22 8 7 1 1 5 Colorado 0 0 0 0 0 0 Florida 1 1 0 0 0 0 Michigan 10 1 6 2 0 1 Minnesota 1 1 0 0 0 0 New York 5 2 1 0 0 2 Texas 11 6 4 0 0 1 Washington 7 1 2 0 0 4 Wisconsin 10 2 1 2 0 5 Other States 33 1 11 4 4 13 United States 100 23 32 9 5 31
Source: 1987 Census of Agriculture.

75
Appendix table 5--California carrot production, by county, 1980-92
Harvested Yield Total
County Year Acreage /acre Production
Comments --tons-- --
tons--
KERN 1980 11,800 11.20 132,000 Data prior
to 1985 appear
fresh+proc. 1981 13,600 12.90 176,000 to reflect
only fresh market
1982 13,700 13.70 188,000 yields and
production.
1983 13,200 10.60 140,000
1984 14,900 10.90 163,000
1985 12,600 23.10 291,000
1986 12,816 35.00 449,000
1987 18,430 30.00 553,000
1988 20,854 27.00 563,000
1989 28,304 25.00 708,000
1990 29,552 28.50 841,000
1991 35,000 28.50 996,000
1992 44,822 27.90 1,250,000
IMPERIAL
all fresh 1980 6,206 18.00 111,708 All county
carrot production
1981 5,912 19.00 112,623 goes to the
fresh market.
1982 6,412 21.80 139,461
1983 10,008 20.80 208,166
1984 7,913 23.40 185,322
1985 9,472 19.00 180,157
1986 10,754 25.00 268,958
1987 12,038 25.90 312,025
1988 12,813 24.30 311,100
1989 12,661 23.80 301,585
1990 12,682 19.70 249,642
1991 9,959 18.20 180,758
1992 15,233 20.40 310,372
MONTEREY 1980 5,330 18.40 97,980 Production
figures represent

76
fresh+proc. 1981 5,095 18.00 91,535 all carrots
supplied to fresh
1982 4,470 17.60 78,770 and
processing markets.
1983 5,190 13.70 71,145
1984 5,810 22.30 129,715
1985 6,956 19.70 136,990
1986 5,290 18.70 111,910
1987 5,095 14.60 100,335
1988 5,750 19.80 134,890
1989 5,351 20.40 144,730
1990 3,180 20.10 76,800
1991 3,100 21.30 84,500
1992 3,750 24.30 109,950
fresh 1984 3,840 18.10 69,510 Production
figures prior to
1985 5,506 17.00 93,770 1984 are not
available.
1986 3,235 18.70 60,360
1987 3,450 14.60 50,280
1988 3,215 19.80 63,650
1989 2,601 20.40 53,180
1990 1,560 20.10 31,300
1991 1,590 21.30 33,800
1992 1,540 24.30 37,430
continued
Appendix table 5--California carrot production, by
county, 1980-92, continued
Harvested Yield Total
County Year Acreage /acre Production
Comments --tons-- --
tons--
Processing 1984 1,970 30.60 60,205 Production
figures prior to
1985 1,450 29.80 43,220 1984 are not
available.
1986 2,055 25.10 51,550
1987 1,645 30.40 50,055
1988 2,535 28.10 71,240
1989 2,750 33.30 91,550
1990 1,620 28.10 45,500
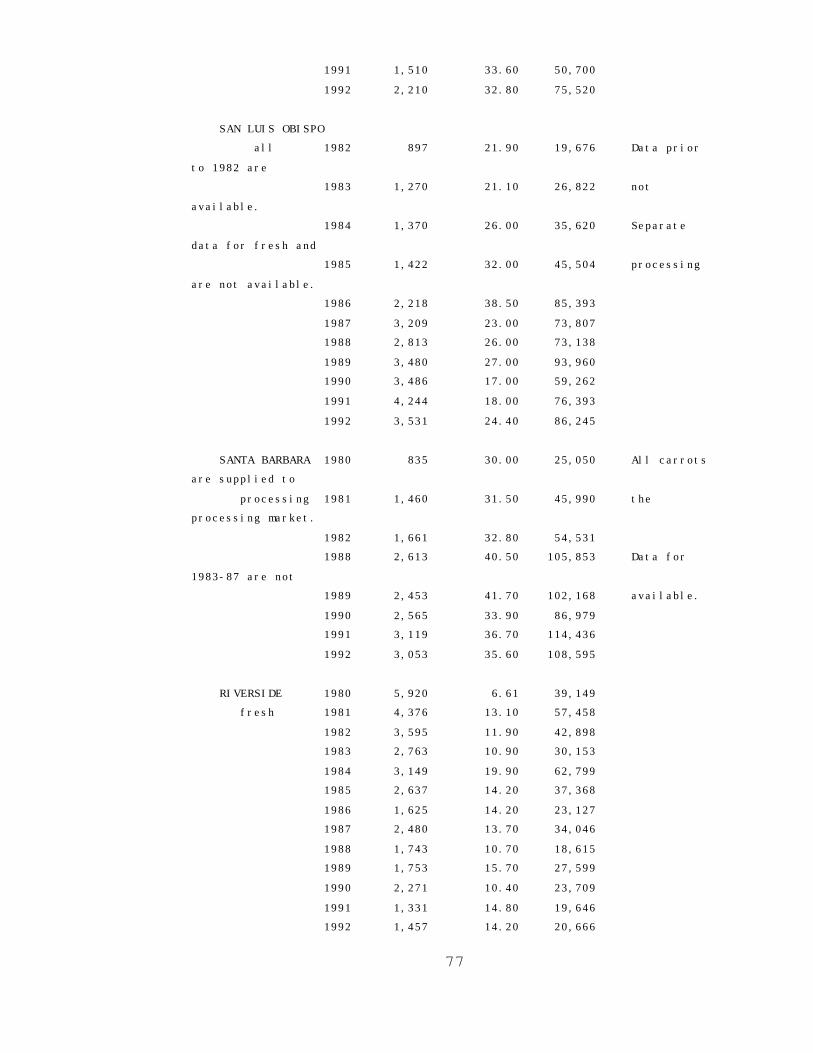
77
1991 1,510 33.60 50,700
1992 2,210 32.80 75,520
SAN LUIS OBISPO
all 1982 897 21.90 19,676 Data prior
to 1982 are
1983 1,270 21.10 26,822 not
available.
1984 1,370 26.00 35,620 Separate
data for fresh and
1985 1,422 32.00 45,504 processing
are not available.
1986 2,218 38.50 85,393
1987 3,209 23.00 73,807
1988 2,813 26.00 73,138
1989 3,480 27.00 93,960
1990 3,486 17.00 59,262
1991 4,244 18.00 76,393
1992 3,531 24.40 86,245
SANTA BARBARA 1980 835 30.00 25,050 All carrots
are supplied to
processing 1981 1,460 31.50 45,990 the
processing market.
1982 1,661 32.80 54,531
1988 2,613 40.50 105,853 Data for
1983-87 are not
1989 2,453 41.70 102,168 available.
1990 2,565 33.90 86,979
1991 3,119 36.70 114,436
1992 3,053 35.60 108,595
RIVERSIDE 1980 5,920 6.61 39,149
fresh 1981 4,376 13.10 57,458
1982 3,595 11.90 42,898
1983 2,763 10.90 30,153
1984 3,149 19.90 62,799
1985 2,637 14.20 37,368
1986 1,625 14.20 23,127
1987 2,480 13.70 34,046
1988 1,743 10.70 18,615
1989 1,753 15.70 27,599
1990 2,271 10.40 23,709
1991 1,331 14.80 19,646
1992 1,457 14.20 20,666

78
FRESNO
fresh 1986 2,400 29.00 69,600 Data prior
to 1986 are not
1987 5,000 24.00 120,000 available.
1988 3,600 30.60 110,000
1989 2,450 22.00 53,900
1990 1,460 30.00 43,800
1991 600 29.70 17,800
1992 410 21.70 8,900
Source: County Agricultural Commissioners' Reports,
California Agricultural Statistics
Service.