cars 2025: vol. 2 solving co2: engines, batteries and...
TRANSCRIPT

August 5, 2015
Cars 2025: Vol. 2
Solving CO2: Engines, Batteries and
Fuel Cells Equity Research
Endless powertrain advancement is a boon for suppliers; Aisin Seiki to Buy
Regulations drive spending to cut CO2
The automobile industry will require enormous
investments over the next decade to meet tighter
environmental regulations we expect to take effect
in different countries between 2020 and 2025. In
this second edition of Cars 2025 we look at
technologies that help reduce CO2 and discuss the
considerable potential of three: 1) engine thermal
efficiency, 2) lithium ion batteries, and 3) fuel cells.
Don’t give up on existing engines
While electrification is a major theme, we expect
95% of vehicles sold in 2025 will use gasoline or
diesel engines for at least part of their power.
Increasing thermal efficiency is vital for meeting
new standards. This will lift demand for powertrain
components that boost efficiency and limit
pollutants. We focus on advances in transmissions
(Aisin Seiki, up to Buy), the expansion of direct-
injection turbochargers (BorgWarner/ Continental),
and demand for gasoline particulate filters (NGK
Insulators). We see homogeneous charge
compression ignition as a powerful solution and
we highlight Mazda’s aim to commercialize the
world’s first HCCI product.
2017-18 as a turning point for battery
We estimate that hybrids (HVs), plug-in hybrid EVs
(PHEVs), and EVs will account for 25% of auto
sales by 2025 vs. 5% in 2015. The evolution of
lithium ion batteries for vehicle electrification is
essential and we see 2017-18 as a turning point for
cutting battery costs and increasing energy
density. Besides Tesla’s Gigafactory (targeting
cost reductions of 30-40%) Nissan and LG Chem
plan to substantially raise energy density.
Fuel cells a nascent, but key presence
Furthest out on the horizon are fuel cell vehicles
(FCVs) powered by hydrogen rather than carbon.
While we forecast FCVs’ share of the overall auto
market at just 0.5% (c.400,000 vehicles) in 2025,
their role in diversifying energy sources,
extending driving distances and meeting
California’s zero emission vehicle regulations
warrants attention. We focus on the technological
innovations in Toyota’s second FCV set for launch
around 2020.
Kota Yuzawa
+81(3)6437-9863 [email protected] Goldman Sachs Japan Co., Ltd.
Patrick Archambault, CFA
(212) 902-2817 [email protected] Goldman, Sachs & Co.
Stefan Burgstaller
+44(20)7552-5784 [email protected] Goldman Sachs International
Yipeng Yang
+86(10)6627-3189 [email protected] Beijing Gao Hua Securities Company Limited
Ashik Kurian
+44(20)7051-3084 [email protected] Goldman Sachs International
Goldman Sachs does and seeks to do business with companies covered in its research reports. As a result, investors should be aware that the firm may have a conflict of interest that could affect the objectivity of this report. Investors should consider this report as only a single factor in making their investment decision.For Reg AC certification and other important disclosures, see the Disclosure Appendix, or go to www.gs.com/research/hedge.html. Analysts employed by non-US affiliates are not registered/qualified as research analysts with FINRA in the U.S.
The Goldman Sachs Group, Inc. Global Investment Research

August 5, 2015 Global: Automobiles
Goldman Sachs Global Investment Research 2
Contents
Analyst team contributors 2
Executive summary: Fuel efficient technologies for a low-CO2 society 3
Don’t underestimate existing engines; thermal efficiency provides scope for fuel economy 10
Electric Vehicles (EVs): Tesla’s Gigafactory key to EV growth 18
Fuel Cell Vehicles (FCVs): The ultimate eco-car? 25
CO2 regulations: Intermittent tightening of regulations approaching 35
Appendix I: Stocks in focus 43
Appendix II: Tesla valuation methodology 44
Appendix III: Glossary 45
Disclosure Appendix 47
Prices in this report are based on August 3, 2015 closing prices, unless otherwise stated.
Analyst team contributors
Region Analyst Telephone email Region Analyst Telephone emailAutos/Auto parts Autos/Auto parts (Global)Japan Kota Yuzawa +81 (3) 6437 9863 [email protected] USA Patrick Archambault +1 (212) 902 2817 [email protected]
Toshihide Kinoshita +81 (3) 6437 9934 [email protected] Europe Stefan Burgtaller +44 (20) 7552 5784 [email protected] Matsuzaki +81 (3) 6437 9877 [email protected] Ashik Kurian +44 (20) 7051 3084 [email protected]
Technology (Hardware) Korea Seung Shin +82 (2) 3788 1779 [email protected] Daiki Takayama +81 (3) 6437 9870 [email protected] China Yipeng Yang +86 (10) 6627 3189 [email protected], Trading companies India Pramod Kumar +91 (22) 6616 9043 [email protected] Hiroyuki Sakaida +81 (3) 6437 9896 [email protected]
August 5, 2015 Global: Automobiles
Goldman Sachs Global Investment Research 3
Executive summary: Fuel efficient technologies for a low-CO2 society
With the transportation sector accounting for 22% of global CO2 emissions (2013), major developed economies are under
pressure to reduce vehicle CO2 g/km by 30%-40% by 2025. We estimate that cars suited to the low-CO2 society of the next
decade will need to absorb cost increases of at least US$2,500 per vehicle. This implies a US$25 bn additional cost burden
by 2025, equivalent to 20% of global automakers’ US$120 bn profit pool in 2014. Suppliers will benefit as global automakers
compete to incorporate—quickly and at a reasonable cost—powertrain technologies that get the most out of every ounce of
fuel and reduce pollutants.
In this second installment of our Cars 2025 series—where we explore seven mega trends that will transform the global auto
industry—we take an in-depth look at the technologies we expect to play the greatest role in reducing emissions. We begin with
internal combustion engine vehicles and advances that could make them as fuel efficient as today’s hybrids. We turn next to lithium
ion (Li-ion) batteries and significant advances in their cost and energy density that will speed efforts in electrification. And finally we
focus on fuel cell vehicles, which may one day become the ultimate eco-car if the industry can find ways to reduce the CO2 created
in the hydrogen production process.
Auto industry faces intermittent tightening of global fuel economy regulations
Despite diligent efforts globally, greenhouse gas emission continues to rise. We expect the major markets of Japan, the United
States, Europe, and China to tighten CO2 regulations mainly over 2020-2025. Plans call for the adoption of the World-Harmonized
Light Vehicles Test Procedure (WLTP) for testing CO2 emissions, and intermittent tightening of various regulations, including
emission (NOx, PM) standards and California’s zero emission vehicle (ZEV) regulations. It is no surprise that technologies to curb
CO2 emissions feature at the top of our ranking of products with the most growth potential through to 2020 (see Exhibit 4).
(1) Higher thermal efficiency in engines an opportunity not to be missed
Vehicle electrification is gaining traction, but we expect that in 2025 more than 95% of all new cars will still have gasoline or diesel
engines, either as their sole source of power or in combination with electric motors in hybrid vehicles (HVs) and plug-in HVs.
Automakers are competing to raise the thermal efficiency to 50% from the current 40% (each 1 percentage point improvement in
thermal efficiency boosts fuel economy by 2%-3%). Many automakers are likely to opt for direct injection turbos to wring additional
power from smaller engines and high-speed automatic transmissions to maximize the time engines operate in their optimal gear
range. Mazda and some European makers going further and are aiming to incorporate homogeneous charge compression ignition
(HCCI) technology, which foregoes the spark plug of traditional gasoline engines and instead incorporates characteristics of diesel
engines to improve fuel efficiency with less particulate matter emissions. If these advances raise thermal efficiency to 50%, it would
be possible to achieve a level of fuel efficiency that is on par with current hybrid vehicles with normal gasoline engines.

August 5, 2015 Global: Automobiles
Goldman Sachs Global Investment Research 4
(2) Li-ion battery innovation in 2017-2018 setting pace of electrification
We estimate that electrified vehicles will account for 25% of auto sales by 2025 versus 5% in 2015. Powertrain electrification is
essential for complying with new regulations and we see hybrid technology becoming mainstream, with our forecast calling for
sales to rise to 17 mn vehicles in 2025 from a little over 2 mn in 2015. We expect languishing sales of PHEVs and EVs to pick up as a
result of lithium ion battery innovation over 2017-2018. Li-ion batteries account for 50% of the cost of an EV; however, costs could be
reduced 30%-40% following the startup in 2017 of Tesla and Panasonic’s Gigafactory (consumer batteries, 50 GWh capacity). A
number of makers are planning to cut auto battery costs 30%-40% by 2020 via energy density increases achieved through cathode
material innovation and scale.
(3) Fuel Cell technology significant potential; FCVs still small market
Toyota released the world’s first mass-market FCV, the Mirai in December 2014, marking a major first step toward the realization of
a hydrogen-based society. Numerous challenges still need to be overcome, including issues related to cost, infrastructure, and
regulatory reform, but this technology has significant mid-term potential from an energy diversification and CO2 emission reduction
standpoint. If production was to reach 50,000 vehicles, the cost of the fuel-cell stack the most expensive component could fall to 20%
of the current price. We expect sales volume to begin rising, chiefly in Japan and California, from 2020 and forecast FCVs’ share of
the overall auto market to rise from 0% in 2015 to 0.5% (roughly 400,000 vehicles) in 2025. However, FCV awareness is still low and
we do not expect FCVs to really gain traction until the second generation of FCVs due for launch in 2020. There has been much
debate about whether FCVs or EVs will emerge as the winning vehicle technology. We do not see the two as being in competition
but as technologies that can coexist given their different vehicle characteristics and both have various global energy policy support.
Stock beneficiaries: Aisin Seiki up to Buy from Neutral; reiterate Mazda Buy
Aisin Seiki (7259.T): Upgrade to Buy: Developing 8- to 10-speed automatic transmission technology
Trend: Automatic Transmission (AT) technology
We raise our rating for Aisin Seiki to Buy, from Neutral, for the following three reasons. (1) We expect the shift to multi-speed
automatic transmissions (AT) to accelerate amid growing demands to cut CO2. We raise our earnings outlook for Aisin AW
(automatic transmission business), which has the world’s top market share for AT, by 10% from FY3/17. (2) The competitive edge of
Aisin’s AT products should become more evident as a new Higashi-Okazaki plant comes online. The company was the first in the
world to commercialize front-engine front-wheel drive (FF) 8-speed AT, and we expect it to accumulate technology as high-speed
advances further. (3) We expect upfront investment to peak in FY3/16 and earnings and cash flow to recover from FY3/17. We expect
growing competitive advantages for AT, which help reduce CO2. Please see Aisin Seiki (7259.T): The need for (multi) speed: AT to
drive growth amid CO2 cuts, to Buy published August 5, 2015.
Aisin Seiki is covered by Japan Autos analyst, Kota Yuzawa.

August 5, 2015 Global: Automobiles
Goldman Sachs Global Investment Research 5
Mazda (7261.T): Buy: Keen to be the first in the world to commercialize HCCI
Trend: Homogeneous charge compression ignition (HCCI) technology
Mazda has a history of cutting investment in powertrain electrification and downsized direct-injection turbocharger in the process of
prioritizing technologies, and of focusing on improving conventional internal combustion engines. It aims to increase thermal
efficiency in homogeneous charge compression ignition (HCCI) gasoline engines to close to 50% and has expressed confidence in
commercializing the world’s first such engine by 2018-2019. We think the wealth of technologies the company has amassed in
naturally aspirated diesel engines over many years is underpinning HCCI development. HCCI engines do not require high-speed
transmissions given the wider range in which the engine operates with high efficiency (Mazda plans to employ a 6-speed automatic
transmission for the time being). The technological hurdles are high, but we view HCCI as a low-cost technology that can clear CO2
regulations. Current earnings are firm as a result of sales growth for SUVs. Mazda has also announced a technology alliance with
Toyota and is steadily laying the groundwork for the future.
Mazda Motor Corp is covered by Japan Autos analyst, Kota Yuzawa.
NGK Insulators (5333.T): Neutral: Gasoline particulate filters small contribution; large medium-term potential for ceramic products
Trend: Gasoline and diesel particulate filters (GPF/DPF)
Direct-injection gasoline engines that focus on engine thermal efficiency raise concerns about an increase in NOx and PM
(particulate matter). Ahead of stronger exhaust gas regulations (Euro 6c), we think exhaust gas after treatment (GPF) is likely to be
used mainly in Europe for gasoline engines. NGK Insulators has a high market share for exhaust gas treatment DPF for diesel
engines, and we expect it to have a strong presence in GPF as well. In April 2014, the company announced plans to build a new
facility at its first plant in Poland (start production in January 2016). We expect it to commence the first mass production of GPF.
However, the scale of GPF production assumed by NGK Insulators is small and we see larger business opportunities in demand for
medium-sized and large diesel vehicles and from emerging markets (from 2019-2020 onward). NGK Insulators has begun investing
aggressively and is earmarking investment of ¥56 bn in FY3/16 and a total of ¥150 bn by FY3/16-FY3/18, compared with
companywide annual average investment of around ¥30 bn in FY3/13-FY3/15. We think the ceramics business will enter a phase
during which it is difficult to raise profit margins over the next one to two years, due to upfront investments.
NGK Insulators is covered by Japan Electric components analyst, Daiki Takayama.
BorgWarner (BWA): Neutral: Sustained top-line growth out to 2019 driven by powertrain technology advancement
Trend: Turbochargers, Thermal Efficiency
We expect a sustained top-line growth CAGR of 9% from 2015 through 2019 from BWA – well above global car production. This is
driven by leverage to secular growth in fitment rates of products like turbochargers, EGR (Exhaust Gas Recirculation) systems, and
advanced transmissions that will continue to see increased penetration as OEMs work to achieve fuel economy standards globally.
Furthermore, we believe BWA is not tied to a single powertrain as it launches products to enhance both existing powertrains –
internal combustion engine through waste heat recovery systems, EGRs, variable valvetrain actuators, eBoosters, eTurbos, amongst
several others and hybrid engines with hybrid clutching technology and a 48V eRDM (Rear Drive Module), as well as fuel cell
vehicles with its fuel cell air supply system planned for launch early next decade. On top of this (and not yet included in our current

August 5, 2015 Global: Automobiles
Goldman Sachs Global Investment Research 6
forecast), BWA recently announced an agreement to acquire Remy ($1.2bn in revenue in 2014), further extending the company's
growth profile within powertrain by complementing its existing portfolio with product offerings in electric motors, generators, and
alternators. That said we remain Neutral rated on BWA in the near-term given two consecutive reductions in 2015 guidance
resulting from execution challenges in 1H15 that drive our near-term estimates to the low-end of revised guidance.
BorgWarner is covered by our US Auto and Auto parts analyst, Patrick Archambault.
Tesla (TSLA): Neutral: EV manufacturer with a promising product; await a better entry point
Trend: Electric Vehicles
Tesla is a pure EV manufacturer headquartered in Fremont, California. Unlike many other competitive EV offerings, Tesla has
focused on the performance space with its flagship Model S offered at a base price ranging of $70,000-$105,000 (+$10,000 of options
is typical) and with the fastest powertrain accelerating from 0-60 Mph in 3.1 seconds. While there are more than a dozen pure EVs
that are either on the market or planned in the next two years, what sets Tesla apart is its long travel range, with the standard Model
S able to drive 265 miles (430 km)on a single charge. We note the majority of EV offerings reside in the sub 100 mile (160 km) range.
Those that are slated to compete at the high range level, like the Audi Q8 e-tron or R8 e-tron, have planned price tags in the
$130,000-$180,000 range which is higher than the S. As we get into more detail later in this report, a large part of Tesla’s competitive
advantage is its battery cost (about $250/Kwh vs $500/Kwh for large form factors) driven by its use of less expensive 18650 cells,
which are available at scale. While this results in a physically larger battery, it does afford Tesla more flexibility for the price. While
we are believers in the Tesla product, which we think has a real chance of helping transform the auto industry, we believe much is
discounted at this stage and await a better entry point.
Tesla is covered by our US Auto and Auto parts analyst, Patrick Archambault.
Continental (CONG.DE): Neutral: Well positioned to benefit from structural megatrends in the powertrain division
Trend: Turbochargers and selective catalyst reduction (SCR) systems
Continental has a top 3 market position across most of its product offerings in the powertrain division and has also entered fast
growing product segments like SCR (selective catalyst reduction) systems and gasoline turbochargers etc. After a disappointing
level of organic growth in the powertrain division over the last couple of years, we see improvement in the powertrain division
driving growth and margin improvement for Continental. We forecast Continental’s powertrain revenues to increase by c.50% to
€9.6bn by 2019 (Continental’s guidance: €10bn) from €6.5bn in 2014.
In addition to the existing portfolio, we expect a significant part of the growth to come from gasoline turbochargers and SCR
systems. While the Diesel turbocharger penetration is quite high in the mature markets, Gasoline turbochargers are relatively
underpenetrated (currently c.15%). We expect increased penetration to drive strong growth of c.65% CAGR over 2014-2019 and we
believe Continental will be a credible participant in this market along with the current players in the diesel turbocharger market.
Continental has leading (top 3) market share in Gasoline Direct Injection systems which is poised to grow at c.20% CAGR over 2014-
2019 driven by increased penetration from c.20% currently to c.50% by 2019.
Continental is also starting production of SCR systems, the penetration of which is expected to rise significantly post the
introduction of Euro 6 in Europe in 2016. Continental expects of c.€1bn of incremental sales by 2019 from turbochargers and SCR
systems.

August 5, 2015 Global: Automobiles
Goldman Sachs Global Investment Research 7
Continental is covered by our European Auto parts analysts, Ashik Kurian and Stefan Burgstaller.
Valeo (VLOF.PA): Buy: Increased presence in powertrain solutions driving strong growth
Trend: Engine downsizing and hybrid penetration
We rate Valeo Buy as we believe continued delivery of c.8% organic revenue growth over the next five years will drive further
rerating of the shares. We expect Valeo’s powertrain division to benefit from the ongoing trend of increased efficiency of engines
and transmissions and increased penetration of HEV vehicles. Valeo has a top 2 market position in both its electrical and
transmission business with exposure to fast growing segments like stop-start systems, mild hybrid systems, high speed
transmission systems etc. In addition, Valeo has been the first to market with the electric supercharger system (which uses an
electric motor to give the engine a near instantaneous air flow to boost acceleration) with production expected for the start of 2016.
We expect the superchargers, along with existing turbochargers, to have increased penetration over the coming years as the trend
of engine downsizing continues. While these products currently constitute only a minor part of Valeo’s current powertrain revenues,
the >25% revenue CAGR we forecast over the next 10 years is driving the strong order intake for Valeo.
Valeo is covered by our European Auto parts analysts, Ashik Kurian and Stefan Burgstaller.

August 5, 2015 Global: Automobiles
Goldman Sachs Global Investment Research 8
Exhibit 1: CO2 regulations becoming tighter CO2 emission regulations
Exhibit 2: Electrification set to continue Powertrain mix of new cars
Source: Japan Automobile Manufacturers Association (JAMA), US Department of Energy (DOE), Goldman Sachs Global Investment Research.
Source: IHS, Goldman Sachs Global Investment Research.
Exhibit 3: Expenses required to cut CO2 emissions are rising
Simulation of cost increases needed to cut CO2 (USD)
Exhibit 4: What parts are needed?
Growth ranking by product
Source: IHS, Goldman Sachs Global Investment Research.
Note: CAGR period is 2010-2020
Source: Frost & Sullivan, Goldman Sachs Global Investment Research.
153 156
120
165
89
116
72
118
0
20
40
60
80
100
120
140
160
180
200
US CAFE Japan Europe China
2014
2025E
(g/km)
-42% -26%
-40%
-28%
0
20,000
40,000
60,000
80,000
100,000
120,000
2012
2013
2014
P
2015
E
2016
E
2017
E
2018
E
2019
E
2020
E
2021
E
2022
E
2023
E
2024
E
2025
E
FCV
EV
PHEV
HV
Internal combustionengines
Using ICE96%
Using battery22%
Using fuel cell0.5%
(K units)
804
1,809
2,596
0
500
1,000
1,500
2,000
2,500
3,000
0
5,000
10,000
15,000
20,000
25,000
30,000
2012 2013 2014 2015E 2016E 2017E 2018E 2019E 2020E 2021E 2022E 2023E 2024E 2025E
Other regions' incremental cost (mn)
EU incremental cost (mn)
USA incremental cost (mn)
Weighted average cost increase per vehicle (rhs)
Product Megatrend CAGRGasoline particulate filters CO2 100%
Selective catalytic reduction CO2 69%
Battery propulsion systems CO2 67%
Switchable coolant and oil pumps CO2 50%
Tire pressure monitoring CO2 32%
Lane departure warning Safety 31%
Electric motors CO2 30%
Start stop systems CO2 28%
Advanced parking assistance Electronics 28%
Forward collision avoidance Safety 28%
Turbocharger (% of gasoline) CO2 27%
Blind spot detection Safety 24%
Advanced voice recognition Electronics 16%
Touch screens Electronics 16%
Adaptive cruise control (ACC) Electronics 15%
Electric power steering Electronics 14%
App interface solutions Electronics 13%
OEM navigation Electronics 9%
Electronic stability program Safety 8%
Smartphone navigation Electronics 7%
Global light vehicle production - 3.7%
0% 20% 40% 60% 80% 100%

August 5, 2015 Global: Automobiles
Goldman Sachs Global Investment Research 9
Exhibit 5: Auto Parts manufacturers that are key to power train evolution Sales weighting of power train-related products (2014)
Note: Sales CAGR period is 2014-2017E. All target price timeframes are 12-month except for BorgWarner (6-month).
Source: Datastream, Goldman Sachs Global Investment Research
(% of total sales) Ticker FX Enginemanagement
o/wTurbo
HV, PHV parts FCV Drive train
(AT/CVT) GPF/DPF Powertrain advancement 3 yr CAGR
BorgWarner BWA $ 60% 60% 0% 0% 30% 0% 90% 5.9%Continental CONG.DE € 9% 1% 1% 0% 5% 5% 19% 9.0%Valeo VLOF.PA € 11% 0% 5% 0% 5% 0% 21% 9.7%Denso 6902.T ¥ 23% 0% 3% 0% 0% 0% 27% 4.8%Aisin 7259.T ¥ 0% 0% 0% 0% 35% 0% 35% 6.8%Ibiden 4062.T ¥ 0% 0% 0% 0% 0% 22% 22% 3.0%NGK 5333.T ¥ 0% 0% 0% 0% 0% 46% 46% 8.3%
(Sales) Ticker FX Enginemanagement
o/wTurbo
HV, PHV parts FCV Drive train
(AT/CVT) GPF/DPF Powertrain advancement Cons. Revenue
BorgWarner BWA $ 4,983 4,983 0 0 2,454 0 7,437 8,305Continental CONG.DE € 3,130 300 200 0 1,565 1,565 6,460 34,506Valeo VLOF.PA € 1,343 0 672 0 672 0 2,686 12,725Denso 6902.T ¥ 995,035 0 150,000 0 0 0 1,145,035 4,308,754Aisin 7259.T ¥ 0 0 0 0 1,026,000 0 1,026,000 2,963,971Ibiden 4062.T ¥ 0 0 0 0 0 70,000 70,000 318,072NGK 5333.T ¥ 0 0 0 0 0 176,000 176,000 378,665
Mkt cap Price TP Return(mn USD) (local) (local) Potential FY15E FY16E FY17E FY15E FY16E FY17E FY15E FY16E FY17E
BorgWarner 11,085 Neutral 48.98 55 12% 18.5 17.2 14.6 3.2 3.0 2.8 17.5% 17.7% 19.3%Continental 44,958 Neutral 204.85 231 13% 16.2 14.2 12.9 3.6 3.0 2.6 22.3% 21.4% 20.1%Valeo 10,603 Buy 121.60 152 25% 17.1 14.6 13.0 3.6 3.1 2.6 21.3% 21.2% 20.4%Denso 43,478 Neutral 6,096 6,000 -2% 16.0 14.7 13.5 1.5 1.4 1.3 9.3% 9.3% 9.6%Aisin 11,375 Buy 4,785 5,700 19% 16.0 13.1 12.4 1.4 1.3 1.2 8.6% 10.1% 10.0%Ibiden 2,355 Neutral 1,935 2,100 9% 18.2 17.1 16.0 0.9 0.8 0.8 4.7% 4.9% 5.0%NGK 8,417 Neutral 3,185 3,050 -4% 16.1 14.9 14.0 2.5 2.2 2.0 15.7% 15.1% 14.2%
(Valuation)ROE
RatingP/E P/B

August 5, 2015 Global: Automobiles
Goldman Sachs Global Investment Research 10
Don’t underestimate existing engines; thermal efficiency provides scope for fuel economy
While vehicle electrification is clearly gaining traction as a medium-term trend, we forecast that over 95% of all new cars
will still have gasoline or diesel engines by 2025 (HVs and plug-in HVs still have gasoline engines). We believe dramatic
evolution is still possible in engines to increase fuel economy, including the development of:
(1) turbo and direct-injection, and
(2) homogeneous charge compression ignition (HCCI) technology
to make them more efficient.
Further advances in thermal efficiency of existing engines needed
While vehicle electrification often steals the spotlight, we expect 95% of vehicles sold in 2025 will use gasoline or diesel engines for
at least part of their power. Advances in engine technology will still be needed to augment fuel economy in hybrids and PHEVs.
Existing engines are already fast evolving with the shift to direct-injection/downsized turbo/variable displacement models. While the
thermal efficiency of engines is still only around 40% (Exhibit 7), engine manufacturers are conducting R&D with the view to raising
this figure to 45% in five years’ time and 50% in 10 years’ time. Exhibit 6 shows how Toyota plans to meet its 50% thermal efficiency
target not through one decisive technological breakthrough, but by combining and developing different technologies.
Why engine thermal efficiency is attracting attention now
Boosting engine thermal efficiency is not a new concept. However, engines are being used more efficiently now as a result of
transmission evolution (the transition to continuously variable transmissions (CVT) and high-speed automatic transmissions) and
advances in hybrid technology. Based on company feedback across the sector, a 1% improvement in thermal efficiency generally
translates into a 2%-3% improvement in fuel efficiency, so a 10% increase in thermal efficiency would improve fuel efficiency in
existing engines by 20%-30%. Thus, it is theoretically possible to achieve fuel efficiency that is on par with today’s HVs through
engine enhancements alone.

August 5, 2015 Global: Automobiles
Goldman Sachs Global Investment Research 11
Exhibit 6: There are many options available to improve engines Technologies for improving engine efficiency
Exhibit 7: Toyota targets thermal efficiency of 50% Measures for raising thermal efficiency
Source: Company data, Goldman Sachs Global Investment Research.
Source: Company data, Goldman Sachs Global Investment Research.
(1) Turbo and direct-injection technology are the best combination
Technology for developing turbo engines using a variety of components has a long history. Recently, however, it has become
possible to increase engine efficiency through the combination of turbo and direct-injection technology (direct injection of fuel into
engine cylinders). The disadvantage of turbo technology is a temperature increase in the engine, and this can be kept in check
through the use of direct injection. The leading makers of turbo system parts are Honeywell, BorgWarner, Mitsubishi Heavy
Industries, and IHI, and these players dominate the industry. We forecast sales of vehicles with turbo engines will grow from 27% of
all auto sales in 2013, 45% in 2020, and 65% in 2025. We forecast a CAGR of 7.9% for turbo car sales over this 12-year period vs. a
CAGR of 3.1% for global auto sales.
Turbo/DownsizingProvide enough power by
using a smaller engine with supercharger
Conbustion systemOptimize the mix of fuel and air. HCCI performs
by forcibly igniting spontaneous combustion.
Flue gas treatmentAdd flue gas treatmentequipment (ex. DPF) to
reduce NOx and particle pollution
Fuel injectionThe engine operates with ideal combustion in the cylinder via direct fuel
injection
EGRThe engine toperates in the lean zone by using exhaust gas effectively

August 5, 2015 Global: Automobiles
Goldman Sachs Global Investment Research 12
Exhibit 8: Turbo parts market is dominated by a few firms Turbocharger parts market share (2013)
Exhibit 9: Turbo market set to grow strongly Turbo market forecast
Source: Company data.
Source: Company data, Goldman Sachs Global Investment Research
Dealing with emissions the stumbling block for direct-injection engines
Direct-injection engines are helping greatly to boost fuel efficiency, but their emissions contain higher amounts of particulate matter.
Results of a study conducted by Japan’s National Institute for Environmental Studies in December 2013 show that direct-injection
engines emit over 10 times more particles than port injection engines. With tighter emission standards (Euro 6c standards) looming,
as we discuss later, we believe gasoline particulate filters (GPFs) will be adopted for use in gasoline engines, mainly in Europe.
Makers with a high market share in diesel particulate filters (DPFs) substrates for diesel engines will likely gain a strong presence in
GPFs also (given similar technical know-how). We think this holds true for the makers of DPF modules (or “canners” as some refer
to them). Leading companies like Tenneco and Faurecia have deep customer relationships, significant scale, and the capability to
design and manufacture emission solutions from the manifold to the tailpipe, leaving them in a good position to also benefit from
additional GPF content.
In fact, NGK Insulators (covered by Japan Electronic Components analyst, Daiki Takayama) announced in April 2014 that it will build
a new facility at its first plant in Poland (start production in January 2016). Our team expects it to commence the first mass
production of GPF. GPF accounts for a small weighting of new facility investment (€95 mn) and capacity expansion (honeycomb
equivalent of about 1.9X based on the total for cordierite products at the facility), and the main objective is to augment large
honeycomb and Cd-DPF. However, the company is also preparing for future GPF demand. NGK Insulators announced in January
29.3%
24.4%
16.8%
17.6%
8.6%
2.6%0.4% 0.3%
HoneywellBorgWarnerMitsubishi HeavyIHICumminsBoschContinentalOthers
0%
10%
20%
30%
40%
50%
60%
0
10
20
30
40
50
60
70
2013 2020E 2025E
Units (LHS)
Turbo ratio (RHS)
(mn units)

August 5, 2015 Global: Automobiles
Goldman Sachs Global Investment Research 13
2015 that it will build a second plant in Poland (¥17 bn) and expand capacity for SiC-DPF (mainly for diesel passenger cars in Europe).
It has also announced that it will expand NOx sensor capacity in Japan and build a new facility in Thailand for Southeast Asia
(various products including honeycomb, large honeycomb, and DPF; cultivate demand in Southeast Asia and India toward 2020). It
is pursuing aggressive investment, targeting ¥56 bn in FY3/16 and a total of ¥150 bn in FY3/16-FY3/18, compared with companywide
annual average investment of around ¥30 bn in FY3/13-FY3/15. Our team expects a worldwide strengthening of fuel economy
regulations to help propel growth in the company’s ceramics business through 2020.
Exhibit 10: Emissions are a drawback of direct-injection engines
Direct-injection engine emission study
Exhibit 11: Three makers dominate the DPF substrate market
DPF substrates and module global share by volume (2014)
Source: National Institute for Environmental Studies (NIES)
Source: Company data, Goldman Sachs Global Investment Research
Costs to rise on adoption of Euro 6c emission standards in 2017
The Euro 6c emission standards scheduled to be adopted by Europe in 2017 call for the move to WLTP and strengthening of exhaust
gas particle standards (to one-tenth the level of the Euro 6b standards). Previously, particulate matter in emissions was regulated by
weight, but with this method it is hard to detect numerically ultra-fine particles that can easily enter the body. Strengthening of
particulate matter standards will make it necessary to measure and eliminate ultra-fine particles. To meet Euro 6c standards, new
gasoline engine cars will need to have gasoline particulate filters (GPF). Diesel engine cars will need urea selective catalyst reduction
(SCR) systems to eliminate particulate matter and nitrogen oxides, in addition to the diesel particulate filters (DPF) they are already
required to have. We expect this to increase cost by several hundred dollars per vehicle, which we believe could cause a decline in
demand of compact diesel engine cars as a proportion of overall new car sales.
Nor
mal
Gas
olin
e
Dire
ct fu
el(J
apan
)
Dire
ct fu
el(E
urop
e)1 x 10¹²
2 x 10¹²
3 x 10¹²
4 x 10¹²
5 x 10¹²
6 x 10¹²
7 x 10¹²
EURO regulation from 2014
EURO regulation from 2017
PM/N
Ox(
unit/
km)
NGK, 40%
Corning, 30%
Ibiden, 20%
Others, 10%
Faurecia, 26%
Tenneco, 15%
Eberspacher, 7%
Futaba, 7%
Yutaka Giken, 7%
Calsonic Kansei, 5%
Benteler, 4%Boysen, 4%
Magneti Marelli, 4%Sejong, 3%Module, 3%
Others, 15%
0%
10%
20%
30%
40%
50%
60%
70%
80%
90%
100%
Substrate Module

August 5, 2015 Global: Automobiles
Goldman Sachs Global Investment Research 14
Exhibit 12: Emission standards will become stricter in Europe in 2017 European emission standards
Source: EU, Company data.
Exhibit 13: Nitrogen oxide SCRs may become the de facto standard from 2017
European standard roadmap
Source: EU, Company data.
Further transmission evolution ahead to drive thermal efficiency improvement
Ongoing advances in transmission technology illustrate how engine thermal efficiency is becoming increasingly important for
automakers. Transmissions can be broadly divided into four types – manual, automatic, CVT, and DCT (Dual-clutch transmission).
CVTs have become widely used mainly by Japanese automakers, and they make it possible to make more frequent use of engine
Year 1992 1996 2000 2005 2009 2011 2014 2017ERegulation EURO-1 EURO-2 EURO-3 EURO-4 EURO-5a EURO-5b EURO-6b EURO-6cTest cycle ECE 15.04 ECE 15.05 NEDC NEDC NEDC NEDC NEDC WLTCGasoline
NOx - - 150 80 60 60 60 60PM only GDI - - - - 5.0 4.5 4.5 4.5PN - - - - - - 6.0 × 10^12 6.0 × 10^11
DieselNOx - - 500 250 180 180 80 80PM 140 80 50 25 5 4.5 4.5 4.5PN - - - - - 6.0 × 10^11 6.0 × 10^11 6.0 × 10^11
CO2
New test requirement
DPF + NOx
Drive cycle
Limits
Year ● ● ● ● ● ● ●1990 1996 2000 2005 2009 2011 2014 2017 2020
Exhaustafter - treatment
EURO-1
GPF
EURO-2 EURO-3 EURO-4 EURO-5a EURO-5b EURO-6b EURO-6c
ECE 15.04 ECE 15.05 NEDC WLTC
Particle mass for PIParticle counter for CI
Particle couter for PIRDE
130g/km 95g/km
DPF+NOxDPF

August 5, 2015 Global: Automobiles
Goldman Sachs Global Investment Research 15
thermal efficiency (see Exhibit 14-15) Automatic transmissions (ATs) are also evolving from 6-speed to 8- and 10-speed models over
the next several years, which should translate into more efficient use of the engine, as with CVTs.
Exhibit 14: CVTs make efficient use of the engine Engine thermal efficiency and transmissions
Exhibit 15: Transition taking place to CVTs and high-speed automatic
transmissions Types of transmissions
Source: Company data.
Source: Company data.
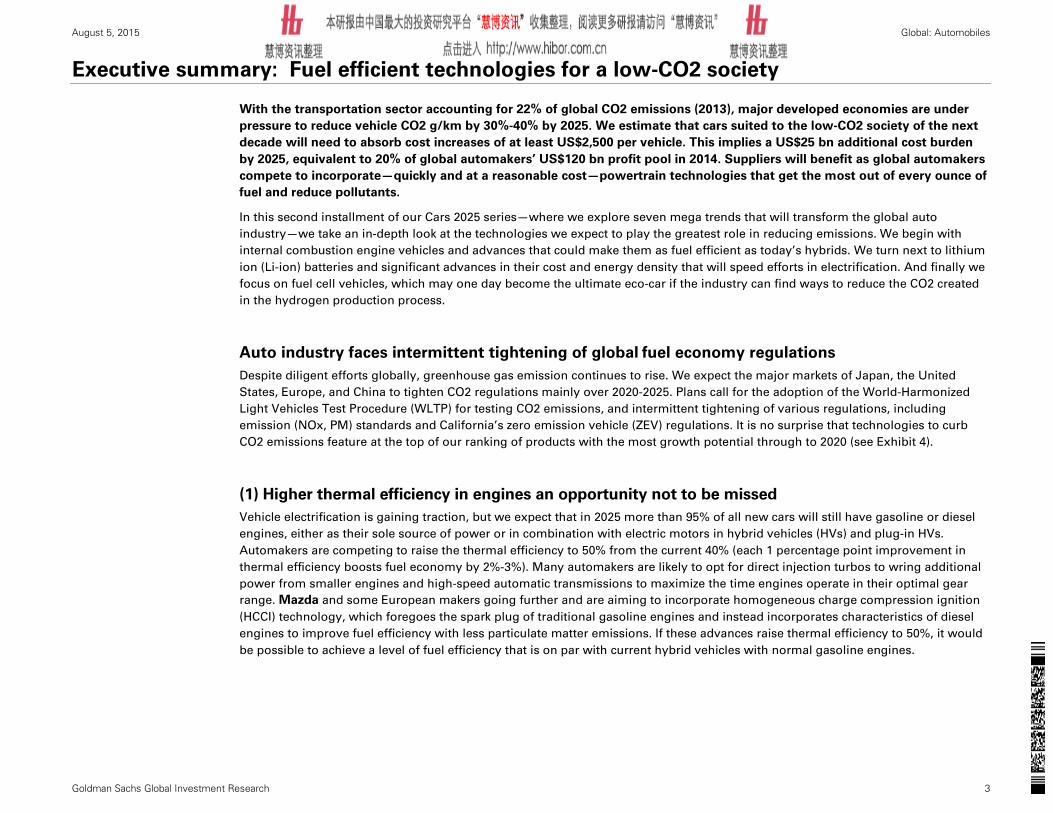
Only a few possess 8+ speed AT technology: Aisin Seiki / ZF set to become even more dominant
The development of automatic transmissions (ATs) has involved the addition of more and more speeds over time. The standard
now is 4- to 6-speed transmissions, but demand for 8- to 10- speed ATs will likely increase as adding one speed generally increases
fuel efficiency by 3%-5%, based on company feedback across the sector. We see the sales weighting of 8- to 10-speed transmissions
rising from 6% in 2015 to 11% in 2020. In addition to transmission makers such as Aisin Seiki and ZF (unlisted), some automakers
also manufacture ATs because they are core powertrain parts. However, Aisin Seiki and ZF lead the field in high-speed
transmissions of over six speeds, and transmission makers are likely to extend their dominance in this space, in our view given the
deep level of technological know-how and significant investment required to produce speeds above the 4/6- speeds automakers can
produce themselves.
On the US front, Ford and GM announced a partnership in 2013 to jointly develop a new automatic 10-speed transmission following
on the success of their joint 6-speed project. The venture appears to be paying dividends with Ford announcing that the new 10
speed AT will go into the Raptor next year for the 2017 model year (a performance version of the F-150 that is lower volume). We
Thermal efficiency distribution
Frequency distributionby powertrain
Engine speed
Torque
Low
CVT
6AT
5AT
High
No. of pedals
Transmission type Features
3 Manual
・Gears are changed manually.・Transmission efficiency is better than with an automatic transmission. Excels in fuel efficiency and power.・Most manual transmissions now have 4-6 speeds. The more speeds, the smoother the gear changes, but the more time spent changing gears.
Automatic
・Gears are changed automatically according to driving conditions.・Most automatic transmissions now consist of a torque converter, auxiliary transmission, and hydraulic control unit.・Adding more speeds makes for a more complicated structure and a larger transmission.
CVT
・In contrast to manual and automatic transmissions, where gears are changed in stages, CVTs change gears continuously using belts, pulleys, and toroidals.・Constant use of the optimal engine speed makes possible greater fuel efficiency and rapid acceleration.
DCT
・Two clutch systems are used, one is connected to a shaft for odd-numbered gears and the other to another shaft for even-numbered gears.・Preparations for gear changes are made by engaging the gear above/below the one currently in use in advance.・There is no time lag when changing gears and the clutch and gear are linked mechanically, making for excellent power transmission efficiency and good fuel efficiency.
2
August 5, 2015 Global: Automobiles
Goldman Sachs Global Investment Research 16
think wider adoption within Ford trucks is likely in coming years. While GM has not disclosed its product plans for the-10 speed, IHS
expects it to be fitted into the pickup trucks, and some Cadillac products.
Exhibit 16: 8+ speed transmissions to become more common in 2020 Global transmission forecast
Exhibit 17: Aisin Seiki has the top AT global market share by volume (2014) Global transmission unit ranking (K units)
Source: IHS, Goldman Sachs Global Investment Research.
Source: Company data.
(2) HCCI engine developments set for 2020;
Over the 2020 horizon, we believe HCCI gasoline engines that work through auto-ignition are worthy of attention; European
automakers and Japanese automakers (particularly Mazda) are competing in R&D in this space, which may be capable of reducing
fuel costs by about 30% compared with current models. According to some calculations, the cost burden may be lighter than
electrification of vehicles (including hybrids). Automakers that have been consistently developing diesel engines may be a step
ahead of others in HCCI, given it requires a significant improvement in compression ratio. In any case, HCCI involves a high
technological hurdle. Automakers are seeking to improve engine characteristics, especially in terms of stable engine operation in a
low temperature environment, using different fuels, etc.
Mazda is ahead of others in HCCI engine development
Mazda has a history of cutting investment in power train electrification to prioritize investment in emerging technologies, and of
focusing on improving conventional internal combustion engines. It aims to increase thermal efficiency in HCCI gasoline engines to
0.0
20.0
40.0
60.0
80.0
100.0
120.0
AMT3-5AT6AT7AT8AT9ATCVT5DCT6DCT7DCT8DCT9DCTEVTMT
8-10 AT : 11%
(mn units)
0 1,000 2,000 3,000 4,000 5,000 6,000 7,000 8,000 9,000 10,000
Daimler
PSA
SAIC
ZF
Ford
Renault / Nissan
GETRAG
FCA
Honda
Jatco
Toyota
GM
VW
Aisin
Hyundai
Aisin has No.1 global share in AT (15%)

August 5, 2015 Global: Automobiles
Goldman Sachs Global Investment Research 17
close to 50% and has expressed confidence in commercializing the world’s first HCCI engine around 2020. We think the wealth of
technologies the company has amassed in naturally aspirated diesel engines over many years is underpinning HCCI development.
HCCI engines do not require high-speed transmissions given the wider range in which the engine operates with high efficiency
(Mazda plans to employ a 6-speed automatic transmission for the time being). In addition, the R&D stage study also shows the
possibility of reining in GPF and other after-treatment costs given limited NOx and PM emissions. While the technological hurdles
are high, we view HCCI as a low-cost technology that can clear CO2 regulations.
Exhibit 18: HCCI engines enable auto-ignition
The principle of an HCCI engine
Source: Goldman Sachs Global Investment Research.
Gasoline engine Diesel engine HCCI engine
Ignition
Piston
Cylinder
Spark plug
Piston
Fuel injector
Air Piston
Exhaust gas Exhaust gas Exhaust gas
Gasolinemixture
Gasolinemixture
Cylinder Cylinder
Air
SelfIgnition
SelfIgnition Gasoline
mixture
Com
pression
Com
pression
Com
pression

August 5, 2015 Global: Automobiles
Goldman Sachs Global Investment Research 18
Electric Vehicles (EVs): Tesla’s Gigafactory key to EV growth
We think the major hurdle to greater market penetration by EVs/PHEVs has been the high cost of Li-ion batteries, but Tesla
and its partner Panasonic see the potential for their Gigafactory, which they expect to be operational by late 2016 and
ultimately ramping up to 50 GWh of capacity, to cut battery costs by 30%-40%. EV sales have been fairly moderate for the
last several years, but we think sales could reaccelerate if the industry can develop an affordable EV with a long travel
distance per charge. FCVs are often discussed in contrast to EVs and the debate often focuses on which technology will win
out over the other. Given each technology has its own idiosyncrasies and varying energy policies adopted around the world,
we see FCV and EV as technologies that can co-exist rather than compete. Our EV sales volume projection for 2025 is 3 mn
units (this would still make the EV market small – we project sales of 17 mn HVs by 2025).
EV vs. FCV view is mistaken; coexisting technologies
The arrival of FCVs is often discussed in contrast to EVs. However, the two technologies can coexist, and they should not be viewed
as an either/or choice. FCVs have the advantages of longer driving ranges and shorter fill-up times (three minutes), but also the
disadvantages of vehicle size restrictions and hydrogen infrastructure development. EVs have the advantage of simple construction
of charging stations, but the disadvantages of low driving ranges and battery degradation. In fact, most EV driving ranges are
limited to around 100 miles (160 kms), although we note Tesla is an important exception with a median range of 265 miles (425 kms)
per charge. We think the use and appeal of FCVs and EVs could differ depending on the driving distance needs of consumers.

August 5, 2015 Global: Automobiles
Goldman Sachs Global Investment Research 19
Exhibit 19: Various technologies may co-exist, in our view
Correlation between vehicle size and travel distance
Source: Company data.
Sales of EVs have been sluggish
In 2011, Nissan announced its decision to allocate significant resources toward EVs, with an investment of $5 bn in vehicle
development and battery production (equivalent of over 12 GWh). Nissan’s efforts resulted in the launch of the Leaf. Despite
ongoing issues with its limited driving range, monthly Leaf sales in the US have been constant at around 2,000-3,000 units since
2013. However, this is very different to the rate at which Nissan initially expected EVs to penetrate the market. Nissan’s initial
projection was that the EV industry would account for 10% (around 10 mn units) of total vehicle demand by 2020. We estimate
Nissan and Renault have a target of around 500,000 units by 2020 (converted at 24 kWh per vehicle). In 2014, however, Nissan Leaf
sales only came to around 60,000 units.
High-end EV market is growing but still small
In contrast, Tesla has concentrated on the high-end EV market. The company’s first model was the Roadster in 2008, followed in
2012 by the Model S. The Model S has a relatively high price tag of US$70,000-110,000 pre-government tax incentives and options,
but it has a driving range of 250-300 miles (400-500 km), which has allowed Tesla to generate demand at the high end of the market.
Clean dieselLarge FCV
(Validation phase)HV・PHV
(full-scale spread・introduction)
EV(introduction)
Short-distanceSmall commuter
Short Travel distance Long
Fuel Electricity Gasoline, diesel, CNG, LPG, biomass, synthetic fuel etc.
Hydrogen
Vehiclesize

August 5, 2015 Global: Automobiles
Goldman Sachs Global Investment Research 20
Model S sales were just over 30,000 units last year, which is low volume, but growth is fast; the company is set to hit 55,000
deliveries this year and is expecting over 100,000 next year, following the addition of the Model X to the lineup.
Exhibit 20: Constant demand in low-price EVs Nissan Leaf sales in US
Exhibit 21: Travel distance of EVS is relatively short Travel distance of EVs in market
Source: Autodata.
Source: Company data, Nikkei Automotive.
Initial market penetration slow, but new entrant technologies could revive sales momentum
EV sales over the past several years did not necessarily meet initial expectations. However, structural advantages of EVs have
allowed companies from other industries to enter the market which could signal the first step toward renewed growth. EVs have
only about one-third of the number of components of on board vehicles powered by a gasoline engine. As a result; (1) the ability to
coordinate and integrate production across several fronts, which is a key strength of conventional automakers, as well as (2) their
supplier management practices, are not necessarily a competitive advantage. Hence, a breakthrough in battery technology could
dramatically change the EV competitive landscape, given Li-ion batteries account for around 50% of the cost of an EV.
Tesla slated to start operation of its Gigafactory from 2017
While the battery technology required to realize vehicle electrification continues to develop rapidly, we expect the outcome of
Tesla’s Gigafactory initiative to be a significant turning point over the next five to ten years. Part of what drives this less crowded
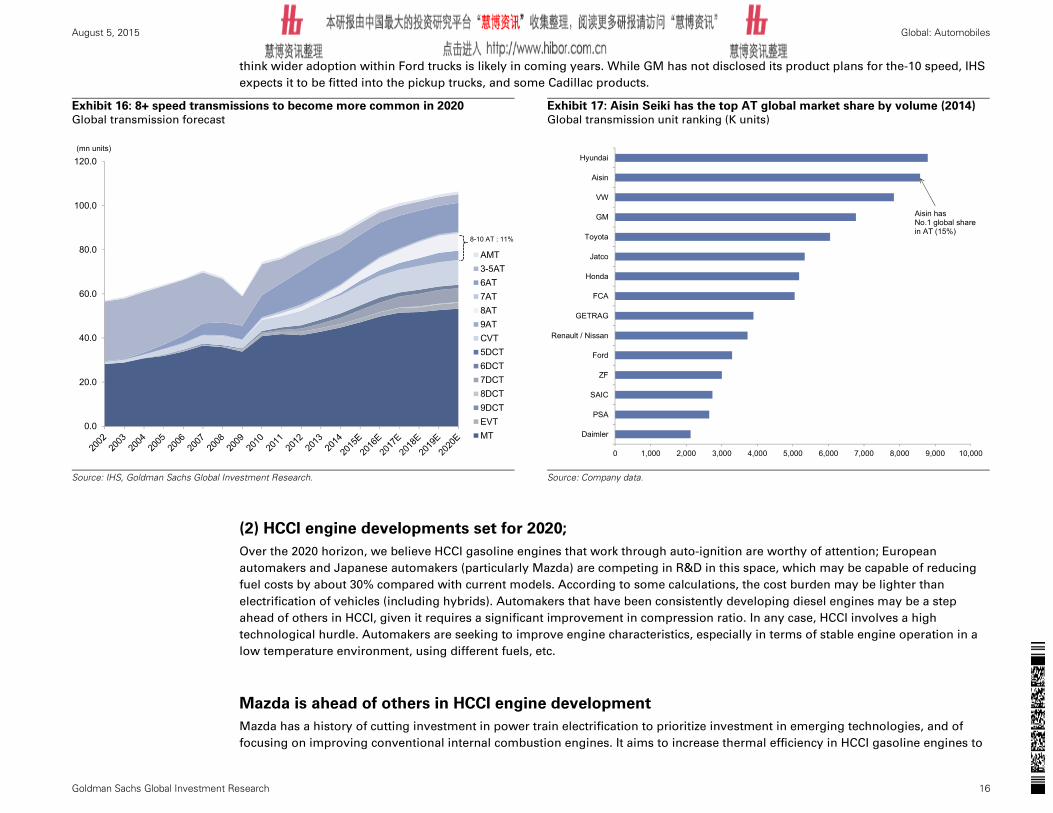
field is Tesla’s advantage in battery cost. As we have highlighted in the past, Tesla has been very successful in taking cost out of its
battery packs over time, taking the cost down from $550/kWh for the original Roadster to about $250/kWh for the Model S based on
0
500
1,000
1,500
2,000
2,500
3,000
3,500
Jan-
13Fe
b-13
Mar
-13
Apr
-13
May
-13
Jun-
13Ju
l-13
Aug-
13Se
p-13
Oct
-13
Nov
-13
Dec
-13
Jan-
14Fe
b-14
Mar
-14
Apr
-14
May
-14
Jun-
14Ju
l-14
Aug-
14Se
p-14
Oct
-14
Nov
-14
Dec
-14
Jan-
15Fe
b-15
Mar
-15
Apr
-15
May
-15
Jun-
15
Leaf
Model S (Tesla)Model X (Tesla)
Model 3 (Tesla)
Q8 e-tron (Audi)
R8 e-tron (Audi)
i3 (BMW)B-class (ML)
Bolt (Chevrolet)
Spark (Chevrolet)
E-Gold (VW)
Focus (Ford)
i-MiEV (MMC)
Soul EV (kia)
500e (Fiat)Leaf (Nissan)
0
20,000
40,000
60,000
80,000
100,000
120,000
140,000
160,000
180,000
200,000
0 50 100 150 200 250 300 350 400Travel distance(mile)
Price($)
August 5, 2015 Global: Automobiles
Goldman Sachs Global Investment Research 21
new chemistries, several manufacturing redesigns, and scale benefits. Japan’s household appliance maker Panasonic has already
announced that it intends to take a 30%-40% stake in the new plant project, which Tesla is investing a total of US$5 bn. The
companies expect the plant’s production capacity to be 50 GWh by 2020, equivalent to the capacity of 3.5 standard nuclear power
plants. Because Tesla intends to use 15 GWhs of the 50 for stationary storage, this leave 35 GWhs for EVs; this translates to a
potential production capacity of 500,000 EV units based on Tesla’s standard battery installment volume/unit (70-90 kWh, cruising
distance of approximately 400-500 km). We expect costs of $150/kWh once the Gigafactory is fully ramped and the company has
said it expects it the cost to be below $100/kWh by 2020. By contrast, industry projections place Li-ion cost at $250/kWh in 2020 for
the larger form factor batteries used by most of Tesla’s competitors.
Exhibit 22: Tesla battery cost to be lowered down from various measures
Tesla’s battery cost by model (USD/kWh)
Source: Company data, Goldman Sachs Global Investment Research.
Next-generation model at $35,000 (excluding options) to drive volume growth
Our US auto industry analyst, Patrick Archambault estimates that Tesla’s EV sales volume will increase from 50,000 units in 2015 to
270,000 units in 2020 and that the key growth driver will be Tesla’s next-generation model, expected to be launched in 2017. This
will mark Tesla’s entry into the popular end of the market, with an estimated price tag in the mid-to-high $40,000 range including
options. We think the model’s driving range will depend heavily on how far the Gigafactory can bring down battery costs, but we
believe a range at least as high as the Model S is realistic.
$0
$100
$200
$300
$400
$500
$600
Roadster Roadster (2nd Gen) Model S Gen III Gigafactory
$/kWh

August 5, 2015 Global: Automobiles
Goldman Sachs Global Investment Research 22
Exhibit 23: Sizeable battery plant with a $5 bn investment Tesla’s Gigafactory
Exhibit 24: We expect Tesla to sell 270K units in 2020 with 2 new model
launches
Tesla unit sales estimate (by model)
Source: Company data.
Source: Company data, Goldman Sachs Global Investment Research.
We expect the price per watt-hour for automotive battery to halve in the next 10 years
The Japanese government projects that by around 2020 EVs with a driving range of 250-300 km will be in popular demand and the
price per watt-hour (Wh) will have fallen to around $0.50 (automotive battery). We believe the Japanese government’s projections
carry weight in this in this area, given the number of battery-related suppliers in Japan. However, if Tesla can achieve its targeted
cost savings described above (18650 cells battery), the government’s cost projection of $0.50 per Wh could be achieved around five
years earlier.
Total Investment USD 5bnTesla Over 50%Panasonic 30-40%
Capacity 50GWhCylindrical typeEquals to 0.5mn units of 70-90kW EV
Start Late 2016Full operation in 2020
Cost reduction Estimating 30-40%20-30cents/Wh (GSE)
Use Mainly automobilePossible use for storage battery
0
50,000
100,000
150,000
200,000
250,000
300,000
2008 2009 2010 2011 2012 2013 2014 2015E 2016E 2017E 2018E 2019E 2020E
Next Gen
Model X
Model S
Roadster
Next Gen (GSE)Travel distance: 500kmPrice: USD 35,000-45,000
Model X (GSE)Travel distance: UnknownPrice: Approx. USD 100,000
Model STravel distance: 390-502kmPrice: USD 57,000-80,000

August 5, 2015 Global: Automobiles
Goldman Sachs Global Investment Research 23
Exhibit 25: Price per watt-hour to halve toward 2025 Estimated price of automotive Li-ion batteries
Source: Goldman Sachs Global Investment Research
Positive electrode and other material evolution continues apace
Higher energy density raises the performance of lithium ion batteries, resulting in an increase in the distance electric vehicles can
travel on one charge and a reduction in battery costs. The energy density of lithium ion batteries in the early 2010s was 100-150
Wh/kg, but recently some manufacturers have been able to achieve 200-300 Wh/kg. Panasonic, in conjunction with Tesla, has
achieved 267 Wh/kg in its NCR18650 series for PCs, and Korean company LG Chem is eyeing development of a battery with an
energy density of 252 Wh/kg for automobiles (according to the June 2015 Nikkei Automotive). Automotive Energy Supply Corp., a
joint venture between Nissan Motor and NEC, is aiming to increase energy density to 200-240 Wh/kg, from 157 Wh/kg at present,
with a view to offering a commercial product in 2017-2018 for use in autos (June 2015 Nikkan Jidosha Shimbun). Switching to cobalt,
manganese, and nickel for positive electrodes is a method frequently used to increase energy density, with lithium nickel
manganese cobalt oxide (NMC) and lithium nickel cobalt aluminum oxide (NCA) seeing increasing adoption. Considerable effort is
also being made to improve the performance of anode materials, electrolytes, separators, and other core battery components to
make possible energy density of 300-350 Wh/kg by mid 2020s.
0
50
100
150
200
250
300
350
400
0.00
0.20
0.40
0.60
0.80
1.00
1.20
1.40
1.60
2009 2011 2013 2015E 2017E 2019E 2021E 2023E 2025E
Price per Wh ($/g, LHS)
Energy density (Wh/kg, RHS)

August 5, 2015 Global: Automobiles
Goldman Sachs Global Investment Research 24
Exhibit 26: Japanese/Korean names feature prominently on the list of battery material producers (2013 market share by sales) Makers of key components and materials
Source: Company data and interview, Goldman Sachs Global Investment Research
Cathode Anode Separator Electrolyte
Nichia, 20%
L&F Material,
15%
Umicore, 15%
Toda Industrial,
10%
Nippon Chem,
5%
Tanaka Chem,
5%
Mitsubishi Chem,
5%
Nippon Denko,
3%Others,
22%Hitachi Chem, 30%
BTR, 20%
Mitsubishi Chem, 15%
JFE Chem, 10%
Tokai Carbon,
10%
Nippon Carbon,
5%
Showa Denko,
5%
Kureha, 3% Others,
2%
Asahi Kasei, 30%
Toray, 20%Celgard,
15%
SK Innovation
, 10%
Ube Industries
, 5%
Sumitomo Chem,
5%
Mitsubishi Chem,
5%
Teijin, 3%
Others, 7% Ube
Industries, 20%
Mitsubishi Chem, 20%
Panaxx, 15%
Chell Industries
, 15%
LG Chem, 10%
Fuji Chem, 10%
Central Glass,
8%
Others, 2%

August 5, 2015 Global: Automobiles
Goldman Sachs Global Investment Research 25
Fuel Cell Vehicles (FCVs): The ultimate eco-car?
Toyota released the world’s first commercially available FCV, the Mirai, in December 2014. This represented a major step
toward the achievement of a hydrogen-based society. FCVs face many obstacles –cost, infrastructure, and regulatory
reform– that are yet to be overcome but the technology has significant medium-term potential from an energy
diversification and CO2 emission reduction standpoint. We expect FCV sales volumes to start increasing mainly in Japan
and California from 2020 given strong regulatory focus on emissions reduction.
Toyota releases long-awaited mass-production FCV
We think FCVs stand alongside EVs as a technology that could transform automobile internal combustion engines in 10 years.
Gasoline-powered vehicles generate power by burning gasoline, whereas FCVs generate power using hydrogen as fuel and onboard
fuel cells. These vehicles are also known as fuel cell electric vehicles (FCEVs) because they combine elements of EVs to use
generated electricity to drive the motor. Toyota released the Mirai as the world’s first mass-production FCV in December 2014. The
vehicle is priced at ¥7.24 mn (US$60,000), or ¥5.22 mn (US$43,000) after subsidies, which is high compared with ¥4.22 mn
(US$35,000) for the similar class Crown HV. Toyota developed the Mirai using parts from existing models, including the motor and
inverters from the Harrier HV and rechargeable batteries from the Camry, but we think the fuel cells and tank likely increased costs
significantly. FCV consumer awareness is still not high, but governments in Japan, California, Germany, UK, and elsewhere have
taken aggressive stances on their penetration through various regulations and subsidies.
Competitors prepare to follow Toyota’s foray into FCVs
Honda plans to release a mass-production FCV sedan in FY3/16, roughly one year after the Toyota Mirai. Nissan plans to release an
FCV developed jointly with Daimler and Ford in 2017. Volkswagen is also developing an FCV, although the release timing is unclear.
Hyundai released an FCV in 2013, but we estimate that most of these were sold for fleet use rather than to general consumers.

August 5, 2015 Global: Automobiles
Goldman Sachs Global Investment Research 26
Exhibit 27: Mirai is still highly priced Comparison of Toyota’s FCV and similar models
Exhibit 28: Other automakers are also planning to release FCVs FCV release plans
Source: Company data.
Source: Company data, Goldman Sachs Global Investment Research.
Nameplate FCV Mirai Crown HV Crown conbustion
Price (¥) 7.24mn 4.22mn 3.64mn
Subsidy (¥) 2.02mn - -
Real price (¥) 5.22mn - -
Vehicle size
Length 4,890mm 4,895mm 4,895mm
Width 1,815mm 1,800mm 1,800mm
Height 1,535mm 1,460mm 1,460mm
Maximum power113kW(motor)
FC stack is 114kW
162kW(motor 105kW)
149kW(engine)
Fuel efficiency ¥7.8/kmHydrogen=¥1,100/kg
¥6.0/kmGasoline ¥130/l
¥12.3/kmGasoline ¥130/l
Model name Launch Note
Toyota Mirai 12/1/2014Price:JPY 7.24mnToyota opened its 5,680 FCV patents for free. Joint development ongoing with BMW.
Honda Sedan FCV FY2015 Joint development ongoing with GM.
Hyundai Tucson based FCV 2013 Massive price down in 2015JPY 16.0mn → JPY 9.0mn
Nissan Unknown 2017 Joint development with Daimler and Ford
Volkswagen Unknown Unknown Obtain a FCV related patent in Canada.

August 5, 2015 Global: Automobiles
Goldman Sachs Global Investment Research 27
Exhibit 29: Many Japanese makers contribute to the Mirai Main parts suppliers for the Mirai
Source: Company data.
High-cost FC stack breakthrough if production volume surpasses 50,000 vehicles
We believe the most important factor for FCV penetration is the pace of decline in FCV prices. The fuel-cell stack is the most
expensive part in FCVs, and at a production volume of around 500 vehicles (Toyota’s current production capacity), we estimate the
FC stack would cost c.US$32,000 (around ¥4 mn; per kW cost of US$280 × Mirai stack capacity of 114 kW = US$32,000)
We estimate that an increase in production volume to 50,000 vehicles could lower the FC stack cost to c.US$7,600 (US$66 × 114 kW).
Japan’s government has presented a roadmap for fuel cell system costs that targets a 50% reduction in 2020 compared with 2015. If
this is achieved, we think FCV sales in the Japanese market could accelerate from 2020. We forecast global FCV sales volume of
150,000 vehicles in 2020 and 400,000 vehicles in 2025.

August 5, 2015 Global: Automobiles
Goldman Sachs Global Investment Research 28
Exhibit 30: Global FCV penetration in 2020/2025 FCV penetration plans
Exhibit 31: FC costs fall sharply at a production volume of 50,000 vehicles Production volume and cost per kW
Source: New Energy and Industrial Technology Development Organization (NEDO)
Source: New Energy and Industrial Technology Development Organization (NEDO)
Major advances in Toyota’s second generation Prius HV
We wonder if anyone could have accurately forecasted the current sales volume of hybrid vehicles (HVs) 18 years ago, when Toyota
presented the Prius to the world as the first HV in 1997. The model had a strong tailwind from high energy prices, but HVs are now
viewed as a mainstream rather than stopgap technology by the world’s automakers. In particular, we find it interesting that Prius
sales volumes accelerated following the release of the second-generation model in 2003. This suggests that perhaps we should not
focus too much on volumes for the first generation of FCVs, given quality and emphasis on production technology maturity is their
key focus. We think the second generation of FCVs planned for release around 2020 will mark the full start of hydrogen vehicles.
Region Plan/estimate Plan
Japan CY2025E:Total 2mn units 1,000 H2 station. 2,000 cars/station.
US CA CY2017E:53thous units Conducting interviews on ZEV regulation to auto makers3.3mn ZEVs until 2025 in CA+7states
Germany CY2023E:0.5mn units Next National Implementation Plan (Jun. 2013)
England CY2030E:1.6mn units UK H2Mobility project (Apr. 2013)
South Korea CY2020E:0.1mn units Green Growth National Committee (Dec. 2010)
0
50,000
100,000
150,000
200,000
250,000
300,000
350,000
400,000
450,000
2015E 2020E 2025E
South KoreaEnglandGermanyUS CAJapan
280.33
103.58
66.6854.83
0
50
100
150
200
250
300
0 100,000 200,000 300,000 400,000 500,000 600,000
(USD/kW)
(Production)

August 5, 2015 Global: Automobiles
Goldman Sachs Global Investment Research 29
Exhibit 32: Toyota hybrids move to fourth generation in 2015 Evolution of the Toyota Prius
Exhibit 33: Second generation spurred sales Toyota’s hybrid sales
Source: Company data.
Source: Company data.
Hydrogen infrastructure hard to develop, but high operating leverage a positive
We think the development of hydrogen stations is essential for FCV penetration. Hydrogen stations require upfront investment of
¥400-¥500 mn per station (gasoline stations cost ¥100 mn - US$0.8mn), and hydrogen accounts for a full 60% of station-related costs.
JX Holdings (covered by Japan Energy analyst, Shuhei Nakamura) plans to cut hydrogen station investment in half, and seeks to
reduce equipment costs based on examples in Europe. Moreover, station operations are significantly affected by utilization rates.
We estimate that one station would need a sustained customer base of around 2,000 FCVs to achieve profits.
Already 78 hydrogen stations confirmed in Japan; approaching the number needed in 2020
Japan’s government has increased subsidies for hydrogen stations, and targets to have 100 stations in operation by the end of
FY2015 (78 stations are already confirmed). We estimate that 200,000 FCVs would be needed for all stations to be profitable (2,000
vehicles × 100 stations = 200,000 vehicles), a figure that may be finally reached by around 2020. The creation of a hydrogen-based
society requires ongoing government support to achieve this target.
1st generation(1997)
2nd generation(2003)
3rd generation(2009)
4th generation(2015E)
Engine type 1.5L Atkinson 1.5L Atkinson 1.8L Atkinson Unknown
Engine power 43kW 57kW 73kW Unknown
Motor power 30kW 50kW 60kW Unknown
Voltage 288V 500V 650V Unknown
Battery Ni-MH Ni-MH NI-MH(Prius V uses Li-ion) Unknown
Fuel efficiency 28km/L(10・15) 29.6km/L(JC08) 32.6km/L(JC08) 40㎞ /L(JC08)
0.0%
2.0%
4.0%
6.0%
8.0%
10.0%
12.0%
14.0%
16.0%
0
200,000
400,000
600,000
800,000
1,000,000
1,200,000
1,400,000
CY2
000
CY2
001
CY2
002
CY2
003
CY2
004
CY2
005
CY2
006
CY2
007
CY2
008
CY2
009
CY2
010
CY2
011
CY2
012
CY2
013
HV sales (units)
HV ratio (%)

August 5, 2015 Global: Automobiles
Goldman Sachs Global Investment Research 30
Exhibit 34: High station costs (2014) Hydrogen cost structure
Exhibit 35: Station costs are highly dependent on volume Utilization rates and hydrogen costs
Source: Ministry of Economy, Trade and Industry (METI), New Energy and Industrial Technology Development Organization (NEDO)
Source: Ministry of Economy, Trade and Industry (METI), New Energy and Industrial Technology Development Organization (NEDO)
10%
26%
26%
4%
15%
19%
0%
10%
20%
30%
40%
50%
60%
70%
80%
90%
100%
Production/transportationRaw material costProduction/transportationFixed costProduction/transportationVariable costStation maintenanceMaintenance costStation maintenanceFixed costStation maintenanceVariable cost
67.5X
7.0X
1.7X 1.2X 1.0X0.0X
10.0X
20.0X
30.0X
40.0X
50.0X
60.0X
70.0X
80.0X
1% 10% 50% 80% 100%
Cost index (100% utilization=1)

August 5, 2015 Global: Automobiles
Goldman Sachs Global Investment Research 31
Exhibit 36: Hydrogen stations need active customer base of 2,000 vehicles to be profitable Hydrogen station earnings simulation
Source: Company data, Goldman Sachs Global Investment Research.
Are FCVs the ultimate eco-car?
Toyota released the world’s first mass-production FCV, the Mirai, in December 2014, calling FCVs the ultimate eco-car. There are
many obstacles to FCV penetration, including a lack of hydrogen infrastructure, well-to-wheel CO2 emission volume, and relatively
high vehicle prices, but Japan, Korea, and California have announced intentions to actively develop this market. If a way to
effectively use byproduct hydrogen (generated in steel and petrochemical production processes) can be found, resources would not
be wasted in hydrogen production. By contrast, if fossil fuel modification and water electrolysis processes were adopted,
manufacturing costs would be high and FCVs would not contribute much to CO2 reduction. However, if hydrogen produced from
solar alkaline or other renewable energy sources were used, we believe the ultimate eco-car moniker would be deserved.
JPY (Case 1) (Case 2) (Case 3) (Case 4)FCV in use 500 1,000 2,000 3,000Hydrogen purchase cost 17,600,000 35,200,000 70,400,000 105,600,000Running cost 30,000,000 30,000,000 30,000,000 30,000,000Depreciation, etc. 30,000,000 30,000,000 30,000,000 30,000,000Cost per yr 77,600,000 95,200,000 130,400,000 165,600,000
Sales volume per yr 440,000 880,000 1,760,000 2,640,000Theoretical ASP per 1㎥ 176 108 74 63
Actual ASP per 1㎥ 100
Hydrogen volume/refuel 55㎥/5㎏Hydrogen price/refuel 5,500Travel distance/yr 10,000㎞# of times refueledl/yr 16 600km/chargeHydrogen cost/yr 88,000Hydrogen volume/yr 880 m3
(Case 1) (Case 2) (Case 3) (Case 4)FCV in use 500 1,000 2,000 3,000Revenue/yr 44,000,000 88,000,000 176,000,000 264,000,000Profit (33,600,000) (7,200,000) 45,600,000 98,400,000

August 5, 2015 Global: Automobiles
Goldman Sachs Global Investment Research 32
Exhibit 37: CO2 is sometimes produced in the hydrogen production process Well to Wheel CO2 g/km emission comparison
Exhibit 38: Hydrogen production methods and costs vary Hydrogen production methods
Source: Japan Automobile Research Institute (JARI), Ministry of Economy, Trade and Industry (METI), New Energy and Industrial Technology Development Organization (NEDO)
Source: Motor Fan
FCVs only one of the building blocks required to achieve a hydrogen-based society
The release of the Mirai created the impression among some that the transition to FCVs constitutes a shift to a hydrogen-based
society; in fact, FCVs are merely one step towards achieving a hydrogen-based society. Due to its lack of national energy resources,
Japan, in particular, plans to diversify its energy sources and take steps to achieve energy security. Amid poor visibility on the
nuclear power outlook, high expectations for hydrogen power generation as a means of addressing greenhouse gas regulations are
understandable. Japan Petroleum Energy Center estimates surplus hydrogen capacity in Japan to be 8.1 bn normal cubic meters
(Nm3) in 2014, which is enough to fuel 9.2 mn FCVs on our calculations. This suggests that making effective use of surplus energy
in Japan is by itself a sufficiently worthwhile project from an FCV standpoint alone.
Ultimate eco-car requires CO2-free hydrogen development
From a medium-term standpoint, taking into account issues such as further hydrogen cost cuts and CO2-free hydrogen production;
FCVs do not mark the end of the discussion. If the field is broadened to include hydrogen power generation also, attention must be
given to hydrogen production from lignite, transporting hydrogen from overseas, and hydrogen production methods using
hydraulic and solar power.
79
78
14
147
132
95
79
55
0 20 40 60 80 100 120 140 160
FCV(Onsight reforming town gas)
FCV(Insight reforming natural gas)
FCV(alkaline water electrolysis by solar)
Gasoline
Diesel
HV
PHEV
EV
Productionprocess
Prospect of practical use
Production cost(JPY/㎥) Characteristic
By-product hydrogen Steel ✓ 24-32 Production volume is dependent on purpose-grown proudct
Petrochemical ✓ 20 18bn ㎥/yr surplus production in steel and petrochemical industry
Purpose-grown Oil refining ✓ 23-32 Produced in unused spare capacity.
(Existing facility) 4bn ㎥/yr produced by oil refining
Purpose-grown Petro fuel reformer ✓ 31-58 Need additional facility.
(New facility) water electrolysis ✓ 84-136
Future development Photocatalysis × Not yet Still a technology hurdle
IS process × Not yet Cost is unknown.

August 5, 2015 Global: Automobiles
Goldman Sachs Global Investment Research 33
Exhibit 39: Japan has sufficient production capacity for 9.2 mn FCVs Japan’s hydrogen production capacity (2014)
Exhibit 40: Hydrogen could be imported for power generation Hydrogen supply/demand
Source: Japan Petroleum Energy Center, Goldman Sachs Global Investment Research
Source: New Energy and Industrial Technology Development Organization (NEDO),Goldman Sachs Global Investment Research
Hydrogen power production raises many issues
From the perspective of energy/environmental policy, our Japan Energy analyst Hiroyuki Sakaida believes the use of hydrogen will
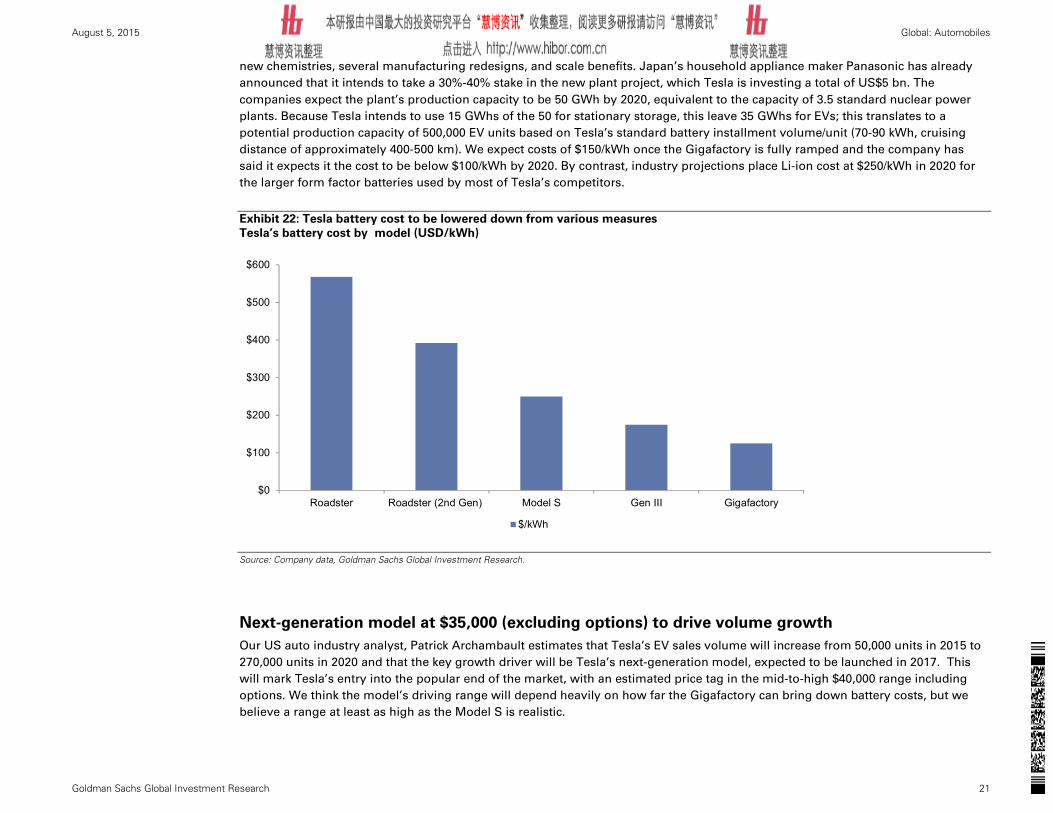
gather real momentum from stage two of the Japanese government’s hydrogen social roadmap (2025-2030).
In stage one, hydrogen is not a satisfactory energy source from the perspective of CO2 reduction because it is primarily made from
fossil fuels (merits stem from the high thermal efficiency of fuel cells). Similarly, hydrogen-driven power generation by gas turbines
has no CO2 reduction merits in stage one, and is rather a stage of technology development for the future.
In stage two, Japan aims to import hydrogen produced overseas. By this time, however, the government expects to be able to use
CO2 made using carbon capture and storage (CCS) technology, which does not release CO2 into the atmosphere. CCS is an
environmentally friendly technology and our team expects hydrogen-driven power generation to be commercialized during this
stage. The government first aims to reduce hydrogen-driven power generation costs (hydrogen fuel costs) to ¥17/kW. However, we
note that this is almost what it costs to generate power at old thermal plants, when crude oil was trading at US$100/bbl, and is quite
high compared with more efficient gas-fired and coal-fired plants. At current oil and gas price levels, some form of political incentive
will be probably be needed to promote diffusion.
(100 mn Nm3) Capacity Unutilizedcapacity
= vehicles(K units)
Petro 189 47 5,341
Petrochemical 31 10 1,136
Soda 12 6 682
Ammonia 42 6 682
Steel 86 12 1,364
Total 360 81 9,205
150 150 150 150 150
2027
110
10
90
0
50
100
150
200
250
300
350
400
450
Demand Demand Supply Demand Supply
Current 2015E 2030E
AbroadDomesticHydrogen powerFCVIndustrial gasSelf-consumption
August 5, 2015 Global: Automobiles
Goldman Sachs Global Investment Research 34
In stage three (targeted for around 2040), the government aims to import hydrogen made at large overseas renewable energy plants.
At this stage hydrogen could truly be described as a CO2-free energy source.
Exhibit 41: Achieving hydrogen-based society a long-term effort Japanese government’s hydrogen-based society roadmap
Source: New Energy and Industrial Technology Development Organization (NEDO)

August 5, 2015 Global: Automobiles
Goldman Sachs Global Investment Research 35
CO2 regulations: Intermittent tightening of regulations approaching
The transportation sector accounts for 22% of global CO2 emissions. Major developed nations are under pressure to reduce
vehicle CO2 g/km by 30%-40% by 2025, and automakers therefore face the risk of margin declines as they become
compliant. Worldwide Harmonized Light Vehicles Test Procedure (WLTP, to be implemented around 2020) and tighter zero
emission vehicle (ZEV) regulations in California (from 2018) are also challenges for automakers operating globally.
Despite diligent efforts, greenhouse gas emission continue to rise
Greenhouse gas emissions increased to 30 bn tonnes in 2011 from 20 bn tonnes in 1990 and it is estimated by International Energy
Agency (IEA) that they will exceed 35 bn tonnes by 2035 despite efforts to control them. Intense debate among major developed
nations over greenhouse gas reduction targets continues. Many countries have withdrawn from the Kyoto Protocol and countries
that are currently parties to it account for only 10%-15% of global CO2 emission volume. It is still uncertain if major developed
nations will ratify reduction targets again this summer.
Vehicles account for 22% of greenhouse gas emissions; reducing environmental burden an
important social responsibility
While vehicles are an essential part of modern society, they are also a major source of greenhouse gases, accounting for 22% of
global emissions. The number of vehicles continues to increase, making it necessary to cut CO2 emissions per vehicle as much as
possible. Automakers and companies in related industries have an important social responsibility in this regard, in our view.
Motorization in developing nations unstoppable with increasing GDP
We forecast global auto sales will increase from 80 mn units in 2015 to 100 mn in 2020 and 120 mn in 2025, and we expect
developing nations to account for almost all of this growth. Our macro team expects per capita GDP to exceed US$10,000-20,000,
the level at which motorization generally gains real momentum, in some developing nations around 2025. Despite the high cost,
improving fuel efficiency through vehicle electrification will be important in developed nations (because of the large number of
vehicles). At the same time, the importance of low-cost fuel efficiency technologies for developing nations is likely to increase.
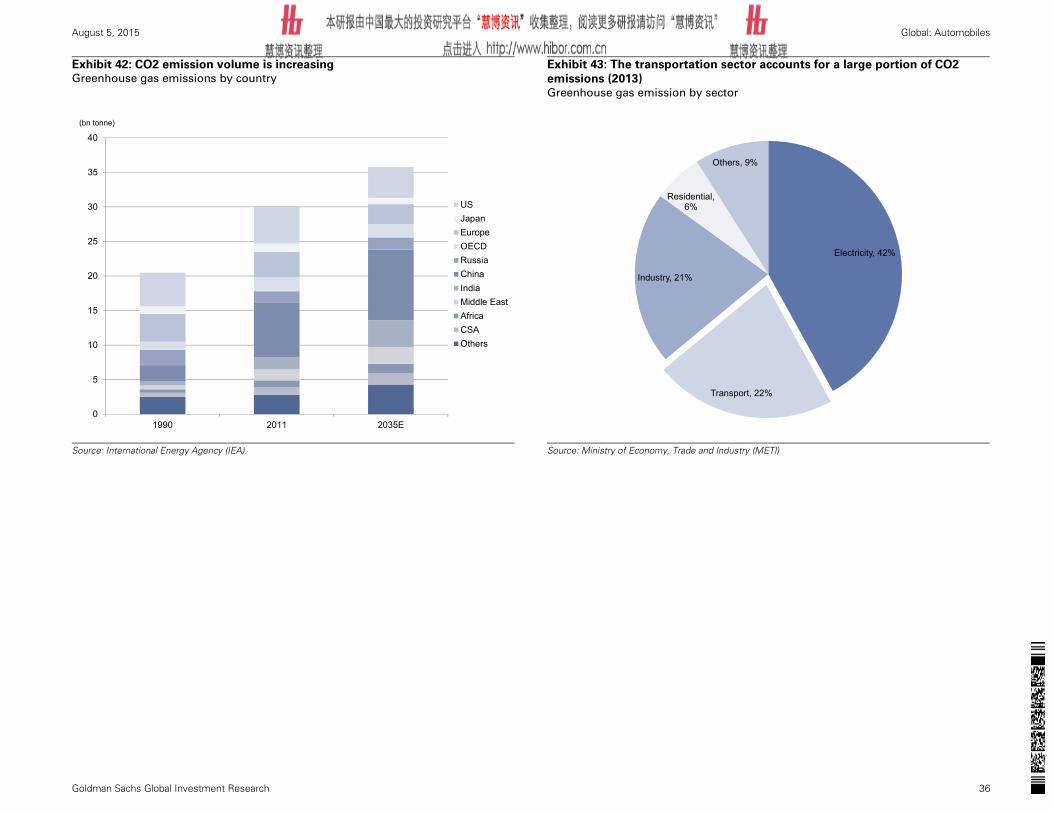
August 5, 2015 Global: Automobiles
Goldman Sachs Global Investment Research 36
Exhibit 42: CO2 emission volume is increasing Greenhouse gas emissions by country
Exhibit 43: The transportation sector accounts for a large portion of CO2
emissions (2013)
Greenhouse gas emission by sector
Source: International Energy Agency (IEA).
Source: Ministry of Economy, Trade and Industry (METI)
0
5
10
15
20
25
30
35
40
1990 2011 2035E
USJapanEuropeOECDRussiaChinaIndiaMiddle EastAfricaCSAOthers
(bn tonne)
Electricity, 42%
Transport, 22%
Industry, 21%
Residential, 6%
Others, 9%

August 5, 2015 Global: Automobiles
Goldman Sachs Global Investment Research 37
Exhibit 44: Motorization unstoppable as GDP increases Per capita GDP
Exhibit 45: New vehicle sales trending upward New vehicle sales volume and the developing nation sales ratio
Source: OECD.
Source: IHS, Goldman Sachs Global Investment Research.
Rising tide of tighter fuel economy regulations in US/Europe
Fuel economy standards could tighten in 2020-2025 mainly in the US/Europe. The Corporate Average Fuel Economy (CAFE) target of
54.5 MPG (miles per gallon) for the 2025 model year in the US, and European CO2 emission targets of 95g/km by 2020 and around
70g/km by 2025, represent very challenging hurdles for automakers. By 2025, we estimate 25% of cars will become electrified
vehicle (EV, FCV, PHEV and HV), vs. 5% in 2015.
OECD
Brazil
China
IndiaIndonesia
Russia
South Africa
0
10,000
20,000
30,000
40,000
50,000
60,000C
Y20
00
CY
2005
CY
2010
CY
2015
E
CY
2020
E
CY
2025
E
CY
2030
E
CY
2035
E
CY
2040
E
CY
2045
E
CY
2050
E
(USD)
29% 29%
38%
58%60%
66%70%
0%
10%
20%
30%
40%
50%
60%
70%
80%
0
20
40
60
80
100
120
1995 2000 2005 2010 2015E 2020E 2025E
Other EM
India
China
DM
EM ratio
(mn units)

August 5, 2015 Global: Automobiles
Goldman Sachs Global Investment Research 38
Exhibit 46: Rising tide of tighter fuel economy regulations CO2 emissions (gCO2/km) regulations
Exhibit 47: Electrified vehicles likely to be 25% of new car sales in 2025 Demand forecasts by power train
Source: Japan Automobile Manufacturers Association (JAMA), US Department of Energy (DOE), Goldman Sachs Global Investment Research.
Source: IHS, Goldman Sachs Global Investment Research.
All automakers need to overcome high regulatory hurdles in the next decade
The degree of improvement needed to meet the US CAFE standard for 2025 among automakers varies. We believe the current
environment is advantageous for Japanese automakers that sell hybrid vehicles chiefly in the compact category, which are already
more efficient. With CAFE regulations to become tighter by 2025, we believe all automakers have yet to fully put in place response
measures. The 95g/km standard in Europe by 2020 is a severe hurdle too. The degree of difficulty in meeting this standard varies
among luxury automakers and automakers without a compact diesel car lineup. We expect automakers to move quickly to expand
their lineups of plug-in hybrid electric vehicles (PHEVs), which have an average CO2 emission of 40-50g/km.
203
119113
89
156
140
116 116
170
140
120
95
72
165
118
70
90
110
130
150
170
190
210
23020
06
2007
2008
2009
2010
2011
2012
2013
2014
2015
E
2016
E
2017
E
2018
E
2019
E
2020
E
2021
E
2022
E
2023
E
2024
E
2025
E
US CAFE
Japan
Europe
China
(g/km)
0%
10%
20%
30%
40%
50%
60%
70%
80%
90%
100%
2012
2013
2014
P
2015
E
2016
E
2017
E
2018
E
2019
E
2020
E
2021
E
2022
E
2023
E
2024
E
2025
E
FCV
EV
PHEV
HV
Internalcombustionengines
(Mix)

August 5, 2015 Global: Automobiles
Goldman Sachs Global Investment Research 39
Exhibit 48: More than a 20% improvement in fuel economy needed Degree of fuel economy improvement required to meet US CAFE standards by
what 2025 (based on 2014 data)
Exhibit 49: Severe hurdles for automakers Degree of fuel economy improvement required to meet European CO2 emission
standards by 2020 (based on 2013 data)
Source: EPA, Goldman Sachs Global Investment Research.
Source: EU, Goldman Sachs Global Investment Research.
Progress toward international harmonization of vehicle test procedures
Along with the roadmap for the implementation of heightened fuel economy regulations, discussions are under way in Japan, the
US and Europe on creating a uniform vehicle test mode for measuring fuel economy. Designed to more closely represent real-world
fuel economy performance, the World-Harmonized Light-Duty Vehicles Test Procedure (WLTP) could lead to a reduction in test
mode fuel economy (actual WLTP introduction will be around 2020 in our view). WLTP constitutes a clear unfavorable headwind to
meeting fuel economy regulations but it could remove some of the complexities involved in performing several measurements of
fuel economy depending on various country standards. WLTP differs from Japan’s JC08 mode in the three ways shown below;
(1) The test cycle is different and fuel economy performance is measured in more low- and high-speed phases. Under WLTP, fuel
economy is sometimes measured at 130km/h.
(2) WLTP prioritizes cold-start data at the ignition point whereas Japan’s JC08 mode measures average fuel economy based on both
a hot and cold start.
(3) At present, weight for all vehicle types is calculated based on two passengers. Under WLTP, the test procedure may assume a
greater number of passengers depending on the vehicle type.
19%21% 22% 22%
28% 29% 29%
37%40%
49% 49% 50%
58%
0%
10%
20%
30%
40%
50%
60%
70%
25%29% 29%
31%36% 38% 38%
42% 42%46% 46%
50% 51%
0%
10%
20%
30%
40%
50%
60%
70%

August 5, 2015 Global: Automobiles
Goldman Sachs Global Investment Research 40
Exhibit 50: Test mode will be closer to real-world fuel economy performance
once test procedures are harmonized globally
WLTP test procedure
Exhibit 51: Japan’s JC08 mode is significantly different from WLTP JC08 test
Source: UNECE, DieselNet.
Source: MLIT.
California ZEV regulations heading to a new phase in 2018; PHEVs, FCVs and EVs to gain
importance
In addition to regulations at the country level, the regulatory drive is also evident in the US at the state level. Zero emission vehicle
(ZEV) regulations announced by the State of California includes hybrids in the ZEV category through 2017, but from 2018 will only
include PHEVs, EVs, and FCVs. The regulations apply to makers which have car sales in CA above 20,000 units. In 2018, ZEV credits
will change in accordance with the length of charge time (see Exhibit 53). We believe smaller EVs with faster charge times will
benefit the most, and we see the product segment that includes GM’s BOLT prototype further expanding. Several other states,
including New York, are planning to introduce ZEV regulations, making the technical hurdles for automakers even more severe.
FCVs a promising solution for meeting ZEV regulations
Toyota, Honda, and General Motors are rushing to launch FCVs as part of a broader effort to achieve a hydrogen-based society (also
possibly in light of California’s ZEV regulations). From 2018, automakers will be required to secure ZEV credits equivalent to 4.5% of
their total California sales volume, so Toyota, Honda, Ford, and General Motors, which have a strong presence in California, will
0
20
40
60
80
100
120
140
0 200 400 600 800 1000 1200
Speed (㎞/h)
No extra-high speed range.HighLowMiddleLow
(Time: Seconds)
Ends in 1,204 seconds

August 5, 2015 Global: Automobiles
Goldman Sachs Global Investment Research 41
need to secure a high level of credits (we estimate that Nissan will easily satisfy ZEV regulations through sales of its Leaf EV).
California is planning to offer nine credits per FCV (which may change). Based on their annual sales, Toyota and Honda should be
able to meet the first-year ZEV regulations by selling just under 2,000 and just over 1,000 FCVs, respectively. Meeting ZEV
regulations is not the main reason why the companies are pursuing the FCV business, but a fortunate by-product of selling FCVs is
that this should help them meet ZEV regulations.
Exhibit 52: ZEV regulations heading for a new phase in 2018
California ZEV regulation schedule
Exhibit 53: ZEV regulations to focus on EVs/FCVs
ZEV credits by category
Note: AT stands for Advanced Technology.
Source: CEPA.
Source: CEPA.
6% 6% 6% 6%
4% 5%3% 2%
2.21%3%
2.5% 3% 3.5% 4% 4.5%TZEV(=PHEV)
5% 5.5% 6%
0.79%3%
2%4%
6%8%
10%12%
14%16%
0%
5%
10%
15%
20%
25%
ZEV
EnhancedAT-PZEVAT-PZEV
PZEV
Credit counted by HEV, SULEV, CNG(-2011)
New ZEV regulationestablished.
ZEV, Enhanced PZEVrequirement
ZEV, Enhanced PZEVonly
Category Requirement (UDDS range)MY2012-17 MY2018-
Type I 50-75miles 2 2Type I.5 75-100miles 2.5 2.5Type II Over 100miles 3 3Type III Over 100miles + Fast refueling* or over 200miles 4 3Type IV Over 200miles + Fast refueling 5 3Type V Over 300miles + Fast refueling 7** 3
* See the chart belowFast refueling requirementsType III Must be capable of replacing 95 miles (UDDS ZEV range) in ≤ 10 minutesType IV Must be capable of replacing 190 miles (UDDS ZEV range) in ≤ 15 minutesType V Must be capable of replacing 285 miles (UDDS ZEV range) in ≤ 15 minutes **9 credits from 2015UDDS:Urban Dynamometer Driving Schedule
Credit

August 5, 2015 Global: Automobiles
Goldman Sachs Global Investment Research 42
Exhibit 54: ZEV credits required in 2025 in California Comparison of credits required to comply with regulation
Exhibit 55: FCVs currently qualify for ZEV credits Estimated FCV requirements in California for Toyota and Honda (sales volume)
Source: CEPA, Goldman Sachs Global Investment Research.
Source: CEPA, Goldman Sachs Global Investment Research.
-
10,000
20,000
30,000
40,000
50,000
60,000
70,000
80,000
90,000
1,172
1,823
2,474
3,125
3,776
4,427
5,078
5,729
1,845
2,869
3,894
4,919
5,944
6,968
7,993
9,018
0
1,000
2,000
3,000
4,000
5,000
6,000
7,000
8,000
9,000
10,000
2018 2019 2020 2021 2022 2023 2024 +2025
Honda Toyota

August 5, 2015 Global: Automobiles
Goldman Sachs Global Investment Research 43
Appendix I: Stocks in focus
Exhibit 56: Stocks in focus
Powertrain (ICE, EV and FCV)
Note: Market capitalization as of August 3, 2015.
Source: Datastream, Goldman Sachs Global Investment Research.
Company Ticker Region Market Cap.(US$, mn)
ICE advancementEngine management systemDenso 6902.T Japan 43,478 Global No.1 revenue auto parts makers. Toyota has 22% stake.Continental CONG.DE Germany 44,958 High tech auto parts maker. It has high end tire business as well.Keihin 7251.T Japan 1,089 High tech auto parts maker. Honda has 41.3% stake.Hyundai Mobis 012330.KS South Korea 17,325 High tech auto parts maker. Hyundai/Kia are its main customers.Bosch Non-listed Germany - Global No.2 revenue auto parts maker.TurboMitsubishi Heavy 7011.T Japan 17,830 World top 3 turbo charger maker.IHI 7013.T Japan 6,177 World top 5 turbo charger maker.Honeywell HON US 81,850 World top 3 turbo charger maker.BorgWarner BWA US 11,085 World top 3 turbo charger maker.Valeo VLOF.PA France 10,603 Global automotive suplier. Supplies electric super charger.Continental CONG.DE Germany 44,958 Global automotive suplier. Supplies gasoline turbo charger.TransmissionAisin 7259.T Japan 11,375 World top 3 automatic transmission maker. Toyota has 22% stake.ZF Non-listed Germany - World top 3 automatic transmission maker.JATCO Non-listed Japan - Global No.1 CVT maker. Nissan has majority stake.Schaeffler Non-listed Germany - World top 3 automatic transmission maker.Fuel Cell VehicleOEMsToyota 7203.T Japan 226,111 First mass produced FCV producer for retail customers.Honda 7267.T Japan 63,255 Aiming to launch FCV (mass production) in early 2016.Nissan 7201.T Japan 42,816 Aiming to launch FCV (mass production) in 2017.Hyundai 005380.KS South Korea 27,112 Already started FCV fleet sale.Volkswagen VOWG_p.DE Germany 60,146 Aiming to launch FCV (mass production).Hydrogen stationIwatani 8088.T Japan 1,525 Japanese No.1 hydrogen maker. Operates several hydrogen stations in Japan.Taiyo Nippon Sanso 4091.T Japan 5,112 Operates several hydrogen stations in Japan.JX Nippon Oil & Energy 5020.T Japan 10,179 Operates over 40 hydrogen stations in Japan.Electric VehicleBattery packPanasonic 6752.T Japan 28,943 Cosumer Electric maker. Strong in camera, sensors and Li-ion battery. Has a close relationship with Tesla.Tesla TSLA US 32,864 High end EV makers. Aiming to become world biggest Li-ion makers by 2020.GS Yuasa 6674.T Japan 1,638 Japanese Li-ion battery maker. Has JVs with both Honda and Mitsubishi Motors.LG Chem 051910.KS Korea 13,471 One of the largest Li-ion battery manufactureAESC Non-listed Japan - One of the largest Li-ion battery manufacture. Nissan and NEC have majority of stakes.Cathode materialNichia Non-listed Japan - Global No.1 in market share in cathode material. Also famous for LED.Umicore UMI Belgium 4,818 Global top 3 in market shareToda Kogyo 4100.T Japan 170 Global top 5 in market shareNippon Chemical Industrial 4092.T Belgium 155 Global top 5 in market shareTanaka Chemical Corp. 4080.T Japan 74 Global top 5 in market shareMitsubishi Chemical 4188.T Japan 9,743 Global top 5 in market shareAnode materialHitachi Chemical 4217.T Japan 3,718 Global No.1 in market share (30%)Mitsubishi Chemical 4188.T Japan 9,743 Global No.3 in market shareTokai Carbon 5301.T Japan 639 Global No.5 in market shareNippon Carbon 5302.T Japan 358 Global No.5 in market shareShowa Denko 4004.T Japan 1,884 Global No.5 in market shareSeparatorAsahi Kasei 3407.T Japan 10,850 Global No.1 in market share (over 30%)Celgard Non-listed Japan - Affiliate of Polypore (Asahi Kasei announced its acquisition). Global No.3 in market shareToray 3402.T Japan 12,762 Global No.3 in market shareUbe Industries 4208.T Japan 2,022 Top tier in market shareSumitomo Chemical 4005.T Japan 8,895 Top tier in market shareMitsui Chemical 4183.T Japan 3,817 Top tier in market sharePolypore PPO US 2,703 Top tier in market share. Asahi Kasei announced to marger Plypore in February 2015.Electrolyte SolutionUbe Industries 4208.T Japan 2,022 Global No.1 in market share (over 20%)Mitsubishi Chemical 4188.T Japan 9,743 Top tier in market shareLG Chem 051910.KS South Korea 13,471 Top tier in market shareLithium producerSQM SQM Chile 5,035 Global No.1 lithium producer.FMC FMC US 6,471 Holding FMC Lithium as an affiliate, the top tier lithium producer.
Comment

August 5, 2015 Global: Automobiles
Goldman Sachs Global Investment Research 44
Appendix II: Tesla valuation methodology
Exhibit 57: TESLA valuation
Key risks are higher/lower pace of Model S demand, FCF, and Gigafactory timing.
Source: Company data, Goldman Sachs Global Investment Research.
Elon as Steve Jobs
Elon as Henry Ford
Elon as the Maytag Repairman
Base case Downside caseProbability Weighted
Disruptive technology iPhone Ford Model TLaundry Appliance/
Dishwasher/RefigeratorEV/Model III EV/Model III
CategoryConsumer electronics
Automobiles Consumer durables Automobiles Automobiles
Historical reference period 2007-2016E 1909-19171916-1924/1947-1955/
1930-19382017-2025E 2017-2025E
2025 Global EV market (000)1 4,677 5,999 3,325 1,542 1,244
2025 EV market share of global LV sales1 4% 5% 3% 1% 1%
2025 Tesla units (000)1 3,164 3,258 1,806 767 507
2025 TSLA EV market share2 68% 54% 54% 50% 41%
2025 Revenue $mn $163,400 $170,943 $99,365 $53,313 $35,491
2025 Margin 14.2% 14.6% 13.9% 14.0% 11.9%
2025 EPS $72.71 $77.49 $42.10 $24.59 $13.85
P/E Multiple3 26.5x 39.3x 25.5x 25.2x 17.0x
Future value per share4 $1,316 $1,572 $898 $372 $191 valuation
Present value per share5 $505 $520 $352 $140 $77 $204
Stationary storagePlus: Stationary storage option value $32 $32 $32 $32 $32 $32
Scenario value per share $537 $552 $384 $172 $109
Potential Upside 102% 107% 44% -35% -59% 6-monthprice target
Scenario Likelihood 8.3% 8.3% 8.3% 50.0% 25.0% $236
1 Long range/pure EVs only Downside: -11%2 Consumer durables share based on Ford Model T3 Based on average multilpes applied in 2019 - 2025 4 Based on average of 2019 - 2025 values5 Based on average 2019-2025 future values discounted back at 20%/15% cost of equity during high/low growth periods
Note: upside potential is based off 7/30/2015 closing price
Automotive

August 5, 2015 Global: Automobiles
Goldman Sachs Global Investment Research 45
Appendix III: Glossary
Automatic Transmission (AT): AT is a transmission that that can automatically change gear ratio.
Compression ratio: Ratio of the volume in an internal combustion engine before and after compression. Power increases as the
compression ratio rises, but engine knocking can occur if it is too high.
Continuously variable transmission (CVT): CVT is a transmission that can change seamlessly without a gearshift. CVT limits power
losses and achieves great fuel efficiency as it can continuously change gear ratios.
Diesel particulate filter (DPF): A filter that removes harmful particles from diesel engine exhaust gas.
Dual-clutch transmission (DCT): DCT is a transmission using two separate clutches for odd and even gear sets. Shifts can be
accomplished without interrupting torque distribution to the driven roadwheels by applying the engine's torque to one clutch at the
same time as it is being disconnected from the other clutch.
Electric vehicle (EV): EV is an automobile that runs on a motor with electric power charged from an external source. It is free of
CO2 emissions as it does not use gasoline or other petroleum derivatives. Lithium ion batteries are the mainstream power source
for EVs.
Fuel cell vehicle (FCV): Whereas a gasoline car obtains kinetic energy using an engine to heat the gasoline, an FCV stores
hydrogen as fuel and generates power using a fuel cell installed in the vehicle. Since electricity is used to power the motor, FCVs
have similar properties to electric vehicles (EVs) and are also called FCEVs.
Gigafactory: Tesla’s battery plant currently under construction in Nevada. Panasonic has also invested in this factory.
Gasoline particulate filter (GPF): A filter that removes harmful particles from gasoline engine exhaust gas.
Hybrid vehicle (HV): An HV is an automobile that runs on two power sources: Engine and electric motor(s). HVs largely break down
into three categories based on their drivetrain, namely series, parallel, and power-split. The motor’s support leads to fuel efficiency
improvement during the drive.
Homogenous charge compression ignition (HCCI) engines: Gasoline engines that work through auto-ignition. HCCI engines may be
capable of reducing fuel costs by about 30% compared with current models.
Honeycomb: A common ceramic porous material reminiscent of honeycomb. Its form allows a broader contact area for exhaust gas
and catalyst.
Li-ion battery: A rechargeable battery capable of recharging and discharging as lithium ions migrate between the positive and
negative electrode. Generally lithium metal oxides are used for the positive electrode and carbon material for the negative electrode.
Plug-in hybrid vehicle (PHV): PHV is a type of HV that allows one to charge electricity directly to a storage battery from a residential
power plug. Similar to HVs, PHVs have series and parallel drivetrains. A PHV’s battery volume is larger compared to that of a HV,
but smaller compared to that of an EV. Driving distance for PHVs depends on the battery size.
Selective catalytic reduction (SCR): An after-treatment system that reduces nitrogen oxides (NOx) contained in exhaust gas with a
catalyst. Popular automotive SCRs include urea SCR, which uses ammonia as a reductant agent.
Thermal efficiency: The ratio of heat transformed into mechanical energy (work). The higher the thermal efficiency, the more
efficiently fuel is converted into mechanical energy.
World-Harmonized Light-Duty Vehicles Test Procedure (WLTP): WLTP is a global harmonized standard to test CO2 emissions

August 5, 2015 Global: Automobiles
Goldman Sachs Global Investment Research 46
and fuel consumption, and is currently being developed under the Article 29 Working Party (WP29). The procedure will likely provide
results with a more accurate reflection of actual fuel economy relative to unique test procedures currently adopted by each country.
Zero emission vehicle (ZEV) regulations: The emission regulatory framework at the state level in the United States. Regulations
announced by California will exclude hybrids from the ZEV category from 2018 and only include PHEVs, EVs, and FCVs.
Rating and pricing information
Aisin Seiki (N/N, ¥4,785), BorgWarner Inc. (N/N, $48.98), Continental (N/N, €205.25), Mazda Motor (B/N, ¥2,393), NGK Insulators (N/A,
¥3,185), Tesla Motors Inc. (N/N, $259.99) and Valeo (B/N, €121.60). Prices as of August 3, 2015 close.
August 5, 2015 Global: Automobiles
Goldman Sachs Global Investment Research 47
Disclosure Appendix
Reg AC
We, Kota Yuzawa, Patrick Archambault, CFA, Stefan Burgstaller, Yipeng Yang and Ashik Kurian, hereby certify that all of the views expressed in this report accurately reflect our personal views about
the subject company or companies and its or their securities. We also certify that no part of our compensation was, is or will be, directly or indirectly, related to the specific recommendations or views
expressed in this report.
Unless otherwise stated, the individuals listed on the cover page of this report are analysts in Goldman Sachs' Global Investment Research division.
Investment Profile
The Goldman Sachs Investment Profile provides investment context for a security by comparing key attributes of that security to its peer group and market. The four key attributes depicted are: growth,
returns, multiple and volatility. Growth, returns and multiple are indexed based on composites of several methodologies to determine the stocks percentile ranking within the region's coverage
universe.
The precise calculation of each metric may vary depending on the fiscal year, industry and region but the standard approach is as follows:
Growth is a composite of next year's estimate over current year's estimate, e.g. EPS, EBITDA, Revenue. Return is a year one prospective aggregate of various return on capital measures, e.g. CROCI,
ROACE, and ROE. Multiple is a composite of one-year forward valuation ratios, e.g. P/E, dividend yield, EV/FCF, EV/EBITDA, EV/DACF, Price/Book. Volatility is measured as trailing twelve-month
volatility adjusted for dividends.
Quantum
Quantum is Goldman Sachs' proprietary database providing access to detailed financial statement histories, forecasts and ratios. It can be used for in-depth analysis of a single company, or to make
comparisons between companies in different sectors and markets.
GS SUSTAIN
GS SUSTAIN is a global investment strategy aimed at long-term, long-only performance with a low turnover of ideas. The GS SUSTAIN focus list includes leaders our analysis shows to be well
positioned to deliver long term outperformance through sustained competitive advantage and superior returns on capital relative to their global industry peers. Leaders are identified based on
quantifiable analysis of three aspects of corporate performance: cash return on cash invested, industry positioning and management quality (the effectiveness of companies' management of the
environmental, social and governance issues facing their industry).
Disclosures
Coverage group(s) of stocks by primary analyst(s)
Kota Yuzawa: Japan-Automobiles. Patrick Archambault, CFA: America-Autos & Auto Parts, America-Autos Dealers. Stefan Burgstaller: Europe-Autos & Auto Parts. Yipeng Yang: China Autos. Ashik
Kurian: Europe-Autos & Auto Parts.
America-Autos & Auto Parts: BorgWarner Inc., Dana Holding, Delphi Automotive Plc, Ford Motor Co., General Motors Co., Harley-Davidson Inc., Johnson Controls Inc., Lear Corp., Magna International
Inc., Magna International Inc., Meritor Inc., Metaldyne Performance Group, Tenneco Inc., Tesla Motors Inc., Tower International Inc..
America-Autos Dealers: AutoNation Inc., Group 1 Automotive Inc., Penske Automotive Group, Sonic Automotive Inc..
China Autos: Anhui Jianghuai Automobile Co., Baoxin Auto Group, Brilliance China Automotive, BYD Co., China Harmony New Energy Auto, Chongqing Changan Auto (A), Chongqing Changan Auto
(B), Dongfeng Motor, FAW Car, Fuyao Glass Industry Group (A), Fuyao Glass Industry Group (H), Geely Automobile Holdings, Great Wall Motor Co. (H), Great Wall Motor Co.(A), Guangzhou
Automobile Group, Huayu Automotive Systems, Minth Group, SAIC Motor, Sinotruk (Hong Kong), Weichai Power (A), Weichai Power (H), Weifu High-Technology Group (A), Weifu High-Technology
Group (B), Zhengtong Auto Services Holdings, Zhongsheng Group.
Europe-Autos & Auto Parts: Autoliv Inc., BMW, CNH Industrial, CNH Industrial, Continental, Daimler AG, Faurecia, Fiat Chrysler Automobiles NV, Fiat Chrysler Automobiles NV, GKN, Hella KGaA Hueck,
Michelin, Nokian Renkaat, Peugeot, Pirelli, Porsche, Renault, Valeo, Volkswagen, Volvo.
Japan-Automobiles: Aisin Seiki, Bridgestone, Calsonic Kansei, Daihatsu Motor, Denso, FCC, Fuji Heavy Industries, Hino Motors, Honda Motor, Isuzu Motors, Keihin, Mazda Motor, Mitsubishi Motors,
Nissan Motor, Nissin Kogyo, Stanley Electric, Sumitomo Rubber Industries, Suzuki Motor, Toyota Boshoku, Toyota Industries, Toyota Motor, TS Tech, Unipres, Yamaha Motor.
Company-specific regulatory disclosures
Compendium report: please see disclosures at http://www.gs.com/research/hedge.html. Disclosures applicable to the companies included in this compendium can be found in the latest relevant
published research
Distribution of ratings/investment banking relationships
Goldman Sachs Investment Research global coverage universe

August 5, 2015 Global: Automobiles
Goldman Sachs Global Investment Research 48
Rating Distribution Investment Banking Relationships
Buy Hold Sell Buy Hold Sell
Global 32% 53% 15% 46% 38% 33%
As of July 1, 2015, Goldman Sachs Global Investment Research had investment ratings on 3,248 equity securities. Goldman Sachs assigns stocks as Buys and Sells on various regional Investment
Lists; stocks not so assigned are deemed Neutral. Such assignments equate to Buy, Hold and Sell for the purposes of the above disclosure required by NASD/NYSE rules. See 'Ratings, Coverage
groups and views and related definitions' below.
Price target and rating history chart(s)
Compendium report: please see disclosures at http://www.gs.com/research/hedge.html. Disclosures applicable to the companies included in this compendium can be found in the latest relevant
published research
Regulatory disclosures
Disclosures required by United States laws and regulations
See company-specific regulatory disclosures above for any of the following disclosures required as to companies referred to in this report: manager or co-manager in a pending transaction; 1% or
other ownership; compensation for certain services; types of client relationships; managed/co-managed public offerings in prior periods; directorships; for equity securities, market making and/or
specialist role. Goldman Sachs usually makes a market in fixed income securities of issuers discussed in this report and usually deals as a principal in these securities.
The following are additional required disclosures: Ownership and material conflicts of interest: Goldman Sachs policy prohibits its analysts, professionals reporting to analysts and members of their
households from owning securities of any company in the analyst's area of coverage. Analyst compensation: Analysts are paid in part based on the profitability of Goldman Sachs, which includes
investment banking revenues. Analyst as officer or director: Goldman Sachs policy prohibits its analysts, persons reporting to analysts or members of their households from serving as an officer,
director, advisory board member or employee of any company in the analyst's area of coverage. Non-U.S. Analysts: Non-U.S. analysts may not be associated persons of Goldman, Sachs & Co. and
therefore may not be subject to NASD Rule 2711/NYSE Rules 472 restrictions on communications with subject company, public appearances and trading securities held by the analysts.
Distribution of ratings: See the distribution of ratings disclosure above. Price chart: See the price chart, with changes of ratings and price targets in prior periods, above, or, if electronic format or if
with respect to multiple companies which are the subject of this report, on the Goldman Sachs website at http://www.gs.com/research/hedge.html.
Additional disclosures required under the laws and regulations of jurisdictions other than the United States
The following disclosures are those required by the jurisdiction indicated, except to the extent already made above pursuant to United States laws and regulations. Australia: Goldman Sachs Australia
Pty Ltd and its affiliates are not authorised deposit-taking institutions (as that term is defined in the Banking Act 1959 (Cth)) in Australia and do not provide banking services, nor carry on a banking
business, in Australia. This research, and any access to it, is intended only for "wholesale clients" within the meaning of the Australian Corporations Act, unless otherwise agreed by Goldman Sachs. In
producing research reports, members of the Global Investment Research Division of Goldman Sachs Australia may attend site visits and other meetings hosted by the issuers the subject of its research
reports. In some instances the costs of such site visits or meetings may be met in part or in whole by the issuers concerned if Goldman Sachs Australia considers it is appropriate and reasonable in the
specific circumstances relating to the site visit or meeting. Brazil: Disclosure information in relation to CVM Instruction 483 is available at http://www.gs.com/worldwide/brazil/area/gir/index.html.
Where applicable, the Brazil-registered analyst primarily responsible for the content of this research report, as defined in Article 16 of CVM Instruction 483, is the first author named at the beginning of
this report, unless indicated otherwise at the end of the text. Canada: Goldman Sachs Canada Inc. is an affiliate of The Goldman Sachs Group Inc. and therefore is included in the company specific
disclosures relating to Goldman Sachs (as defined above). Goldman Sachs Canada Inc. has approved of, and agreed to take responsibility for, this research report in Canada if and to the extent that
Goldman Sachs Canada Inc. disseminates this research report to its clients. Hong Kong: Further information on the securities of covered companies referred to in this research may be obtained on
request from Goldman Sachs (Asia) L.L.C. India: Further information on the subject company or companies referred to in this research may be obtained from Goldman Sachs (India) Securities Private
Limited. Goldman Sachs may beneficially own 1% or more of the securities (as such term is defined in clause 2 (h) the Indian Securities Contracts (Regulation) Act, 1956) of the subject company or
companies referred to in this research report. Japan: See below. Korea: Further information on the subject company or companies referred to in this research may be obtained from Goldman Sachs
(Asia) L.L.C., Seoul Branch. New Zealand: Goldman Sachs New Zealand Limited and its affiliates are neither "registered banks" nor "deposit takers" (as defined in the Reserve Bank of New Zealand Act
1989) in New Zealand. This research, and any access to it, is intended for "wholesale clients" (as defined in the Financial Advisers Act 2008) unless otherwise agreed by Goldman
Sachs. Russia: Research reports distributed in the Russian Federation are not advertising as defined in the Russian legislation, but are information and analysis not having product promotion as their
main purpose and do not provide appraisal within the meaning of the Russian legislation on appraisal activity. Singapore: Further information on the covered companies referred to in this research
may be obtained from Goldman Sachs (Singapore) Pte. (Company Number: 198602165W). Taiwan: This material is for reference only and must not be reprinted without permission. Investors should
carefully consider their own investment risk. Investment results are the responsibility of the individual investor. United Kingdom: Persons who would be categorized as retail clients in the United
Kingdom, as such term is defined in the rules of the Financial Conduct Authority, should read this research in conjunction with prior Goldman Sachs research on the covered companies referred to
herein and should refer to the risk warnings that have been sent to them by Goldman Sachs International. A copy of these risks warnings, and a glossary of certain financial terms used in this report,
are available from Goldman Sachs International on request.
European Union: Disclosure information in relation to Article 4 (1) (d) and Article 6 (2) of the European Commission Directive 2003/126/EC is available at
http://www.gs.com/disclosures/europeanpolicy.html which states the European Policy for Managing Conflicts of Interest in Connection with Investment Research.
Japan: Goldman Sachs Japan Co., Ltd. is a Financial Instrument Dealer registered with the Kanto Financial Bureau under registration number Kinsho 69, and a member of Japan Securities Dealers
Association, Financial Futures Association of Japan and Type II Financial Instruments Firms Association. Sales and purchase of equities are subject to commission pre-determined with clients plus
consumption tax. See company-specific disclosures as to any applicable disclosures required by Japanese stock exchanges, the Japanese Securities Dealers Association or the Japanese Securities
Finance Company.

August 5, 2015 Global: Automobiles
Goldman Sachs Global Investment Research 49
Ratings, coverage groups and views and related definitions
Buy (B), Neutral (N), Sell (S) -Analysts recommend stocks as Buys or Sells for inclusion on various regional Investment Lists. Being assigned a Buy or Sell on an Investment List is determined by a
stock's return potential relative to its coverage group as described below. Any stock not assigned as a Buy or a Sell on an Investment List is deemed Neutral. Each regional Investment Review
Committee manages various regional Investment Lists to a global guideline of 25%-35% of stocks as Buy and 10%-15% of stocks as Sell; however, the distribution of Buys and Sells in any particular
coverage group may vary as determined by the regional Investment Review Committee. Regional Conviction Buy and Sell lists represent investment recommendations focused on either the size of the
potential return or the likelihood of the realization of the return.
Return potential represents the price differential between the current share price and the price target expected during the time horizon associated with the price target. Price targets are required for all
covered stocks. The return potential, price target and associated time horizon are stated in each report adding or reiterating an Investment List membership.
Coverage groups and views: A list of all stocks in each coverage group is available by primary analyst, stock and coverage group at http://www.gs.com/research/hedge.html. The analyst assigns one
of the following coverage views which represents the analyst's investment outlook on the coverage group relative to the group's historical fundamentals and/or valuation. Attractive (A). The
investment outlook over the following 12 months is favorable relative to the coverage group's historical fundamentals and/or valuation. Neutral (N). The investment outlook over the following 12
months is neutral relative to the coverage group's historical fundamentals and/or valuation. Cautious (C). The investment outlook over the following 12 months is unfavorable relative to the coverage
group's historical fundamentals and/or valuation.
Not Rated (NR). The investment rating and target price have been removed pursuant to Goldman Sachs policy when Goldman Sachs is acting in an advisory capacity in a merger or strategic
transaction involving this company and in certain other circumstances. Rating Suspended (RS). Goldman Sachs Research has suspended the investment rating and price target for this stock, because
there is not a sufficient fundamental basis for determining, or there are legal, regulatory or policy constraints around publishing, an investment rating or target. The previous investment rating and
price target, if any, are no longer in effect for this stock and should not be relied upon. Coverage Suspended (CS). Goldman Sachs has suspended coverage of this company. Not Covered (NC). Goldman Sachs does not cover this company. Not Available or Not Applicable (NA). The information is not available for display or is not applicable. Not Meaningful (NM). The
information is not meaningful and is therefore excluded.
Global product; distributing entities
The Global Investment Research Division of Goldman Sachs produces and distributes research products for clients of Goldman Sachs on a global basis. Analysts based in Goldman Sachs offices
around the world produce equity research on industries and companies, and research on macroeconomics, currencies, commodities and portfolio strategy. This research is disseminated in Australia
by Goldman Sachs Australia Pty Ltd (ABN 21 006 797 897); in Brazil by Goldman Sachs do Brasil Corretora de Títulos e Valores Mobiliários S.A.; in Canada by either Goldman Sachs Canada Inc. or
Goldman, Sachs & Co.; in Hong Kong by Goldman Sachs (Asia) L.L.C.; in India by Goldman Sachs (India) Securities Private Ltd.; in Japan by Goldman Sachs Japan Co., Ltd.; in the Republic of Korea by
Goldman Sachs (Asia) L.L.C., Seoul Branch; in New Zealand by Goldman Sachs New Zealand Limited; in Russia by OOO Goldman Sachs; in Singapore by Goldman Sachs (Singapore) Pte. (Company
Number: 198602165W); and in the United States of America by Goldman, Sachs & Co. Goldman Sachs International has approved this research in connection with its distribution in the United
Kingdom and European Union.
European Union: Goldman Sachs International authorised by the Prudential Regulation Authority and regulated by the Financial Conduct Authority and the Prudential Regulation Authority, has
approved this research in connection with its distribution in the European Union and United Kingdom; Goldman Sachs AG and Goldman Sachs International Zweigniederlassung Frankfurt, regulated
by the Bundesanstalt für Finanzdienstleistungsaufsicht, may also distribute research in Germany.
General disclosures
This research is for our clients only. Other than disclosures relating to Goldman Sachs, this research is based on current public information that we consider reliable, but we do not represent it is
accurate or complete, and it should not be relied on as such. We seek to update our research as appropriate, but various regulations may prevent us from doing so. Other than certain industry reports
published on a periodic basis, the large majority of reports are published at irregular intervals as appropriate in the analyst's judgment.
Goldman Sachs conducts a global full-service, integrated investment banking, investment management, and brokerage business. We have investment banking and other business relationships with a
substantial percentage of the companies covered by our Global Investment Research Division. Goldman, Sachs & Co., the United States broker dealer, is a member of SIPC (http://www.sipc.org).
Our salespeople, traders, and other professionals may provide oral or written market commentary or trading strategies to our clients and principal trading desks that reflect opinions that are contrary
to the opinions expressed in this research. Our asset management area, principal trading desks and investing businesses may make investment decisions that are inconsistent with the
recommendations or views expressed in this research.
The analysts named in this report may have from time to time discussed with our clients, including Goldman Sachs salespersons and traders, or may discuss in this report, trading strategies that
reference catalysts or events that may have a near-term impact on the market price of the equity securities discussed in this report, which impact may be directionally counter to the analyst's published
price target expectations for such stocks. Any such trading strategies are distinct from and do not affect the analyst's fundamental equity rating for such stocks, which rating reflects a stock's return
potential relative to its coverage group as described herein.
We and our affiliates, officers, directors, and employees, excluding equity and credit analysts, will from time to time have long or short positions in, act as principal in, and buy or sell, the securities or
derivatives, if any, referred to in this research.
The views attributed to third party presenters at Goldman Sachs arranged conferences, including individuals from other parts of Goldman Sachs, do not necessarily reflect those of Global Investment
Research and are not an official view of Goldman Sachs.
Any third party referenced herein, including any salespeople, traders and other professionals or members of their household, may have positions in the products mentioned that are inconsistent with
the views expressed by analysts named in this report.
This research is not an offer to sell or the solicitation of an offer to buy any security in any jurisdiction where such an offer or solicitation would be illegal. It does not constitute a personal
recommendation or take into account the particular investment objectives, financial situations, or needs of individual clients. Clients should consider whether any advice or recommendation in this

August 5, 2015 Global: Automobiles
Goldman Sachs Global Investment Research 50
research is suitable for their particular circumstances and, if appropriate, seek professional advice, including tax advice. The price and value of investments referred to in this research and the income
from them may fluctuate. Past performance is not a guide to future performance, future returns are not guaranteed, and a loss of original capital may occur. Fluctuations in exchange rates could have
adverse effects on the value or price of, or income derived from, certain investments.
Certain transactions, including those involving futures, options, and other derivatives, give rise to substantial risk and are not suitable for all investors. Investors should review current options
disclosure documents which are available from Goldman Sachs sales representatives or at http://www.theocc.com/about/publications/character-risks.jsp. Transaction costs may be significant in option
strategies calling for multiple purchase and sales of options such as spreads. Supporting documentation will be supplied upon request.
All research reports are disseminated and available to all clients simultaneously through electronic publication to our internal client websites. Not all research content is redistributed to our clients or
available to third-party aggregators, nor is Goldman Sachs responsible for the redistribution of our research by third party aggregators. For research, models or other data available on a particular
security, please contact your sales representative or go to http://360.gs.com.
Disclosure information is also available at http://www.gs.com/research/hedge.html or from Research Compliance, 200 West Street, New York, NY 10282.
© 2015 Goldman Sachs.
No part of this material may be (i) copied, photocopied or duplicated in any form by any means or (ii) redistributed without the prior written consent of The Goldman Sachs Group, Inc.