cart2 model
TRANSCRIPT

NREL is a national laboratory of the U.S. Department of Energy, Office of Energy Efficiency & Renewable Energy, operated by the Alliance for Sustainable Energy, LLC.
Contract No. DE-AC36-08GO28308
Controller Field Tests on the NREL CART2 Turbine E. Bossanyi Garrad Hassan & Partners Ltd.
A. Wright and P. Fleming National Renewable Energy Laboratory
Technical Report NREL/TP-5000-49085 December 2010

NREL is a national laboratory of the U.S. Department of Energy, Office of Energy Efficiency & Renewable Energy, operated by the Alliance for Sustainable Energy, LLC.
National Renewable Energy Laboratory 1617 Cole Boulevard Golden, Colorado 80401 303-275-3000 • www.nrel.gov
Contract No. DE-AC36-08GO28308
Controller Field Tests on the NREL CART2 Turbine E. Bossanyi Garrad Hassan & Partners Ltd.
A. Wright and P. Fleming National Renewable Energy Laboratory
Prepared under Task No. WE10.3131
Technical Report NREL/TP-5000-49085 December 2010

NOTICE
This report was prepared as an account of work sponsored by an agency of the United States government. Neither the United States government nor any agency thereof, nor any of their employees, makes any warranty, express or implied, or assumes any legal liability or responsibility for the accuracy, completeness, or usefulness of any information, apparatus, product, or process disclosed, or represents that its use would not infringe privately owned rights. Reference herein to any specific commercial product, process, or service by trade name, trademark, manufacturer, or otherwise does not necessarily constitute or imply its endorsement, recommendation, or favoring by the United States government or any agency thereof. The views and opinions of authors expressed herein do not necessarily state or reflect those of the United States government or any agency thereof.
Available electronically at http://www.osti.gov/bridge
Available for a processing fee to U.S. Department of Energy and its contractors, in paper, from:
U.S. Department of Energy Office of Scientific and Technical Information
P.O. Box 62 Oak Ridge, TN 37831-0062 phone: 865.576.8401 fax: 865.576.5728 email: mailto:[email protected]
Available for sale to the public, in paper, from:
U.S. Department of Commerce National Technical Information Service 5285 Port Royal Road Springfield, VA 22161 phone: 800.553.6847 fax: 703.605.6900 email: [email protected] online ordering: http://www.ntis.gov/help/ordermethods.aspx
Cover Photos: (left to right) PIX 16416, PIX 17423, PIX 16560, PIX 17613, PIX 17436, PIX 17721
Printed on paper containing at least 50% wastepaper, including 10% post consumer waste.

iii
Abstract
This document presents the results of the field tests carried out on the CART2 turbine at NREL to validate control algorithms for individual pitch control and active tower damping designed for this turbine by Garrad Hassan & Partners Ltd as part of the European research project ‘UPWIND’.

iv
Table of Contents
Abstract ........................................................................................................................................ iii Introduction ................................................................................................................................... 1 The CART2 turbine ....................................................................................................................... 1 Controller design ........................................................................................................................... 3 Field tests ...................................................................................................................................... 6
Instrumentation .......................................................................................................................... 6 Controller adjustments ............................................................................................................... 6 First results ................................................................................................................................ 7 Analysis of individual campaigns .............................................................................................. 8 Aggregated data analysis ......................................................................................................... 16
Conclusions ................................................................................................................................. 24 References ................................................................................................................................... 25 Appendix A. Bladed model parameters for CART2 ................................................................... 26
Figures Figure 1. CART2 Campbell diagram ............................................................................................ 2 Figure 2. Speed regulation around rated ....................................................................................... 7 Figure 3. Effect of acceleration offset ........................................................................................... 8 Figure 4. First results with and without IPC and FATD: 600s datasets near rated ..................... 10 Figure 5. Tower base moment: two comparisons with measured data (top) and a comparable
simulation result (bottom). Units: (Nm)2/Hz .................................................................. 12 Figure 6. Blade root My moment: two comparisons with measured data (top) and a comparable
simulation result (bottom). Units: (Nm)2/Hz ................................................................. 13 Figure 7. Shaft My moment: two comparisons with measured data (top) and a comparable
simulation result (bottom). Units: (Nm)2/Hz .................................................................. 14 Figure 8. Hub fixed Mz (yaw) moment: two comparisons with measured data (top) and a
comparable simulation result (bottom). Units: (Nm)2/Hz .............................................. 15 Figure 9. Teeter angles (deg): two comparisons with measured data ......................................... 15 Figure 10. Pitch rate spectra: two comparisons with measured data (top) and a comparable
simulation result (bottom). Units: (rad/s)2/Hz ................................................................ 16 Figure 11. Sample time histories of pitch rate for OFF (left) and ON (right) cases in comparable
wind conditions .............................................................................................................. 16 Figure 12: Spread of datasets ...................................................................................................... 17 Figure 13. DELs, Hub My ........................................................................................................... 18 Figure 14. DELs, Hub yaw Mz ................................................................................................... 18 Figure 15. DELs, Tower base My ............................................................................................... 19 Figure 16: Power output .............................................................................................................. 19 Figure 17. Blade root My DEL (steel) ........................................................................................ 20 Figure 18. Blade root My DEL (GRP) ........................................................................................ 21 Figure 19. Shaft My DEL (steel) ................................................................................................. 21 Figure 20. My Nod moment DEL (steel) .................................................................................... 22 Figure 21. Mz Yaw moment DEL (steel) .................................................................................... 22 Figure 22. Tower My DEL (steel) ............................................................................................... 23

v
Tables Table 1. Lowest key frequencies, as modeled ............................................................................... 3 Table 2: Controller parameters ...................................................................................................... 5 Table 3. Sample datasets for comparison .................................................................................... 11 Table 4. Load reductions averaged over the eight bins above 12 m/s ......................................... 23

1
Introduction
An important task of the UPWIND control systems work package is to use field tests to demonstrate that the very significant load reductions predicted with individual pitch control (IPC) can really be achieved in practice. So far, the only published results have come from simulation models [1], so field test results are vital for increasing the confidence of turbine designers to use IPC in their new designs to improve cost-effectiveness. As well as reducing asymmetrical out of plane loading on three-bladed machines, IPC can similarly be used on two-bladed machines to replace a mechanical teeter hinge [2]. Two-bladed turbines are still in contention for use offshore, since some of the main environmental impact objections are less relevant in that environment, i.e. aerodynamic noise due to high tip speed, and visual appearance. Although the hub fatigue loads will still be higher than with a completely free teeter hinge, some form of teeter restraint is often required in practice. This reintroduces some loading, and the possibility of extreme load damage due to teeter end-stop impacts. In any case, the advanced control principles to be tested (both IPC and tower damping), are actually identical, irrespective of the number of blades. The IPC control action is calculated in the non-rotating frame in two orthogonal axes, and this is equally valid for any number of blades. Field tests were originally intended for a commercial European turbine, but commercial considerations prevented this testing. Therefore, a new program was conceived in 2008, making use of two research turbines at the NREL test site in Colorado, USA. Both Controls Advanced Research Turbines (CART's) are 42m in diameter and rated at 660 kW. Because the CART2 is two bladed and the CART3 is three-bladed, they provided an excellent opportunity to test IPC in both cases. Although these turbines may be a bit small and commercially unrepresentative, they are quite adequate for the required proof of principle, and have the advantage of being very accessible and free of commercial problems that might prevent publication of results. Some of the field test results have been published in [3],[4] and a full report is available in [5]. At the same time, they offer the opportunity to further confirm the efficacy of fore-aft tower damping (FATD) by means of collective pitch control. Although this has previously been demonstrated in the field [6], the present tests provided an ideal opportunity to provide further experimental verification of this technique. This document presents the results of the field tests carried out on the two-bladed CART2 turbine at NREL, and demonstrates conclusively that both IPC and FATD can reduce fatigue loading as anticipated. The CART2 turbine
The CART2 turbine is 42m in diameter, with a rated output of 660 kW at 41.7 rpm rotor speed. For these tests the rated power was set at 570 kW which is reached at about 12.7 m/s wind speed. The machine is two-bladed with a teetered hub. The aim of the IPC is to avoid the need for a teetered hub, but the turbine has a teeter brake, which was applied during the tests to lock the teeter hinge.

2
The CART-2 is fitted with conventional strain gauges, but these are very stable, robust and well calibrated. This is partly because of the mounting position, made possible by the spindle bearings used for pitching, which also results in very low pitch bearing friction and very fast actuator response, which is very suitable for IPC. This is excellent for proving the control principles, even if it does not allow experience to be built up with the use of fiber-optic load sensors (which are more likely to be chosen for commercial applications) or the effect on more conventional pitch bearings or actuation systems. A Bladed model of the CART-2 turbine was built from information supplied by NREL [7]. Details are provided in Appendix A. Linearized models were derived from this at a number of operating points, and used as the starting point for control tuning. A Campbell diagram showing the coupled system modes is shown in Figure 1. The lowest key frequencies are listed in Table 1. Some of the frequencies do not match exactly with those measured on the real turbine; however, as the advanced control techniques being tested here are expected to be reasonably robust, no further effort was made to match the model exactly to the turbine. The experimental results certainly have helped to confirm this robustness.
Figure 1. CART2 Campbell diagram

3
Table 1. Lowest key frequencies, as modeled
Rated rotational frequency (1P) 0.695 Hz
Blade passing frequency (2P) 1.39 Hz
First fore-aft tower mode 0.88 Hz
First rotor out of plane mode 2.22 Hz
Drive train torsion 3.36 Hz
First rotor in-plane mode 4.31 Hz
Controller design
The power production control algorithm to be tested on the CART2 is based on up-to-date principles regularly used by Garrad Hassan (GH) for commercial controller design work [1],[8]. The application of these techniques to the UPWIND 5 MW reference turbine is documented in [9],[10]. The application of these techniques to the CART2 is similar and, therefore, not elaborated here in detail. The controller includes the following features:
• Optimal power production, maintaining peak Cp over the entire nominal operating speed range
• Speed regulation by interacting PI-based torque and collective pitch control loops
• Drivetrain damping filter in torque controller
• Damping of fore-aft tower vibration by collective pitch control
• PI-based 1P individual pitch control to reduce rotating and non-rotating loads
The tuning of the control loops has been carried out using classical design techniques. Although the controller as a whole has several measured input signals and several output demands, it can easily be divided into a series of largely decoupled single-input, single-output loops for which classical methods are well suited. For those loops which are not fully decoupled, for example the collective pitch control loops for rotor speed and tower vibration, a good coupled solution can be reached after only a very small number of iterations with each loop in turn. In many ways, this is more practical than using multivariable methods. Of particular relevance to this work, the IPC control is decoupled into two orthogonal PI control loops, tuned identically, thus ignoring the azimuthal asymmetry in the turbine dynamics due to the tower. The tower damper was tuned in parallel with the pitch PI controller using an iterative approach, but a single iteration was sufficient. The main controller parameters are listed in Table 2. The drivetrain damper is not included, for reasons explained below.

4
For the field testing, the IPC and FATD action can be switched on and off during operation without affecting speed regulation. By comparing test data with and without the advanced features, the load reduction can be quantified across a variety of wind conditions.

5
Table 2: Controller parameters
Parameter Value Units
Minimum generator speed 1295 rpm
Optimal mode quadratic speed-torque gain 0.081997 Nms²/rad²
Rated generator speed 1800 rpm
Generator torque set point 3524.36 Nm
Fine pitch angle -1 deg
Dead-band 0.1 deg
Maximum negative pitch rate -18 deg/s
Maximum positive pitch rate 18 deg/s
Pitch position error adjustment gain 1 s-1
Nominal pitch controller proportional gain 0.02127 s
Nominal pitch controller integral gain 0.01820 -
Gain schedule Inverse linear on pitch angle -
Gain divisor below 7º 1 -
Gain divisor above 49º 7.8 -
Power-pitch proportional gain 1.e-6 rad/W
Power-pitch integral gain 1.e-6 rad/Ws
Pitch controller notch filter 1 8.7178, 0, 8.20266, 0.06072 Note 1
Pitch controller notch filter 2 8.7178, 0, 9.26528, 0.06072 Note 1
Pitch controller notch filter 3 21.031, 0.3507, 17.66, 0.5755 Note 1
Pitch controller notch filter 4 20.5, 0.0077, 20.5, 0.0971 Note 1
Tower damping gain 0.01614 rad/m
Tower damping filter 2.8, 0.8878, 4.713, 0.437 Note 1
Accelerometer high-pass filter frequency 0.6283 rad/s
Accelerometer high-pass filter damping 0.7071 rad/s
IPC maximum amplitude (Note 2) 5 deg
IPC proportional gain 1.1416e-7 deg/Nm
IPC integral gain 5.2514e-7 deg/Nms
IPC notch filter 8.73372, 0, 8.73372, 1 Note 1
IPC low pass filter frequency 20 rad/s
IPC low pass filter damping factor 1 -
IPC azimuthal compensation time shift 0.01 s
Azimuthal dead-band 0.001 rad
Torque controller proportional gain 264 Nms/rad
Torque controller integral gain 132 Nm/rad
Torque controller notch filter 25.131, 0, 5.02163, 0.919122 Note 1
Note 1: Numerator frequency (rad/s), numerator damping factor, denominator frequency (rad/s), d i t d i f tNote 2: Reduced to 2.9º during tests to avoid pitch actuator thermal stress

6
Field tests
The CART2 baseline controller at NREL is compiled from C and runs on a DOS computer. In early 2009, following simulation testing using Bladed [2], the new power production algorithm was embedded within the existing controller code. This already included the supervisory control, which hands over control to the new algorithm when a certain rotational speed is reached, but continues to monitor for faults and resumes control for shutdowns. Unfortunately, a gearbox failure occurred just before testing was due to begin, delaying the start of field testing until November 2009. There followed a winter wind season with unusually low winds, so that the first data was not obtained until early February 2010. The first results demonstrated good performance of the advanced load reduction features of the controller, as shown below. Testing continued, whenever sufficient wind was available, until mid-April 2010, allowing datasets to be collected over a good range of wind conditions. Instrumentation The sensor inputs to the control algorithm were:
• Rotor speed
• Rotor azimuth
• Generator speed
• Flapwise and edgewise blade root strain gauges (conventional type)
• Fore-aft nacelle acceleration
• Pitch angles
The following additional sensors were also used in evaluating the field test results: • Wind speed and direction at hub height on nearby met mast
• Tower base bending strain gauges in two directions: E/W and N/S
• Nacelle yaw position
• Teeter angle
• Generator power
A number of internal controller variables were also logged, including the switching variable, which defines whether the IPC and FATD features are active. Controller adjustments The new control algorithm designed for CART2 included the following control features: 1. Drivetrain damper.
2. Speed regulation by torque (below rated).
3. Speed regulation by collective pitch (above rated).
4. Interaction between loops 2 and 3 around rated.
5. Fore-aft tower damping by collective pitch.
6. 1P individual pitch control using blade root strain gauges.

7
Features 5 and (more especially) 6 were the focus of the field tests. The performance of features 2, 3, and 4 was not quantified, but these were observed to work very well from the start, and required no adjustment. The design of the drivetrain damper (feature 1) depends on precise knowledge of the drivetrain dynamics and power converter control, for which the necessary level of detail was not available. The damper was designed to use generator speed as its input, but it was found that the filtered rotor speed was found to work better, and gave satisfactory performance. No attempt was made to analyze or optimize this feature since its problems are well understood and were not the focus of this exercise. The advanced features 5 and 6 would normally be phased out in low winds, since the already low loading levels do not justify the additional pitch action required to reduce them further. For these tests however, these features were enabled at all wind speeds to maximize the amount of useful data obtained. First results All recorded datasets were 10 minutes in length. Headers were created to allow each dataset to be plotted and post-processed using Bladed. Figure 2 plots four variables from dataset 02050340 measured on 4th February 2010 (at 8:40 p.m. Mountain Standard Time [MST]), just to illustrate the entirely satisfactory operation of the speed regulation below and above rated.
Figure 2. Speed regulation around rated
When the tower feedback feature was switched on, a problem was immediately apparent. The acceleration signal had a large mean offset (which is clearly not physical
0
100
200
300
400
500
600
0 100 200 300 400 500 600
Time [s]
468
10121416182022
0 100 200 300 400 500 600
Time [s]
28
30
32
34
36
38
40
42
44
0 100 200 300 400 500 600
Time [s]
-202468
10121416
0 100 200 300 400 500 600
Wind speed, m/s
Rotor speed, rpm
Power, kW
Pitch, deg

8
if the turbine is staying in the same place). The integrator in the FATD algorithm was then causing the pitch angle to drift away, causing loss of power. If the pitch drifted to negative angles, the blades would stall and the IPC would work poorly, as predicted by simulations. The problem is illustrated in Figure 3 (part of dataset 01240204 from 3rd February 2010, measured at 7:04 p.m. MST). This problem was very easily fixed by passing the acceleration signal through a 0.1 Hz high pass filter. This removed the offset with little effect on the phase of the remaining signal. After this change, both the IPC and FATD were found to work well, as the subsequent results illustrate.
Figure 3. Effect of acceleration offset
Analysis of individual campaigns First, some time series results are presented, comparing two datasets with similar wind conditions, both measured on 4th February 2010; dataset 02050253 with IPC and FATD switched ‘OFF’, and dataset 02050317 with both features switched ‘ON’ (Figure 4). Clearly the wind speed is not identical in the two cases, and is dropping off towards the end in case ‘ON’. Fine pitch is reached (-1º) and the speed and power start to fall. The individual pitch action is clearly visible. The load reduction in the ‘ON’ case is not immediately obvious in the time histories. To assess this, Bladed post-processing was used to resolve the flapwise and edgewise bending moments, with pitch angle to give the out of plane moment, and the N/S and E/W tower base bending moments with yaw position to give the fore-aft moment (the yaw position signal was very noisy and first had to be cleaned up by removing spikes and filtering). Furthermore, the blade root My signals were combined to give the rotating hub My (ignoring the small additional moment due to differences in blade root Fx force). They were also transformed to stationary coordinates using the azimuth position, to give the hub fixed My and Mz
200 220 240 260 280 300
-6
-5
-4
-3
-2
Seconds
deg,
deg
Blade 1 and Blade 2 pitch angles
200 220 240 260 280 300-4.5
-4
-3.5
-3
-2.5
-2
-1.5
Seconds
mps
2
Nacelle x-acceleration signal

9
(ignoring any possible differences in blade Mz pitch moment). Spectra of these signals then immediately reveal the expected changes in loading. Although the ‘ON’ case has a lower mean wind speed, it has significantly higher turbulence intensity, as shown in Table 3. Two more cases have, therefore, also been included in the subsequent analysis. These were selected to have similar wind speeds and turbulence intensities, but in this case slightly lower values in the ‘ON’ case. The characteristics of these datasets are also seen in Table 3. The table also includes an estimate of the wind shear, obtained as an approximate fit to the mean wind speeds measured at the four anemometer heights on the met mast: 3, 15, 36.6 and 58.2m.

10
Figure 4. First results with and without IPC and FATD: 600s datasets near rated
OFF (02050253) ON (02050317)
Win
dspe
ed 3
6.6m
[m
/s]
810121416182022242628
Rot
or s
peed
[rpm
]
35
36
37
38
39
40
41
42
43
Pow
er o
utpu
t[k
W]
300
400
500
600
OFF ON (Blade 1) ON (Blade 2)
Pitc
h [d
eg]
-5
-10
0
5
10
15
20
Bla
de 1
Fla
p B
endi
ng [kN
m]
0
100
200
300
400
500
600
0 100 200 300 400 500 600
Tow
er B
endi
ng E
/W [
kNm
]
-1000
0
1000
2000
3000
4000
0 100 200 300 400 500 600

11
Table 3. Sample datasets for comparison
Dataset
Mean wind direction
(deg)
Mean wind speed (m/s)
Standard deviation
(m/s)
Turbulence intensity (%)
Estimated shear
exponent
02050253 (OFF)
(7:53 p.m. MST) 276.698 16.3807 2.61317 15.95 .09
02050317 (ON)
(8:17 p.m. MST) 284.246 15.481 2.85928 18.47 .14
02050340 (OFF)
(8:40 p.m. MST) 289.563 12.4217 2.67643 21.55 .13
02020007 (ON)
(5:07 p.m. MST) 277.872 12.0926 2.50302 20.70 .08
Looking first at the tower damping, Figure 5 shows the spectrum of tower base fore-aft bending moment for these four cases, with the thicker lines representing the two ‘ON’ cases. A clear reduction is seen on both ‘ON’ cases at the first tower frequency, around 0.9 Hz, confirming that the damping algorithm is working as intended. The low frequency levels are more variable, lower in one ‘ON’ case and higher in the other. This is simply caused by the range of the wind speed variations during the sample, not by the controller dynamics (more below rated dips occurred in the first ‘ON’ case). Since the maximum thrust occurs at rated, this gave rise to more periods of higher mean thrust in this case, as is clearly shown in Figure 4. For the 12 m/s cases, the ‘OFF’ case suffered from bigger wind speed dips down to 6 m/s, compared to 8 m/s for the ‘ON’ case.

12
Figure 5. Tower base moment: two comparisons with measured data (top) and a comparable simulation result (bottom). Units: (Nm)2/Hz
Turning to the IPC performance, Figure 6 compares the spectra of blade root out of plane bending moment. The low frequency changes occur for exactly the same reason as for the tower base moment, and the complete removal of the 1P peak at 0.7 Hz is exactly as predicted in simulations, confirming that the IPC is working perfectly as intended.
02050253 OFF16.38m/s 15.95%TI
02050317 ON15.48m/s 18.47%TI
Frequency [Hz]
5.0e+11
1.0e+08
1.0e+09
1.0e+10
1.0e+11
0.0 0.5 1.0 1.5 2.0 2.5 3.0 3.5 4.0 4.5 5.0
02050340 OFF12.42m/s 21.55%TI
02020007 ON12.09m/s 20.70%TI
Frequency [Hz]
9.0e+11
1.0e+08
1.0e+09
1.0e+10
1.0e+11
0.0 0.5 1.0 1.5 2.0 2.5 3.0 3.5 4.0 4.5 5.0
Simulation, 15 m/s, 20% turbulenceOFF ON
Frequency [1/s]
1.0e+09
1.0e+10
1.0e+11
1.0e+12
0.0 0.5 1.0 1.5 2.0 2.5 3.0 3.5 4.0 4.5 5.0

13
Figure 6. Blade root My moment: two comparisons with measured data (top) and a comparable simulation result (bottom). Units: (Nm)2/Hz
02050253 OFF16.38m/s 15.95%TI
02050317 ON15.48m/s 18.47%TI
Frequency [Hz]
1.0e+07
5.0e+09
1.0e+08
1.0e+09
0.0 0.5 1.0 1.5 2.0 2.5 3.0 3.5 4.0 4.5 5.0
02050340 OFF12.42m/s 21.55%TI
02020007 ON12.09m/s 20.70%TI
Frequency [Hz]
1.0e+07
5.0e+09
1.0e+08
1.0e+09
0.0 0.5 1.0 1.5 2.0 2.5 3.0 3.5 4.0 4.5 5.0
Simulation, 15 m/s, 20% turbulenceOFF ON
Frequency [1/s]
5.0e+07
3.0e+10
1.0e+08
1.0e+09
1.0e+10
0.0 0.5 1.0 1.5 2.0 2.5 3.0 3.5 4.0 4.5 5.0
14
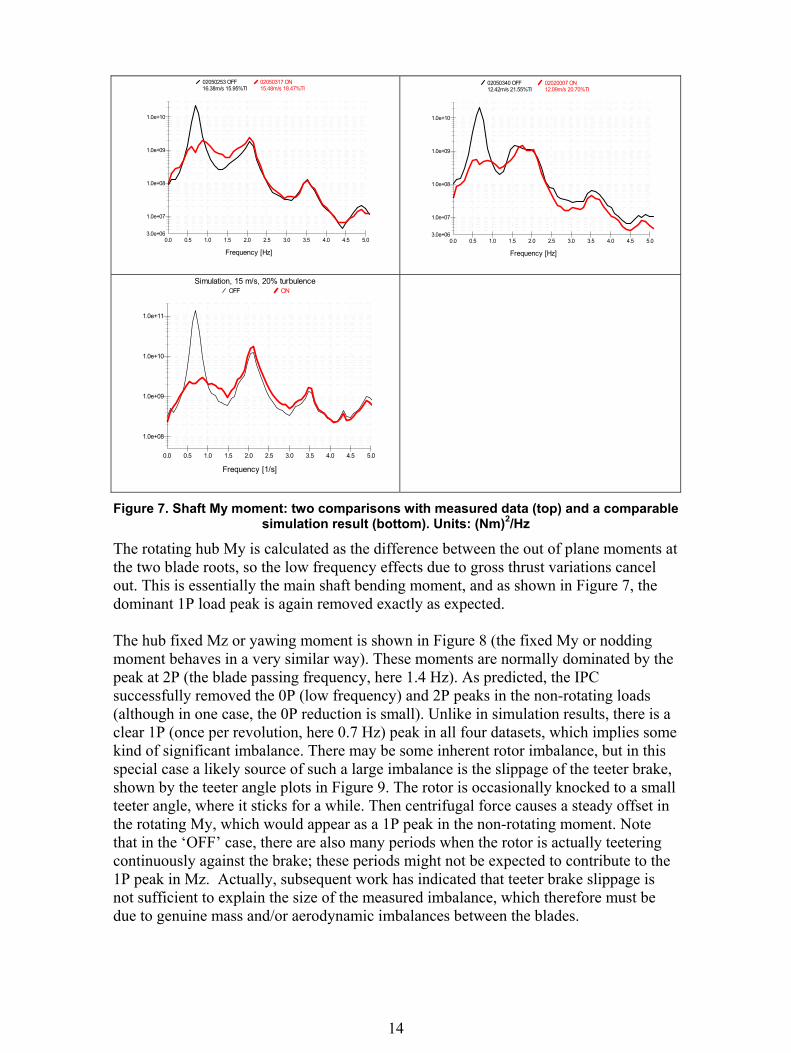
Figure 7. Shaft My moment: two comparisons with measured data (top) and a comparable simulation result (bottom). Units: (Nm)2/Hz
The rotating hub My is calculated as the difference between the out of plane moments at the two blade roots, so the low frequency effects due to gross thrust variations cancel out. This is essentially the main shaft bending moment, and as shown in Figure 7, the dominant 1P load peak is again removed exactly as expected. The hub fixed Mz or yawing moment is shown in Figure 8 (the fixed My or nodding moment behaves in a very similar way). These moments are normally dominated by the peak at 2P (the blade passing frequency, here 1.4 Hz). As predicted, the IPC successfully removed the 0P (low frequency) and 2P peaks in the non-rotating loads (although in one case, the 0P reduction is small). Unlike in simulation results, there is a clear 1P (once per revolution, here 0.7 Hz) peak in all four datasets, which implies some kind of significant imbalance. There may be some inherent rotor imbalance, but in this special case a likely source of such a large imbalance is the slippage of the teeter brake, shown by the teeter angle plots in Figure 9. The rotor is occasionally knocked to a small teeter angle, where it sticks for a while. Then centrifugal force causes a steady offset in the rotating My, which would appear as a 1P peak in the non-rotating moment. Note that in the ‘OFF’ case, there are also many periods when the rotor is actually teetering continuously against the brake; these periods might not be expected to contribute to the 1P peak in Mz. Actually, subsequent work has indicated that teeter brake slippage is not sufficient to explain the size of the measured imbalance, which therefore must be due to genuine mass and/or aerodynamic imbalances between the blades.
02050253 OFF16.38m/s 15.95%TI
02050317 ON15.48m/s 18.47%TI
Frequency [Hz]
3.0e+06
1.0e+07
1.0e+08
1.0e+09
1.0e+10
0.0 0.5 1.0 1.5 2.0 2.5 3.0 3.5 4.0 4.5 5.0
02050340 OFF12.42m/s 21.55%TI
02020007 ON12.09m/s 20.70%TI
Frequency [Hz]
3.0e+06
1.0e+07
1.0e+08
1.0e+09
1.0e+10
0.0 0.5 1.0 1.5 2.0 2.5 3.0 3.5 4.0 4.5 5.0
Simulation, 15 m/s, 20% turbulenceOFF ON
Frequency [1/s]
1.0e+08
1.0e+09
1.0e+10
1.0e+11
0.0 0.5 1.0 1.5 2.0 2.5 3.0 3.5 4.0 4.5 5.0

15
The IPC is of course achieved at the cost of additional 1P Pitch activity. As Figure 10 shows, this is entirely concentrated at 1P, again agreeing well with simulations. Some short sample time histories of pitch rate are shown in Figure 11. The 1P pitch activity is clearly seen on the ON case. There is also some high frequency noise in both cases.
Figure 8. Hub fixed Mz (yaw) moment: two comparisons with measured data (top) and a comparable simulation result (bottom). Units: (Nm)2/Hz
02050253 OFF16.38m/s 15.95%TI
02050317 ON15.48m/s 18.47%TI
Frequency [Hz]
3.0e+06
6.0e+09
1.0e+07
1.0e+08
1.0e+09
0.0 0.5 1.0 1.5 2.0 2.5 3.0 3.5 4.0 4.5 5.0
02050340 OFF12.42m/s 21.55%TI
02020007 ON12.09m/s 20.70%TI
Frequency [Hz]
3.0e+06
5.0e+09
1.0e+07
1.0e+08
1.0e+09
0.0 0.5 1.0 1.5 2.0 2.5 3.0 3.5 4.0 4.5 5.0
Simulation, 15 m/s, 20% turbulenceOFF ON
Frequency [1/s]
2.0e+07
3.0e+10
1.0e+08
1.0e+09
1.0e+10
0.0 0.5 1.0 1.5 2.0 2.5 3.0 3.5 4.0 4.5 5.0
Figure 9. Teeter angles (deg): two comparisons with measured data
02050253 OFF16.38m/s 15.95%TI
02050317 ON15.48m/s 18.47%TI
Time [s]
-0.5
-1.0
-1.5
0.0
0.5
1.0
1.5
2.0
0 100 200 300 400 500 600
02050340 OFF12.42m/s 21.55%TI
02020007 ON12.09m/s 20.70%TI
Time [s]
-0.5
-1.0
-1.5
-2.0
-2.5
0.0
0.5
1.0
1.5
2.0
2.5
0 100 200 300 400 500 600

16
Figure 10. Pitch rate spectra: two comparisons with measured data (top) and a comparable simulation result (bottom). Units: (rad/s)2/Hz
Figure 11. Sample time histories of pitch rate for OFF (left) and ON (right) cases in comparable wind conditions
Below rated, both IPC and FATD cause the pitch to be constantly moving with respect to the optimum ‘fine pitch’ value, which in principle should cause a small loss of power output. However, simulations have shown any such loss is very small. Since the wind is different for each dataset, it would be very difficult to confirm this from the data in Figure 4 for example. However, this is addressed further in the next section. Aggregated data analysis The above results are for just two pair of 10-minute datasets; one without and one with IPC and FATD, chosen because they have similar wind speeds. This demonstrates fairly conclusively that these load reducing features work well, confirming previous
Pitch rate: 02050340 OFF
deg/
s
Time [s]
-5
-10
-15
-20
0
5
10
15
20
30 35 40 45 50 55 60
Pitch rate: 02020007 ON
deg/
s
Time [s]
-5
-10
-15
-20
0
5
10
15
20
30 35 40 45 50 55 60
02050253 OFF16.38m/s 15.95%TI
02050317 ON15.48m/s 18.47%TI
Frequency [Hz]
0.02
0.1
1
10
100
0.0 0.5 1.0 1.5 2.0 2.5 3.0 3.5 4.0 4.5 5.0
02050340 OFF12.42m/s 21.55%TI
02020007 ON12.09m/s 20.70%TI
Frequency [Hz]
0.02
70
0.1
1
10
0.0 0.5 1.0 1.5 2.0 2.5 3.0 3.5 4.0 4.5 5.0
Simulation, 15 m/s, 20% turbulenceOFF ON
Frequency [1/s]
0.00001
0.06
0.0001
0.001
0.01
0.0 0.5 1.0 1.5 2.0 2.5 3.0 3.5 4.0 4.5 5.0
17
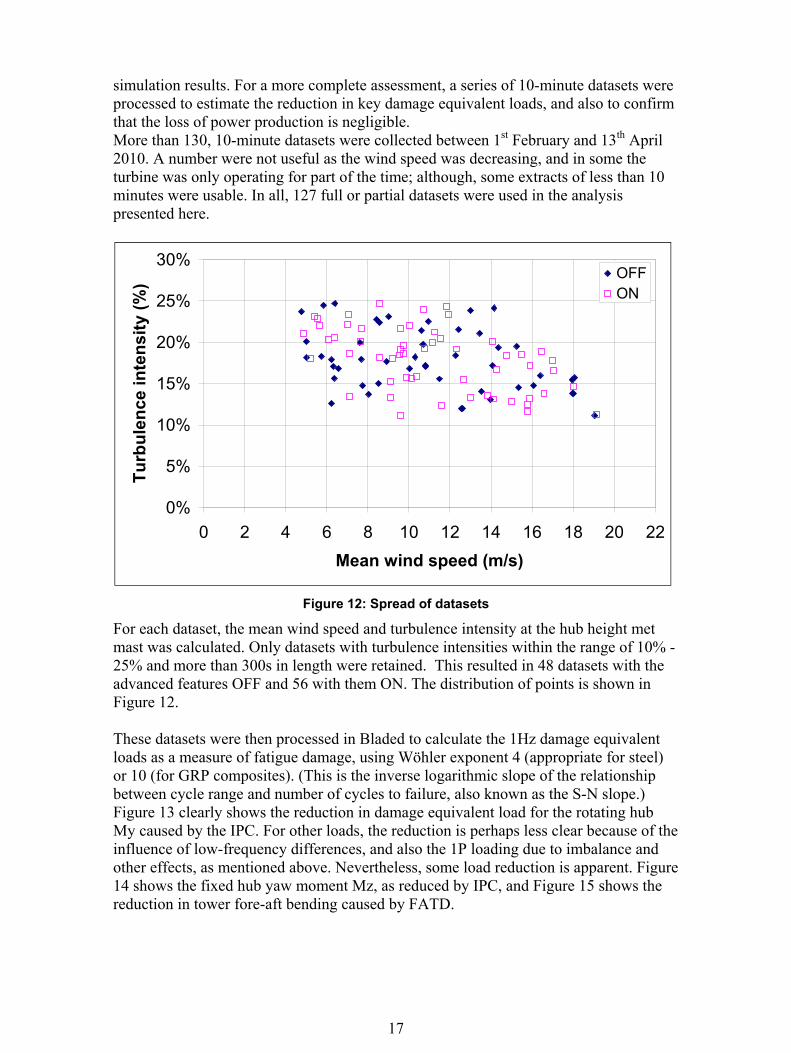
simulation results. For a more complete assessment, a series of 10-minute datasets were processed to estimate the reduction in key damage equivalent loads, and also to confirm that the loss of power production is negligible. More than 130, 10-minute datasets were collected between 1st February and 13th April 2010. A number were not useful as the wind speed was decreasing, and in some the turbine was only operating for part of the time; although, some extracts of less than 10 minutes were usable. In all, 127 full or partial datasets were used in the analysis presented here.
Figure 12: Spread of datasets
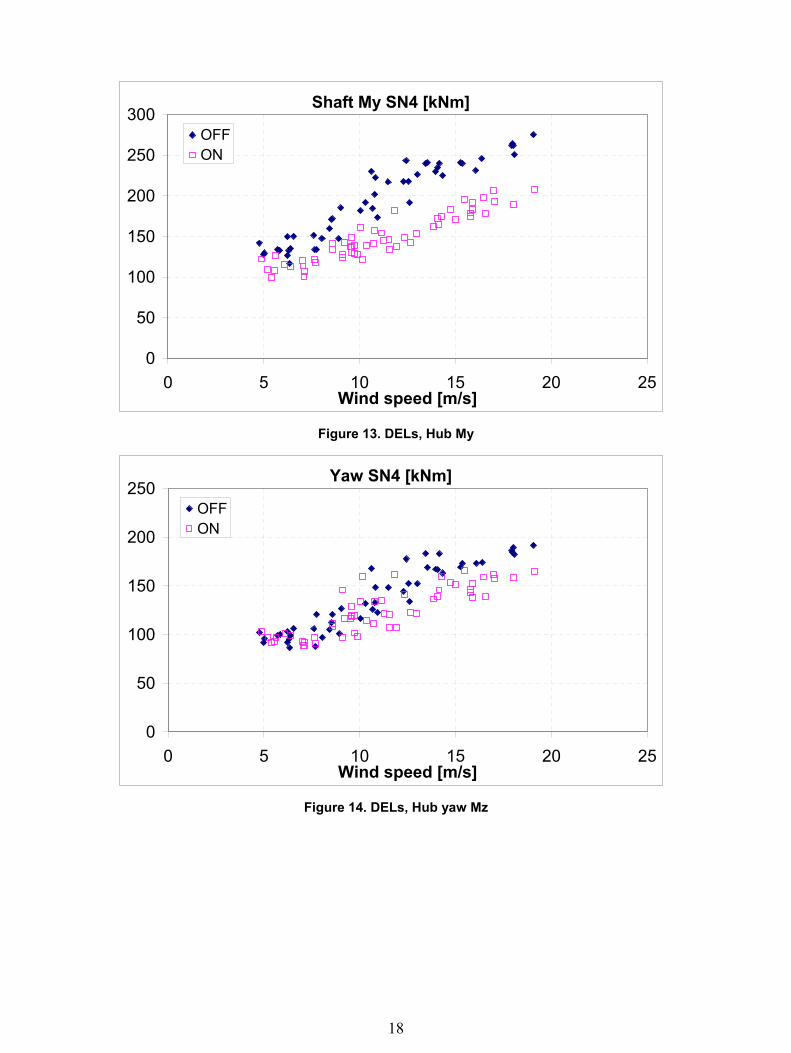
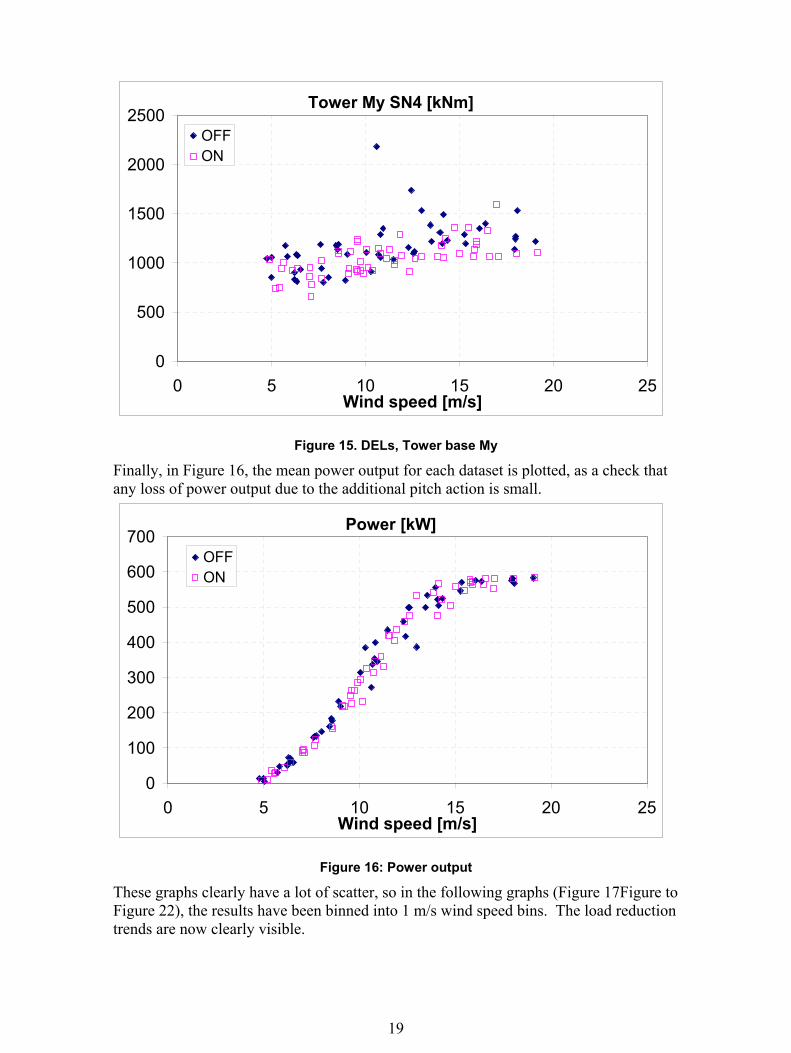
For each dataset, the mean wind speed and turbulence intensity at the hub height met mast was calculated. Only datasets with turbulence intensities within the range of 10% - 25% and more than 300s in length were retained. This resulted in 48 datasets with the advanced features OFF and 56 with them ON. The distribution of points is shown in Figure 12. These datasets were then processed in Bladed to calculate the 1Hz damage equivalent loads as a measure of fatigue damage, using Wöhler exponent 4 (appropriate for steel) or 10 (for GRP composites). (This is the inverse logarithmic slope of the relationship between cycle range and number of cycles to failure, also known as the S-N slope.) Figure 13 clearly shows the reduction in damage equivalent load for the rotating hub My caused by the IPC. For other loads, the reduction is perhaps less clear because of the influence of low-frequency differences, and also the 1P loading due to imbalance and other effects, as mentioned above. Nevertheless, some load reduction is apparent. Figure 14 shows the fixed hub yaw moment Mz, as reduced by IPC, and Figure 15 shows the reduction in tower fore-aft bending caused by FATD.
0%
5%
10%
15%
20%
25%
30%
0 2 4 6 8 10 12 14 16 18 20 22
Mean wind speed (m/s)
Tu
rbu
len
ce in
ten
sity
(%
)
OFFON
18
Figure 13. DELs, Hub My
Figure 14. DELs, Hub yaw Mz
Shaft My SN4 [kNm]
0
50
100
150
200
250
300
0 5 10 15 20 25Wind speed [m/s]
OFFON
Yaw SN4 [kNm]
0
50
100
150
200
250
0 5 10 15 20 25Wind speed [m/s]
OFFON
19
Figure 15. DELs, Tower base My
Finally, in Figure 16, the mean power output for each dataset is plotted, as a check that any loss of power output due to the additional pitch action is small.
Figure 16: Power output
These graphs clearly have a lot of scatter, so in the following graphs (Figure 17Figure to Figure 22), the results have been binned into 1 m/s wind speed bins. The load reduction trends are now clearly visible.
Tower My SN4 [kNm]
0
500
1000
1500
2000
2500
0 5 10 15 20 25Wind speed [m/s]
OFFON
Power [kW]
0
100
200
300
400
500
600
700
0 5 10 15 20 25Wind speed [m/s]
OFFON

20
The number of points in some of the individual bins is too small to allow any measure of statistical significance to be stated. Wider bins would be needed to encompass more points, but some form of normalization is needed to allow bins to be aggregated. The mean percentage damage equivalent load reductions for all eight bins above 12 m/s are shown in Table 4. This comparison includes 20 ‘OFF’ points and 20 ‘ON’ points. The reductions in shaft My and yaw Mz are particularly consistent, with a mean reduction of more than 6 standard deviations.
Figure 17. Blade root My DEL (steel)
4 6 8 10 12 14 16 18 2080
100
120
140
160
180
200
220Bin averages (showing number of points)
Mean wind speed [m/s]
Bla
de M
y S
N4 [k
Nm
]
2 3 6 3
5
1
7
1
4
43 2
2 2
2
1
1 42 6
2 10
5
63
1
46
3
1 11
OFF ON

21
Figure 18. Blade root My DEL (GRP)
Figure 19. Shaft My DEL (steel)
4 6 8 10 12 14 16 18 20100
150
200
250
300
350
400Bin averages (showing number of points)
Mean wind speed [m/s]
Bla
de
My
SN
10
[kN
m],
2 3 6
3
5
17 1
4
43 2 2 2
2
1
1 42 6
2
105
6 3 1
46
3
1 1
1
OFF ON
4 6 8 10 12 14 16 18 20100
120
140
160
180
200
220
240
260
280Bin averages (showing number of points)
Mean wind speed [m/s]
Shaft
My
SN
4 [k
Nm
]
2 3 6 3
5
17
1 4
4 32 2
22
1
14 2 6
2 105
6 31
46
31 1
1
OFF ON

22
Figure 20. My Nod moment DEL (steel)
Figure 21. Mz Yaw moment DEL (steel)
4 6 8 10 12 14 16 18 2080
100
120
140
160
180
200Bin averages (showing number of points)
Mean wind speed [m/s]
Nod S
N4 [k
Nm
]
2 3 6
3 5
1
7
1
44 3 2 2 2
2
1
1
4 26
210
56 3
1
4 631 1
1
OFF ON
4 6 8 10 12 14 16 18 2080
100
120
140
160
180
200Bin averages (showing number of points)
Mean wind speed [m/s]
Yaw
SN
4 [k
Nm
]
2 3 63 5
17
14
4 3 2 2
221
14
26
210
56 3
1
4 631 1
1
OFF ON

23
Figure 22. Tower My DEL (steel)
Table 4. Load reductions averaged over the eight bins above 12 m/s
Mean load reduction
Range Standard deviation
Blade root My, steel 9.4% -1.3 to 17.2% 5.9%
Blade root My, GRP 7.3% -7.4 to 18.3% 7.7%
Shaft My, steel 26.0% 18.5 to 32.0% 4.1%
Nod My, steel 10.0% 4.8 to 18.1% 5.2%
Yaw Mz, steel 14.4% 11.6 to 18.3% 2.1%
Tower My, steel 12.6% 3.5 to 22.2% 7.8%
Figure 23 shows that there is no loss of output above rated – in fact the power seems to be slightly increased in the 12-14 m/s region. In lower winds, there is evidence of a slight decrease in power; but in the normal situation, the IPC would be phased out in low winds anyway, as the loads are lower and the additional pitch action would not be justified.
4 6 8 10 12 14 16 18 20800
900
1000
1100
1200
1300
1400Bin averages (showing number of points)
Mean wind speed [m/s]
Tow
er M
y S
N4 [k
Nm
]
2
3
63
5
1
7
1
4
4
3
2
2
2
2
1
1
4
2
6
2
105
6
3
1
46
3
11 1
OFF ON

24
Figure 23: Power output
Conclusions
The data collected from the CART2 field tests clearly shows that both the individual pitch control and the fore-aft tower damping algorithms work as expected, and that the load reductions predicted by simulations can be realised in practice, without significant loss of energy output. The fact that no adjustments of any significance needed to be made to the algorithms or parameter values confirms that these controller features are robust, and should provide the confidence required by turbine designers to be able to use these techniques as an integral part of turbine design in future. Future work includes testing these algorithms on the 3-bladed Controls Advanced Research Turbine to further validate these control approaches for load reduction.
4 6 8 10 12 14 16 18 200
100
200
300
400
500
600Bin averages (showing number of points)
Mean wind speed [m/s]
Po
we
r [k
W]
2 36
3
51
7
14
43
2 2 22 1
14
2
6
2
10
5
6
3
14
6 31 1 1 OFF ON

25
References 1. Developments in Individual Blade Pitch Control, E Bossanyi, “The Science of
making Torque from Wind” Delft University of Technology, The Netherlands, April 19-21 2004.
2. Field testing of individual pitch control on the NREL CART-2 wind turbine, E. Bossanyi, A. Wright, proc. European Wind Energy Conference 2009.
3. Further progress with field testing of individual pitch control, E. Bossanyi, A. Wright and P. Fleming, proc. European Wind Energy Conference 2010.
4. Progress with field testing of individual pitch control, E. Bossanyi, A. Wright and P. Fleming, proc. Conference on the science of making torque from wind, The European Academy of Wind Energy, June 2010.
5. Controller field tests on the NREL CART2 turbine, E. Bossanyi, A. Wright and P. Fleming, UPWIND report 11593/BR/08, 22nd June 2010, available at http://www.upwind.eu/Shared%20Documents/WP5%20-%20Publications/D%205.6.1.pdf.
6. Damping of tower motions via pitch control – theory and practice, M. Rossetti, E. Bossanyi, proc. European Wind Energy Conference 2004.
7. Geometry and Structural Properties for the Controls Advanced Research Turbine (CART) from Model Tuning, August 25, 2003–November 30, 2003, K A Stol, NREL/SR-500-32087, http://www.nrel.gov/docs/fy04osti/32087.pdf
8. Wind Turbine Control for Load Reduction, E Bossanyi, Wind Energy 2003 vol 6 pp 229-244.
9. A state-of-the-art controller for the 5MW UPWIND reference wind turbine, E. Bossanyi and D Witcher, Proceedings of European Wind Energy Conference 2009.
10. Controller for 5MW reference turbine, E Bossanyi and D Witcher, Upwind Work Package 5 deliverable report 11593/BR/04, 10th July 2009, http://www.upwind.eu/Shared%20Documents/WP5%20-%20Publications/D%205.1.1.%20Controller%20for%205MW%20reference%20turbine.pdf
26
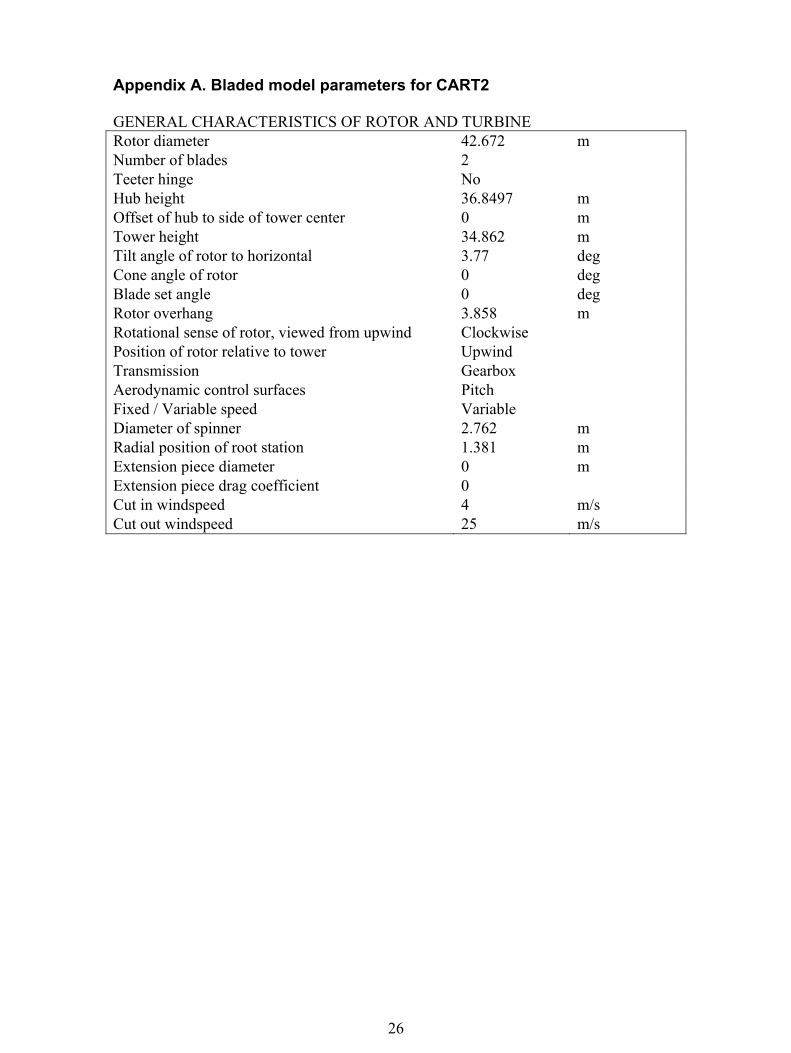
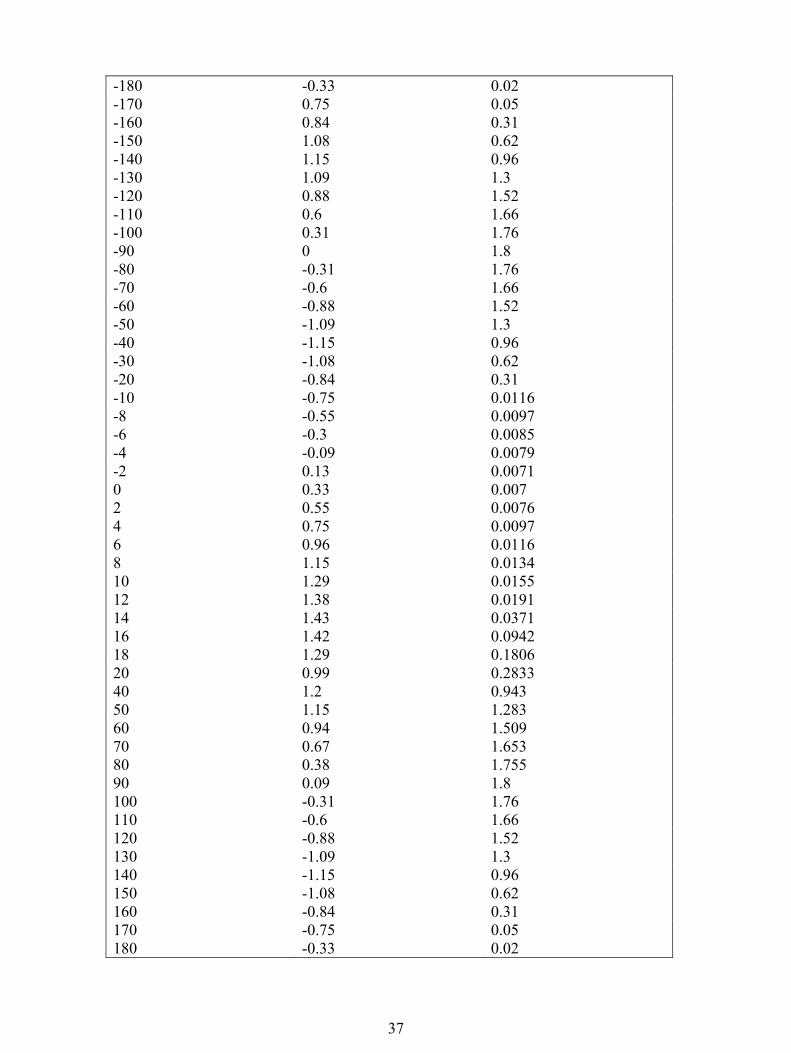
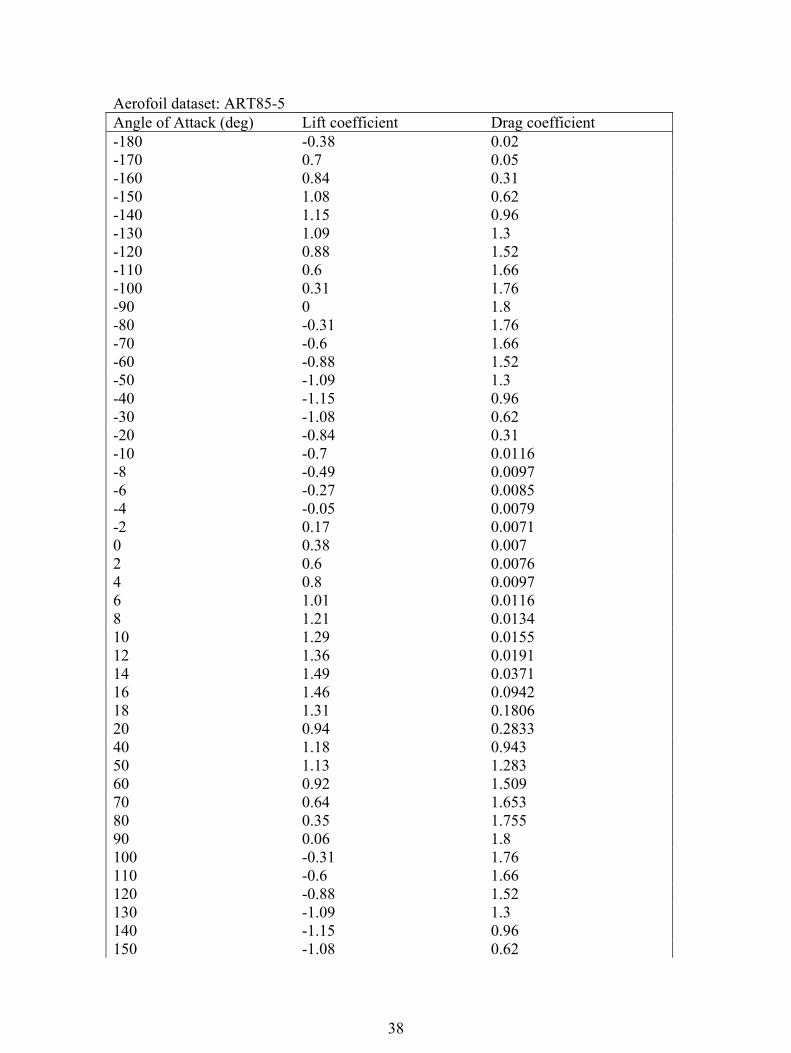
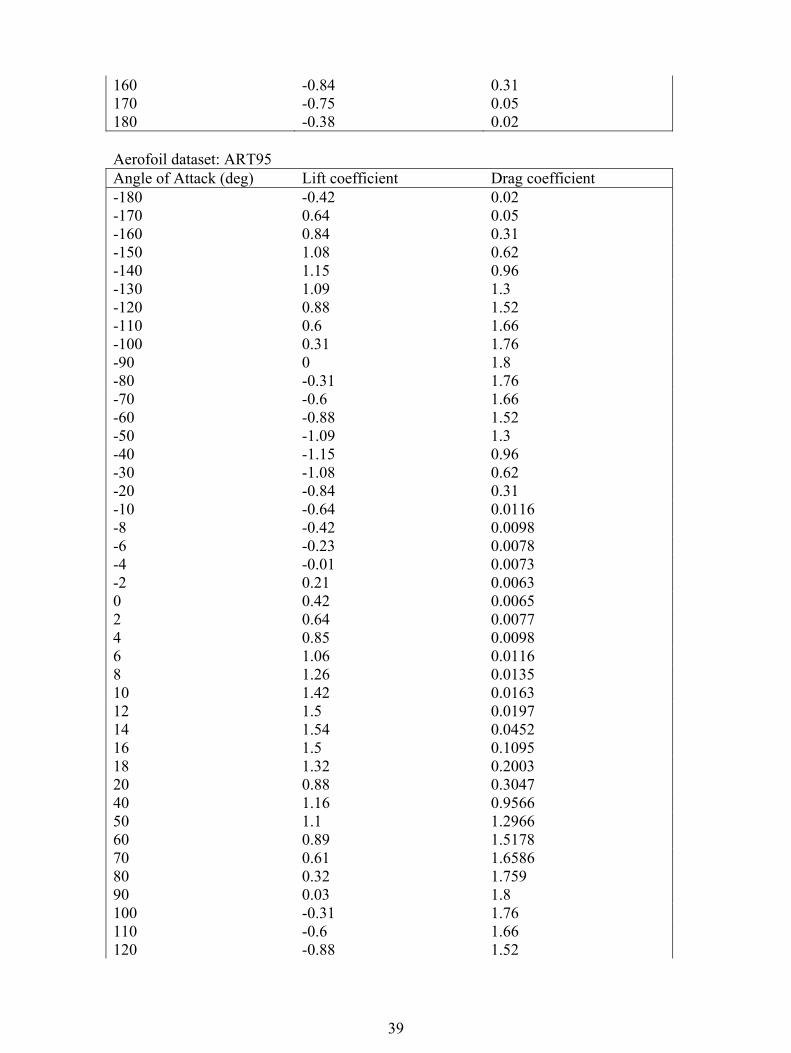
Appendix A. Bladed model parameters for CART2 GENERAL CHARACTERISTICS OF ROTOR AND TURBINE Rotor diameter 42.672 m Number of blades 2 Teeter hinge No Hub height 36.8497 m Offset of hub to side of tower center 0 m Tower height 34.862 m Tilt angle of rotor to horizontal 3.77 deg Cone angle of rotor 0 deg Blade set angle 0 deg Rotor overhang 3.858 m Rotational sense of rotor, viewed from upwind Clockwise Position of rotor relative to tower Upwind Transmission Gearbox Aerodynamic control surfaces Pitch Fixed / Variable speed Variable Diameter of spinner 2.762 m Radial position of root station 1.381 m Extension piece diameter 0 m Extension piece drag coefficient 0 Cut in windspeed 4 m/s Cut out windspeed 25 m/s

27
BLADE GEOMETRY Blade length 19.955 m Pre-bend at tip 0 m Pitch control Full span
Distance from root (m)
Chord (m)
Twist (deg)
Twist Axis (% chord)
Thickness (% chord)
Pitch Axis (% chord)
Pre-bend (m)
Aero-dynamic control
Aerofoil section reference
0 1.1929
3.44 50 0 50 0 Pitchable
ART15
0.439 1.1929
3.37 50 0 50 0 Pitchable
ART15
1.0576 1.2689
3.27 49 0 49 0 Pitchable
ART15
1.4967 1.3286
3.2015 47.5 0 47.5 0 Pitchable
ART15
2.2749 1.4058
3.08 45 0 45 0 Pitchable
ART15
2.4944 1.4276
3.0439 44 0 44 0 Pitchable
ART15
3.4921 1.5637
2.88 42.5 0 42.5 0 Pitchable
ART15
4.4899 1.6633
2.7243 40 0 40 0 Pitchable
ART25
4.7094 1.662 2.69 39.5 0 39.5 0 Pitchable
ART25
5.4876 1.6575
2.5414 38.5 0 38.5 0 Pitchable
ART25
6.4853 1.6163
2.354 37.5 0 37.5 0 Pitchable
ART35
7.2636 1.5689
2.21 37.5 0 37.5 0 Pitchable
ART35
7.4831 1.5555
2.1576 37.5 0 37.5 0 Pitchable
ART35
8.4808 1.5017
1.9195 37.5 0 37.5 0 Pitchable
ART45
9.479 1.4274
1.685 37.5 0 37.5 0 Pitchable
ART45
10.476 1.3735
1.4135 37.5 0 37.5 0 Pitchable
ART55
11.075 1.3294
1.24 37.5 0 37.5 0 Pitchable
ART55
11.474 1.3 1.1194 37.5 0 37.5 0 Pitchable
ART55

28
12.472 1.2461
0.80753 37.5 0 37.5 0 Pitchable
ART65
13.47 1.1718
0.43251 37.5 0 37.5 0 Pitchable
ART65
14.467 1.1179
0.045585
37.5 0 37.5 0 Pitchable
ART75
14.866 1.0885
-0.11 37.5 0 37.5 0 Pitchable
ART75
15.465 1.0444
-0.41931 37.5 0 37.5 0 Pitchable
ART75
16.463 0.9906
-0.93496 37.5 0 37.5 0 Pitchable
ART75-5
17.461 0.9171
-1.4598 37.5 0 37.5 0 Pitchable
ART85
18.458 0.8626
-2.2058 37.5 0 37.5 0 Pitchable
ART85-5
19.456 0.7889
-2.9428 37.5 0 37.5 0 Pitchable
ART95
19.955 0.7889
-3.31 37.5 0 37.5 0 Pitchable
ART95
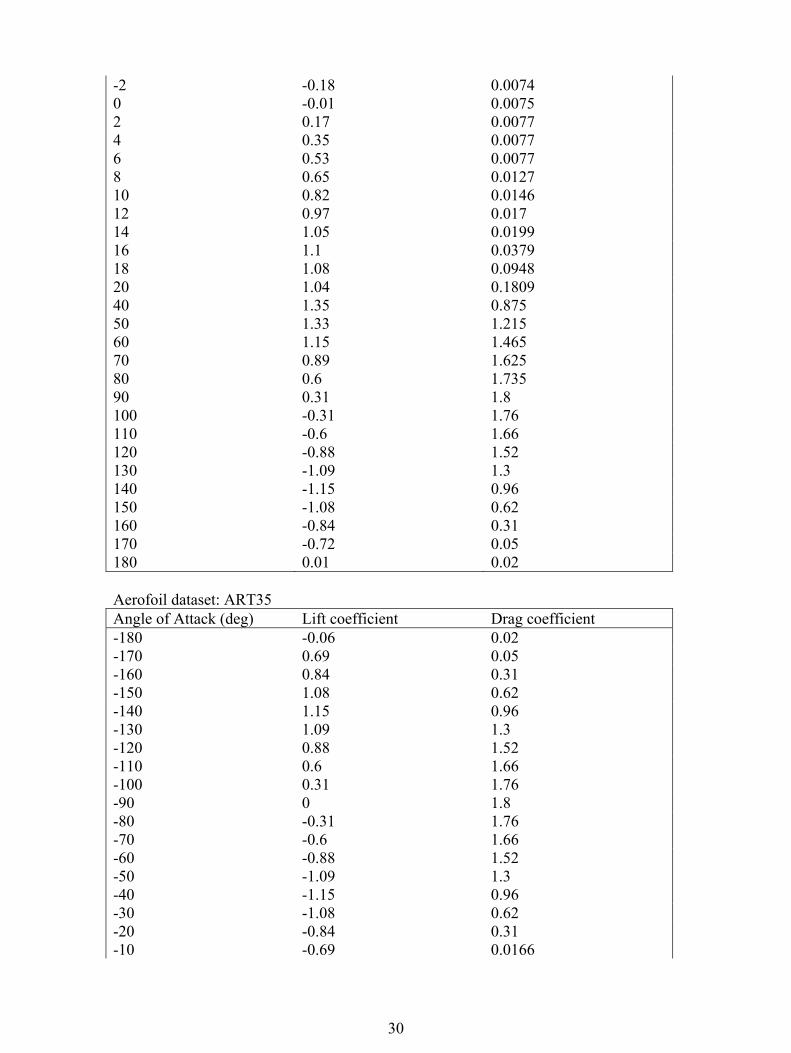
AEROFOIL DATA Aerofoil dataset: ART15 Angle of Attack (deg) Lift coefficient Drag coefficient -180 0 0.7384 -170 0.32 0.7409 -160 0.44 0.7961 -150 0.49 0.9 -140 0.54 1.0676 -130 0.53 1.1992 -120 0.46 1.2983 -110 0.36 1.3618 -100 0.25 1.4052 -90 0 1.4439 -80 -0.25 1.4052 -70 -0.36 1.3618 -60 -0.46 1.2983 -50 -0.53 1.1992 -40 -0.54 1.0676 -30 -0.5 0.9 -20 -0.44 0.7961 -10 -0.32 0.7417 -8 -0.26 0.7409 -6 -0.19 0.7403 -4 -0.13 0.7389 -2 -0.06 0.7383 0 0.01 0.7384 2 0.07 0.7384

29
4 0.14 0.7384 6 0.21 0.7385 8 0.26 0.7402 10 0.32 0.7409 12 0.39 0.7417 14 0.43 0.7428 16 0.45 0.7463 18 0.46 0.7649 20 0.44 0.7961 40 0.54 1.0676 50 0.53 1.1992 60 0.46 1.2983 70 0.36 1.3618 80 0.25 1.4052 90 0 1.4439 100 -0.25 1.4052 110 -0.36 1.3618 120 -0.46 1.2983 130 -0.53 1.1992 140 -0.54 1.0676 150 -0.49 0.9 160 -0.44 0.7961 170 -0.32 0.7409 180 0 0.7384 Aerofoil dataset: ART25 Angle of Attack (deg) Lift coefficient Drag coefficient -180 0.01 0.02 -170 0.72 0.05 -160 0.84 0.31 -150 1.08 0.62 -140 1.15 0.96 -130 1.09 1.3 -120 0.88 1.52 -110 0.6 1.66 -100 0.31 1.76 -90 0 1.8 -80 -0.31 1.76 -70 -0.6 1.66 -60 -0.88 1.52 -50 -1.09 1.3 -40 -1.15 0.96 -30 -1.08 0.62 -20 -0.84 0.31 -10 -0.72 0.017 -8 -0.6 0.0146 -6 -0.54 0.0127 -4 -0.36 0.0086
30
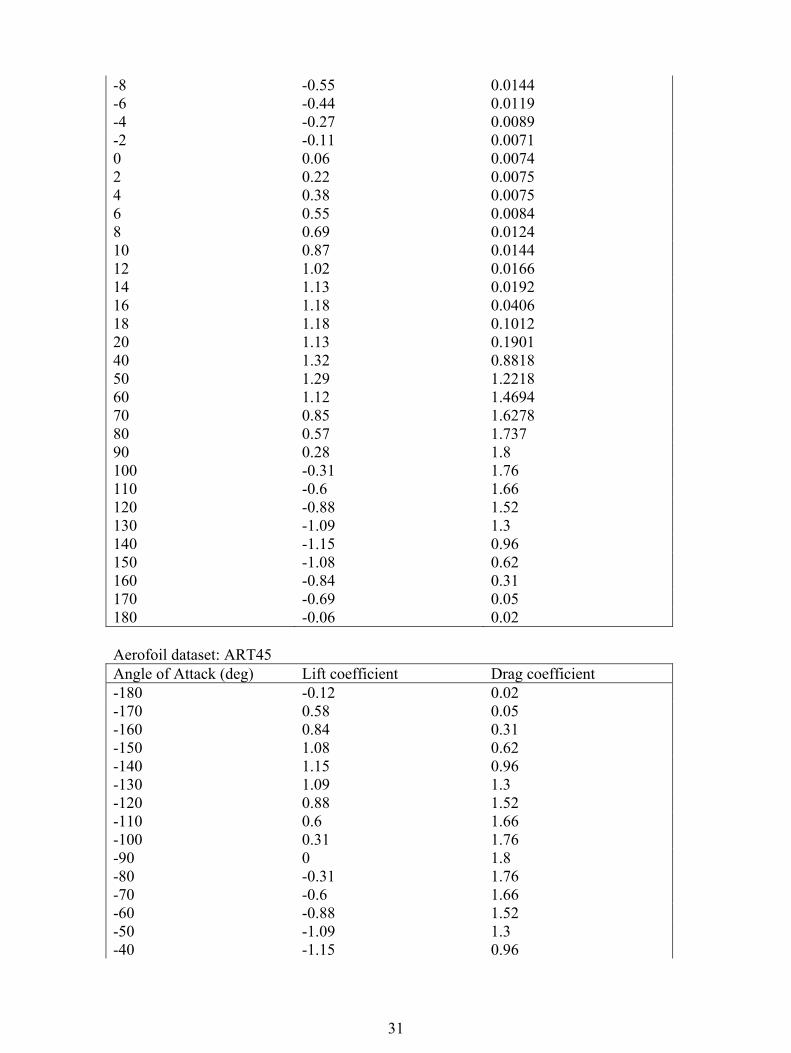
-2 -0.18 0.0074 0 -0.01 0.0075 2 0.17 0.0077 4 0.35 0.0077 6 0.53 0.0077 8 0.65 0.0127 10 0.82 0.0146 12 0.97 0.017 14 1.05 0.0199 16 1.1 0.0379 18 1.08 0.0948 20 1.04 0.1809 40 1.35 0.875 50 1.33 1.215 60 1.15 1.465 70 0.89 1.625 80 0.6 1.735 90 0.31 1.8 100 -0.31 1.76 110 -0.6 1.66 120 -0.88 1.52 130 -1.09 1.3 140 -1.15 0.96 150 -1.08 0.62 160 -0.84 0.31 170 -0.72 0.05 180 0.01 0.02 Aerofoil dataset: ART35 Angle of Attack (deg) Lift coefficient Drag coefficient -180 -0.06 0.02 -170 0.69 0.05 -160 0.84 0.31 -150 1.08 0.62 -140 1.15 0.96 -130 1.09 1.3 -120 0.88 1.52 -110 0.6 1.66 -100 0.31 1.76 -90 0 1.8 -80 -0.31 1.76 -70 -0.6 1.66 -60 -0.88 1.52 -50 -1.09 1.3 -40 -1.15 0.96 -30 -1.08 0.62 -20 -0.84 0.31 -10 -0.69 0.0166
31
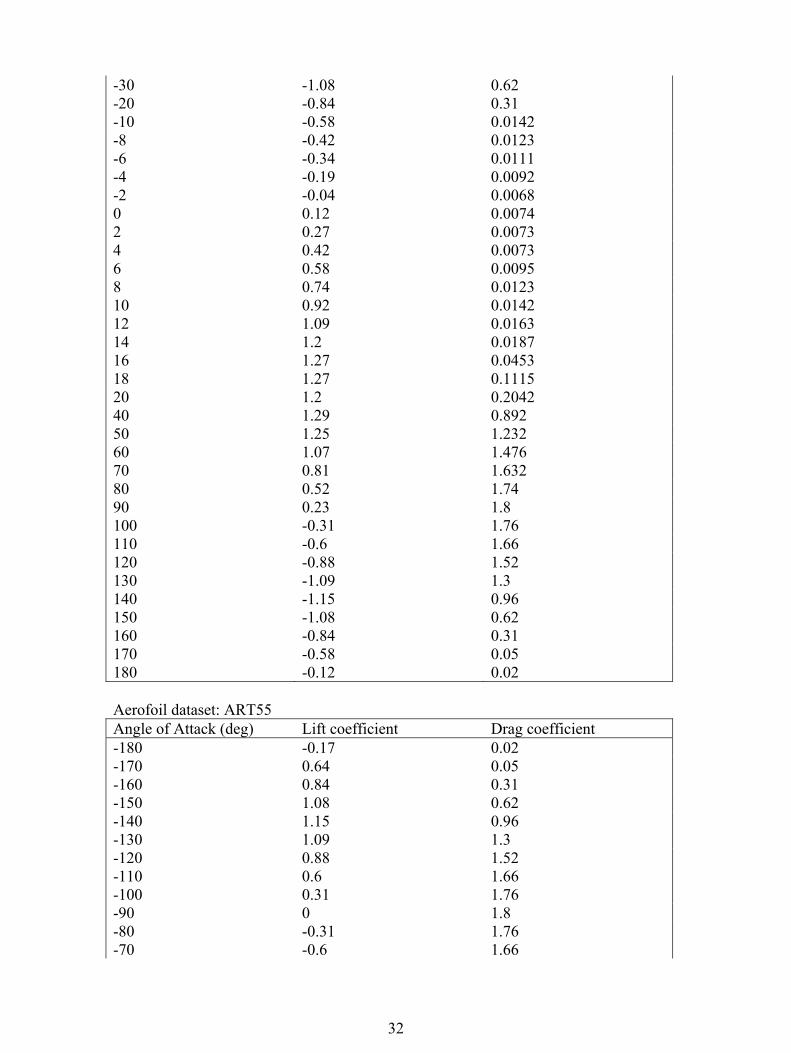
-8 -0.55 0.0144 -6 -0.44 0.0119 -4 -0.27 0.0089 -2 -0.11 0.0071 0 0.06 0.0074 2 0.22 0.0075 4 0.38 0.0075 6 0.55 0.0084 8 0.69 0.0124 10 0.87 0.0144 12 1.02 0.0166 14 1.13 0.0192 16 1.18 0.0406 18 1.18 0.1012 20 1.13 0.1901 40 1.32 0.8818 50 1.29 1.2218 60 1.12 1.4694 70 0.85 1.6278 80 0.57 1.737 90 0.28 1.8 100 -0.31 1.76 110 -0.6 1.66 120 -0.88 1.52 130 -1.09 1.3 140 -1.15 0.96 150 -1.08 0.62 160 -0.84 0.31 170 -0.69 0.05 180 -0.06 0.02 Aerofoil dataset: ART45 Angle of Attack (deg) Lift coefficient Drag coefficient -180 -0.12 0.02 -170 0.58 0.05 -160 0.84 0.31 -150 1.08 0.62 -140 1.15 0.96 -130 1.09 1.3 -120 0.88 1.52 -110 0.6 1.66 -100 0.31 1.76 -90 0 1.8 -80 -0.31 1.76 -70 -0.6 1.66 -60 -0.88 1.52 -50 -1.09 1.3 -40 -1.15 0.96
32
-30 -1.08 0.62 -20 -0.84 0.31 -10 -0.58 0.0142 -8 -0.42 0.0123 -6 -0.34 0.0111 -4 -0.19 0.0092 -2 -0.04 0.0068 0 0.12 0.0074 2 0.27 0.0073 4 0.42 0.0073 6 0.58 0.0095 8 0.74 0.0123 10 0.92 0.0142 12 1.09 0.0163 14 1.2 0.0187 16 1.27 0.0453 18 1.27 0.1115 20 1.2 0.2042 40 1.29 0.892 50 1.25 1.232 60 1.07 1.476 70 0.81 1.632 80 0.52 1.74 90 0.23 1.8 100 -0.31 1.76 110 -0.6 1.66 120 -0.88 1.52 130 -1.09 1.3 140 -1.15 0.96 150 -1.08 0.62 160 -0.84 0.31 170 -0.58 0.05 180 -0.12 0.02 Aerofoil dataset: ART55 Angle of Attack (deg) Lift coefficient Drag coefficient -180 -0.17 0.02 -170 0.64 0.05 -160 0.84 0.31 -150 1.08 0.62 -140 1.15 0.96 -130 1.09 1.3 -120 0.88 1.52 -110 0.6 1.66 -100 0.31 1.76 -90 0 1.8 -80 -0.31 1.76 -70 -0.6 1.66

33
-60 -0.88 1.52 -50 -1.09 1.3 -40 -1.15 0.96 -30 -1.08 0.62 -20 -0.84 0.31 -10 -0.64 0.0144 -8 -0.48 0.0124 -6 -0.29 0.0104 -4 -0.14 0.0093 -2 0.02 0.007 0 0.17 0.0074 2 0.33 0.0072 4 0.48 0.0076 6 0.64 0.0105 8 0.82 0.0124 10 0.99 0.0144 12 1.15 0.0166 14 1.26 0.0214 16 1.32 0.0566 18 1.31 0.1289 20 1.19 0.2249 40 1.26 0.9056 50 1.22 1.2456 60 1.04 1.4848 70 0.77 1.6376 80 0.48 1.744 90 0.19 1.8 100 -0.31 1.76 110 -0.6 1.66 120 -0.88 1.52 130 -1.09 1.3 140 -1.15 0.96 150 -1.08 0.62 160 -0.84 0.31 170 -0.64 0.05 180 -0.17 0.02 Aerofoil dataset: ART65 Angle of Attack (deg) Lift coefficient Drag coefficient -180 -0.21 0.02 -170 0.69 0.05 -160 0.84 0.31 -150 1.08 0.62 -140 1.15 0.96 -130 1.09 1.3 -120 0.88 1.52 -110 0.6 1.66 -100 0.31 1.76

34
-90 0 1.8 -80 -0.31 1.76 -70 -0.6 1.66 -60 -0.88 1.52 -50 -1.09 1.3 -40 -1.15 0.96 -30 -1.08 0.62 -20 -0.84 0.31 -10 -0.69 0.0128 -8 -0.5 0.0111 -6 -0.35 0.01 -4 -0.16 0.0088 -2 0.02 0.0084 0 0.21 0.0073 2 0.4 0.0075 4 0.59 0.0081 6 0.78 0.0111 8 0.94 0.0128 10 1.08 0.0159 12 1.19 0.0184 14 1.26 0.0268 16 1.27 0.0727 18 1.21 0.1519 20 1.06 0.2514 40 1.25 0.9226 50 1.2 1.2626 60 1.01 1.4958 70 0.73 1.6446 80 0.44 1.749 90 0.15 1.8 100 -0.31 1.76 110 -0.6 1.66 120 -0.88 1.52 130 -1.09 1.3 140 -1.15 0.96 150 -1.08 0.62 160 -0.84 0.31 170 -0.69 0.05 180 -0.21 0.02 Aerofoil dataset: ART75 Angle of Attack (deg) Lift coefficient Drag coefficient -180 -0.26 0.02 -170 0.67 0.05 -160 0.84 0.31 -150 1.08 0.62 -140 1.15 0.96 -130 1.09 1.3

35
-120 0.88 1.52 -110 0.6 1.66 -100 0.31 1.76 -90 0 1.8 -80 -0.31 1.76 -70 -0.6 1.66 -60 -0.88 1.52 -50 -1.09 1.3 -40 -1.15 0.96 -30 -1.08 0.62 -20 -0.84 0.31 -10 -0.67 0.0116 -8 -0.47 0.0097 -6 -0.34 0.0085 -4 -0.14 0.0079 -2 0.06 0.0071 0 0.26 0.007 2 0.47 0.0076 4 0.67 0.0097 6 0.87 0.0116 8 1.05 0.0134 10 1.18 0.0155 12 1.27 0.0191 14 1.34 0.0371 16 1.33 0.0942 18 1.24 0.1806 20 1.03 0.2833 40 1.23 0.943 50 1.18 1.283 60 0.98 1.509 70 0.7 1.653 80 0.41 1.755 90 0.12 1.8 100 -0.31 1.76 110 -0.6 1.66 120 -0.88 1.52 130 -1.09 1.3 140 -1.15 0.96 150 -1.08 0.62 160 -0.84 0.31 170 -0.67 0.05 180 -0.26 0.02 Aerofoil dataset: ART75-5 Angle of Attack (deg) Lift coefficient Drag coefficient -180 -0.3 0.02 -170 0.71 0.05 -160 0.84 0.31

36
-150 1.08 0.62 -140 1.15 0.96 -130 1.09 1.3 -120 0.88 1.52 -110 0.6 1.66 -100 0.31 1.76 -90 0 1.8 -80 -0.31 1.76 -70 -0.6 1.66 -60 -0.88 1.52 -50 -1.09 1.3 -40 -1.15 0.96 -30 -1.08 0.62 -20 -0.84 0.31 -10 -0.71 0.0116 -8 -0.51 0.0097 -6 -0.32 0.0085 -4 -0.12 0.0079 -2 0.1 0.0071 0 0.3 0.007 2 0.51 0.0076 4 0.71 0.0097 6 0.92 0.0116 8 1.1 0.0134 10 1.24 0.0155 12 1.33 0.0191 14 1.39 0.0371 16 1.38 0.0942 18 1.27 0.1806 20 1.01 0.2833 40 1.21 0.943 50 1.16 1.283 60 0.96 1.509 70 0.68 1.653 80 0.4 1.755 90 0.1 1.8 100 -0.31 1.76 110 -0.6 1.66 120 -0.88 1.52 130 -1.09 1.3 140 -1.15 0.96 150 -1.08 0.62 160 -0.84 0.31 170 -0.67 0.05 180 -0.3 0.02 Aerofoil dataset: ART85 Angle of Attack (deg) Lift coefficient Drag coefficient
37
-180 -0.33 0.02 -170 0.75 0.05 -160 0.84 0.31 -150 1.08 0.62 -140 1.15 0.96 -130 1.09 1.3 -120 0.88 1.52 -110 0.6 1.66 -100 0.31 1.76 -90 0 1.8 -80 -0.31 1.76 -70 -0.6 1.66 -60 -0.88 1.52 -50 -1.09 1.3 -40 -1.15 0.96 -30 -1.08 0.62 -20 -0.84 0.31 -10 -0.75 0.0116 -8 -0.55 0.0097 -6 -0.3 0.0085 -4 -0.09 0.0079 -2 0.13 0.0071 0 0.33 0.007 2 0.55 0.0076 4 0.75 0.0097 6 0.96 0.0116 8 1.15 0.0134 10 1.29 0.0155 12 1.38 0.0191 14 1.43 0.0371 16 1.42 0.0942 18 1.29 0.1806 20 0.99 0.2833 40 1.2 0.943 50 1.15 1.283 60 0.94 1.509 70 0.67 1.653 80 0.38 1.755 90 0.09 1.8 100 -0.31 1.76 110 -0.6 1.66 120 -0.88 1.52 130 -1.09 1.3 140 -1.15 0.96 150 -1.08 0.62 160 -0.84 0.31 170 -0.75 0.05 180 -0.33 0.02
38
Aerofoil dataset: ART85-5 Angle of Attack (deg) Lift coefficient Drag coefficient -180 -0.38 0.02 -170 0.7 0.05 -160 0.84 0.31 -150 1.08 0.62 -140 1.15 0.96 -130 1.09 1.3 -120 0.88 1.52 -110 0.6 1.66 -100 0.31 1.76 -90 0 1.8 -80 -0.31 1.76 -70 -0.6 1.66 -60 -0.88 1.52 -50 -1.09 1.3 -40 -1.15 0.96 -30 -1.08 0.62 -20 -0.84 0.31 -10 -0.7 0.0116 -8 -0.49 0.0097 -6 -0.27 0.0085 -4 -0.05 0.0079 -2 0.17 0.0071 0 0.38 0.007 2 0.6 0.0076 4 0.8 0.0097 6 1.01 0.0116 8 1.21 0.0134 10 1.29 0.0155 12 1.36 0.0191 14 1.49 0.0371 16 1.46 0.0942 18 1.31 0.1806 20 0.94 0.2833 40 1.18 0.943 50 1.13 1.283 60 0.92 1.509 70 0.64 1.653 80 0.35 1.755 90 0.06 1.8 100 -0.31 1.76 110 -0.6 1.66 120 -0.88 1.52 130 -1.09 1.3 140 -1.15 0.96 150 -1.08 0.62
39
160 -0.84 0.31 170 -0.75 0.05 180 -0.38 0.02 Aerofoil dataset: ART95 Angle of Attack (deg) Lift coefficient Drag coefficient -180 -0.42 0.02 -170 0.64 0.05 -160 0.84 0.31 -150 1.08 0.62 -140 1.15 0.96 -130 1.09 1.3 -120 0.88 1.52 -110 0.6 1.66 -100 0.31 1.76 -90 0 1.8 -80 -0.31 1.76 -70 -0.6 1.66 -60 -0.88 1.52 -50 -1.09 1.3 -40 -1.15 0.96 -30 -1.08 0.62 -20 -0.84 0.31 -10 -0.64 0.0116 -8 -0.42 0.0098 -6 -0.23 0.0078 -4 -0.01 0.0073 -2 0.21 0.0063 0 0.42 0.0065 2 0.64 0.0077 4 0.85 0.0098 6 1.06 0.0116 8 1.26 0.0135 10 1.42 0.0163 12 1.5 0.0197 14 1.54 0.0452 16 1.5 0.1095 18 1.32 0.2003 20 0.88 0.3047 40 1.16 0.9566 50 1.1 1.2966 60 0.89 1.5178 70 0.61 1.6586 80 0.32 1.759 90 0.03 1.8 100 -0.31 1.76 110 -0.6 1.66 120 -0.88 1.52

40
130 -1.09 1.3 140 -1.15 0.96 150 -1.08 0.62 160 -0.84 0.31 170 -0.64 0.05 180 -0.42 0.02 BLADE MASS DISTRIBUTION Distance from root (m) Centre of Mass (% chord) Mass/unit length (kg/m) 0 50 282.92 0.439 50 290.24 1.0576 50 261.88 1.4967 50 240.02 2.2749 50 201.28 2.4944 50 198.62 3.4921 50 186.52 4.4899 50 172.24 4.7094 50 169.1 5.4876 50 156.83 6.4853 50 142.84 7.2636 50 133.19 7.4831 50 129.45 8.4808 50 112.42 9.479 50 100.58 10.476 50 87.145 11.075 50 78.57 11.474 50 74.273 12.472 50 63.352 13.47 50 51.359 14.467 50 41.429 14.866 50 37.59 15.465 50 31.694 16.463 50 22.761 17.461 50 15.842 18.458 50 11.652 19.456 50 7.8599 19.955 50 6.02 Blade Mass Integrals Blade Mass 2126.19 kg First Mass Moment 12408.7 kgm Second Mass Moment 115269 kgm² Blade inertia about shaft 153597 kgm² BLADE STIFFNESS DISTRIBUTION Radial Position (m) Flapwise stiffness (Nm²) Edgewise stiffness (Nm²)

41
0 1.65E+08 2.83E+08 0.439 1.61E+08 3.18E+08 1.0576 1.42E+08 3.28E+08 1.4967 1.264E+08 3.204E+08 2.2749 9.87E+07 3.07E+08 2.4944 9.504E+07 3.13E+08 3.4921 7.84E+07 3.4E+08 4.4899 6.266E+07 3.416E+08 4.7094 5.92E+07 3.42E+08 5.4876 5.066E+07 3.024E+08 6.4853 4.088E+07 2.616E+08 7.2636 3.41E+07 2.37E+08 7.4831 3.251E+07 2.251E+08 8.4808 2.529E+07 1.712E+08 9.479 1.968E+07 1.458E+08 10.476 1.493E+07 1.146E+08 11.075 1.23E+07 9.4E+07 11.474 1.1E+07 8.718E+07 12.472 7.857E+06 6.968E+07 13.47 5.474E+06 4.952E+07 14.467 3.693E+06 3.708E+07 14.866 3.02E+06 3.26E+07 15.465 2.364E+06 2.623E+07 16.463 1.432E+06 1.75E+07 17.461 855310 1.287E+07 18.458 537870 9.575E+06 19.456 310180 7.601E+06 19.955 209000 6.8E+06 HUB MASS AND INERTIA Mass of hub 5852 kg Mass centre of hub -0.21 m Hub inertia: about shaft 15000 kgm² perpendicular to shaft 0 kgm² Total Rotor Mass 10104.4 kg Total Rotor Inertia 322193 kgm² TOWER DETAILS Station Number
Height (m) Diameter (m) Mass/unit length (kg/m)
Stiffness (Nm²)
1 0 4.42 1548 8.21E+10 2 2.29392 3.86647 1361 5.48E+10 3 6.86781 2.76277 1428 2.96E+10 4 9.1443 2.21344 1311 1.75E+10 5 11.4801 2.2 1311 1.75E+10 6 14.9872 2.2 1311 1.75E+10 7 17.9086 2.2 878 1.14E+10 8 21.4157 2.2 878 1.14E+10

42
9 24.3407 2.2 878 1.14E+10 10 27.2481 2.2 599 7.63E+09 11 30.7274 2.2 599 7.63E+09 12 33.6628 2.2 1311 1.75E+10 13 34.862 2.2 1311 1.75E+10 Total Tower Mass 37944 kg Total Turbine Mass 77161.4 kg Drag coefficient for tower 0 Environment Land Foundation Rigid NACELLE MASS Nacelle mass 29113 kg Nacelle centre of mass lateral offset 0 m Nacelle centre of mass above tower top 1.734 m Nacelle centre of mass in front of tower axis 1.1 m Yaw inertia (about tower axis) 71750 kgm² Nodding inertia (about CoG) 0 kgm² Rolling inertia (about CoG) 0 kgm² Total Tower-head Mass 39217.4 kg Total Yaw Inertia: 0° azimuth 212921 kgm² Total Yaw Inertia: 90° azimuth 535114 kgm² DRIVE TRAIN Gearbox ratio 43.165 Position of shaft brake High speed
shaft (Gearbox End)
Generator inertia 34.4 kgm² High speed shaft inertia: 0 kgm² Low speed shaft Flexible Low speed shaft torsional stiffness 2.691E+07 Nm/rad Low speed shaft torsional damping 0 Nms/rad High speed shaft Stiff GENERATOR CHARACTERISTICS Generator model Variable Speed Power electronics time constant 0 s Maximum generator torque 4000 Nm Minimum generator torque 0 Nm Phase Angle 0 deg Discrete Controller: Signal noise Blade pitch angle discretisation step 0 deg Electrical power discretisation step 0 kW Generator speed discretisation step 0 rpm

43
Rotor speed discretisation step 0 rpm Generator torque discretisation step 0 Nm Yaw error (wind vane) discretisation step 0 deg Nacelle wind speed discretisation step 0 m/s Nacelle direction discretisation step 0 deg Blade OPBM discretisation step 5600 Nm Fore-aft acceleration discretisation step 0 m/s² Side-side acceleration discretisation step 0 m/s² Rotor azimuth discretisation step 0 deg Random number seed 0 PITCH ACTUATOR Pitch actuator responds to Rate demand Pitch Rate response Passive First order lag time constant 0.016667 s Lower pitch limit -10 deg Upper pitch limit 90 deg Lower pitch rate limit -18 deg/s Upper pitch rate limit 18 deg/s Pitch actuation Individual MODAL ANALYSIS (uncoupled component modes) Rotor modes at 0.0 degrees pitch Mode Frequency at
42.0 rpm (Hz) Non-rotating frequency (Hz)
Damping factor
In-plane root slope
Out of plane 1 2.201 2.014 0.0050 0.0000 Out of plane 2 2.201 2.014 0.0050 0.0000 Out of plane 3 5.965 5.763 0.0050 0.0000 Out of plane 4 5.965 5.763 0.0050 0.0000 In plane 1 4.262 4.182 0.0050 0.0000 In plane 2 9.241 9.154 0.0050 0.0345 In plane 3 14.397 14.321 0.0050 0.0000 In plane 4 20.526 20.456 0.0050 0.0384 Tower modes Mode Frequency (Hz) Damping factor Tower top slope Fore-aft 1 0.874 0.0050 0.0552 Fore-aft 2 6.634 0.0050 -0.7237 Side-side 1 0.886 0.0050 0.0546 Side-side 2 8.712 0.0050 -1.4140
F1147-E(10/2008)
REPORT DOCUMENTATION PAGE Form Approved OMB No. 0704-0188
The public reporting burden for this collection of information is estimated to average 1 hour per response, including the time for reviewing instructions, searching existing data sources, gathering and maintaining the data needed, and completing and reviewing the collection of information. Send comments regarding this burden estimate or any other aspect of this collection of information, including suggestions for reducing the burden, to Department of Defense, Executive Services and Communications Directorate (0704-0188). Respondents should be aware that notwithstanding any other provision of law, no person shall be subject to any penalty for failing to comply with a collection of information if it does not display a currently valid OMB control number. PLEASE DO NOT RETURN YOUR FORM TO THE ABOVE ORGANIZATION. 1. REPORT DATE (DD-MM-YYYY)
December 2010 2. REPORT TYPE
Technical Report 3. DATES COVERED (From - To)
4. TITLE AND SUBTITLE
Controller Field Tests on the NREL CART2 Turbine 5a. CONTRACT NUMBER
DE-AC36-08-GO28308
5b. GRANT NUMBER
5c. PROGRAM ELEMENT NUMBER
6. AUTHOR(S) E. Bossanyi, A. Wright, and P. Fleming
5d. PROJECT NUMBER NREL/TP-5000-49085
5e. TASK NUMBER WE10.3131
5f. WORK UNIT NUMBER
7. PERFORMING ORGANIZATION NAME(S) AND ADDRESS(ES) National Renewable Energy Laboratory 1617 Cole Blvd. Golden, CO 80401-3393
8. PERFORMING ORGANIZATION REPORT NUMBER NREL/TP-5000-49085
9. SPONSORING/MONITORING AGENCY NAME(S) AND ADDRESS(ES)
10. SPONSOR/MONITOR'S ACRONYM(S) NREL
11. SPONSORING/MONITORING AGENCY REPORT NUMBER
12. DISTRIBUTION AVAILABILITY STATEMENT National Technical Information Service U.S. Department of Commerce 5285 Port Royal Road Springfield, VA 22161
13. SUPPLEMENTARY NOTES
14. ABSTRACT (Maximum 200 Words) This document presents the results of the field tests carried out on the CART2 turbine at NREL to validate control algorithms for individual pitch control and active tower damping designed for this turbine by Garrad Hassan & Partners Ltd as part of the European research project ‘UPWIND’.
15. SUBJECT TERMS wind turbine; field tests; CART2; control algorithms; pitch control; active tower damping
16. SECURITY CLASSIFICATION OF: 17. LIMITATION OF ABSTRACT
UL
18. NUMBER OF PAGES
19a. NAME OF RESPONSIBLE PERSON a. REPORT
Unclassified b. ABSTRACT Unclassified
c. THIS PAGE Unclassified 19b. TELEPHONE NUMBER (Include area code)
Standard Form 298 (Rev. 8/98) Prescribed by ANSI Std. Z39.18