cartiva synthetic cartilage implant (p150017) fda …€¦ · the cartiva® synthetic cartilage...
TRANSCRIPT

1
Meeting of the Orthopaedic and Rehabilitation Devices Panel of
the Medical Devices Advisory Committee Gaithersburg, Maryland
April 20, 2016
Cartiva Synthetic Cartilage Implant (P150017)
FDA Introduction

2
FDA Review Team (P150017) • Jemin Dedania, MS, RAC – Lead Reviewer • Nadine Sloan, ME - Engineer • Nona Colburn, M.D. – Clinical • Laurence Coyne, Ph.D. – Branch Chief • Alvin Van Orden, MS – Statistics • Yelizaveta Torosyan – Epidemiology • Maureen Dreher, Ph.D. - Biomechanical testing • Brendan Casey, Ph.D. – Biocompatibility • Steven Turtil, M.S. – Sterilization/Cleaning • John Carver, DVM – Animal Performance Study • Philip Lafleur – Manufacturing • Ted Peterson – BIMO • Albert Moyel– BIMO

3
Presentation Outline
• Introduction • Device Description • Regulatory History • Non-Clinical Studies • Clinical Background • Study Overview • Safety Assessments
• Effectiveness Assessments • Statistical Summary • FDA Observations • FDA Summary (Benefit-Risk
Assessment) • Post-Approval Study (PAS)
Considerations
The Panel Questions will be presented in the afternoon.

4
JEMIN DEDANIA, MS, RAC Biomedical Engineer / Senior Lead Reviewer Restorative and Repair Devices Branch Division of Orthopedic Devices Office of Device Evaluation
INTRODUCTION DEVICE DESCRIPTION REGULATORY HISTORY NON-CLINICAL STUDIES

5
Purpose of Panel Meeting The purpose of this panel meeting is to obtain feedback on: • Safety and Effectiveness Results of the outside the US clinical
trial (MOTION STUDY) conducted for the Cartiva Synthetic Cartilage Implant (SCI), and submitted in PMA P150017.
• Agency questions related to the various elements of the clinical trial that affect the interpretation of the study results, including: • The appropriateness of the chosen non-inferiority margin • Primary and secondary endpoint analysis • Risk of Secondary Surgical Interventions • Assessment of pain • Assessment of function • Radiographic outcomes

6
• Polymer-based, viscoelastic hydrogel implant composed of polyvinyl alcohol and saline
• The device is press-fit into place
Cartiva Synthetic Cartilage Implant Device Description
7
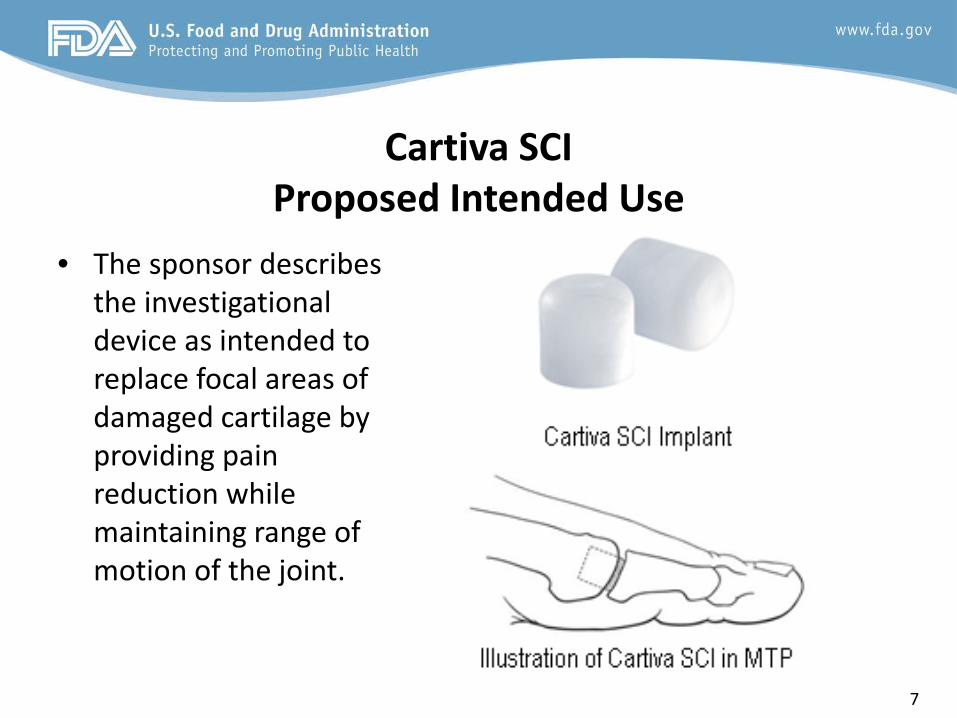
Cartiva SCI Proposed Intended Use
• The sponsor describes the investigational device as intended to replace focal areas of damaged cartilage by providing pain reduction while maintaining range of motion of the joint.

8
Proposed Indications for Use (IFU) The Cartiva® Synthetic Cartilage Implant is intended for use in the treatment of patients with degenerative or post-traumatic arthritis in the first metatarsophalangeal joint in the presence of good bone stock along with the following clinical conditions: hallux valgus or hallux limitus, hallux rigidus, and an unstable or painful metatarsophalangeal joint.

9
Regulatory History
• The study was conducted in the United Kingdom and Canada and therefore was not subject to IDE Regulations
– Extensive feedback was provided to the sponsor prior to initiation of the study. Some of the clinical study design issues raised by the Agency in our feedback were ultimately incorporated into the study protocol and adequately addressed by the time of PMA submission, others were not and are identified in the Panel Pack.
• A Prospective, Randomized, Non-Inferiority Study to Evaluate the Safety and Effectiveness of Cartiva Synthetic Cartilage Implant in the Treatment of First Metatarsophalangeal Joint Osteoarthritis as Compared to a Control” https://clinicaltrials.gov/ct2/show/NCT00969969

10
Non-Clinical Studies
• Multi-Use Testing • Confined Compression (new and accelerated aged implants) • Unconfined Compression (new and accelerated aged implants) • Creep • Shear (new and accelerated aged implants) • Pushout Testing • Hydration Properties • S-N Analysis • Fatigue • Wear (performed on the pure resin, non-sterile Implant, sterilized Implant and
sterilized-fatigued Implant devices) • Chemical Characterization (performed on the pure resin, non-sterile Implant, sterilized
Implant and sterilized-fatigued Implant devices) • Goat Implantation Study • Rabbit Particulate Implantation Study
No remaining concerns were identified in any of the non-clinical studies

11
LAURENCE COYNE, Ph.D. Branch Chief Restorative and Repair Devices Branch Division of Orthopedic Devices Office of Device Evaluation
CLINICAL BACKGROUND STUDY OVERVIEW SAFETY ASSESSMENTS EFFECTIVENESS ASSESSMENTS

12
Osteoarthritis (OA) of the First Metatarsophalangeal (MTP) Joint
• MTP joint the most frequent site for OA in the forefoot. • Can arise from trauma, repetitive microtrauma, severe bunion
deformities (hallux valgus), and recurrent hallux deformity after surgery.
• OA-induced development of osteophytes can lead to hallux rigidus, a condition associated with pain and limited range of motion. Patients may experience pain with pushing off and an inability to wear shoes.
• Static subluxation of the first MTP joint can lead to hallux valgus, or bunion formation. Hallux valgus may occur from wearing tight, narrow, or high heeled shoes or due to family history, ageing, and other factors.

13
Current Treatment Options for OA of the First MTP Joint
• Non-operative treatments include use of orthotics or accommodative footwear, using a stiff soled shoe, pain medications and anti-inflammatory medications, injections, hot/cold temperature baths, and limitations in activities.
• Operative treatments include: – Cheilectomy – Hemiarthroplasty – Total Joint Replacement – Arthrodesis or fusion – Resurfacing/Focal Chondral Defect Repair of the First MTP Joint
• Treatment options may be dependent upon severity of symptoms.

14
CLINICAL STUDY

15
Study Objective To compare the safety and effectiveness of the Cartiva Synthetic Cartilage Implant to an arthrodesis control in the treatment of first metatarsophalangeal joint osteoarthritis.

16
Study Hypothesis – The Cartiva device would be non-inferior to
conventional fusion of the first metatarsophalangeal joint in the identified subjects.
– Non-inferiority was to be demonstrated in the primary composite endpoint, which included measures of pain and function and if subjects underwent a secondary surgery or experienced undesirable radiographic outcomes.

17
Study Design • Outside-the-U.S., prospective, randomized, controlled,
multicenter pivotal trial. (6 sites in Canada and 6 sites in U.K.) • Arthrodesis/fusion control. • Randomization 2:1 • No blinding of investigators or subjects. • Single composite primary endpoint for pain, function, and
safety. • Safety evaluated through 24 months, and effectiveness
evaluated at 12 months. In addition, based on pre-study feedback, a post-hoc effectiveness assessment at 24 months was requested by FDA and provided.

18
Study Population
Subjects with degenerative or post-traumatic arthritis in the first metatarsophalangeal joint in the presence of good bone stock along with the following clinical conditions: hallux valgus or hallux limitus, hallux rigidus, and an unstable or painful metatarsophalangeal joint
19
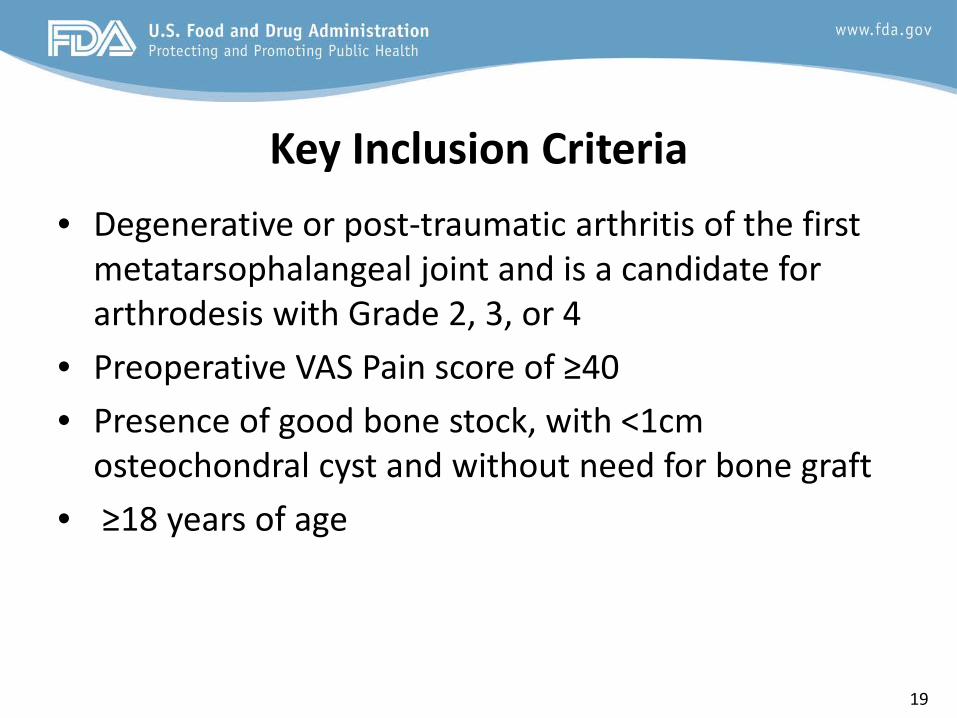
Key Inclusion Criteria • Degenerative or post-traumatic arthritis of the first
metatarsophalangeal joint and is a candidate for arthrodesis with Grade 2, 3, or 4
• Preoperative VAS Pain score of ≥40 • Presence of good bone stock, with <1cm
osteochondral cyst and without need for bone graft • ≥18 years of age

20
Key Exclusion Criteria • Degenerative or post-traumatic arthritis of the first
metatarsophalangeal joint and is not a candidate for arthrodesis with Grade 0 or 1
• Preoperative VAS Pain score <40 • Active bacterial infection of the foot • Additional ipsilateral lower limb (hip, knee, ankle, or foot)
pathology that requires active treatment (i.e., surgery, brace) • Bilateral degenerative or post-traumatic arthritis of the first
metatarsophalangeal joints that would require simultaneous treatment of both MTP joints

21
Key Exclusion Criteria (cont’d) • Previous cheilectomy resulting in inadequate bone stock • Inflammatory arthropathy • Any significant bone loss, avascular necrosis, and/or large
osteochondral cyst (>1cm) of the first metatarsophalangeal joint • Lesions greater than 10mm in size; • Hallux varus to any degree or hallux valgus >20° • Physical conditions that would tend to eliminate adequate implant
support (e.g., insufficient quality or quantity of bone resulting from cancer, congenital dislocation, or osteoporosis), systemic and metabolic disorders leading to progressive deterioration of bone (e.g., cortisone therapies or immunosuppressive therapies), and/or tumors and/or cysts >1cm of the supporting bone structures

22
Control Cohort Treatment • Investigators instructed to utilize their own standard surgical technique for
all arthrodesis subjects. • Surgical steps could include the following:
– Using standard surgical technique, access the affected first MTP joint. – Resect any osteophytes as needed from the proximal phalanx and the distal
metatarsal. – Ensure proper alignment and angle/degree of the joint prior to placement of
hardware. – Use screws and/or plates and screws, as necessary, to fuse the joint. – Repair any soft tissue, as necessary, and close the surgical wound in standard
fashion. • Arthrodesis subjects had their wound bandaged and treated foot placed
in a dressing, walking boot or cast for a length of time as determined by the Investigator.
• Full weight bearing and any rehabilitation were to occur after union, confirmed by x-ray, or at the discretion of the treating Investigator.

23
Investigational Cohort Treatment
• Cartiva implantation procedure similar to that used for osteochondral autograft or allograft transplantation
• Cartiva device placed into a pre-drilled hole to resurface the damaged area of cartilage/bone.
• After the operation, subjects receiving Cartiva were to have their operative site bandaged and the treated foot placed in a stiff soled shoe.
• Weight bearing could begin immediately as tolerated by the subject, and range of motion exercises were encouraged immediately to avoid stiffness.

24
Patient Assessment Schedule Data Required Screening
/Baseline
Operative/ Discharge
Day 0P
2-week Follow
Up (±7days)
6-week
Follow Up
(±14 days)
3-month Follow
Up (±14 days)
6-month Follow
Up (±14 days)
12-month Follow
Up (±14 days)
18-month Follow
Up (±14 days)
24-month Follow
Up (±14 days)
Unscheduled Visit
Informed Consent X
I/E Criteria X
Medical History X
Foot Exam X X X X X X X X
Foot X-ray X X X X X X X X
General Health X X X X X X X X
VAS Pain X X X X X X X X Foot Function Index
Revised (FFI-R) X X X X X X X X
Foot & Ankle Ability Measure (FAAM) X X X X X X X X
SF-36 Health Survey X X X X X X X
Global Assessment (Subject & Site PI) X X X X X X X
Operative/ Discharge Form X
Follow Up Visit Form X X X X X X X
Telephone Follow-up X
AE Reporting X X X X X X X X X

25
Primary Study Endpoint Originally Specified by the Sponsor
• Single composite primary endpoint reflecting three study outcomes (pain, function, and safety).
• An individual subject’s outcome was considered a success if all of the following criteria were met: – Improvement (decrease) from baseline in VAS Pain of ≥30% at 12 months; – Maintenance of function from baseline in FAAM Sports score at 12 months
(inclusive of a decrease ≤9); and – Freedom from the events listed below for the respective treatment arms and
freedom from subsequent secondary surgical interventions for both treatment arms that included revisions, removals, reoperations and/or supplemental fixations over the time period of 24 months from surgery.
– No radiographic failure, which for each arm was defined separately: • Cartiva - device displacement, device fragmentation and/or development of
avascular necrosis • Arthrodesis - mal-union, non-union and/or hardware failure. The radiographic
assessment for non-union and mal-union was only to be included from 3 months to 24 months after surgery.

26
Pre-Study Feedback from FDA to Sponsor • Pre-study feedback that both pain and function be assessed at 24
months instead of 12 months – later analysis needed to adequately assess any effects from longer-term adverse events and to more reliably determine fusion and other clinical outcomes.
• Prior to the study, the FDA-reviewed protocol utilized a FAAM Activities of Daily Living (ADL) primary effectiveness measure for function. The PMA clinical data set, however, utilized a FAAM Sports Subscale primary effectiveness measure for function.
• Per the above, FDA requested the sponsor provide a post-hoc analysis of its clinical data set at 24 months for all components and utilizing the FAAM ADL measure for the function component of the primary composite endpoint.

27
Revised Primary Study Endpoint for Post-Hoc Analysis Requested by FDA
• Single composite primary endpoint reflecting three study outcomes (pain, function, and safety).
• An individual subject’s outcome was considered a success if all of the following criteria were met: – Improvement (decrease) from baseline in VAS Pain of ≥30% at 24 months; – Maintenance of function from baseline in FAAM ADL score at 24 months
(inclusive of a decrease <8); and – Freedom from the events listed below for the respective treatment arms and
freedom from subsequent secondary surgical interventions for both treatment arms that included revisions, removals, reoperations and/or supplemental fixations over the time period of 24 months from surgery.
– No radiographic failure, which for each arm was defined separately: • Cartiva - device displacement, device fragmentation and/or development of
avascular necrosis • Arthrodesis - mal-union, non-union and/or hardware failure. The radiographic
assessment for non-union and mal-union was only to be included from 3 months to 24 months after surgery.

28
Pre-Study Feedback from FDA on Non-Inferiority Margin
• The FDA-reviewed study protocol incorporated a 15% margin for assessment of non-inferiority of the primary composite endpoints for Cartiva and arthrodesis subjects, the primary success criterion for the study.
• FDA provided pre-study feedback that the non-inferiority margin should be chosen to correspond to a “maximum clinically insignificant difference”.

29
Sponsor Justification for 15% Non-Inferiority Margin
• The 15% non-inferiority margin was retained by the sponsor for its
analysis of the clinical data set in the submitted PMA. The sponsor justified its previously chosen 15% margin, in part, as follows:
“The clinicians involved in the study design, took into consideration the patient population, the types of responses that are expected for Arthrodesis and felt that a 15% delta between the study groups was appropriate given the potential benefits of Cartiva and was a clinically insignificant difference. In particular, the potential for a Cartiva patient’s ability to maintain motion of the joint, quicker rehabilitation, less restrictive post-operative instructions, quicker return to function and sports activity and the impact these have on their quality of life would allow for efficacy (-15%) and not be unacceptably worse than arthrodesis.”

30
FDA Comments Regarding the Sponsor’s Chosen 15% Non-Inferiority Margin
• Inherent potential benefit of the Cartiva device to maintain
motion of the joint served as part of the sponsor’s justification for its chosen 15% non-inferiority margin. – However the superiority of the Cartiva device in range of motion, which
was demonstrated in the study, did not necessarily translate to any advantage of the Cartiva device with respect to functional capability.
– Foot and Ankle Ability Measure (FAAM) functional capability scores were found to be substantially better for arthrodesis subjects than for Cartiva subjects at all of the later time points of the study through Month 24, including the pre-specified primary functional assessment, FAAM Sports subscale scores at Month 12.

31
Non-Inferiority Margin • A lower non-inferiority margin of 10% is typically utilized in
non-inferiority studies for other orthopedic implants. • FDA believes that whatever non-inferiority margin is chosen,
the margin should correspond to a maximum clinically insignificant difference appropriate for the particular study.
The Agency will be asking the Panel a non-voting question regarding the 15% non-inferiority margin used for the Cartiva clinical study.

32
Study Results and Observations

-
236Enrolled
Randomized
17 Withdrew
Cartiva Roll-inControl
65Randomized
130Randomized
& Treated
2 Withdrew
147Completing
Study
-
47Completed
ITT
mITT
CC
22 Non‐randomized
& Treated
128Completed
10 Cartiva Subjects Revised to Arthrodesis
15 Withdrew
50Randomized
& Treated
3 LTF2 LTF(1 SSSI Failure before LTF)
Cartiva
132Randomized
Subject Accounting Flowchart

34
MOTION Study Protocol Deviations
Deviation Type Cartiva® (n=152)
Fusion (n=50)
Total
Deviations (n=202)
Major
Deviations PP1
(n=202)
Major
Deviations PP2
(n=202) Follow up visit out of visit window
Follow up @ 24 Mo > -60 days Follow up out of window with no impact on endpoint assessment
168 (51%)
2 166
42 (49%)
0 42
210 (50%)
2 208
2 (1.0%)
2 0
0 (0%)
0 0
Assessments not performed per protocol 71 (22%) 17 (20%) 88 (21%) 0 0 Investigator/Site oversight or omission 41 (12%) 5 (6%) 46 (11%) 0 0 Consent form deviation 13 (4%) 3 (4%) 16 (4%) 0 0 Subject took pain medication within 8 hours of completing assessments
Pain Med w/in 8 hrs. @ 24 Mo. Pain Med w/in 8 hrs. other visits
15 (5%)
0 15
8 (9%)
0 8
23 (6%)1
0 23
0
0 0
0
0 0
Inclusion/Exclusion Eligibility Criteria Not Met
8 (2%) 5 (6%) 13 (3%) 0 2
Other Randomized >72 hr. before surg Other deviations
10 (3%) 5 5
2 (2%) 2 0
12 (3%) 7 5
0 0 0
0 0 0
Follow up visit not completed 5 (2%) 3 (4%) 8 (2%) 0 0 TOTAL % Deviations by Subjects
331 (218%)
85 (166%)
416 (206%)
2 (0.5%)
2 (0.5%)
35
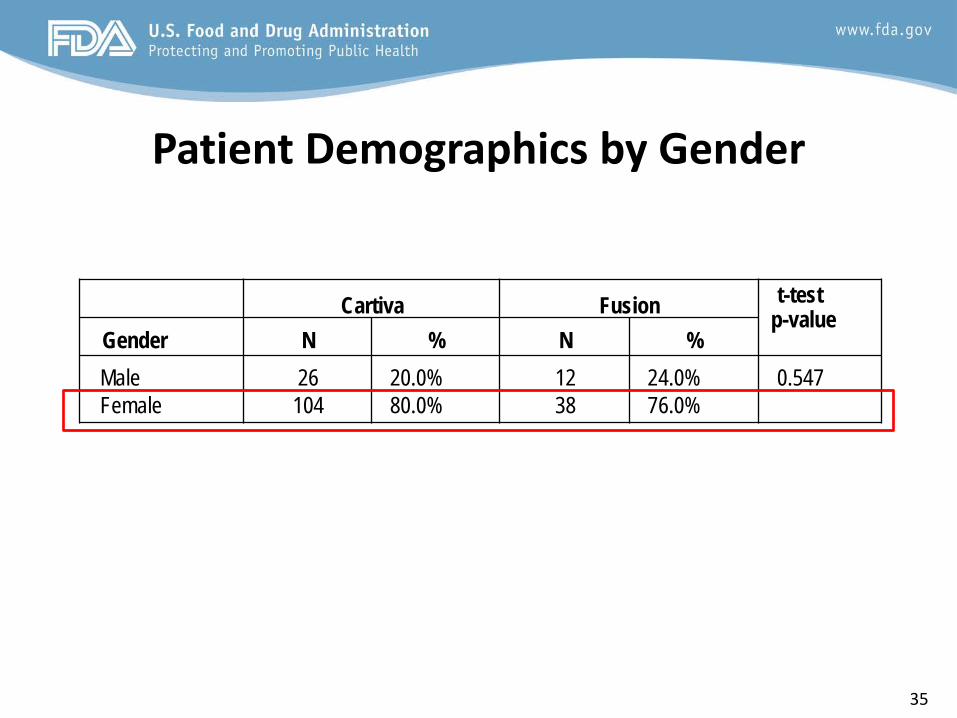
Patient Demographics by Gender
Cartiva
Fusion t-test
p-value Gender
N
%
N
%
Male Female
26 104
20.0% 80.0%
12 38
24.0% 76.0%
0.547

36
Baseline Demographics ITT Population

37
MOTION Study Subject Baseline Characteristics (mITT Cohort)
Cartiva Fusion
t-test Wilcoxon
Effect
Demographics - All N Mean SD M e d M in M ax N Mean SD M e d M in M ax p-value1 p-value2 Size3
Age at surgery (yrs) 130 57.4 8.8 57.9 30.5 79.2 50 54.9 10.5 55.1 32.4 78.2 0.146 0.097 0.27 Height (cm) 130 114.8 50.7 72.0 58.0 180.0 50 118.5 51.4 154.5 61.0 188.0 0.664 0.538 -0.07 Weight (kg) 130 120.3 49.6 114.0 50.6 235.0 50 116.1 52.2 97.7 50.0 290.0 0.623 0.505 0.08 BMI (k/m2) 130 27.2 4.4 26.4 19.1 36.9 50 26.3 4.7 25.6 19.0 41.6 0.236 0.171 0.21
Demographics – Male Age at surgery (yrs) 26 56.9 11.2 58.1 30.5 72.5 12 55.2 11.2 57.6 32.4 70.6 0.654 0.683 0.16 Height (cm) 26 122.3 53.3 119.0 68.0 180.0 12 97.0 48.3 71.0 67.0 181.0 0.160 0.344 0.50 Weight (kg) 26 142.8 59.4 114.0 70.0 235.0 12 159.6 65.8 163.5 78.0 290.0 0.459 0.615 -0.28 BMI (k/m2) 26 29.4 3.7 29.5 23.7 36.9 12 27.8 5.5 27.3 21.6 41.6 0.351 0.084 0.40
Demographic - Fe male Age at surgery (yrs) 104 57.5 8.2 57.9 35.2 79.2 38 54.8 10.4 53.9 35.6 78.2 0.164 0.090 0.30 Height (cm) 104 112.9 50.1 70.0 58.0 176.0 38 125.3 51.0 155.0 61.0 188.0 0.203 0.301 -0.25 Weight (kg) 104 114.7 45.4 111.5 50.6 210.0 38 102.4 38.8 87.5 50.0 180.0 0.113 0.179 0.28 BMI (k/m2) 104 26.6 4.4 25.8 19.1 36.8 38 25.8 4.4 25.4 19.0 37.3 0.325 0.337 0.19
Bas e line Functional Status FAAM ADL 128 59.4 16.9 57.9 7.1 100.0 50 56.0 16.8 54.9 22.6 95.2 0.222 0.157 0.21 FAAM Sports 127 36.9 20.9 34.4 0.0 100.0 50 35.6 20.5 31.3 0.0 87.5 0.692 0.505 0.07 SF36 130 52.4 22.8 50.0 0.0 100.0 50 49.8 23.6 40.0 15.0 100.0 0.495 0.348 0.12 VAS 130 68.0 13.9 68.3 27.8 100.0 50 69.3 14.3 70.0 38.0 97.5 0.577 0.529 -0.10
Note s : 1 Two sample pooled t-test p-value 2 Two sample Wilcoxon rank sum test p-value 3 Standardized effect size (group difference in means divided by pooled within group SD).

38
Surgery Information: Procedure Time and Length of Anesthesia
Cartiva®
Fusion
N Mean Med Min Max N Mean Med Min Max
Procedure Time (minutes)
112 35 32 13 80 39 58 55 30 122
Length of Anesthesia (min.)
137 67 65 20 176 44 95 90 30 218

39
Safety Assessments

40
Adverse Event Data Collection • Adverse event information was collected for the
Safety population and categorized by System Organ Class (SOC) and Preferred Term (PT) with further subcategorization into Treatment and Non-Treatment Emergent and assessment as device or operative related events.

41
Summary of Adverse Events (Safety Analysis Set)

42
Device Related Serious Adverse Events (Safety Set)
Dev ice Related Serious Adverse Events
All (N = 202)
Cartiva (N = 152)
Fusion (N = 50)
Events Subjects % Events Subjects % Events Subjects % All Device Related Serious Adverse Events 13 13 6.4% 11 11 7.2% 2 2 4.0%
GENERAL DISORDERS AND ADMINISTRATION SITE CONDITIONS
8 8 4.0% 8 8 5.3% 0 0 0.0%
Implant site pain 8 8 4.0% 8 8 5.3% 0 0 0.0% INJURY, POISONING AND PROCEDURAL COMPLICATIONS
5 5 2.5% 3 3 2.0% 2 2 4.0%
Medical device complication 1 1 0.5% 0 0 0.0% 1 1 2.0% Medical device pain 4 4 2.0% 3 3 2.0% 1 1 2.0%

43
Safety Outcome Assessments An individual subject’s outcome for the safety component of the composite endpoint was considered a success if the following criteria were met: • Freedom from the events listed below for the respective
treatment arms and freedom from subsequent secondary surgical interventions for both treatment arms to include revisions, removals, reoperations and/or supplemental fixations over the time period of 24 months from surgery.
• No radiographic failure, which for each arm is defined separately: – Cartiva - device displacement, device fragmentation and/or development of
avascular necrosis – Arthrodesis - mal-union, non-union and/or hardware failure. The radiographic
assessment for non-union and mal-union will only be included from 3 months to 24 months after surgery.

44
Subsequent Secondary Surgical Interventions (SSSIs)
SSSI Cartiva® Roll-In (n=22)
Cartiva® Randomized
(n=130)
Cartiva® Total
(n=152)
Fusion (n=50)
Removal 4 (18.2%) 10 (7.7%) 14 (9.2%) 4 (8%) Reoperation 0 1 (0.8%) 1 (0.7%) 0
Revision 0 1 (0.8%) 1 (0.7%) 3 (6%) Supplemental Fixation 0 1 (0.8%) 1 (0.7%) 0
Overall 4 (18.2%) 13 (10.0%) 17 (11.2%) 61 (12.0%)

45
Radiographic Data • Assessments through 24 months by an independent review of
plain radiographs. • Plain radiographs allowed for the assessment of abnormal
bone formation at the fusion site in Arthrodesis subjects and the loss of implant integrity in Cartiva subjects.
• Qualitative evaluations included assessments for heterotopic ossification (HO), radiolucency, bony fractures, avascular necrosis (AVN), adverse bony reactions, device displacement, fusion status, device integrity, and additional observations.

46
Radiographic Findings
Radiographic Finding Cartiva® SCI Randomized
(n=130)
Cartiva® SCI Safety
(n=152)
Arthrodesis (n=50)
n % n % n %
Radiographic Failure Modalities in Primary Endpoint
Avascular Necrosis 0 0.0% 0 0.0% 0 0.0% Device Displacement 0 0.0% 0 0.0% -- -- Device Fragmentation 0 0.0% 0 0.0% -- --
Non Union -- -- -- -- 4 8.0% Mal Union -- -- -- -- 0 0.0%
Fractured Hardware -- -- -- -- 1 2.0%
Other Radiographic Findings
Fusion (Cartiva® cohort) 0 0.0% 0 0.0% -- -- Radiolucency (any) 5 3.8% 6 3.9% 6 12.0%
Bony Fracture 1 0.8% 1 0.7% 1 2.0% Bony Reaction 64 49.2% 75 49.3% 3 6.0%
Heterotopic Ossification 75 57.7% 89 58.6% 24 48.0%

47
Incidence of Bony Reactions
1Subject had both loss of cortical white and osteolysis at different time points.

48
Incidence of Heterotopic Ossification
HO Class 4 Not Applicable to the Fusion Group

49
FDA Summation – Safety • 69.1% of the Cartiva subjects had at least one adverse event
within 24 months versus 72.0% of the arthrodesis subjects. • Cartiva subjects had a somewhat higher incidence rate of
serious device related adverse events than arthrodesis subjects, 7.2% to 4%.
• The rates of all subsequent secondary surgical interventions (SSSIs) for Cartiva, 10% for randomized and treated subjects and 11.2% for all treated subjects, were slightly lower than the 12% rate of all SSSIs in all arthrodesis subjects.

50
FDA Summation – Safety (continued) • Utilizing the different pre-specified criteria for radiographic
assessments of Cartiva and arthrodesis treatment groups, 5 arthrodesis subjects (10% of the arthrodesis cohort) were deemed as radiographic failures for the primary composite endpoint, and no Cartiva subjects were deemed radiographic failures.
• Osteolysis, the most clinically concerning bony reaction, was observed in 2 Cartiva subjects and 3 arthrodesis subjects.
• Class 3 heterotopic ossification was observed in 13 treated Cartiva subjects.
The Agency will be asking the Panel a voting question on whether a reasonable assurance of safety has been demonstrated for the PMA device for its proposed
intended use

51
Effectiveness Assessments

52
Pre-Specified Effectiveness Outcome Assessments
An individual subject’s outcome for the effectiveness component of the composite endpoint was considered a success if the following criteria were met: • Improvement (decrease) from baseline in VAS Pain of
≥30% at 12 months; and • Maintenance of function from baseline (defined as no
more than 9 points worse) in FAAM Sports score at 12 months.

53
Revised Effectiveness Outcome Assessments for Post-Hoc Analysis Requested by FDA
An individual subject’s outcome for the effectiveness component of the composite endpoint was considered a success if the following criteria were met: • Improvement (decrease) from baseline in VAS Pain of
≥30% at 24 months; and • Maintenance of function from baseline (or no more
than 8 points worse) in FAAM ADL score at 24 months.

54
VAS Pain Score Over Time – Completed cases without SSSI
[CARTIVA Table]

55
FAAM Sports Function Scores Over Time – Completed cases without SSSI
[CARTIVA Table]

56
FAAM ADL Function Scores Over Time – Completed cases without SSSI
[CARTIVA Table]

57
FDA Summation – Effectiveness • Both the Cartiva and fusion treatment groups demonstrated substantial and
clinically meaningful reductions in mean VAS pain scores over the course of the study. However, mean pain scores for the arthrodesis cohort were substantially less for all of the later assessment time points from Week 6 through Month 24.
• Both the Cartiva and fusion treatment groups demonstrated clinically meaningful
improvements in mean FAAM Sports and ADL functional assessments over the duration of the study. Both sets of scores favored the Cartiva device at earlier time points through Week 6, but favored the arthrodesis treatment for all of the later assessment time points from Month 6 through Month 24.
• Any inherent advantage in functional improvement for the Cartiva device emanating from its ability to retain range of motion was not apparent in any of the longer-term functional assessments, both for mean FAAM Sports and FAAM ADL scores.
The Agency will be asking the Panel a voting question on whether a reasonable assurance of effectiveness has been demonstrated for the PMA device for its proposed
intended use

58
Statistical Review of P150017
Cartiva Synthetic Cartilage by Cartiva, Inc.
Alvin Van Orden, M.S.
Division of Biostatistics Office of Surveillance and Biometrics

59
Non-inferiority Margin H0: PCart ≤ PArth- δ versus Ha: PC > PA – δ • δ = 15%* in the sponsor’s protocol • δ = 10% typically accepted by the FDA *This means that the lower bound of the one-sided 95% confidence interval for the difference (PC – PA) can be no less than this -15%. Using a 15% non-inferiority margin means we can say with 95% confidence that the true success rate for Cartiva is not lower than Arthrodesis by more than 15%. By choosing a 10% non-inferiority margin as opposed to a 15% non-inferiority margin, the FDA is saying we want to be confident that Cartiva is no more than 10% worse than Arthrodesis. The panel will be asked to comment on an appropriate non-inferiority margin.
The Agency will be asking the Panel a non-voting question regarding what is an appropriate non-inferiority margin.

60
Analysis Populations Population Description N
Cartiva Arthrodesis Total
Intent-to-Treat (ITT)
The ITT population includes all randomized subjects, irrespective of treatment compliance.
132 65 197
Modified Intent-to- Treat (mITT)
The mITT population includes all randomized subjects who receive treatment. Data from subjects who were randomized but never underwent study treatment will be excluded.
130 50 180
Completed Cases Population (CC)
The completed cases (CC) population will include all randomized subjects who receive treatment and who have follow-up, through the time of endpoint analysis (minimum 24 months).
129* 47 176
Completed Cases (without SSSI)
The completed cases excluding subjects that had a subsequent secondary surgery intervention (SSSI) from the time of the event to the end of the study.
116 41 157**
*Two other Cartiva subjects did not officially finish the study. One had an SSSI event, so is a known failure, even if this subject had completed the follow-up. Another Cartiva subject is not a completer because the subject left the 24 month visit before completing the final X-rays. However, this subject (a success on the composite primary endpoint) is still included here. ** This is the number of subjects at 24 months, but the number of subjects varies, depending on the time point.

61
Untreated Missing Subjects • 17 randomized subjects that were never treated (15
Arthrodesis, 2 Cartiva); 23% of Arthrodesis subjects and 2% of Cartiva subjects
• In a study randomized 2:1, many subjects were hoping to be randomized to the other treatment.
• LOCF is not a meaningful imputation for untreated subjects, as it treats them all as failures.
• No baseline covariates were discovered that predicted that the untreated subjects would have had different results than the treated subjects.
• Reasonable imputation methods estimate an 80% success rate in both groups.

62
Lost to Follow-up Subject Treatment
Group Last Follow-up
% Improve- ment in VAS
Improvement in FAAM ADL
SSSI Radiographic Success
1 Arthr. 3-months --* --* No Yes
2 Arthr. 6-months 99%** --** No Yes
3 Arthr. 3-months 76% 20 No Yes
4 Cartiva 1 year 98% 19 No Yes
*Subject 1 has no post-baseline VAS or FAAM ADL scores, only X-rays. **Subject 2 did not have baseline FAAM ADL or any VAS or FAAM past 6 weeks, but at 6 weeks the FAAM ADL was 90 and the VAS was 1. One additional subject did not have 24 month radiographs. This was a Cartiva subject that was a success on the primary composite endpoint. Another subject failed the primary endpoint (SSSI) before leaving the study at 1 year.

63
Conversion to Arthrodesis • Subjects with SSSI events: 13 Cartiva and 6 Arthrodesis • 10 Cartiva subjects converted to Arthrodesis • Possible approaches to analyzing data for secondary
endpoints from subjects with SSSI events: – Remove subjects with SSSI from the analysis from the time of the
event onward – Impute secondary endpoints using the last value before the surgery – Continue to analyze subjects as they were randomized, without
deleting or imputing, even if the subject is converted from Cartiva to Arthrodesis

64
Protocol Specified Composite Endpoint
Analysis Group Cartiva Arthrodesis Lower Bound of one-sided 95% Confidence
Interval (Cartiva-Arthrodesis)
Pre-Specified 12 month Primary – Completers
102/127 (80.3%)
38/47 (80.9%)
-11.6%

65
FDA Requested Primary
Analysis Group Cartiva Arthrodesis Lower Bound of one-sided 95% Confidence
Interval
FDA requested Primary 24 month- Completers
103/129 (79.8%)
37/47 (78.7%)
-10.3%
FDA Requested Primary 24 month - mITT Missing as Success
104/130 (80%)
40/50 (80%)
-10.9%
FDA Requested Primary 24 month – mITT Missing as Failure
103/130 (79.2%)
37/50 (74%)
-6.5%

66
Composite Endpoint • Combines distinct endpoints into one number • Assumes equal weight to each of the parts • The results for two groups may vary drastically on each part of
the composite endpoint yet combine to have similar overall results. Thus, similar composite results may not be evidence of similar risks and benefits.

67
Components of the Composite Endpoint
• Pain- VAS • Function – FAAM • SSSI • Radiographs
Each of the 4 parts defined as success or failure. To be an overall success, a subject needs to be a success on all 4 parts.

68
Pain- VAS Responder Analysis
Time Point Cartiva Arthrodesis Difference (C-A)
95% Conf. Interval
2 weeks 84/130 (65%) 32/49 (65%) 0 (-15%, 15%) 6 weeks 90/129 (70%) 44/50 (88%) -18% (-29%, -4%) 3 months 102/130 (78%) 46/49 (94%) -16% (-24%, -3% )
6 months 91/126 (72%) 45/47 (96%) -24% (-33%, -11%) 1 year 115/130 (88%) 47/47 (100%) -12% (-18%, -3%)
2 years 114/128 (89%) 46/47 (98%) -9% (-16%, 1%)
• A responder is defined as a 30% reduction in pain

69

70
Question for Panel – Pain Score
The Agency will be asking the Panel a non-voting question regarding the interpretation of Cartiva and Arthrodesis pain score results.

71
Function – FAAM Responder
• Responder defined as maintenance of function, or no more than 9 points worse for FAAM-Sports and no more than 8 points worse for FAAM-ADL
FAAM Time Point Cartiva Arthrodesis Difference (C-A)
95% Conf. Interval
Sports 1 year 122/126 (97%)
47/47 (100%)
-3% (-6%, -0.01%)
2 years 117/123 (95%)
46/47 (98%)
-3% (-8%, 3%)
ADL 1 year 124/128 (97%)
47/47 (100%)
-3% (-6%, -0.01%)
2 years 124/127 (98%)
46/47 (98%)
-0.2% (-5%, 5%)

72

73

74
Questions From FAAM ADL All Subjects at 2 Years
Question Group No Difficulty
Slight Difficulty
Moderate Difficulty
Extreme Difficulty
Unable to Do
Daily Activities
Arth. 94% 6% 0% 0% 0% Cart. 88% 10% 0% 2% 0%
Walk 15 Min
Arth. 85% 13% 0% 0% 0% Cart. 67% 17% 9% 5% 2%
Upstairs Arth. 87% 13% 0% 0% 0% Cart. 83% 10% 4% 2% 0%
Up On Toes
Arth. 36% 28% 17% 9% 11% Cart. 37% 33% 15% 7% 9%
Squat Arth. 70% 21% 6% 2% 0% Cart. 57% 18% 11% 6% 2%

75
Questions From FAAM Sports All Subjects at 1 Year
Question Group No Difficulty
Slight Difficulty
Moderate Difficulty
Extreme Difficulty
Unable to Do
Jumping Arth. 45% 25% 21% 6% 2% Cart. 37% 21% 17% 10% 13%
Running Arth. 45% 28% 15% 10% 2% Cart. 33% 25% 15% 12% 12%
Participate in Sport
Arth. 57% 19% 11% 6% 2% Cart. 40% 22% 19% 6% 8%
Normal Technique
Arth. 64% 32% 4% 0% 0% Cart. 58% 22% 13% 4% 2%
Low Impact
Arth. 89% 6% 4% 0% 0% Cart. 63% 21% 10% 5% 1%

76
Question for Panel- Function
The Agency will be asking the Panel a non-voting question regarding the interpretation of the Cartiva and Arthrodesis functional results.

77
SSSI events (Subsequent Secondary Surgery Intervention)
• Additional 4 SSSI events among Cartiva subjects that occurred after 24 months • The median time to SSSI was 157 days in the arthrodesis group and 364 days in the
Cartiva group, or approximately 6 months and 1 year respectively. (This does not include the Cartiva SSSI events that occurred after the final follow-up at 24 months.)
Cartiva Roll-In (n=22)
Cartiva Randomized
(n=130)
Cartiva Total
(n=152)
Arthrodesis (n=50)
4 (18.2%) 13 (10.0%) 17 (11.2%) 6 (12.0%)

78
SSSI pain and function (Subsequent Secondary Surgery Intervention)
• Among subjects that underwent SSSI, Arthrodesis subjects had less pain and greater function.
Time point Cartiva (n=13) Arthrodesis (n=6)
VAS FAAM ADL VAS FAAM ADL
Baseline 71 59 72 56
3 months 39 65 9 84
6 months 50 70 4 85
1 year 40 70 7 94
2 years 12 87 4 96

79
Estimation of SSSI Rates (Subsequent Secondary Surgery Intervention)
• For three Arthrodesis subjects, all at site 2, the reason for the procedure was listed as “Hardware removed as an elective procedure, no failure or dislocation.”
• Literature submitted by sponsor suggests that expected SSSI rate in Arthrodesis subjects is 8.5%.
• Higher rates of SSSI among roll-in subjects and continued SSSI events after 2 years suggest the SSSI rate for Cartiva may be above 10%, as was estimated in the primary analysis.
80
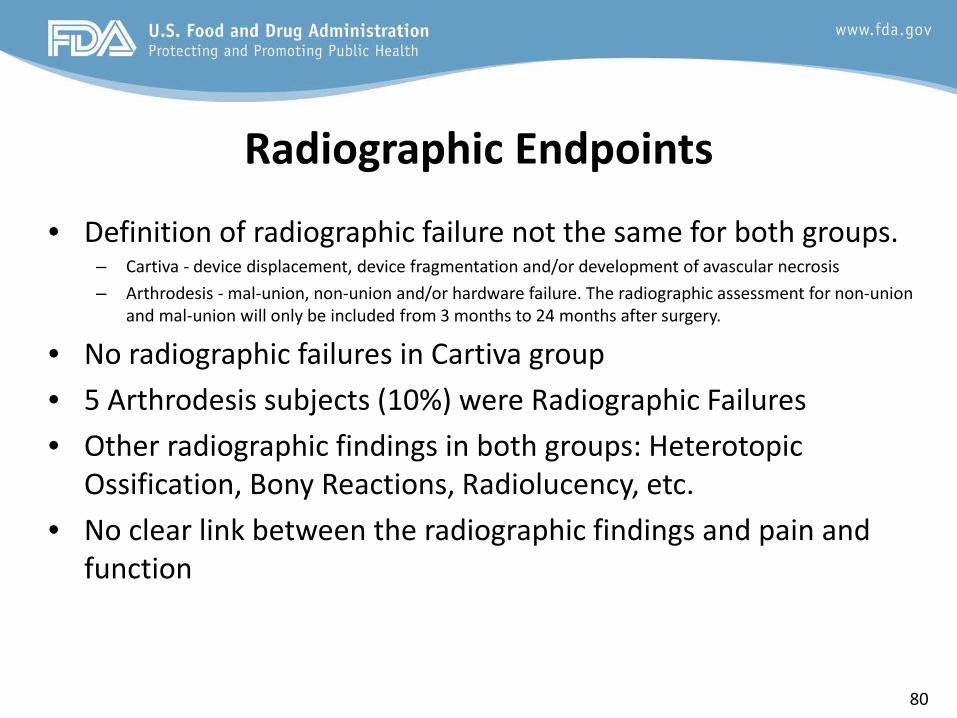
Radiographic Endpoints
• Definition of radiographic failure not the same for both groups. – Cartiva - device displacement, device fragmentation and/or development of avascular necrosis – Arthrodesis - mal-union, non-union and/or hardware failure. The radiographic assessment for non-union
and mal-union will only be included from 3 months to 24 months after surgery.
• No radiographic failures in Cartiva group • 5 Arthrodesis subjects (10%) were Radiographic Failures • Other radiographic findings in both groups: Heterotopic
Ossification, Bony Reactions, Radiolucency, etc. • No clear link between the radiographic findings and pain and
function

81
Radiographic Failures
• 3 subjects that were radiographic failures that were not failures due to SSSI. No indication that these subjects experienced higher pain or lower function.
Subject Reason for Failure
VAS FAAM ADL 6
months 1 year 2 year 6
months 1 year 2 years
1 Non-union 75 2 0 56 81 95
2 Device fracture
0 0 0 100 100 100
3 Non-union 17 31 9 90 90 96

82
Robustness of Results
• These are post-hoc analyses. They show that how changing or removing the radiographic criteria would affect the primary 24 month analysis.
Analysis Group Cartiva Arthrodesis Lower Bound of one-sided 95% Confidence Interval (24
months) Add Class 3 HO as Radiographic Failure
92/129 (71.3%)
37/47 (78.7%)
-19.2%
Elimination of Radiographic Criteria from Primary Endpoint
103/129 (79.8%)
40/47 (85.1%)
-15.6%

83
Secondary Endpoints Planned to test secondary endpoints* in order: 1. VAS Scores 2. FAAM Activities of Daily Living Scores 3. Active MTP Peak Dorsiflexion 4. Patient Global Assessment 5. Investigator Global Assessment 6. SF-36 Physical Functioning Scale 7. Foot Function Index Revised (FFI-R) *FAAM Sports was also a secondary endpoint but was not in the ordered testing list

84
Pain- VAS Improvement from Baseline
Time Point Cartiva Arthrodesis Difference (C-A)
95% Conf. Interval
2 weeks 30 30 -0.8 (-11, 9) 6 weeks 35 50 -15 (-27, -4) 3 months 39 53 -14 (-23, -6) 6 months 39 58 -19 (-28, -10) 1 year 50 63 -13 (-21, -6) 2 years 54 63 -9 (-13, 3) • Both groups experienced large improvements from baseline. • The improvement in the Arthrodesis group is significantly larger than the
improvement in the Cartiva group at the pre-specified time point of 1 Year.
85
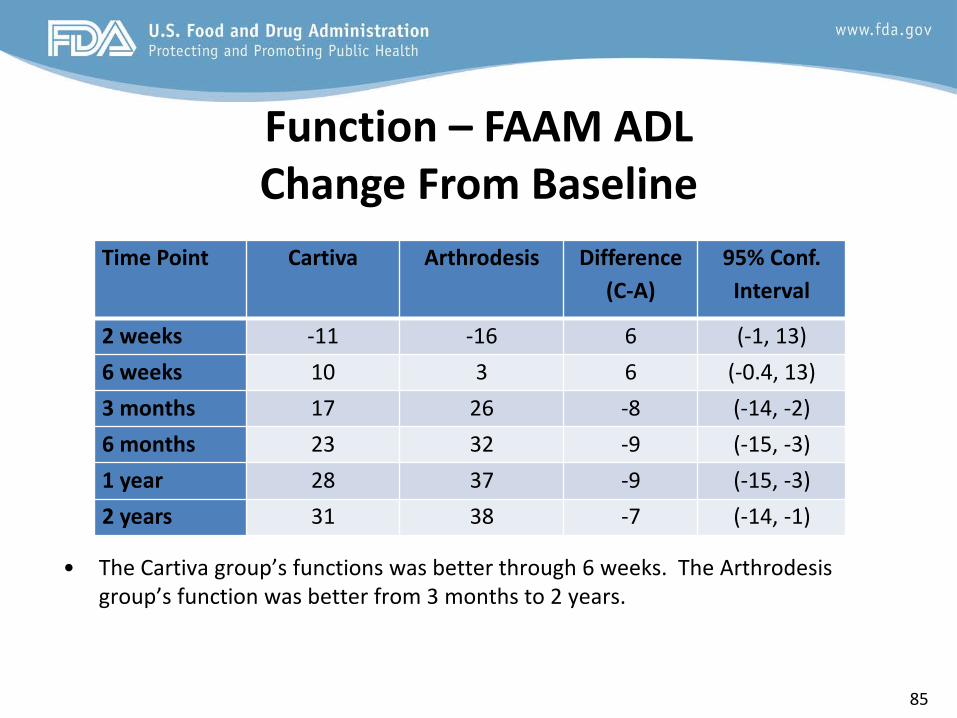
Function – FAAM ADL Change From Baseline
Time Point Cartiva Arthrodesis Difference (C-A)
95% Conf. Interval
2 weeks -11 -16 6 (-1, 13) 6 weeks 10 3 6 (-0.4, 13) 3 months 17 26 -8 (-14, -2) 6 months 23 32 -9 (-15, -3) 1 year 28 37 -9 (-15, -3) 2 years 31 38 -7 (-14, -1)
• The Cartiva group’s functions was better through 6 weeks. The Arthrodesis group’s function was better from 3 months to 2 years.

86
Function – FAAM Sports Change From Baseline
Time Point Cartiva Arthrodesis Difference (C-A)
95% Conf. Interval
2 weeks -19 -26 7 (0.4, 15) 6 weeks 2 -13 15 (6, 23) 3 months 17 18 -1 (-9, 7) 6 months 28 40 -12 (-21, -3) 1 year 37 49 -12 (-21, -4) 2 years 42 48 -6 (-17, 2)
• The Cartiva group’s functions was better through 6 weeks. The Arthrodesis group’s function was better from 3 months on, including at the pre-specified time point of 1 year.

87
Active MTP Peak Dorsiflexion Change from Baseline
• Both groups had a baseline peak dorsiflexion angle of 23 degrees. • Cartiva increased the average range of motion (mean 29° median 30° at 2 years) • Arthrodesis is designed to decrease the range of motion. • 26% of Cartiva subjects had a decrease from baseline in peak dorsiflexion at 2
years. (Does not include those converted to Arthrodesis )
Time Point Cartiva Arthrodesis Difference (C-A)
95% Conf. Interval
2 weeks -2 -10 8 ( 5, 12 ) 6 weeks 2 -10 12 (9, 16) 3 months 4 -9 13 (9, 18) 6 months 5 -7 12 (8, 17) 1 year 6 -7 13 (8, 17) 2 years 5 -7 12 (7, 17)

88
Question for Panel: Mobility vs. Function
The Agency will be asking the Panel a non-voting question regarding the relationship between range of motion and function and if any specific information would need to be
provided to patients to ensure that they are properly informed.

89
Patient Global Assessment “Has your overall well-being improved?”
% Agreed or Strongly Agreed
• Strongly Agree at 24 months – Cartiva 39% Arthrodesis 55% • Strongly Agree at 12 months – Cartiva 33% Arthrodesis 53%
Time point Cartiva Arthrodesis Difference (C-A)
95% Conf. Interval
2 weeks 53/130 (41%) 15/48 (31%) 10% (-7%, 24%) 6 weeks 68/129 (53%) 31/49 (63%) -10% (-25%, 6%) 3 months 86/130 (66%) 37/48 (77%) -11% (-24%, 5%) 6 months 85/126 (67%) 38/46 (83%) -16% (-27%, 0.1%) 1 year 97/130 (75%) 37/47 (79%) -4% (-16%, 11%) 2 years 94/128 (73%) 40/47 (85%) -12% (-23%, 3%)

90
Additional Endpoint- Willingness to Have Procedure Again
• Willingness to have procedure again peaked at Week 2 when subjects in most pain and have least function.
• Unblinded subjects that may have preconceptions about the other treatment options.
Time point Cartiva Arthrodesis Difference (C-A)
95% Conf. Interval
2 weeks 119/124 (96%) 43/47 (91%) 5% (-3%,16%) 6 weeks 115/126 (91%) 40/48 (83%) 8% (-2%, 21%) 3 months 110/127 (87%) 42/48 (88%) -1% (-11%, 12%) 6 months 100/125 (80%) 40/46 (87%) -7% (-17%, 7%) 1 year 101/128 (79%) 39/47 (83%) -4% (-15%, 10%) 2 years 102/128 (80%) 36/47 (77%) 3% (-9%, 18%)

91
Investigator Global Assessment “Has the patient’s overall well-being improved?”
% Agreed or Strongly Agreed
• From 3 months to 1 year, more investigators agreed that subjects in the Arthrodesis group had improved.
Time point Cartiva Arthrodesis Difference (C-A)
95% Conf. Interval
2 weeks 31/129 (24%) 11/50 (22%) 2% (-13%, 15%) 6 weeks 57/129 (44%) 23/50 (46%) -2% (-17%, 14%) 3 months 70/130 (54%) 39/49 (80%) -26% (-38%.,-10%) 6 months 79/127 (62%) 38/47 (81%) -19% (-31%.,-3%) 1 year 98/130 (75%) 39/47 (83%) -8% (-19%, 7%) 2 years 107/127 (84%) 39/47 (83%) 1% (-9%, 16%)
92
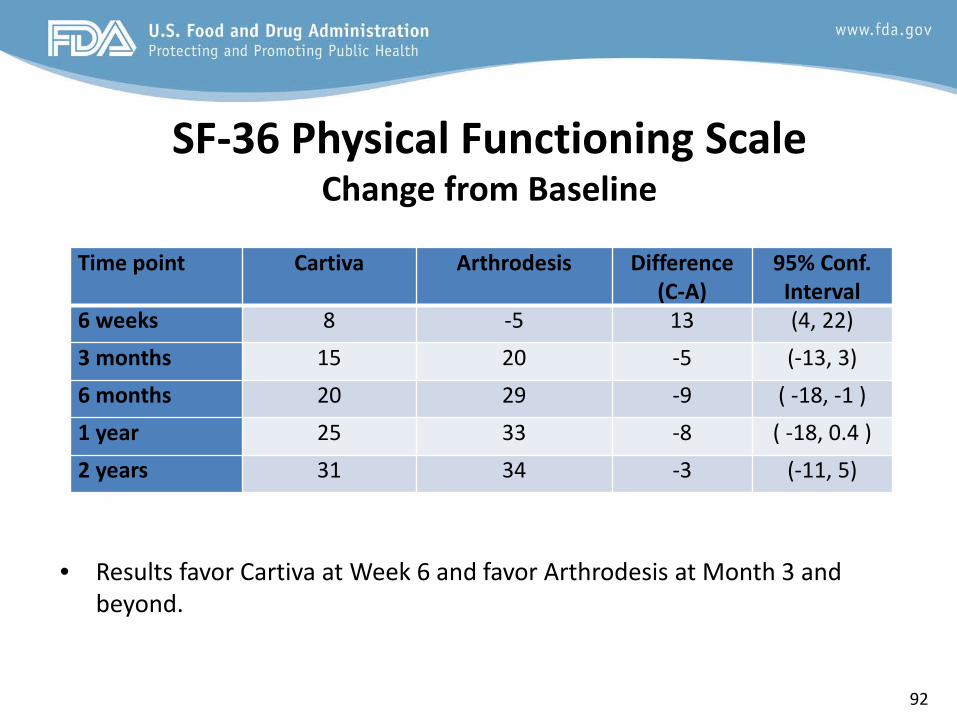
SF-36 Physical Functioning Scale Change from Baseline
• Results favor Cartiva at Week 6 and favor Arthrodesis at Month 3 and beyond.
Time point Cartiva Arthrodesis Difference (C-A)
95% Conf. Interval
6 weeks 8 -5 13 (4, 22) 3 months 15 20 -5 (-13, 3) 6 months 20 29 -9 ( -18, -1 ) 1 year 25 33 -8 ( -18, 0.4 ) 2 years 31 34 -3 (-11, 5)

93
Foot Function Index Revised (FFI-R) Change from Baseline
• Difference in favor of Arthrodesis from Week 2 to Month 24.
Time point Cartiva Arthrodesis Difference (C-A)
95% Conf. Interval
2 weeks 10 18 -8 (-15, -2 ) 6 weeks 18 28 -10 (-17, -4) 3 months 20 31 -11 (-16, -5) 6 months 24 36 -8 (-18, -6) 1 year 30 40 -10 (-15, -4) 2 years 33 40 -7 (-13, -0.3)

94
Conclusion • The lower bound of the confidence interval (Cartiva – Arthr.)
for the Composite Primary Endpoint is between -10% and -12% for CC, PP, and reasonable mITT and ITT
• Cartiva subjects experienced large improvements in pain and function from baseline but showed substantially less improvement in pain and function than Arthrodesis subjects at the pre-specified primary time points.
• Radiographic criteria not the same for both groups • Difficult to estimate the long term SSSI rate for Cartiva. • Secondary endpoints all favor Arthrodesis, except for mobility
of the toe, where Arthrodesis is designed to limit mobility.

95
LAURENCE COYNE, Ph.D. Branch Chief Restorative and Repair Devices Branch Division of Orthopedic Devices Office of Device Evaluation
FDA SUMMARY (Benefit-Risk Assessment)

96
Benefit-Risk Overview When making a determination of the benefit-risk profile of a device, the Agency considers the following:
• Benefits: type of benefits, magnitude of benefits, probability of the patient experiencing one or more benefits, and duration of effect
• Risks: types, number, and rates of harmful events associated with the use of the device
(device-related serious, device-related non-serious, and procedure-related adverse events), probability of a harmful event, and duration of harmful events.
• Additional factors (if applicable): uncertainty, characterization of the disease, patient
tolerance for risk and perspective on benefit, availability of alternate treatments, risk mitigation, post-market data, and novel technology addressing unmet needs.

97
Summary of Benefits • Clinically important improvement in VAS pain scores for most Cartiva
subjects.
– Cartiva showed a 88% responder rate at 12 months and 89% responder rate at 24 months, where a responder was defined as having at least a 30% decrease in VAS pain score. Corresponding responder rates in the Arthrodesis group were 100% and 98% at 12 and 24 months respectively.
• Clinically important improvement in function for most Cartiva subjects as assessed either by FAAM Sports or FAAM Activities of Daily Living scores.
– Cartiva showed an improvement from baseline of 38.9 points (on a 100 point scale) at 12 months and 42.6 points at 24 months for mean FAAM Sports function scores. Corresponding improvements from baseline for Arthrodesis were 48.5 points at 12 months and 47.1 points at 24 months.
– The Cartiva group was substantially better than the Arthrodesis group at the earliest assessments at Weeks 2 and 6.

98
Summary of Benefits (continued)
• Improvement in quality of life, as measured by the SF-36 assessment, for most Cartiva patients with 89% and 94% responder rates at 12 and 24 months, where a responder was defined as having improved by 10 points from baseline. The corresponding responder rates in the Arthrodesis control group was 93% at both 12 and 24 months. The Cartiva group was substantially better than the Arthrodesis group at Week 6 for this assessment.
• Improvement in function, as measured by FFI-R assessment, for most Cartiva patients with 94% and 95% responder rates at 12 and 24 months, where a responder was defined as having improved by 5 points from baseline. The corresponding responder rates in the Arthrodesis control group were 100% and 95% at 12 and 24 months respectively.

99
Summary of Benefits (continued) • General agreement at 12 and 24 months post-treatment with the patient satisfaction
question, “My overall well-being has improved since the beginning of the study?” The proportion of subjects in the primary analysis dataset responding with answers of “strongly agree” or “agree” at 12 months was 75% for the Cartiva treatment group and 79% for the Arthrodesis group. At 24 months 74% of Cartiva subjects and 85% of Arthrodesis subjects responded with answers of “strongly agree” or “agree”.
• Maintenance of range of motion as measured by Active MTP Dorsiflexion. The Cartiva
group showed substantially greater range of motion than the Arthrodesis group at all time points. However, this greater range of motion for Cartiva subjects did not appear to ultimately correlate with function assessments, which were substantially better for Arthrodesis subjects at longer time points.
• Shorter surgery times for Cartiva subjects with the average procedure time 23
minutes less than for the Arthrodesis group. Data were not available for all subjects.

100
Summary of Risks • The rate of device related adverse events through 24 months was numerically higher
in Cartiva as compared to the Arthrodesis control, 15.1% to 8.0%. The rate of serious device related adverse events through 24 months was also numerically higher in Cartiva as compared to the Arthrodesis control, 7.2% to 4.0%.
• The rate of osteolysis, the most severe bony reaction, was 2.0% for the Cartiva safety analysis cohort, but was less than the 6.0% observed for the Arthrodesis cohort. Class 3 Heterotopic Ossification occurred in 8.6 % of the Cartiva safety analysis cohort versus 0% in the corresponding Arthrodesis cohort.
• Reductions from baseline VAS pain scores were substantially less for the Cartiva group as compared to the Arthrodesis control at every time point from Week 6 to Month 24.
• FAAM Sports function scores, measured as change from baseline, were worse or substantially worse in the Cartiva group as compared to the Arthrodesis control at all of the later assessment time points from Month 6 through Month 24.

101
Summary of Risks (continued)
• FAAM ADL function scores, measured as change from baseline, were worse or substantially worse in the Cartiva group as compared to the Arthrodesis control at all of the later assessment time points from Month 6 through Month 24.
• The FFI-R function scores as a change from baseline were substantially worse in the Cartiva group as compared to the Arthrodesis control at every time point from Week 6 to Month 24.
• The patient global assessment where subjects responded to the question “My overall well-being has improved since the beginning of the study?” showed lower rates of patients answering “Strongly Agree” at Month 12 (Cartiva 33%, Arthrodesis 53%) and Month 24 (Cartiva 39%, Arthrodesis 55%).

102
Benefit-Risk Assessment • The Cartiva device demonstrated non-inferiority to the arthrodesis control
treatment in the primary composite endpoint with a 15% non-inferiority margin, both by the sponsor’s pre-specified analysis and by an FDA-requested post-hoc analysis.
• Large, clinically important reductions in pain and increases in functional
assessments were demonstrated for the Cartiva device, and study results confirmed that the device successfully retained range of motion as intended.
• However, FDA has questions regarding the chosen 15% non-inferiority margin and the robustness of the study results.

103
Benefit-Risk Assessment
• In addition, examination of the individual components of the composite endpoint reveals that:
– the Cartiva device, in general, performed worse or substantially worse than arthrodesis in pain reduction and functional assessments at longer study time points;
– safety analyses for subsequent secondary surgical interventions and radiographic assessments utilized criteria that may not have necessarily been consistent for the respective treatment groups; and
– the impact of some potentially more clinically significant adverse events such as osteolysis and heterotopic ossification may not have been adequately incorporated into the safety assessment.
• Consequently, a determination of the relative weight of the benefits and risks of the Cartiva device remains unclear.
The Agency will also be asking the Panel a voting question on whether a favorable benefit-risk has been demonstrated for the PMA device for its proposed intended use.

104
THANK YOU